

Abstract
The concept of the Borehole Diffusive Flux Apparatus (BDFA) is presented herein. The BDFA is an innovative apparatus designed to provide continuous direct access to an undisturbed column of sediment that can be monitored at multiple discrete vertical intervals to provide high-resolution characterization of local-scale mass transfer and attenuation. The conceptual basis and technical design of the device are presented, along with an example of borehole design and installation at a field site. Mathematical simulations are used to illustrate its application for two scenarios. The results of these simulations indicate that test periods of several weeks to a few months should be sufficient to obtain robust results. The device has the potential to improve our ability to characterize critical mass-transfer and attenuation processes and to quantify the associated rates. This information is key to the evaluation of remediation alternatives, for enhancing the accuracy of mathematical models, and to support more effective long-term management of large groundwater contaminant plumes present at many sites.
Keywords: groundwater contamination, back diffusion, attenuation, plume persistence, site characterization
1. Introduction
Groundwater contaminant plumes at many sites exhibit significant persistence, which delays closure and contributes to the cost of long-term site management. As a result, cleanup and closure of sites with large, complex groundwater contaminant plumes is recognized to be generally impractical within time frames of 50–100 years (e.g., NRC, 2013). Accurate characterization of mass removal and plume persistence is especially critical for these sites, where long-term operation and maintenance costs can total many millions of dollars.
A primary factor contributing to plume persistence is aqueous and sorbed contaminant mass associated with areally extensive lower-permeability units adjacent to aquifers (e.g., Johnson et al., 1989; Liu and Ball, 2002; Chapman and Parker, 2005; Brusseau et al., 2007; Parker et al., 2008; Brusseau et al., 2011; Rasa et al., 2011; Brusseau and Guo, 2014; Matthieu et al., 2014). These units typically receive minimal treatment from standard hydraulic-based methods such as pump-and-treat and various reagent-injection approaches. Hence, contaminant residing within these units is removed primarily by diffusive mass transfer into the adjacent higher-permeability units, often referred to as back diffusion. As a result, this distributed mass in lower-permeability units serves as a long-term source to the plume, thereby contributing to plume persistence. Given that many organic-contaminated hazardous-waste sites originated in the 1940’s-1950’s, and that pump-and-treat operations were initiated at many of these sites in the late 1970’s to 1980’s, it is likely that this issue is a primary constraint to site closure for a large number of sites.
Current methods used to characterize plume persistence are generally limited in their ability to provide unambiguous, real-time delineation of specific mass-transfer and attenuation processes and accurate estimation of associated rates. The standard method used to characterize plume attenuation and persistence is based on the analysis of plume-scale concentration-vs-distance profiles determined along the longitudinal axis of the plume. An alternative approach is based on measurement of contaminant mass flux at two or more control planes placed perpendicular to the mean plume trajectory (e.g. Borden et al., 1997; King et al., 1999; Bockelmann et al., 2001; Basu et al., 2006). As has been well established, these approaches are subject to considerable uncertainty due to a number of factors (e.g., Newell et al., 2002; Chapelle et al., 2007).
Over the past decade or so there has been increased interest in the use of high-resolution site characterization approaches to reduce uncertainties associated with standard site characterization methods. These approaches are based primarily on collection of vertically discrete data using sampling of sediment cores collected from drilling of boreholes, or application of various direct-push sensing apparatus (e.g., cone penetrometers, geoprobes) (EPA, 2014). This approach has the benefit of characterizing accurately the vertical contamination distribution at that location. These concentration-depth profiles can be used to help evaluate mass-transfer and attenuation processes (e.g., Johnson et al., 1989; Ball et al., 1997; Chapman and Parker, 2005; Brusseau et al., 2007). This method, however, suffers from several issues that typically limit its ability to produce robust measures of rates. First, these concentration profiles reflect the aggregate, composite impact of all mass-transfer and attenuation processes active at that location. Second, the data produced represent a single snapshot in time. Determining temporal variability of attenuation processes, or the impact of perturbations, requires the drilling of additional boreholes, which will significantly increase overall costs. Third, the impact of advective flow components can in some cases obscure the concentration signals associated with attenuation processes.
The development of innovative, cost-effective field methods for improved characterization of attenuation processes is deemed a critical research need (NRC, 2013, SERDP, 2013). This work addresses this need with the development of the BDFA. The conceptual basis and technical design of the device are presented, along with an example of borehole design and installation at a field site. Mathematical model simulations are used to illustrate its application for two scenarios.
2. Conceptual Basis and Technical Design
The field-scale method presented herein is designed to provide direct access to an undisturbed column of sediment that can be monitored. The concept of employing undisturbed sediment columns for in-situ applications is not new. For example, Ptacek and Gillham (1992) developed a device with which one can conduct small-scale in situ tracer tests for an enclosed section of undisturbed sediment. However, this device did not provide a means to monitor the spatial distribution of solute concentrations. The BDFA, first developed in 2008 (Brusseau, 2008), is designed to provide continuous direct access to an undisturbed column of sediment that can be monitored at multiple discrete vertical intervals to characterize mass transfer and attenuation.
The specific design of the BDFA in allowing continued access is a distinct advantage compared to the standard core-removal and probe-insertion methods. The BDFA device can be installed at any selected depth and for any type of subsurface condition. However, in the current conceptual application, it is targeted to the interface region between lower and higher permeability units to provide a direct in-situ measure of contaminant diffusion, sorption/desorption, and other attenuation processes.
The BDFA is designed specifically to measure local solute flux between lower and higher permeability units. In brief, the device comprises a solid casing that is driven into the target domain, isolating the sediment profile of interest (Figure 1). This approach allows diffusive flux across the contact plane to be characterized separately from horizontal advective transport processes, and ameliorates the impact of the surrounding plume on flux measurements. One issue to consider is that the demarcation between the higher and lower permeability units may not always be distinct, and that there may be a transition zone. This situation would need to be accounted for in the placement of the device and design of the multi-level sampling system, described below.
Figure 1.

Conceptual representation of the BDFA, installed at the interface between higher and lower permeability layers. Yellow arrow represents a mass flux mechanism.
A multi-level sampling device is emplaced within the casing to monitor aqueous concentrations (Figure 2). Transducers and a flowmeter are also installed to measure possible vertical flow. This set of instrumentation allows characterization of solute flux and differentiation of diffusive vs vertical-advective flux. Additionally, a sampling port is included to allow monitoring of the water column on top of the undisturbed sediment core. This port can be equipped to sample the overlying water as well as to inject tracer solutions.
Figure 2.

Schematic of borehole setup for installation of BDFA.
The device requires a specific borehole configuration, as shown in Figure 2. Specifically, a borehole is drilled to within approximately 2 meters of the top of the lower-permeability unit of interest. Note that the dimensions provided in this discussion are illustrative values, and that the actual dimensions employed would be based on specific site conditions. A solid casing is then advanced approximately 2 m into the lower-permeability layer. This will result in a sediment column of approximately four meters being isolated within the casing. A narrow-diameter (approximately 2–4 inch) sediment core is collected from within this sediment column, advancing approximately two meters into the lower-permeability unit. The sediment core is analyzed to obtain a contaminant concentration profile across the undisturbed sediment present inside the device. It is also used to determine the specific vertical distribution of media texture to allow accurate delineation of the lower-higher permeability interface and positioning of the sampling ports. This constitutes the standard sediment-core characterization method, the results of which serve as a baseline data set. The narrow-diameter borehole developed to collect the core is used to emplace the multi-level sampling device. Drilling, core retrieval, and device emplacement methods should be selected to prevent borehole collapse.
As described, the device specifically provides the means to accurately measure local-scale concentrations and flux of resident contaminant for the isolated domain within the apparatus. In addition to this baseline aspect, additional components can be employed to conduct further characterization. For example, tracer solutions can be injected into any targeted region of the sediment profile to enhance the characterization of specific processes. One example involves using a solution containing one or more non-reactive tracers (no sorption or decay) to provide direct, specific characterization of diffusion. A biodegradable tracer solution can be injected to help characterization transformation processes and their impact on attenuation. Analysis of the tracer data can help delineate the specific mass-transfer and transformation processes influencing the observed flux of the contaminant. This in turn will improve the accuracy of mass-transfer/transformation rate coefficients determined from the data.
Another component that can be incorporated into the method is the application of small-volume, vertically discrete push-pull tests using the multilevel sampling device (e.g., Knecht et al., 2011). This can be done for example to conduct small-scale in-situ biotransformation tests. Small-scale pumping or slug tests can be conducted to measure hydraulic conductivities. In addition, various extraction solutions can be injected (and then extracted) to provide high-resolution characterization of sediment properties. Examples include using an acidic solution to characterize mineral and oxide composition, an organic extractant (e.g., methanol) to determine solid-phase organic-contaminant concentrations and test for the potential presence of trapped immiscible liquids, and a surfactant solution to assess microbial content. The implementation of such tests would be predicated on the ability to inject/withdraw the small volumes of solution required for the test.
The concentration data obtained from the tests are used to develop a series of vertical concentration profiles as a function of time (see Figure 3). Measurement accuracy can be evaluated via mass-balance calculations. Inverse modeling approaches can be used to determine effective mass-transfer/transformation rate coefficients from the experiment profiles. For example, for a system wherein transport is governed by diffusive mass transfer, the effective diffusion coefficient obtained from analysis of the test data can be compared to measured bulk aqueous diffusion coefficients to evaluate tortuosity and retardation impacts.
Figure 3.

Example of a simulated concentration profile across the high-low permeability contact plane.
3. Device Installation
A BDFA borehole has been installed at the AFP44 site, which is part of the Tucson International Airport Area (TIAA) Superfund site in Tucson. Brusseau and colleagues have conducted numerous studies at this site to characterize contaminant distribution and transport and to test the performance of various remediation technologies (e.g., Brusseau et al, 2007, 2011). The TIAA site was placed on the National Priorities List in 1983 after the detection of trichloroethene (TCE) in the groundwater. This site consists of a large multi-source TCE plume (Figure S1 supplemental materials) present in the regional aquifer. The hydrogeological units at the site have been described in previous work (Brusseau et al 2007) and comprise an alluvial aquifer with areally extensive lower-permeability silt/clay units present above and below the aquifer.
Roto-sonic drilling was used to drill the borehole and collect continuous sediment core. The borehole configuration is presented in Figure 4. The borehole log is presented in Figure S2. A 10-inch diameter borehole was drilled to 46 m below ground surface. A temporary 10-inch casing was used to allow installation of the permanent casing. A 6-inch solid steel casing, open on the bottom, was then installed. This casing was advanced 3 m into the undisturbed formation, spanning the interface between the clay and sand units. A 2-inch diameter borehole was then drilled within the center of the undisturbed formation, and a PVC screened casing was installed.
Figure 4.

Diagram of borehole B119 with the BDFA installed at the AFP44 field site in Tucson, AZ.
The sediment core was analyzed with high spatial resolution, at <10-cm intervals from ~37 to 49 m below ground surface. The subsamples (∼10 mL) were collected from the internal central axis of the core to minimize the impact of drilling effects. The subsamples were placed in 40-mL glass vials that contained premeasured volumes of solvent (>99.9% methanol) for solvent-extraction analysis of TCE. The subsamples were placed on a shaker for 24 h, followed by centrifugation for 10 min with a Beckman GP Centrifuge. A 2-mL subsample of the eluent was extracted from the vial and placed in a 2-mL autosampler vial with no headspace. The samples were analyzed by GC/MS/MS (gas chromatography tandem mass spectrometry). The mean detection limit for sediment-phase concentrations of TCE was ~50 μg/kg-dry sediment. Groundwater samples were collected from the bottom region of the borehole right after completion of drilling and casing emplacement.
Approximately 100 sediment samples were analyzed. The TCE concentrations were below detection, with the exception of two samples (concentrations of 226 and 240 μg/kg). The two exceptions are samples located at a depth between 42 and 43 m below ground surface. This interval corresponds to the areally continuous clay unit residing above the aquifer. The results show that low levels of non-dissolved (sorbed, separate-phase liquid) TCE are present in the formation profile ensconced within the BDFA. The concentration of TCE in the groundwater sampled from the borehole was 26 μg/L.
4. Model Simulations
A key factor for tests conducted with the BDFA is the length of time required for observation of changes in concentration that are sufficient to support accurate determination of mass flux. Knowledge of this parameter will facilitate effective planning and application of BDFA tests. Two illustrative test applications were simulated to evaluate effective time scales.
The representative model subsurface domain comprises an areally extensive clay unit (aquitard) residing within a sand aquifer, as illustrated in Figure 5. The BDFA was evaluated for two scenarios. The first represents plume migration into uncontaminated regions, e.g., pre-remediation conditions at a site. In this scenario, solute migration in the downgradient direction occurs via advective-dispersive transport in the more permeable sand unit, and diffusive mass-transfer transmits solute to the adjacent low-permeability unit. This scenario also represents implementation of a tracer test within the BDFA to characterize diffusive mass transfer between the high- and low-permeability units (i.e., injection of a non-reactive tracer solution into the sand unit). The second scenario represents conditions wherein plume remediation via pump and treat has been conducted at the site for an extended period (many years), and as a result, contaminant concentrations are relatively low in the sand unit (~few µ/L) and higher in the clay unit (~100s-1000s µ/L). This scenario represents using the BDFA to characterize back diffusion of solute from the clay unit to the sand. Mass transfer across the sand-clay interface was simulated using solutions to Fick’s second Law. The simulations were simplified by assuming the solute is non-reactive.
Figure 5.
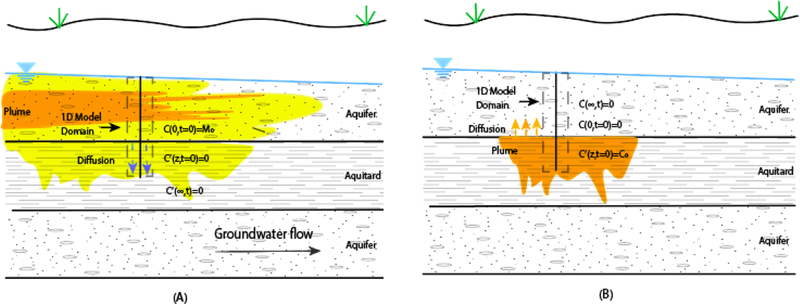
Conceptual scheme for simulated application of the Borehole Diffusive Flux Apparatus. The region within the dashed box is the 1D model domain. (A) Simulation scenario 1: The application of a tracer test to characterize mass transfer from a sand (aquifer) unit to a clay (aquitard) unit (e.g., representing plume migration for pre-remediation period). (B) Simulation scenario 2: The application of a test to characterize back diffusion from a clay unit to the sand unit (e.g., representing a plume pump-and-treat remediation scenario).
The first scenario was simulated with the total mass M [M] of a non-reactive tracer introduced instantaneously at the interface of the aquifer and the aquitard (Fig. 1A). The solution for this scenario is given by (Crank, 1975):
where C [M/L3] is the concentration in the aquitard, x [L] is the distance starting from the aquifer/aquitard interface to the sampling point, t [T] is the time since the test started, and Deff [L2/T] is the effective diffusion coefficient, Deff = Dθ/τ, where D [L2/T] is the diffusion coefficient in bulk solution, is tortuosity, and is porosity. The second scenario is represented with the initial and boundary conditions as:
where C and C’ [M/L3] are the concentration in the aquifer and aquitard, respectively. C0 [M/L3] is the initial concentration of resident contaminants in the aquitard whose thickness is 2h [L]. This can be solved by (Crank, 1975):
where x [L] is the distance starting from the center of the aquitard to the sampling point.
For the first simulation, tracer with initial concentration of 10,000 g/m3 was injected at t=0. D was set at 0.00015 m2/d to represent a typical tracer such as bromide. For the second simulation, the initial concentration in the aquitard was 100 g/m3, with D of 0.00005 m2/d to represent a typical organic contaminants such as trichloroethene. The thickness of the aquitard was 1 m, porosity was 0.3 for both layers, and tortuosity was 1.5 for both layers. These values are selected to be generally representative of typical sites with sedimentary deposits.
The results are shown in Figures 6a and 6b for scenarios 1 and 2, respectively. Significant migration of solute for the two applications is observed within time scales of several weeks to a few months. This time frame is a reasonable period for field-scale tests. In actual applications, the measured concentration profiles obtained from a test would, for example, be used for parameter determination by fitting with appropriate analytical or numerical solutions.
Figure 6A.

Diffusion concentration profiles for scenario 1. Depth is distance into the clay unit.
Figure 6B.

Diffusion concentration profiles for scenario 2.
5. Summary
The Borehole Diffusive Flux Apparatus is an innovative apparatus designed to provide continuous direct access to an undisturbed column of sediment that can be monitored at multiple discrete vertical intervals to provide high-resolution characterization of local-scale mass transfer and attenuation. In this work, its application is illustrated specifically to measure diffusive mass transfer of solute between lower-permeability and higher-permeability units in an isolated environment. This allows quantitative characterization of the local-scale processes controlling mass transfer and attenuation. An example installation at a field site demonstrated the feasibility of field-scale implementation.
Mathematical model simulations were used to illustrate its application for two scenarios. The results indicated that test periods of several weeks to a few months should be sufficient to obtain robust results. The device has the potential to improve our ability to characterize critical mass-transfer and attenuation processes and to quantify the associated rates. This information is key to the evaluation of remediation alternatives, for enhancing the accuracy of mathematical models, and to support more effective long-term management of large groundwater contaminant plumes present at many sites.
Supplementary Material
Acknowledgements
This research was supported by funds provided by the NIEHS Superfund Research Program (P42 ES04940) and the U.S. Air Force. We thank Bill DiGuiseppi formerly of AECOM for his assistance with the field installation. We thank the reviewers for their comments.
Footnotes
Conflict of Interest: The authors declare that they have no conflict of interest.
References
- Ball WP, Liu C, Xia G, and Young DF 1997. A diffusion-based interpretation of tetrachloroethene and trichloroethene concentration profiles in a groundwater aquitard, Water Resour. Res, 33, 2741–2757. [Google Scholar]
- Basu NB, Rao PSC, Poyer IC, Annable MD, and Hatfield K 2006. Flux-based assessment at a manufacturing site contaminated with trichloroethylene. J. Contam. Hydrol 86, no. 1–2: 105–127. [DOI] [PubMed] [Google Scholar]
- Bockelmann A, Ptak T, Teutsch G 2001. An analytical quantification of mass fluxes and natural attenuation rate constants at a former gasworks site. J. Contam. Hydrol, 53, 429–453. [DOI] [PubMed] [Google Scholar]
- Borden RC, Daniel RA, LeBrun LE Davis CW 1997. Intrinsic biodegradation of MTBE and BTEX in gasoline-contaminated aquifer. Water Resour. Res 33(5) 1105–1115. [Google Scholar]
- Brusseau ML 2008. Characterizing Diffusive Flux and its Contribution to Plume Attenuation and Longevity. Full proposal submitted to the Strategic Environmental Research and Development Program, Department of Defense. [Google Scholar]
- Brusseau, Mark L, Nelson NT, Zhang Z, Blue JE, Rohrer J, and Allen T. 2007. Source-zone characterization of a chlorinated-solvent contaminated Superfund site in Tucson, AZ. J. Contam. Hydrol 90(1–2): 21–40. [DOI] [PubMed] [Google Scholar]
- Brusseau ML, Hatton J, DiGuiseppi W 2011. Assessing the impact of source-zone remediation efforts at the contaminant-plume scale through analysis of contaminant mass discharge, J. Contam. Hydrol 126,130–139. [DOI] [PMC free article] [PubMed] [Google Scholar]
- Brusseau ML, Guo Z 2014. Assessing contaminant-removal conditions and plume persistence through analysis of data from long-term pump-and-treat operations, J. Contam. Hydrol 164, 16–24. [DOI] [PMC free article] [PubMed] [Google Scholar]
- Chapelle FH, Novak J, Parker J, Campbell BG, and Widdowson MA 2007. A Framework for Assessing the Sustainability of Monitored Natural Attenuation. United States Geological Survey, Circular 1303. [Google Scholar]
- Chapman SW and Parker BL 2005. Plume persistence due to aquitard back diffusion following dense nonaqueous phase liquid source removal or isolation. Water Res. Res, Vol. 41, 10.1029/2005WR004224. [DOI] [Google Scholar]
- Johnson RL, Cherry JA, and Pankow JF 1989. Diffusive contaminant transport in natural clay: A field example and implications for clay- lined waste disposal sites, Environ. Sci. Technol, 23(3), 340–349. [Google Scholar]
- King M, Barker WG, Devlin JF, Butler BJ, 1999. Migration and natural fate of a coal tare creosote plume: 2. Mass balance and biodegradation indicators. J. Contam. Hydrol 39, 281–307. [Google Scholar]
- Knecht K, Schroth MH, Schulin R, and Nowack B, 2011. Development and Evaluation of Micro Push-Pull Tests to Investigate Micro-Scale Processes in Porous Media. Environ. Sci. Technol, 45, 6460–6467. [DOI] [PubMed] [Google Scholar]
- Liu CX, Ball WP, Back diffusion of chlorinated solvent contaminants from a natural aquitard to a remediated aquifer under well-controlled field conditions: Predictions and measurements, Ground Water, 40 (2002) 220–220. [DOI] [PubMed] [Google Scholar]
- Matthieu DE III, Brusseau ML, Guo Z, Plaschke M, Carroll KC, Brinker F 2014. Persistence of a groundwater contaminant plume after hydraulic source containment at a chlorinated-solvent contaminated site, Groundwater Monit. Remed, 34, 23–32. [DOI] [PMC free article] [PubMed] [Google Scholar]
- NRC (National Research Council), Alternatives for managing the nation’s complex contaminated groundwater sites Washington, D.C. 2013. [Google Scholar]
- Ptacek CJ, Gillham RW, 1992. Laboratory and field measurements of nonequilibrium transport in the Borden aquifer, Ontario, Canada, J. Contam. Hydrol, 10 (2), 119–158. [Google Scholar]
- Rasa E, Chapman SW, Bekins BA; Fogg GE, Scow KM, Mackay DM 2011. Role of back diffusion and biodegradation reactions in sustaining an MTBE/TBA Plume in alluvial media, J. Contam. Hydrol 126, 235–247. [DOI] [PMC free article] [PubMed] [Google Scholar]
- Newell CJ, Rifai HS, Wilson JT, Connor JA, Aziz JA, & Suarez MP 2002. Calculation and use of first-order rate constants for monitored natural attenuation studies United States Environmental Protection Agency, National Risk Management Research Laboratory. [Google Scholar]
- SERDP (Strategic Environmental Research and Development Program). 2013. SERDP and ESTCP workshop on long term management of contaminated groundwater sites [Google Scholar]
- USEPA. 1996. Soil screening guidance: User’s guide 2nd ed. EPA-540-R-96/018. Office of Emergency and Remedial Response, Washington, DC. [Google Scholar]
- USEPA. 2010. “Tucson International Airport Area Superfund Site, March 2010.” : 1–12. Region 9, San Francisco, CA. [Google Scholar]
Associated Data
This section collects any data citations, data availability statements, or supplementary materials included in this article.