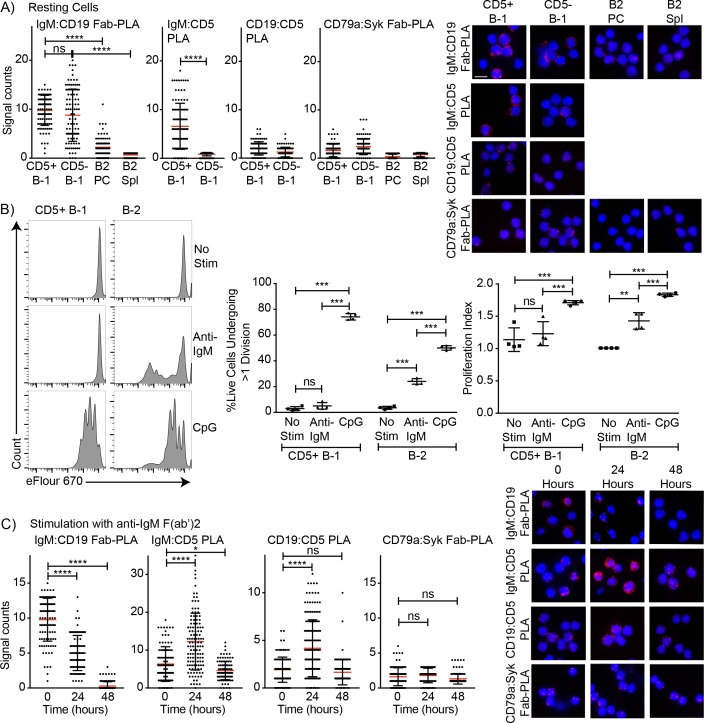
Figure 5. Association of CD5 with IgM-BCR in resting B-1a cells is increased after BCR-stimulation.
(A) Indicated FACS-purified B cell subsets from the peritoneal cavity (PC) and spleen (Spl) of BALB/C mice were analyzed by proximal ligation assay for the following interactions (left to right): IgM:CD19, IgM:CD5, CD19:CD5 and CD79:syk. Left panel shows summarizes data on signal counts for 200 individual cells analyzed. Each symbol represents one cell, horizontal line indicates mean signal count per cell. Right panel show representative fluorescent images. (B) FACS-purified CD19hi CD23- CD5+ CD43+ B-1 cells from the peritoneal cavity and CD19+ CD23+ splenic B-2 cells of BALB/C mice were labeled with efluor670 and then cultured in the absence (top) or presence of 20 ug/ml anti-IgM (middle) or 10 ug/ml CpGs for 72 hr. Left panels show representative histogram plots, middle panel shows the % cells in each culture having undergone at least one cell division and right panel indicates the proliferation index (average number of proliferations undergone per divided cell). (C) Summary of proximal ligation assay results of B-1 cells purified as in (A) and then stimulated for indicated times with anti-IgM(Fab)2. Interactions of the following proteins were analyzed on 200 cells per condition (left to right): IgM:CD19, IgM:CD5, CD19:CD5 and CD79:syk. Right panels shows representative fluorescent images from one experiment of at least two done. Values were compared using an unpaired Student’s t test (*=p < 0.05, **=p < 0.005, ***=p < 0.0005, ****=p < 0.00005).

