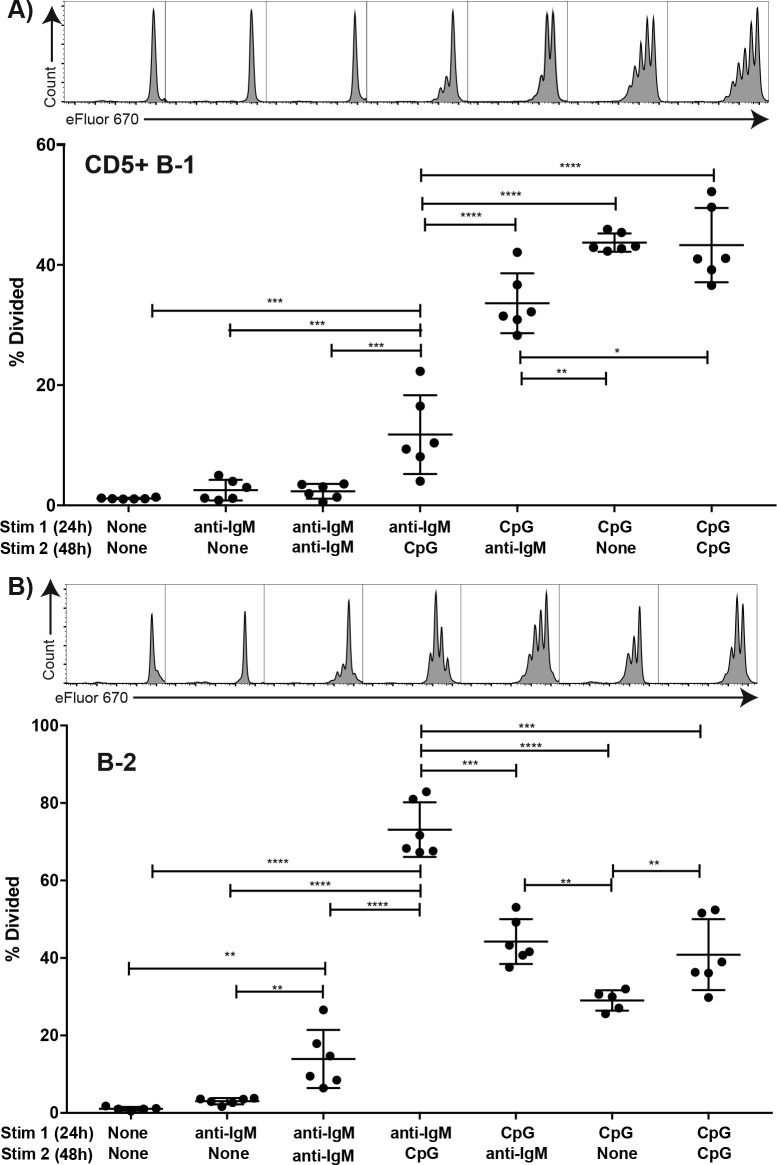
Figure 7. TLR but not BCR-stimulation induces CD5+ B-1 cell proliferation FACS-purified.
(A) peritoneal cavity CD19hiCD23- CD43+ CD5+ B-1 and (B) splenic CD19+ CD23+ CD43 CD5- B-2 cell from BALB/C mice were labeled with eFluor 670, rested for 2 hr and then cultured for 24 hr with the indicated stimulus 1 (none/anti-IgM at 10 μg/ml or CpG ODN7909 at 5 μg/ml), washed and recultured for 48 hr with stimulus 2 (none/anti-IgM at 10 μg/ml/ CpG ODN7909 at 5 μg/ml) prior to analysis for efluor 670 staining. Top panels show representative FACS histogram plots and bottom panels shows the % cells in each culture having undergone at least one cell division. Each symbol represents results from one culture well, horizontal line indicates mean for the group. Results are compiled from two independent experiments. Statistical analysis was done by one-way ANOVA, followed by an unpaired Student’s t test with Holm-Sidak correction for multiple comparisons (*p<0.05, **p<0.005, ***p<0.0005, ****p<0.00005).

