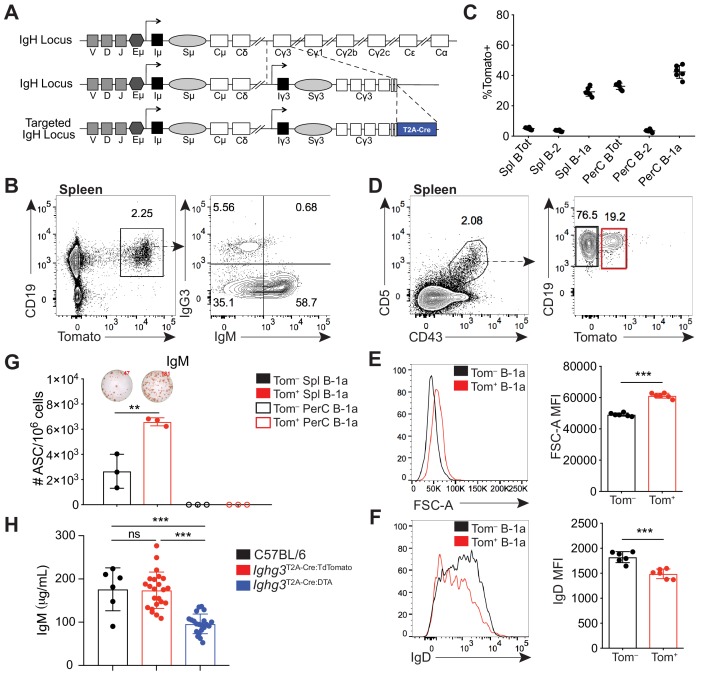
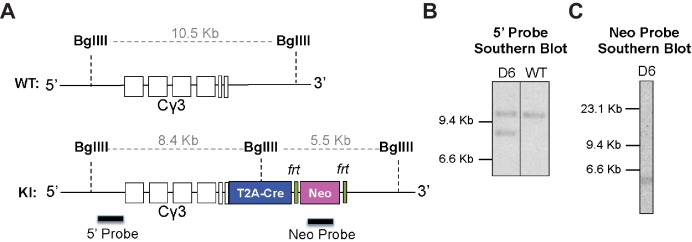
Figure 1. A reporter mouse marks activated B-1a cells.
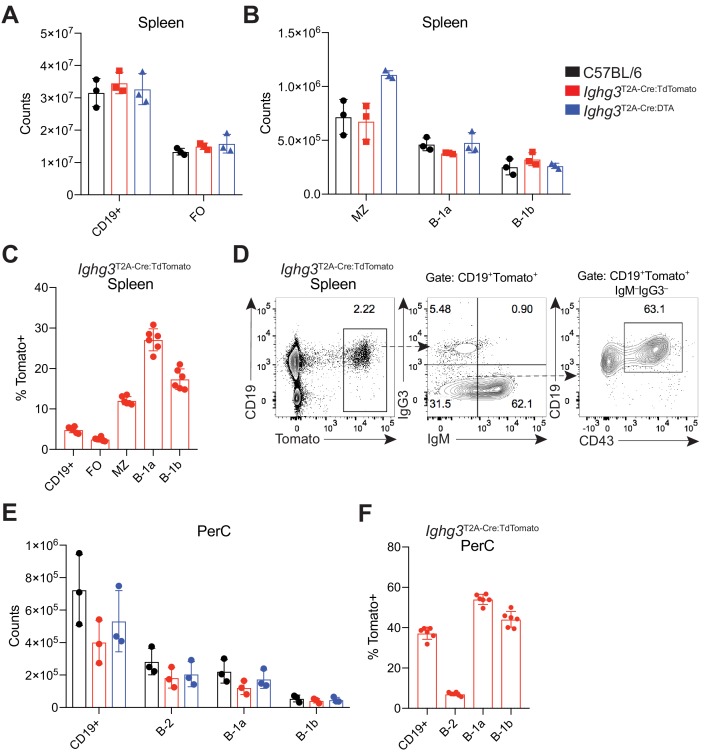
(A) Schematic of targeted insertion of T2A-Cre into the Ighg3 (Iγ3) heavy chain locus to generate the Ighg3T2A-Cre reporter mouse. (B) Representative flow cytometry plot of IgG3 and IgM expression on pregated CD19+Tomato+ splenocytes from 6 wk old Ighg3T2A-Cre mice crossed to Rosa26STOP-flox-TdTomato mice (Ighg3T2A-Cre:TdTomato). (C) Percentage Tomato expression in B cell subsets from the peritoneal cavity (PerC) and spleen (Spl) of 6 wk old Ighg3T2A-Cre:TdTomato mice by flow cytometry. Total B cells defined as CD19+; B-2 cells defined as CD19+CD23+CD43–CD5–; B-1a cells defined as CD19+CD23–CD43+CD5+. (D) Representative flow cytometry gating of Tomato– and Tomato+ splenic B-1a cells from 3 wk old Ighg3T2A-Cre:TdTomato mice, pregated on Live/CD19+CD23– cells. (E) Representative histogram and quantification of FSC-A and (F) IgD expression on pre-gated Tomato– (black) and Tomato+ (red) splenic B-1a cells. (G) Number of IgM+ antibody secreting cells (ASCs)/106 present in purified Tomato– (black) or Tomato+ (red) splenic (closed circles) or peritoneal cavity (PerC) (open circles) B-1a cells from 6 wk old Ighg3T2A-Cre:TdTomato mice, as measured by ELISpot. (H) Serum IgM titers of 7 wk old C57BL/6 (black), Ighg3T2A-Cre:TdTomato (red) and Ighg3T2A-Cre mice crossed to Rosa26STOP-flox-DTA (Ighg3T2A-Cre:DTA) (blue) mice. Error bars indicate the mean (± SEM). *p<0.05, **p<0.01, and ***p<0.001 (unpaired two-tailed Student's t-test). Each data point represents an individual mouse (C, E-H). Data are representative of at least three independent experiments (B-G) or pooled from five independent experiments (H).

