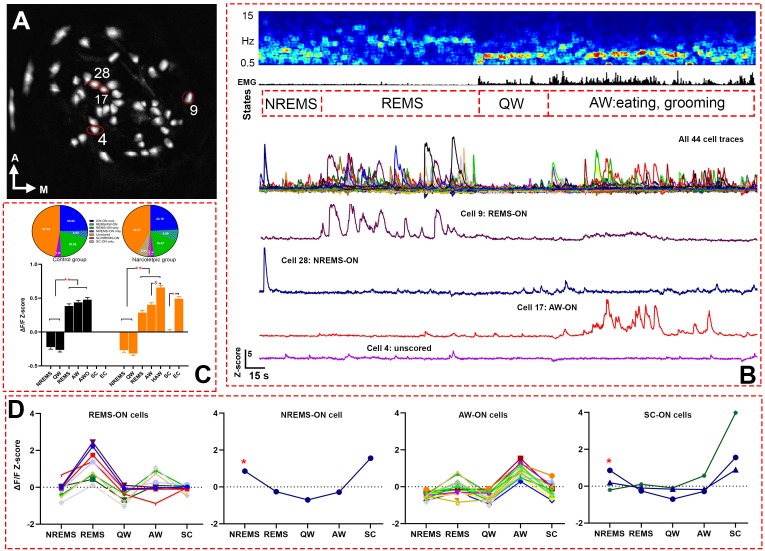
Figure 2. Live Ca2+ activity recording and cell classification.
(A) Map of 44 recorded cells from narcoleptic mouse LR02082418. (B) A serial figures showing (top to bottom) EEG spectrogram, EMG, brain states, cell traces of a total of 44 cells, cell traces of four example cells outlined in A. (C) bar graph (bottom) of Z-scores in each brain state and Bonferroni pairwise comparison results, and pie charts (top) of ON cell percentages in each brain states. **: p<0.001 compared to NREMS and QW in both groups, or SC in the narcoleptic group. and : p<0.001 compared to AW in the narcoleptic group. (D) Z-scores graphs of ‘ON’ cells in each brain state during undisturbed recording period in mouse LR02082418, including 10 REMS-ON, 1 NREMS-ON, 15 AW-ON, and 3 SC-ON cells. The only NREMS-ON cell (marked with *) was also one of the SC-ON neurons. AWO: active waking after odor exposure in control mice. HAW: hyperactive AW after odor exposure in the narcoleptic mice. SC: spontaneous cataplexy during undisturbed recording. EC: emotion-induced cataplexy during odor exposure.

