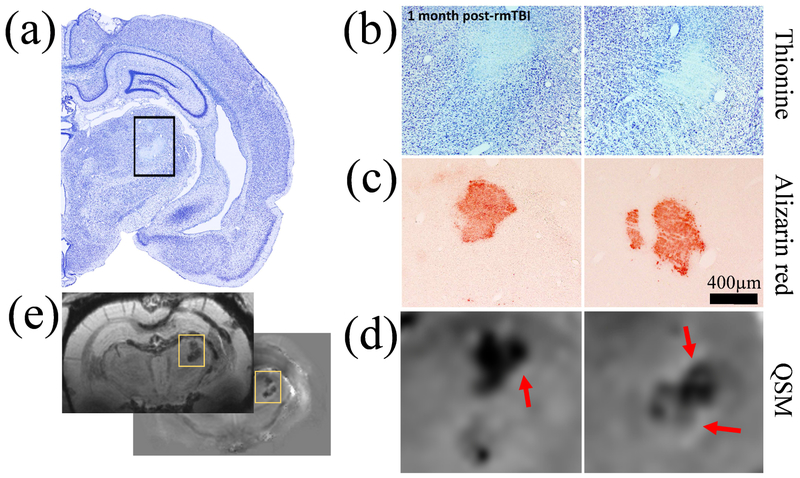
Figure 6.
Comparison of MRI-based findings with histology in an r-mTBI animal with 0.38 mm3 thalamic calcification volume. (a) Low magnification picture of the thionine stained (neuronal damage) injured right hemisphere. (b) Higher magnification pictures of thionine stained the thalamus in two consecutive slides spaced 300 μm apart, showing thalamic damage and hyper intense calcifications. (c) Thalamic calcifications stained with Alizarin red (calcium). Note the similar location of the calcifications with thionine stained sections. (d) Magnifications of similar regions on the susceptibility maps with a nominal slice thickness of 90 μm. A high agreement of the appearance of calcium deposits was observed between MRI and histology. Red arrows point at the hyperintense rim observed around calcifications. (e) Overview slices of mean-intensity projections and mIPs of the susceptibility map and magnitude images, respectively, across the 600 μm covered by the shown histological stains.

