

Abstract
The cerebral cortex is a highly organized structure responsible for advanced cognitive functions. Its development relies on a series of steps including neural progenitor cell proliferation, neuronal migration, axonal outgrowth and brain wiring. Disruption of these steps leads to cortical malformations, often associated with intellectual disability and epilepsy. We have generated a new resource to shed further light on subcortical heterotopia, a malformation characterized by abnormal neuronal position. We describe here the generation and characterization of a knockout (KO) mouse model for Eml1, a microtubule‐associated protein showing mutations in human ribbon‐like subcortical heterotopia. As previously reported for a spontaneous mouse mutant showing a mutation in Eml1, we observe severe cortical heterotopia in the KO. We also observe abnormal progenitor cells in early corticogenesis, likely to be the origin of the defects. EML1 KO mice on the C57BL/6N genetic background also appear to present a wider phenotype than the original mouse mutant, showing additional brain anomalies, such as corpus callosum abnormalities. We compare the anatomy of male and female mice and also study heterozygote animals. This new resource will help unravel roles for Eml1 in brain development and tissue architecture, as well as the mechanisms leading to severe subcortical heterotopia.
Keywords: cortical malformations, heterotopia, mouse model of developmental disorders
Introduction
Cerebral cortical development relies on highly regulated processes of cell proliferation, neuronal migration, growth of axons and dendrites, as well as synaptogenesis and refined connectivity. Defects in these steps lead to cortical pathology, and severe malformations are associated with abnormal progenitor cells and/or defects in migrating neurons (Bizzotto & Francis, 2015; Stouffer et al. 2016; Romero et al. 2018).
Although human cortical malformations are rare disorders, their combined incidence is more than 1% in the human population. Fourteen percent of epileptic patients are believed to present a neuronal migration disorder. This percentage rises to 40% when considering those patients with intractable epilepsy (Farrell et al. 1992; Meencke & Veith, 1992; Guerrini, 2005). Subcortical heterotopia is a malformation characterized by the presence of masses of neurons beneath the normal cortex. It can be associated with a delay in somatic development, intellectual disability as well as epilepsy (Bahi‐Buisson et al. 2013).
Patients with compound heterozygote or homozygote mutations in EML1 exhibit giant bilateral ribbon‐like heterotopia, presenting large clusters of neurons that are aberrantly positioned within the white matter (Kielar et al. 2014; Shaheen et al. 2017, OMIM #600348). EML1‐mutation patients can also present hydrocephalus, polymicrogyria and macrocrania (Kielar et al. 2014; Shaheen et al. 2017), and suffer from refractory epilepsy, intellectual disability and/or psychomotor developmental delay (Kielar et al. 2014; Shaheen et al. 2017).
We previously studied Heterotopic Cortex (HeCo) mice, a spontaneously arisen mouse line exhibiting a retrotransposon insertion in the Eml1 gene (Croquelois et al. 2009; Kielar et al. 2014). These mice show bilateral heterotopia below the cortex in dorso‐medial regions, associated with a susceptibility to epilepsy, as well as learning and memory deficits (Croquelois et al. 2009).
EML1 is a microtubule‐associated protein expressed in proliferative progenitor zones from early stages of corticogenesis (Kielar et al. 2014; Bizzotto et al. 2017). It binds to both microtubules and soluble tubulin (Richards et al. 2015) and contains an N‐terminal domain with a coiled coil motif and a C‐terminal region with a tandem beta propeller structure. Although its function remains relatively unknown, EML1 is important for progenitor distribution and function in the early developing cortex (Kielar et al. 2014; Bizzotto et al. 2017). Indeed, heterotopia formation in the HeCo mouse was shown to involve abnormal radial glial cell progenitors (RGs) in early‐mid corticogenesis (Kielar et al. 2014; Bizzotto et al. 2017), which are the main neuronal progenitor cell in the developing cortex. They are characterized by the presence of an apical and a long basal process, the latter serving as a guide for radially migrating neurons (Götz & Huttner, 2005; Matsuzaki & Shitamukai, 2015; Uzquiano et al. 2018). Because of abnormal RG distribution and basal process morphology in HeCo mice, migration is perturbed throughout corticogenesis, with upper‐layer neurons permanently arrested in the neocortical white matter (Kielar et al. 2014). Additionally, RGs were reported to show abnormal spindle orientation and mitotic spindle length, indicating a possible role for Eml1 in mitosis (Kielar et al. 2014; Bizzotto et al. 2017).
Although other subcortical heterotopia mouse models have arisen (Cappello et al. 2012; Beattie et al. 2017; Jossin et al. 2017; Liu et al. 2018), the HeCo mouse line represents a good disease model, mimicking human subcortical heterotopia, and showing mutations in a gene also mutated in human patients.
Eml1 gene expression was verified in the HeCo mouse mutant, and full‐length transcripts were shown to be absent. A retrotransposon insertion occurs towards the end of the gene, and certain chimeric transcripts were identified between Eml1 and the retrotransposon (Kielar et al. 2014). The absence of reliable antibodies against this protein made it difficult to verify whether mutant Eml1 isoforms were produced; however, loss‐of‐function due to severe disruption of the major scaffolding beta propeller domains is predicted (Richards et al. 2015). HeCo mice also arose on an unusual in‐crossed NOR‐CD1 congenic background. We had the possibility in this project of developing Eml1 knockout (KO) mice on the C57BL/6N genetic background (B6N), as well as performing detailed and extensive neuroanatomical analyses. We show here that Eml1 KO mice resemble HeCo mice, faithfully revealing subcortical heterotopia, visible as early as embryonic day (E) 18.5. RG progenitor cells are perturbed at E13.5, similar to HeCo. Neuroanatomical measures in adult KO‐B6N mice reveal a wider phenotype than observed in HeCo, which is not restricted to the neocortex. Males and females are both affected, with especially males showing a consistent heterotopia phenotype. This work hence characterizes a new Eml1 KO resource, as well as illustrating wide systematic neuroanatomical analyses in neurological mouse mutants.
Materials and methods
Mouse line and ethical statement
All mouse experimental procedures were performed in agreement with the EC directive 2010/63/UE86/609/CEE for the care and use of laboratory animals, and every effort was made to minimize the number of animals used and their suffering. The neuroanatomical pipeline was approved by the local animal care, use and ethic committee of the Institute of Genetics and of Molecular and Cellular Biology (IGBMC) under accreditation number 2012‐139. Embryonic analyses were approved by the French MESR 00984.02 authorization with protocols followed and approved by local ethical committees (Charles Darwin committee, Paris, France). The light cycle was controlled as 12 h light and 12 h dark (lights on at 07.00 h), and the temperature was maintained at 23 ± 1 °C.
Creation of an Eml1 mouse KO line
The Eml1 mutant mouse line was established at the PHENOMIN MCI/ICS (Mouse Clinical Institute ‐ Institut Clinique de la Souris, Illkirch, France; http://www-mci.u-strasbg.fr), in the framework of funding from the French Rare Disease Foundation. The Eml1 mutant line was generated and analyzed on the mouse genetic background C57BL/6N (B6N). LoxP sites surrounding exon 8 were first introduced into a genomic DNA targeting construct (Supporting Information Fig. S1). This vector contained a Neo cassette encompassed by two FRT sites upstream of the second loxP site. This targeting construct was introduced by electroporation to allow homologous recombination in B6N embryonic stem (ES) cells. After G418 selection, targeted clones were identified by long‐range PCR using external primers and further confirmed by Southern blot with an internal Neo probe as well as 5′ and 3′ external probes. Two positive ES clones were injected into B6N blastocysts. Resulting male chimeras were bred with wild type (WT) B6N females to obtain germline transmission. Selection cassettes were excised by crossing with a Rosa Cre Flpase deleter mouse line (Birling et al. 2012). Standard biochemical and metabolic tests were performed. Briefly, blood collection was performed for hematology and clinical chemistry assessments. Procedures are detailed in the following link (http://www.mousephenotype.org/impress).
Genotyping
The following primers were used for genotyping (Fig. S1):
| Position | Primers | Sequence |
|---|---|---|
| Ef | 7964 | CCCTGAGCTTCCTCATAACTTCAGC |
| Ef2 | 7965 | CAGGTCTGTGGGCTCTGTAACAGG |
| Er | 7966 | CACCCACTGAAGAAATGACTGGCAG |
| Er2 | 7967 | CTTGTTAAAGCGTCTGCAGTCTGTCTG |
| Lf | 7962 | GAAAACGTGCTTTGCTGTGTACATAGG |
| Lr | 7963 | CGCCACCCTTTTCTACAAGTCATTTTTG |
| Lxr | 4724 | CGAAGTTATCTGCAGGTCGACCTTAAG |
| Mqf | 6 | GAAGAACGAGATCAGCAGCCTCTGTTCC |
| Mqr | 265 | TGCTAAAGCGCATGCTCCAGACTGC |
To distinguish the knockout allele, primer pairs Lf‐Lr (245 bp, knock‐out [KO]; 165 bp, WT) and Ef‐Er (414 bp, KO; 309 bp WT) were used.
Neuroanatomical studies
Neuroanatomical studies were carried out independently in WT and Eml1−/− male and female mice at 7 weeks of age. We aimed for n = 5 per group for male and n = 4 per group for female 7‐week‐old animals, although for some measures, statistics were not computed (comparisons involving fewer than three animals; see the Figure legends for more information). Also at postnatal day 13 (P13), we aimed for n = 3 per group for male and females in comparisons (see Figure legends for exceptions), as described previously (Collins et al. 2018). Of note, experiments with Eml1+/− mice were performed with n = 3–4 for both males and females (see Figure legends for exceptions). Concerning adults, the four females and the five males used for studies of 7‐week‐old mice each came from three different litters. Concerning all other analyses, the mice used came from at least two different litters. Exceptions are heterogeneous (het) male 7 week analyses and WT male E18.5 analyses. In these two cases, the animals used came only from one litter.
In brief, adult mouse brain samples were fixed in 10% buffered formalin for exactly 48 h. A total of 166 brain parameters, made up of area and length measurements, as well as cell level features and 31 covariates, were taken blind to the genotype across one well‐defined sagittal section (Supporting Information Fig. S2A,B and Table S1).
Similarly, neuroanatomical studies were carried out at E18.5 [n = 3 per group for a total of six groups including male and female; wild type (WT), heterozygous (het) and homozygous (hom), for exceptions see below]. To obtain the samples, het–het crosses were established, thus allowing analyses of littermates. Mouse embryo head tissue samples were harvested and fixed in Bouin's fixative for exactly 48 h followed by careful dissection of the brain and incubation in 70% ethanol before paraffin‐embedding for sagittal sectioning. Brain sections were cut exactly in the plane of the closest image to the section defined as critical section at Lateral 0.60 mm of the right hemisphere numbered 9 (Supporting Information Figs S2 and S3). We failed brain sections that deviated more than 140 μm anterior or posterior to the critical section. When sectioning, great care was taken to avoid dorso‐ventral and antero‐posterior asymmetry. Sections were co‐stained with cresyl violet and luxol blue as described previously (Collins et al. 2018). For E18.5 analyses, 46 brain parameters, concerning area and length measurements, were taken blind to the genotype across one sagittal section, as well as 31 covariates (Fig. S3B). We have previously shown that our quantitative and ultra‐standardized approach allowed us to detect many more features and more subtle phenotypes than previously published data (Mikhaleva et al. 2016).
Immunohistochemistry analyses at P13
Immunohistochemistry analyses were performed in WT (n = 3 for male and female), het (n = 3 for male and two for female) and hom (n = 3 for male and female) mice. Brains of P13 mice were fixed by immersion in ice‐cold 4% (w/v) paraformaldehyde (PFA) in phosphate‐buffered saline (PBS) during 24 h, washed in 1 × PBS and embedded in paraffin. The sections from paraffin‐embedded tissues were collected on glass slides and were treated with Tris–ethylenediaminetetraacetic acid (EDTA) buffer (10 mm Tris Base, 1 mm EDTA, 0.05% Tween 20, pH 9.0) at 94 °C for 40 min. The slides were cooled down at room temperature (RT) for 15 min. Blocking was performed for 1 h at RT (1 × PBS with 5% normal goat serum, 0.05% Tween 20). The primary antibody Tbr1 (Abcam, ab31940, 1 : 200) was incubated overnight (O/N) at 4 °C. The secondary antibody Alexa 555 (Invitrogen, 1 : 500) was then incubated for 1 h at RT. The sections were then stained with 4′,6‐diamidino‐2‐phenylindole (DAPI) (50 mg mL−1) diluted in Tris–MWL 4‐88 solution (Citifluor, EMS). Images were acquired with a TCS Leica SP5‐II confocal microscope.
Immunohistochemistry analyses at early embryogenesis
Mouse embryos were obtained at E13.5 from timed‐pregnant females. To obtain the samples, het–het crosses were established, allowing analyses of littermates. For WT, het and hom mice three to five embryos were analyzed from at least three different litters. Pregnant females were injected with 5‐bromo‐2′‐deoxyuridine (BrdU, 99% Bioultra, Sigma‐Aldrich Chimie Sarl, ref. B9285, 50 μg · g–1 bodyweight) and sacrificed after 30 min. Mouse embryo head tissue samples were fixed by immersion O/N at 4 °C in 4% w/v PFA in 0.1 m phosphate buffer, pH 7.4. Brains were dissected and extensively washed in 1 × PBS. Brains were cut in 70‐μm‐thick coronal sections using a vibrating blade microtome (Leica VT1000 S), followed by immunohistochemistry. Blocking was performed for 1 h at RT with blocking solution (1 × PBS with 10% goat serum and 0.5% Triton X‐100) before incubation O/N at 4 °C with the following primary antibodies: Pax6 (BioLegend, Poly19013, 1 : 300) and N‐Cadherin (Transduction Laboratories, C70320, 1 : 2000). For other primary antibodies, see below. After extensive washes, sections were incubated with secondary anti‐mouse Alexa 488 or anti‐rabbit Alexa 568 (Life Technologies, 1 : 1000) for 2 h at RT. This was followed by 10 min incubation in Hoechst (Thermo Fisher Scientific, 1 : 1000). After extensive washes, brain sections were mounted with Fluoromount G (Southern Biotechnology). For F‐actin immunofluorescence, Alexa Fluor 568 Phalloidin (1 : 100, Life Technologies) was incubated in PBST 1% for 1h at RT after incubation with the secondary antibody.
To perform immunohistochemistry combining the primary antibodies Ki67 (BD 556003, 1 : 200) and BrdU (Bio‐Rad, clone Bu20a, 1 : 1000), a modified protocol was applied. Antigen retrieval was performed by incubating the sections in sodium citrate 10 mm pH 6 at 95 °C for 20 min and allowing them to cool before blocking. After blocking, incubation with the primary antibody (Ki67), secondary antibody and Hoechst, sections were fixed with PFA 8% w/v for 15 min at RT (Palmer et al. 2000). Extensive washes with PBST‐0.1% (1 × PBS and 0.1% Triton X‐100) were performed, followed by incubation of the sections in 2 n hydrochloric acid for 30 min at 37 °C. After extensive washes, the sections were incubated with the primary antibody (BrdU), secondary antibody and Hoechst, and then mounted with Fluoromount G as previously described.
To assess Pax6 positive (+) and Ki67+BrdU+ cell distribution, regions of interest (ROI) were selected from both hemispheres, spanning the whole cortical wall and with a width of 100 μm. Two ROIs were quantified per animal. The cortical wall was divided into six equal‐size bins, bins 1 to 6, corresponding to the most apical (apical ventricular zone) to basal (cortical plate) regions of the developing cortex, respectively (Fig. 4A, top row, right panel). Cells that were positive for the selected markers were quantified, and the percentage relative to the total number of positive cells was compared between the three genotypes (WT, het and hom), in each different bin. Images were acquired with a TCS Leica SP5‐II confocal microscope.
Statistical analyses
For adult and E18.5 analyses, data were analyzed using a two‐tailed Student t‐test of equal variance to determine whether a brain region was associated with the neuroanatomical defect. The level of significance was set at P < 0.05. Data are represented in a combined graph. Color‐coded histograms according to the P‐value show the percentage decreased (minus scale) or increased (plus scale) of measured brain regions as compared with the controls (0%). Data are also represented as box plots displaying the median with interquartile range. Box plots additionally indicate the number of animals specifically used for each parameter quantified. We only considered the exact same stereotaxic coordinates, thus some animals could not be used to quantify certain specific parameters, explaining sometimes compromised sample size. Equally, due to the lower penetrance of the heterotopia phenotype in females (see below), a lower n number (2) was used when assessing heterotopia‐specific characteristics in 7‐week‐old adults and E18.5 embryos. Related to heterotopia‐specific characteristics (area and height of HeCo and HoCo), data are represented as mean ± SEM.
For E13.5 analyses, data were analyzed using the Kruskal–Wallis test with two factors (bin and genotype), followed by a Chi square test to compare each genotype across the different bins. The level of significance was set at P < 0.05. The median is represented, and the error bars represent the minimum and maximum range. The analyses were performed with statview and graphpad prism.
Results
Generation of an Eml1 KO mouse model
A knockout strategy was developed targeting Eml1 exon 8, with a view to impacting drastically the tandem beta propeller (TAPE) organization of the EML1 protein (Fig. S1A,B). The TAPE structure is an important scaffolding domain representing the major part of the protein sequence (Richards et al. 2015). After homologous recombination, mice chimeras were generated incorporating the targeted allele (Fig. S1C) and crossed with a Flp‐Cre deleter line (Birling et al. 2012). PCR genotyping confirmed the generation of the KO allele. Het mice were crossed to generate homozygotes, and the autosomal recessive nature of the heterotopia phenotype was confirmed (Croquelois et al. 2009).
Postnatal lethality in a proportion of Eml1 homozygous KO mice
Generating 235 animals with a het‐by‐het breeding scheme, at 3 weeks of age (weaning), mouse survival was estimated at 79% and 185 animals were genotyped. We obtained 51% het, 29% WT and 20% hom, suggesting a possible lethality of a proportion of Eml1 homozygous mice (25% expected). Of 19 homozygote juvenile/adult females, seven were sacrificed for dissection or died for other reasons, e.g. aged between 28 and 44 weeks. The remaining 12 (63.1%) died earlier at an average age of 11 weeks (range 7–25 weeks), with at least three mice suffering from hydrocephalus. Of 16 homozygote juvenile/adult females, six were sacrificed for dissection or died for other reasons, e.g. aged between 20 and 28 weeks. The remaining 10 (62.5%) died earlier at an average age of 9.4 weeks (range 4–26 weeks), with at least two mice known to suffer from hydrocephalus. Thus, male and female Eml1 KO mice seemed relatively equally affected by the lethality, and severe hydrocephalus was noted in certain individuals (see also below). A small proportion of Eml1 het mice (10%) also died between 5 and 16 weeks of age. Blood hematology and blood chemistry analyses at 7 weeks of age showed no major differences between WT and KO mice (data not shown).
Identification of defects in Eml1 KO mice, including double cortex, corpus callosum agenesis, abnormal hippocampus and hydrocephalus
We examined the brain anatomy of Eml1 homozygous mice at 7 weeks of age, both in males and females, using a platform for the parasagittal histo‐phenotyping of the mouse brain (Collins et al. 2018). Slide scans down to cell level resolution (Fig. S2A) were used to quantify 40 brain parameters across 22 distinct brain structures (Table S1 and Fig. S2B) from a single sagittal brain section at Lateral + 0.60 mm. This quantification was blind to the genotype. To minimize environmental and genetic variation, mice were analyzed according to their gender, aged exactly 7 weeks, and bred on the same genetic background (B6N).
Severe brain anomalies were found and are summarized in Fig. 1A. As previously reported in an Eml1‐spontaneous mouse mutant (Croquelois et al. 2009; Kielar et al. 2014), underneath a homotopic thinner cortex, a massive heterotopia surrounded by fiber tracts formed a double cortex (Fig. 1B). Considering analyses testing at least three mice per genotype, other neuroanatomical defects included cell dispersion in the CA3 region of the hippocampus (Fig. 1B), an enlarged area of the hippocampal pyramidal cell layer (+122%, P = 0.01 for male compared with +45%, P = 0.37 for female Eml1−/− mice; Fig. 1B), together with increased area of the dorsal subiculum (+170%, P = 0.006 for male compared to +89%, P = 0.12 for female Eml1−/− mice; Fig. 1B). The commissures were also affected, showing corpus callosum agenesis (5/5 affected for Eml1−/− males compared with 2/4 affected for Eml1−/− females), a smaller area of the anterior commissure (−27%, P = 0.015 for male Eml1−/− mice) and an enlargement of the lateral ventricles (+266%, P = 0.046 for male and +136%, P = 0.12 for female Eml1−/− mice). Some variability in female phenotypes may explain why the significance threshold of 0.05 was never reached despite the large effect size (Fig. 1A). It is, however, important to note that males and females shared a very similar phenotypic profile.
Figure 1.
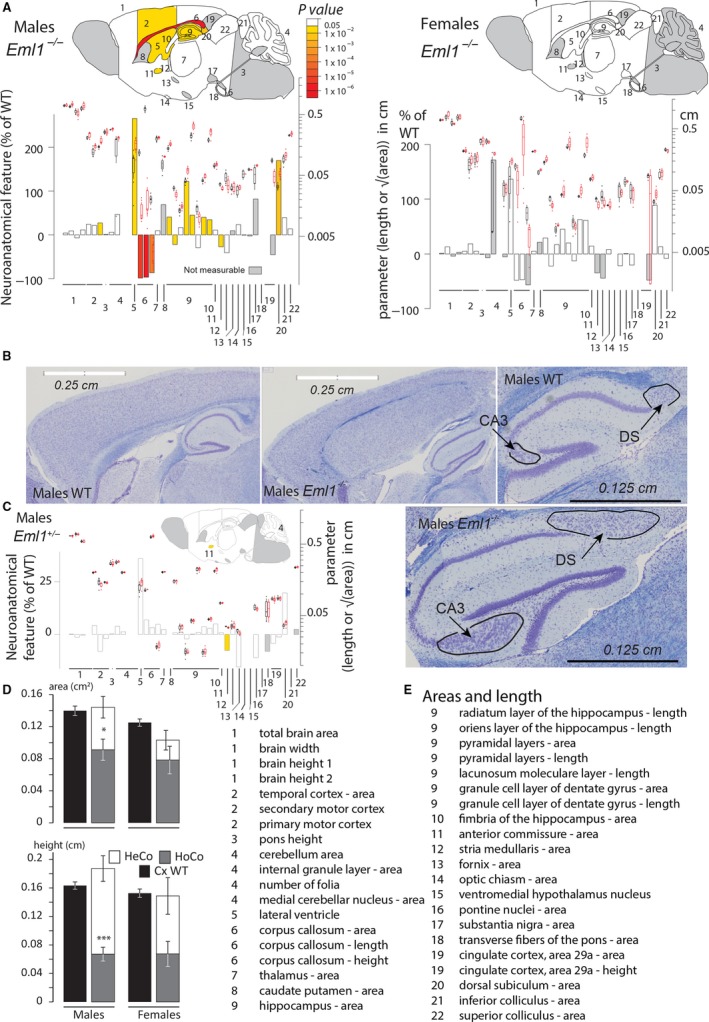
Juvenile Eml1 KO mouse shows a giant subcortical band heterotopia, abnormal hippocampus, hydrocephalus and corpus callosum agenesis. (A) Schematic representation of affected brain regions in Eml1−/− male (left) and female (right) mice at 7 weeks of age plotted in sagittal planes according to P‐values. The top image represents a section at Lateral +0.60 mm. The color map indicates P‐values below the threshold of 0.05, whereas gray indicates parameters for which statistics could not be computed (sample size below 3) and white indicates non‐significance. Histograms show the percentage decreased (minus scale) or increased (plus scale) of measured brain regions as compared with the controls (0%). They are combined with box plots displaying the median with interquartile range. Each point represents an animal. Certain data remain preliminary given that less than three male mice for one or both genotypes were compared for the following areas: medial cerebellar nucleus, caudate‐putamen, optic chiasm, ventromedial hypothalamus nucleus, substantia nigra, fornix, pontine nuclei, transverse fibers of the pons, cingulate cortex area and cingulate cortex height, and less than three females were compared for the following areas: total brain, brain height, temporal cortex, pons height, cerebellum, internal granule layer, medial cerebellar nucleus, corpus callosum height, caudate‐putamen, anterior commissure, stria medullaris, substantia nigra, optic chiasm, transverse fibers of the pons, cingulate cortex and cingulate cortex height. (B) Nissl‐stained sagittal brain sections from Eml1−/− mouse, showing a giant band of subcortical heterotopic neurons, dispersed neurons in the CA3 layer of the hippocampus and enlarged dorsal subiculum (indicated by black arrows). (C) Schematic representation of brain regions in Eml1+/− male mice at 7 weeks of age plotted in sagittal planes according to P‐values. Data concerning the following areas remain preliminary given the lower numbers of animals (i.e. less than three): caudate‐putamen, optic chiasm, ventromedial hypothalamus nucleus, pontine nuclei, substantia nigra, transverse fibers of the pons, inferior colliculus, superior colliculus, and brain height. (D) Characterization of the heterotopic cortex (HeCo) as well as the homotopic cortex (HoCo) in Eml1−/− male and female mice (n = 2 for Eml1−/− female mice). The description of the parameters used is provided in Fig. S2C. Plots are represented as mean ± SEM. *P < 0.05, **P < 0.005, ***P < 0.005 (Student t‐test, two‐tailed) for the comparison between HoCo and Cx (normal cortex in WT). (E) Details of brain regions assessed in order of appearance in (A) together with corresponding numbers.
In addition, we examined the brain anatomy of male Eml1 het mice at 7 weeks of age using the same approach. We were unable to detect any major differences between the brain anatomy of Eml1 het mice and that of their age matched controls (Fig. 1C), although a decrease of 8% in the size of the anterior commissure was observed after the analysis of two mice for each genotype.
The cortical heterotopia is associated with corpus callosum agenesis and hippocampal defects, but not with hydrocephalus
In two Eml1−/− female mice (of four assessed), we did not see the subcortical heterotopia or the corpus callosum agenesis and hippocampal‐related phenotypes despite the presence of the hydrocephalus. Similarly, in one Eml1−/− male mice (of five tested), the heterotopia, corpus callosum agenesis and hippocampal‐related phenotypes were segregated, but without the enlarged ventricles. Together, these results suggest that the underlying biological mechanisms leading to heterotopia, corpus callosum agenesis and hippocampal defects might be shared and may be independent of the enlarged ventricle phenotype.
To characterize further the heterotopia phenotype, we quantified seven additional parameters (illustrated in Fig. S2C). We analyzed the normal cortex in WT mice and its corresponding homotopic cortex (HoCo) as well as the heterotopic cortex (HeCo) in Eml1 hom mice that exhibited the heterotopia phenotype. The area and the height of the homotopic cortices were reduced in male Eml1 hom mice (area: −34.8%, P = 0.0078; height: −58.9%, P = 3.19E‐05, Fig. 1D), when compared with the normal total cortex (Fig. 1D). Analysis of two female mice with heterotopia revealed potentially similar results (area: −37.4%; height: −55.9% compared with WT, Fig. 1D). The combined height of HeCo and HoCo remained the same in male and female Eml1 hom mice; however, their combined area appeared moderately smaller in two female Eml1 hom mice (−17.6%, Fig. 1D).
The hydrocephalus phenotype is visible at postnatal day 13 (P13)
Next, we assessed neuroanatomical defects in Eml1 hom mice at P13, in both males and females using the same platform as the one used for the parasagittal histo‐phenotyping of the adult mouse brain (Fig. S2B). In line with the adult data, when comparing at least three mice for each condition, similar neuroanatomical defects were also seen at P13 in both male and female KOs (Fig. 2A): a massive heterotopia surrounded by fiber tracts and cell dispersion in the CA3 layer of the hippocampus. An enlarged size of the ventricles was observed in male KOs (Fig. 2B), and a similar tendency when analyzing n = 2 females. An increased area of the dorsal subiculum was also observed in three females, with a similar tendency in two males. In one Eml1−/− female mouse, the heterotopia, corpus callosum agenesis and hippocampal‐related phenotypes were not segregated with enlarged ventricles, further suggesting that these neuroanatomical anomalies are likely to be unrelated. We also analyzed the normal cortex in WT mice and its corresponding homotopic cortex (HoCo) as well as the heterotopic cortex (HeCo) in Eml1−/− mice. In a manner similar to adult mice, there was a tendency towards a reduced area and the height of the homotopic cortices both in male and female Eml1−/− mice when compared with the normal total cortex (Fig. 2C). There was also a tendency towards a decreased area of the combined area of HeCo and HoCo both in male and female mice; however, their combined height seemed to be enlarged compared with matched controls (Fig. 2C).
Figure 2.
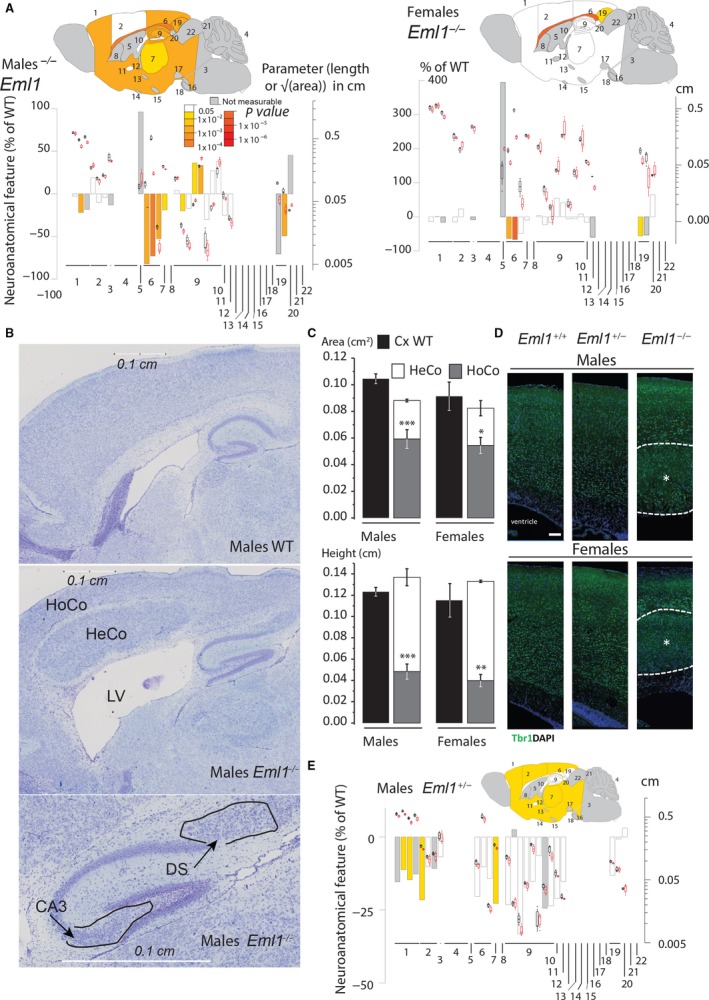
Eml1 KO mice show similar defects at postnatal day 13. (A) Schematic representation of affected brain regions in Eml1−/− male (left) and female (right) mice at P13 plotted in sagittal planes according to P‐values. The top image represents a section at Lateral +0.60 mm. The color map indicates P‐value below the threshold of 0.05 and gray indicates parameters where the number (n) was too low to perform statistics. Histograms show the percentage decreased (minus scale) or increased (plus scale) of measured brain regions as compared with the controls (0%). They are combined with box plots displaying the median with interquartile range. Each point represents an animal. Certain data remain preliminary given that fewer than three male mice for one or both genotypes were compared for the following areas: total brain, cerebellum, internal granular layer, medial cerebellar nucleus, lateral ventricle, caudate‐putamen, stria medullaris, fornix, optic chiasm, ventromedial hypothalamus nucleus, pontine nuclei, substantia nigra, transverse fibers of the pons, cingulate cortex, dorsal subiculum, inferior colliculus, superior colliculus, brain height and pons height, and fewer than three females were compared for the following areas: temporal cortex, cerebellum, internal granular layer, medial cerebellar nucleus, lateral ventricle, caudate‐putamen, anterior commissure, stria medullaris, fornix, optic chiasm, ventromedial hypothalamus nucleus, pontine nuclei, substantia nigra, transverse fibers of the pons, inferior colliculus, superior colliculus, brain height, primary motor cortex height and cingulate cortex height. (B) Nissl‐stained sagittal brain sections from Eml1−/− mouse showing a giant band of subcortical heterotopic neurons, dispersed neurons in the CA3 layer of the hippocampus and enlarged dorsal subiculum. (C) Characterization of the heterotopic cortex (HeCo) as well as the homotopic cortex (HoCo) in Eml1−/− male and female mice. Plots are represented as mean ± SEM. *P < 0.05, **P < 0.005, ***P < 0.005 (Student t test, two‐tailed) for the comparison of HoCo and Cx (normal cortex in WT). (D) Immunostainings for Tbr1 at P13 in male and female WT, het and hom mice. Tbr1 (green) and DAPI (blue). White dashed lines delineate the heterotopia (*). Scale bar: 100 μm. (E) Schematic representation of brain regions in Eml1+/− male mice at P13 plotted in sagittal planes according to P‐values. Histograms and box plots illustrate the results as described for A. Data concerning the following areas remain preliminary given n < 3 numbers for one or both genotypes: total brain, cerebellum, internal granular layer, medial cerebellar nucleus, lateral ventricle, caudate‐putamen, dentate gyrus, stria medullaris, fornix, optic chiasm, ventromedial hypothalamus nucleus, pontine nuclei, substantia nigra, transverse fibers of the pons, cingulate cortex, dorsal subiculum, inferior colliculus, superior colliculus, as well as the following length/height parameters: total brain height, primary motor cortex length, radiatum layer of the hippocampus length and pons height.
To shed further light on the identity of the cells composing the heterotopia, we performed immunostainings for Tbr1 in male and female WT, het and hom (all n = 3) mice (Fig. 2D). Although Tbr1 is expressed in diverse populations of cortical neurons, it is highly expressed in deep layers of the cortical plate (Molyneaux et al. 2007), serving as a marker of the latter. We observed that highly expressing Tbr1+ neurons are localized in deep layers of the WT and het cortices, as well as in the normotopic cortex of Eml1 KO mice. As previously reported for the Eml1‐spontaneous mouse mutant (Croquelois et al. 2009), Tbr1+ neurons are mostly absent from the heterotopia. However, we observed some sparse cells positive for Tbr1, suggesting that even if most of the heterotopia is composed of upper‐layer neurons, a very small population of deep‐layer neurons are also arrested beneath the homotopic cortex.
Embryonic origins of the brain anomalies: analysis at E18.5
The time scale of neuroanatomical defects was further investigated through a similar morphological screen at E18.5. In keeping with the adult brain screen, we assessed 39 brain parameters (listed in Table S2 and schematized in Fig. S3B) distributed across 11 distinct brain regions of the developing brain (cortical layers, hippocampus, thalamus, basal ganglia, fiber tracts, cerebellum, pons, ventricle, forebrain and midbrain).
In line with the adult and P13 data, major neuroanatomical defects were identified at E18.5 in both male and female KO mice (summarized in Fig. 3A). Most of the assessed parameters pertaining to the cortical wall (Cxne, neuroepithelial ventricular zone; SubVCx, subventricular zone; ICx, intermediate zone; higher CxP, superficial cortical plate) appeared decreased in size compared with matched WT brains. For example, the superficial CxP was smaller (−64.8%, P = 0.0009 for male and −62.0%, P = 0.0013 for female Eml1−/− mice, Fig. 3A). The deep cortical plate (CxP) area also showed a similar reduction of 79.4% (P = 0.001) in male Eml1 hom, and 78.9% when analyzing two females. Remarkably, the areas of both the ventricular and subventricular zones (Cxne and SubVCx, respectively) were also smaller in males Eml1−/− mice (Cxne: −50.0%, P = 0.006, SubVCx: −66.4%, P = 0.0002, Fig. 3A). A similar tendency was observed in females. Unexpectedly, the lateral ventricles were smaller in size in male Eml1−/− mice (by 88.6%, P = 0.0016, Fig. 3A). This trend was potentially mimicked in female Eml1−/− mice (n = 2, smaller by 84.3%). This suggests that the hydrocephalus phenotype seen at 7 weeks of age is likely to originate from postnatal stages onwards, further supporting the hypothesis that independent mechanisms may be responsible for the different phenotypes observed (i.e. cortical anomalies vs. hydrocephalus). The height of the cingulate cortex was reduced by 60.6% (P = 0.0009) in male and by 39.5% (P = 0.05) in female Eml1 hom mice (Fig. 3A). In contrast, some parameters were gender‐specific. For example, the apparent length of the pyramidal layer of the hippocampus was enlarged by 28.1% (P = 0.0033) in male Eml1−/− mice, indicating that the hippocampal anomalies seen at 7 weeks of age might start in embryonic stages (Fig. 3A). The size of the anterior commissure appeared smaller in the two female Eml1−/− mice analyzed (−13.7%).
Figure 3.
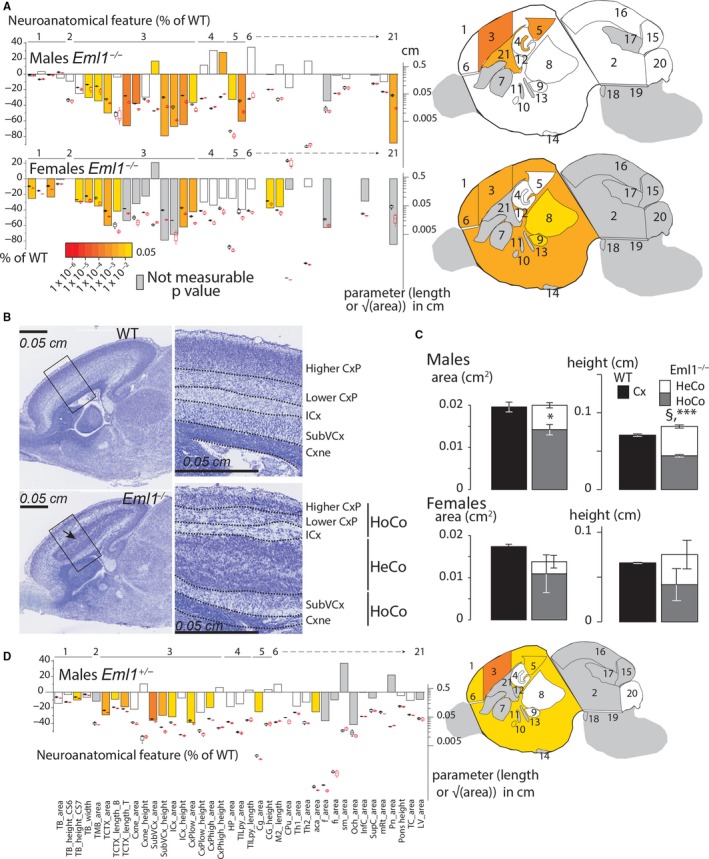
Late embryonic Eml1 KO mouse exhibits subcortical band heterotopia but not enlarged ventricle size. (A) Histograms comparing E18.5 male and female Eml1−/− with matched WT, showing variation (decreased‐minus scale or increased‐positive scale) in areas and lengths expressed as percentage of WT together with a color map indicating the significance level. They are combined with box plots displaying the median with interquartile range. Each point represents an animal. Certain data remain preliminary given that fewer than three male mice for one or both genotypes were compared for the following areas: caudate‐putamen, fornix, stria medullaris, optic chiasm, pontine nuclei and pons height, and fewer than three females were compared for the following areas: total midbrain, subventricular cortex, intermediate cortex, lower cortical plate, caudate‐putamen, anterior commissure, fornix, stria medullaris, optic chiasm, inferior colliculus, superior colliculus, mesencephalic reticular formation, pontine nuclei, cerebellum, lateral ventricles, total brain height, subventricular cortex height, intermediate cortex height, lower cortical plate height and pons height (left panel). A schematic representation of a section at Lateral +0.60 mm with the colored regions indicating the presence of at least one significant parameter within the brain region (right panel). White coloring indicates a P‐value > 0.05 and gray shows not enough data to calculate a P‐value. (B) Representative Nissl‐stained sagittal brain sections from E18.5 Eml1−/− mouse (bottom panels) showing a giant band of subcortical heterotopic neurons (black arrow), compared with a WT section (top panels). (C) Characterization of the size and the average thickness of the homotopic (HoCo) and the heterotopic (HeCo) cortices in E18.5 Eml1−/− male mice (top panels) and E18.5 EML1−/− female mice (bottom panels). The description of the parameters used is provided in Fig. S3B. Plots are represented as mean ± SEM. *P < 0.05, **P < 0.005, ***P < 0.005 (Student t test, two‐tailed) for the comparison of HoCo and Cx (normal cortex in WT), and §P < 0.05 for the comparison of HoCo+HeCo and Cx. (D) Histograms and box plots comparing E18.5 male Eml1+/− with matched WT as described for (A). A schematic representation of a section at Lateral +0.60 mm with the colored regions indicating the presence of at least one significant parameter within the brain region (right panel). White coloring indicates a P‐value > 0.05 and gray shows not enough data to calculate a P‐value. Data concerning the following areas remain preliminary given the low numbers (i.e. n < 3): total midbrain, caudate‐putamen, fornix, fimbria, stria medullaris, optic chiasm, inferior colliculus, superior colliculus, mesencephalic reticular formation, pontine nucleus and lateral ventricles.
Characterization of the cortical heterotopia at E18.5
The band heterotopia (HeCo) was clearly visible and appeared to be interposed between the ICx and SubVCx zones of the developing cortex (Fig. 3B). The position and the general presentation of this subcortical heterotopia were consistent between the mice; however, its size varied more in female than in male Eml1−/− mice. To characterize the E18.5 heterotopia phenotype, we used the quantification of the same seven parameters as in adult and P13 mice which we adapted for embryonic stages (Fig. S3C), and analyzed cortices in Eml1 hom mice. The area and the height of the homotopic cortex were smaller in male Eml1−/− mice (area: −27.5%, P = 0.034; height: −37.8%, P = 0.0002) when compared with the normal total cortex (Fig. 3C). Similar trends were observed for females (n = 2, area −37.0%; height, −37.1%). The combined area of HeCo and HoCo was either similar (male mice) or potentially smaller in female Eml1−/− mice compared with matched WT brains (n = 2, −20.6%). However, the thickness (height) of the combined HeCo and HoCo was moderately larger in male Eml1−/− mice (+16.2%, P = 0.008, Fig. 3C), with a similar trend in females (n = 2, +13.0%).
These results suggest severe morphological anomalies in both male and female Eml1 hom mice. The origins of these anomalies are observed during embryonic development. The main anomalies pertained to the neocortex, with the presence of a massive subcortical band heterotopia. Milder to moderate defects were also identified in other brain regions.
Absence of cortical heterotopia in Eml1 het mice but brain size defects
Next, we studied neuroanatomical features in both male and female Eml1 het mice and confirmed the recessive transmission of the heterotopic cortex (Croquelois et al. 2009) since we did not see a single occurrence of heterotopia in the het state. However, we observed some brain size defects in male Eml1 het mice at both P13 and E18.5 stages (for male: Figs 2E and 3D; for female: Fig. S4A,B). These anomalies may be more apparent in male mice due to the possible higher variation of phenotypic traits in females. The average effect size for significant brain parameters in male Eml1 het mice (n = 3) was approximately half the size of the Eml1 hom mice. For example, the deep CxP area was reduced by 39.1% (P = 0.02) in male Eml1+/− E18.5 mice (compared with a reduction of 79.4% in male Eml1 hom mice), together with a smaller SubVCx of −36.3% (P = 0.0004), as compared with −66.4% (P = 0.0002) in male Eml1 hom mice. This may suggest a gene dosage effect of Eml1 on certain aspects of developmental brain anatomy. Taken together, these results suggest a role for Eml1 in the regulation of brain size in a dosage‐dependent manner.
Ectopic RG progenitors in Eml1 KO mice at early stages of corticogenesis
Although heterotopia often arises because of aberrant neuronal migration, abnormalities in progenitor cells have also been associated with this cortical malformation (Bizzotto & Francis, 2015). In the spontaneous Eml1 mouse mutant, cycling progenitors were found outside the germinal layers, in basal regions of the cortical wall (Kielar et al. 2014; Bizzotto et al. 2017). These progenitors were often Pax6+, a marker of RGs, which are physiologically located in the neuroepithelial ventricular zone (Cxne). RGs are the main progenitor cells in the developing cortex, responsible for the production of other progenitor types and therefore the final neuronal output. Their apical processes extending to the ventricular surface (VS) are characterized by the presence of an adherens junction–actin belt, which allows cell–cell interactions. Throughout the cell cycle, RG nuclei oscillate between the basal and apical‐most region of the VZ, a process known as interkinetic nuclear migration. Basally, they undergo S‐phase; mitosis takes place apically (Taverna et al. 2014; Uzquiano et al. 2018).
We assessed the location of cycling and Pax6+ progenitors at early stages of corticogenesis (E13.5). First, we analyzed the distribution of Ki67+ (a marker of proliferative cells), BrdU+ (incorporated during S‐phase) cells in E13.5 cortices subjected to a 30‐min BrdU pulse. To assess cell distribution, ROIs were divided into six equal‐size bins across the cortical wall (Fig. 4A, top row, right panel). No major differences were observed between WT and het conditions, where Ki67+BrdU+ cells were mainly localized in basal regions of the Cxne as expected (bins 3 and 4, Fig. 4A,C). Hom mice (n = 5) showed a significant increase in the percentage of Ki67+BrdU+ cells present in the SubVCx/ICx/CxP (bins 5 and 6) as well as in the apical‐most Cxne (bin 1). Accordingly, there was a significant decrease in the percentage of cells expressing these markers in the most basal regions of the Cxne (Fig. 4A,C). These data show the presence of aberrantly positioned cycling neuronal progenitors in Eml1 KO cortices.
Figure 4.
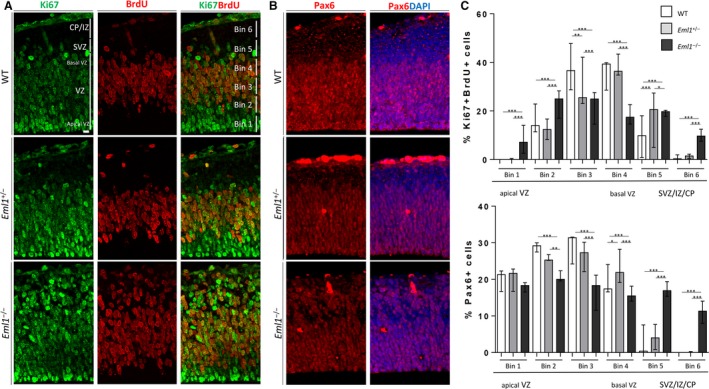
Eml1 KO mice show ectopic progenitors at early stages of corticogenesis. (A) Representative images of WT (top row), het (middle row) and hom (bottom row) cortices at E13.5, immunostained for Ki67 (green) and BrdU (red) after a 30‐min pulse of the latter. The regions of the developing cortical wall are indicated in the first image of the top row (WT). An example of the binning procedure is shown in the last image of the top row (WT). (B) Representative images of WT (top row), het (middle row) and hom (bottom row) cortices at E13.5, immunostained for Pax6 (red) and Hoechst (blue). (C) Quantification of percentage of Ki67+BrdU+ cells present in each of the six bins. (D) Quantification of percentage of Pax6+ cells present in each of the six bins. Bins 1–4 span the ventricular zone (Cxne or VZ). Bins 5–6 span the subventricular zone (SVZ or SubVCx), intermediate zone (IZ or ICx) and cortical plate (CP or CxP). Scale bar: 10 μm. The median is represented and the error bars represent the minimum and maximum range. *P < 0.05, **P < 0.001,***P < 0.001.
To assess the identity of aberrantly localized progenitors, we performed the same type of analyses with the RG marker Pax6. Although the vast majority of Pax6+ cells were localized in the Cxne in WT and het mice, a significant proportion of Pax6+ cells were shifted towards more basal positions (SubVCx/ICx/CxP, bins 5 and 6) in hom developing cortices (Fig. 4B,D). Therefore, our immunohistochemistry analyses at early stages of cortical development show the presence of ectopic Pax6+ and cycling progenitors.
Mouse mutants showing ectopically located Pax6+ progenitors can show disruption of the adherens junction–actin belt delineating the VS (Junghans et al. 2005; Cappello et al. 2006, 2012; Kadowaki et al. 2007; Gan et al. 2014; Gil‐Sanz et al. 2014; Schmid et al. 2014). We performed immunostainings for N‐cadherin and F‐actin, both markers for this belt. We confirm that no major changes were observed in Eml1 KO mice when compared with WT mice (Fig. S4C). Similar results were obtained previously for the spontaneous Eml1 mouse mutant (Kielar et al. 2014), suggesting that other primary mechanisms are likely responsible for the presence of ectopic Pax6+ progenitors in Eml1 mouse mutants.
Discussion
A previous study described neuroanatomical defects in a spontaneous mouse mutant of Eml1 (Croquelois et al. 2009), a gene encoding a microtubule‐associated protein, as a result of a retrotransposon insertion in the intron lying between exons 22 and 23 (Kielar et al. 2014). In this study, we analyzed the brain morphology of a new KO mouse model of Eml1, analyzing heterozygotes as well as homozygotes, and males as well as females. Overall, the anomalies we identified appeared more severe than the ones previously reported by spontaneous mutation on the NOR‐CD1 genetic background (Croquelois et al. 2009). For example, the thickness of the homotopic cortex was reduced in the KO model in young adult and P13 animals (Figs 1D and 2C), whereas it did not reach significance in the previously published spontaneous model (Croquelois et al. 2009). The combined thickness of the homotopic and heterotopic cortices was either unchanged or only moderately larger in our study (Figs 1D, 2C and 3C) but was much larger in the previous report (Croquelois et al. 2009). Another example includes the subcortical band heterotopia that we detected at E18.5, whereas in the published spontaneous model, at a similar embryonic age, an increase of the intermediate zone of the cortex was described but not visibly the heterotopia (Croquelois et al. 2009). It should be noted, however, that Croquelois et al. mentioned in their study that a proportion of animals were observed with severer phenotypes. Of note, in our study we mainly analyzed single hemispheres, but in cases where both hemispheres were analyzed (e.g. P13), the heterotopia was observed bilaterally.
Our results at early stages of corticogenesis (Fig. 4) show similar results to those observed in the spontaneous Eml1 mouse mutant (Kielar et al. 2014). In Eml1 KO cortices we also observe the presence of ectopic cycling neuronal progenitors, further supporting this progenitor displacement as the original defect leading to the heterotopia phenotype in Eml1‐mutant conditions. The heterotopia develops from this point on, with accumulating neurons in the ICx, at the expense of those in the CxP.
The neuroanatomical anomalies we identified may point to a possible sexual dimorphism. Although male and female mice appeared to share similar phenotypes, variability in the female group, which also apparently included individuals without heterotopia, suggests a more complex pattern of inheritance. Indeed, in two Eml1 hom young adult females, the subcortical band heterotopia was completely absent, and in E18.5 females (n = 2 analyzed), the size of the subcortical band heterotopia seemed to be more heterogeneous than in males. Although we do not rule out that heterotopia may be smaller or unilateral, overall, the phenotypes seem different in males. The reasons for potential male–female differences remain unclear but may reflect the genetic background used, possibly involving modifier genes and/or hormones, leading to a less severe brain phenotype in females. Interestingly, as well, at E18.5 and P13, subtle brain size defects may exist only in male heterozygotes. However, few heterozygote defects were detected at 7 weeks of age, which may suggest that these developmental anomalies represent delayed processes that catch up over time. However, caution is also still required in drawing conclusions, since sampling may be insufficient to capture the full picture of interindividual and inter‐litter variations.
Our morphological screen of the KO on this genetic background allowed us to associate Eml1 function with spatially distinct brain defects, suggesting a role for the Eml1 gene in the overall architecture of the brain. This is consistent with the wider expression pattern of Eml1 in different types of neuronal progenitors and post mitotic neurons during development (Kielar et al. 2014). Although no defects were reported in the spontaneous model of Eml1 in structures such as the hippocampus, the striatum, the thalamus and the cerebellum (Kielar et al. 2014), we found perturbations in the KO including corpus callosum agenesis and hydrocephalus, as well as in the organization and/or size of hippocampal regions, at embryonic, postnatal and adult stages. Interestingly, the BXD29 mouse model for subcortical heterotopia shows ectopic clusters of neurons in CA1 and the dentate gyrus (Ramos et al. 2016). Additionally, other mouse mutants for genes mutated in severe forms of human heterotopia (Dcx, Lis1, Tuba1a) (Gleeson et al. 1998; des Portes et al. 1998; Barkovich et al. 2012) also show a heterotopia‐like phenotype in the hippocampus in the form of a ‘double‐layer’ in the CA3 region (Hirotsune et al. 1998; Corbo et al. 2002; Kappeler et al. 2007; Keays et al. 2007). It is thus of interest that CA3 cell dispersion was detected in the Eml1 KO model, and future work involving serial sections across the brain will attempt to confirm this phenotype.
Related to the hydrocephalus phenotype here described, a mild ventricular enlargement was previously reported in the HeCo mouse (Croquelois et al. 2009). Additionally, two of three EML1‐mutation families present hydrocephalus (Kielar et al. 2014; Shaheen et al. 2017). Further studies of Eml1 hom mice at postnatal stages may help unravel the underlying pathological mechanisms resulting in the hydrocephalus. Additionally, further postnatal studies are required to investigate causes of death of Eml1 hom mice and their relationships with brain morphology.
Rodent models of heterotopia, originally thought to be quite rare, are now becoming available to provide further information on how heterotopia form and disrupt neuronal function (reviewed in Bizzotto & Francis, 2015; Stouffer et al. 2016). This new constitutive KO, finely characterized here, is a valuable tool to contribute further to this domain.
Conflict of interest
None declared.
Funding
A.U. and F.F. are associated with the BioPsy Labex project and the Ecole des Neurosciences de Paris Ile‐de‐France (ENP) network. Our labs are supported by Inserm, Centre national de la recherche scientifique (CNRS), SU, French Agence National de la Recherche (ANR‐13‐BSV4‐0008‐01; ANR‐16‐CE16‐0011‐03), Fondation Bettencourt Schueller, the European Union (EU‐ HEALTH‐2013, DESIRE, No 60253) the JTC 2015 Neurodevelopmental Disorders, the ANR (for NEURON8‐Full‐ 815‐006 STEM‐MCD), the Fondation Maladies Rares/Phenomin (project IR4995) and the European Cooperation on Science and Technology (COST Action CA16118) to F.F. B.Y. is supported by a French State fund grant (ANR‐10‐LABX‐0030‐INRT), managed by the Agence Nationale de la Recherche under the frame program Investissements d'Avenir ANR‐10‐IDEX‐0002‐02. A.U. received an ENP PhD grant, a Company of Biologists travel grant, and was awarded a Valérie Chamaillard prize by the Fondation de France (ranked by the FFRE). This study received support from French state funds through the ANR under the frame programme Investissements d'Avenir labelled ANR‐10‐INBS‐07 PHENOMIN.
Supporting information
Table S1. Description of the 166 variables for adult brain sagittal analysis at Lateral 600 μm (right hemisphere).
Table S2. List of 39 variables for brain sagittal analysis at E18.5 Lateral 600 μm (right hemisphere).
Fig. S1. Eml1 KO strategy.
Fig. S2. Adult screen. Resolution and adult mouse brain atlas.
Fig. S3. Embryonic screen (E18.5). Resolution and E18.5 mouse brain atlas.
Fig. S4. Schematic representation of brain regions in Eml1+/− female mice at P13 (A) and E18.5 (B). Eml1 KO mice do not show major disruptions in the adherens junction–actin belt at E13.5 (C).
Acknowledgements
We are grateful to the French Fondation Maladies Rares for agreeing to fund this project. We would like to thank the Genetic Engineering and Model Validation Department at the ICS for generating the mouse model; the animal care‐takers of the PHENOMIN‐ICS animal facility for their technical assistance with mouse care. We would like to thank the Imaging Platform at the Institut du Fer à Moulin, Paris, as well as Dr. Marika‐Nosten Bertrand for advice with statistical analyses. Finally we would like to thank Patrick Reilly, Yann Herault and Tania Sorg from the ICS.
Contributor Information
Binnaz Yalcin, Email: yalcin@igbmc.fr.
Fiona Francis, Email: fiona.francis@inserm.fr.
References
- Bahi‐Buisson N, Souville I, Fourniol FJ, et al. (2013) New insights into genotype‐phenotype correlations for the doublecortin‐related lissencephaly spectrum. Brain 136(Pt 1), 223–244. [DOI] [PMC free article] [PubMed] [Google Scholar]
- Barkovich AJ, Guerrini R, Kuzniecky RI, et al. (2012) A developmental and genetic classification for malformations of cortical development: update 2012. Brain 135, 1348–1369. [DOI] [PMC free article] [PubMed] [Google Scholar]
- Beattie R, Postiglione MP, Burnett LE, et al. (2017) Mosaic analysis with double markers reveals distinct sequential functions of Lgl1 in neural stem cells. Neuron 94, 517–533.e513. [DOI] [PubMed] [Google Scholar]
- Birling MC, Dierich A, Jacquot S, et al. (2012) Highly‐efficient, fluorescent, locus directed cre and FlpO deleter mice on a pure C57BL/6N genetic background. Genesis 50, 482–489. [DOI] [PubMed] [Google Scholar]
- Bizzotto S, Francis F (2015) Morphological and functional aspects of progenitors perturbed in cortical malformations. Front Cell Neurosci 9, 30. [DOI] [PMC free article] [PubMed] [Google Scholar]
- Bizzotto S, Uzquiano A, Dingli F, et al. (2017) EML1 loss impairs apical progenitor spindle length and soma shape in the developing cortex. Sci Rep 7, 17308. [DOI] [PMC free article] [PubMed] [Google Scholar]
- Cappello S, Attardo A, Wu X, et al. (2006) The Rho‐GTPase cdc42 regulates neural progenitor fate at the apical surface. Nat Neurosci 9, 1099–1107. [DOI] [PubMed] [Google Scholar]
- Cappello S, Bohringer CR, Bergami M, et al. (2012) A radial glia‐specific role of RhoA in double cortex formation. Neuron 73, 911–924. [DOI] [PubMed] [Google Scholar]
- Collins S, Wagner C, Gagliardi L, et al. (2018) Benefits of using parasagittal over coronal sectioning for neuroanatomical quantification of the adult brain structure in the mouse. Curr Protoc Mouse Biol 8, e48. [DOI] [PubMed] [Google Scholar]
- Corbo JC, Deuel TA, Long JM, et al. (2002) Doublecortin is required in mice for lamination of the hippocampus but not the neocortex. J Neurosci 22, 7548–7557. [DOI] [PMC free article] [PubMed] [Google Scholar]
- Croquelois A, Giuliani F, Savary C, et al. (2009) Characterization of the HeCo mutant mouse: a new model of subcortical band heterotopia associated with seizures and behavioral deficits. Cereb Cortex 19, 563–575. [DOI] [PubMed] [Google Scholar]
- Farrell MA, DeRosa MJ, Curran JG, et al. (1992) Neuropathologic findings in cortical resections (including hemispherectomies) performed for the treatment of intractable childhood epilepsy. Acta Neuropathol 83, 246–259. [DOI] [PubMed] [Google Scholar]
- Gan Q, Lee A, Suzuki R, et al. (2014) Pax6 mediates ss‐catenin signaling for self‐renewal and neurogenesis by neocortical radial glial stem cells. Stem Cells 32, 45–58. [DOI] [PMC free article] [PubMed] [Google Scholar]
- Gil‐Sanz C, Landeira B, Ramos C, et al. (2014) Proliferative defects and formation of a double cortex in mice lacking Mltt4 and Cdh2 in the dorsal telencephalon. J Neurosci 34, 10475–10487. [DOI] [PMC free article] [PubMed] [Google Scholar]
- Gleeson JG, Allen KM, Fox JW, et al. (1998) Doublecortin, a brain‐specific gene mutated in human X‐linked lissencephaly and double cortex syndrome, encodes a putative signaling protein. Cell 92, 63–72. [DOI] [PubMed] [Google Scholar]
- Götz M, Huttner W (2005) The cell biology of neurogenesis. Nat Rev Cell Biol 6, 777–7888. [DOI] [PubMed] [Google Scholar]
- Guerrini R (2005) Genetic malformations of the cerebral cortex and epilepsy. Epilepsia 46(Suppl. 1), 32–37. [DOI] [PubMed] [Google Scholar]
- Hirotsune S, Fleck MW, Gambello MJ, et al. (1998) Graded reduction of Pafah1b1 (Lis1) activity results in neuronal migration defects and early embryonic lethality. Nat Genet 19, 333‐339. [DOI] [PubMed] [Google Scholar]
- Jossin Y, Lee M, Klezovitch O, et al. (2017) Llgl1 connects cell polarity with cell‐cell adhesion in embryonic neural stem cells. Dev Cell 41, 481–495.e485. [DOI] [PMC free article] [PubMed] [Google Scholar]
- Junghans D, Hack I, Frotscher M, et al. (2005) Beta‐catenin‐mediated cell‐adhesion is vital for embryonic forebrain development. Dev Dyn 233, 528–539. [DOI] [PubMed] [Google Scholar]
- Kadowaki M, Nakamura S, Machon O, et al. (2007) N‐cadherin mediates cortical organization in the mouse brain. Dev Biol 304, 22–33. [DOI] [PubMed] [Google Scholar]
- Kappeler C, Dhenain M, Phan Dinh Tuy F, et al. (2007) Magnetic resonance imaging and histological studies of corpus callosal and hippocampal abnormalities linked to doublecortin deficiency. J Comp Neurol 500, 239–254. [DOI] [PubMed] [Google Scholar]
- Keays DA, Tian G, Poirier K, et al. (2007) Mutations in alpha‐tubulin cause abnormal neuronal migration in mice and lissencephaly in humans. Cell 128, 45–57. [DOI] [PMC free article] [PubMed] [Google Scholar]
- Kielar M, Tuy FP, Bizzotto S, et al. (2014) Mutations in EML1 lead to ectopic progenitors and neuronal heterotopia in mouse and human. Nat Neurosci 17, 923–933. [DOI] [PubMed] [Google Scholar]
- Liu WA, Chen S, Li Z, et al. (2018) PARD3 dysfunction in conjunction with dynamic HIPPO signaling drives cortical enlargement with massive heterotopia. Genes Dev 32, 763–780. [DOI] [PMC free article] [PubMed] [Google Scholar]
- Matsuzaki F, Shitamukai A (2015) Cell division modes and cleavage planes of neural progenitors during mammalian cortical development. Cold Spring Harb Perspect Biol 7, a015719. [DOI] [PMC free article] [PubMed] [Google Scholar]
- Meencke HJ, Veith G (1992) Migration disturbances in epilepsy. Epilepsy Res Suppl 9, 31–40. [PubMed] [Google Scholar]
- Mikhaleva A, Kannan M, Wagner C, et al. (2016) Histomorphological phenotyping of the adult mouse brain. Curr Protoc Mouse Biol 6, 307–332. [DOI] [PubMed] [Google Scholar]
- Molyneaux B, Arlotta P, Menezes JR, et al. (2007) Neuronal subtype specification in the cerebral cortex. Nat Rev Neurosci 8, 427–437. [DOI] [PubMed] [Google Scholar]
- Palmer TD, Willhoite AR, Gage FG (2000) Vascular niche for adult hippocampal neurogenesis. J Comp Neurol 425, 479–494. [DOI] [PubMed] [Google Scholar]
- des Portes V, Francis F, Pinard JM, et al. (1998) Doublecortin is the major gene causing X‐linked subcortical laminar heterotopia (SCLH). Hum Mol Genet 7, 1063–1070. [DOI] [PubMed] [Google Scholar]
- Ramos RL, Toia AR, Pasternack DM, et al. (2016) Neuroanatomical characterization of the cellular and axonal architecture of subcortical band heterotopia in the BXD29‐Tlr4lps−2J/J mouse cortex. Neuroscience 337, 48–65. [DOI] [PubMed] [Google Scholar]
- Richards MW, O'Regan L, Roth D, et al. (2015) Microtubule association of EML proteins and the EML4‐ALK variant 3 oncoprotein require an N‐terminal trimerization domain. Biochem J 437, 529–536. [DOI] [PubMed] [Google Scholar]
- Romero DM, Bahi‐Buisson N, Francis F (2018) Genetics and mechanisms leading to human cortical malformations. Semin Cell Dev Biol 76, 33–75. [DOI] [PubMed] [Google Scholar]
- Schmid MT, Weinandy F, Wilsch‐Brauninger M, et al. (2014) The role of alpha‐E‐catenin in cerebral cortex development: radial glia specific effect on neuronal migration. Front Cell Neurosci 8, 215. [DOI] [PMC free article] [PubMed] [Google Scholar]
- Shaheen R, Sebai MA, Patel N, et al. (2017) The genetic landscape of familial congenital hydrocephalus. Ann Neurol 81, 890–897. [DOI] [PubMed] [Google Scholar]
- Stouffer MA, Golden JA, Francis F (2016) Neuronal migration disorders: focus on the cytoskeleton and epilepsy. Neurobiol Dis 92, 18–45. [DOI] [PMC free article] [PubMed] [Google Scholar]
- Taverna E, Gotz M, Huttner WB (2014) The cell biology of neurogenesis: toward an understanding of the development and evolution of the neocortex. Annu Rev Cell Dev Biol 30, 465–502. [DOI] [PubMed] [Google Scholar]
- Uzquiano A, Gladwyn‐Ng I, Nguyen L, et al. (2018) Cortical progenitor biology, cell cycling versus neurogenesis. J Neurochem 146, 500–525. [DOI] [PubMed] [Google Scholar]
Associated Data
This section collects any data citations, data availability statements, or supplementary materials included in this article.
Supplementary Materials
Table S1. Description of the 166 variables for adult brain sagittal analysis at Lateral 600 μm (right hemisphere).
Table S2. List of 39 variables for brain sagittal analysis at E18.5 Lateral 600 μm (right hemisphere).
Fig. S1. Eml1 KO strategy.
Fig. S2. Adult screen. Resolution and adult mouse brain atlas.
Fig. S3. Embryonic screen (E18.5). Resolution and E18.5 mouse brain atlas.
Fig. S4. Schematic representation of brain regions in Eml1+/− female mice at P13 (A) and E18.5 (B). Eml1 KO mice do not show major disruptions in the adherens junction–actin belt at E13.5 (C).