Abstract
Head and neck squamous cell carcinoma (HNSCC) is a common malignant disease with high mortality rates. Recently, long non-coding RNAs (lncRNAs) have been demonstrated to participate in a number of important biological functions and could serve as prognostic biomarkers in the field of oncology. Therefore, the present study aimed to identify an lncRNA-based model that was associated with prognosis. RNA-sequencing data was downloaded from The Cancer Genome Atlas and R software was used to analyze the data. Univariate analyses, robust likelihood analyses and multivariate analyses were performed to screen out key lncRNA candidates associated with prognosis and construct a risk model. A Kaplan-Meier plot was constructed for survival analysis. LncBase and Starbase were used to identify the miRNA and protein targets. Gene set enrichment analysis was used for functional analysis. As a result, a 4-lncRNA (ALMS1-IT1, RP11-359J14.2, CTB-178M22.2 and RP11-347C18.5) based risk model was identified and patients in the high-risk group were revealed to have a lower survival rate than patients in the low-risk group. A nomogram that could predict the survival of patients was plotted. A total of 79 target miRNAs and 61 target proteins were identified. The gene set enrichment analysis results revealed that nutrient metabolism pathways were enriched in the high-risk group and immune regulation pathways were enriched in the low-risk group. In summary, a 4-lncRNA based risk model was identified that was associated with prognosis, which may serve as a prognosis prediction biomarker for HNSCC.
Keywords: head and neck squamous cell carcinoma, The Cancer Genome Atlas, RNA-sequencing, long non-coding RNA, Kaplan-Meier, survival analysis
Introduction
Head and neck cancer include malignant tumors in the oral cavity, pharynx and throat. It is the sixth most common type of malignant tumor worldwide (1,2). In total, ~90% of these are squamous cell carcinoma, i.e., head and neck squamous cell carcinoma (HNSCC). The number of new cases of HNSCC diagnosed each year is >600,000 cases worldwide, with more than two-thirds of cases being reported in developing countries (1). The average age at diagnosis is ~60 years, and the incidence rate of males is significantly higher than that of females (3). At present, the preferred method of treatment for patients with HNSCC is the combination of surgical resection with radiotherapy, chemotherapy and biotherapy. The main objective of treatment is to preserve organs and organ functions as much as possible, but the majority of patients diagnosed during the late stages of HNSCC have a survival rate of <50% (1,4). The majority of HNSCCs are located in the superficial mucosa of the oral cavity and can be directly detected through a physical examination. During the actual process of diagnosis and treatment, the tumor is similar to other mucosal lesions, making early diagnosis difficult to be achieved (5). Therefore, the diagnosis and treatment of HNSCC remains to be the main focus of research, and identifying effective, specific indicators of HNSCC for early diagnosis and the assessment of patient prognosis is essential.
Non-coding RNAs (ncRNAs) are gaining increasing attention in the field of molecular mechanism research; they play an important role in the regulation of various biological processes (6,7). Researchers have divided ncRNAs into two groups: Short and long ncRNAs, according to the length of their nucleotide sequences (8,9). Long non-coding RNAs (lncRNAs) are RNAs that are >200 nucleotides in length. The majority of areas in the human genome do not encode for any proteins and will ultimately be transcribed into functional ncRNAs, which play important roles in physiological and pathological processes (10,11). It has been reported that lncRNAs are involved in a number of biological processes, including gene expression regulation, cell cycle regulation, transcription, translation, cell differentiation, nuclear cytoplasmic transportation and chromatin modification (6,7). There is evidence indicating that the abnormal expression of lncRNAs are involved in the development, diagnosis and prognosis of numerous different types of human cancer, including HNSCC (12–14). In addition, an increasing number of previous studies have identified that lncRNAs have a prognostic value for various different types of cancer, such as cervical cancer, colorectal cancer and lung cancer (15–17). Compared with microRNAs, mRNAs, alternative splicing, methylation and other biomarkers, lncRNAs add additional value for the prediction of prognosis in patients with cancer (18–22). However, the potential of using lncRNAs as a biomarker to predict the clinical outcomes and patient prognosis in HNSCC has not yet been fully investigated, and there are currently very few reports on it, to the best of our knowledge.
In the present study, HNSCC RNA sequencing (RNA-seq) data from The Cancer Genome Atlas (TCGA) database was utilized to identify features of lncRNAs that are associated with prognosis by dividing samples into training and testing groups. A 4-lncRNA based risk model was identified that was revealed to be significantly associated with survival time. The targets and functions of the 4 lncRNAs were also revealed. The present study constructed a powerful prognostic model for a risk assessment of patients with HNSCC, which could provide new biomarkers for HNSCC and may provide new insight into finding therapeutic targets for HNSCC.
Materials and methods
Data preparation
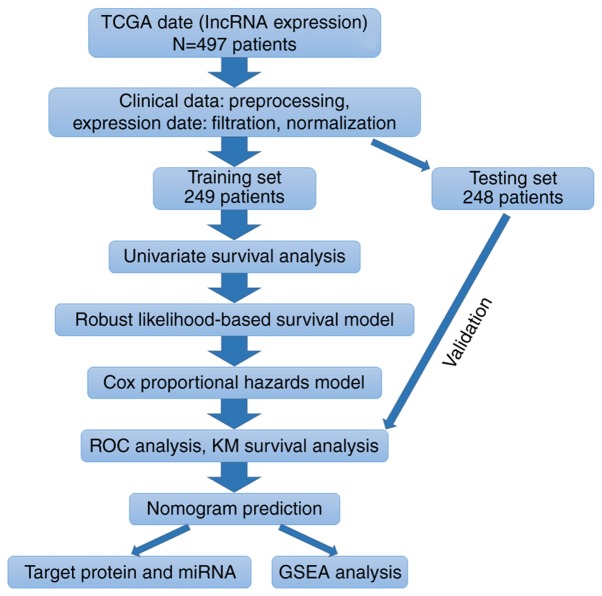
According to the flow chart (Fig. 1), HNSCC RNA-seq expression data and corresponding clinical follow-up information were obtained from the public database TCGA (www.cancergenome.nih.gov; project ID: TCGA-HNSC). The TCGA biolinks package of R (version 3.5.2; www.r-project.org/) software was used to download the data from TCGA. In total, the clinical information of 528 patients and RNA-seq expression data of 546 samples were available. After excluding certain samples (exclusion criteria: Normal tissue samples, samples without clinical follow-up information or incomplete follow-up information, samples that were repeated without corresponding RNA-seq data), a total of 14,461 lncRNA raw count expression data of 497 patients along with their clinical information were extracted for use in the present study. The raw counts of expression data were processed as follows: Filtration (keeping sample raw count of >1-50%), normalization (using the R package, edgeR; version 3.26.5; http://bioinf.wehi.edu.au/edgeR), and excluding low expression genes (sum of normalized counts per million <1), from which 5,408 lncRNAs were used for further analysis after preprocessing. Patients were further randomly assigned into a training and testing set by patient survival status (50%: 50%; training group: 249 and testing group: 248).
Figure 1.
Flow chart of the present study. Flow chart presenting the methods used to construct the 4-lncRNA based risk model and conduct a functional analysis. TCGA, The Cancer Genome Atlas; lncRNA, long non-coding RNA; ROC, receiver operating characteristic; KM, Kaplan-Meier; miRNA, microRNA; GSEA, gene set enrichment analysis.
Identification of prognosis-associated lncRNAs
The expression data and patient overall survival (OS) time were analyzed in the training set. The R package, Survival (version 2.44–1.1; http://github.com/therneau/survival), was used to perform the univariable cox regression analysis. The lncRNAs with a resulting P-value of <0.05 were considered to be statistically significant for OS and were defined as candidate lncRNAs. In order to select feasible and reliable clinical prognosis-associated candidate lncRNAs, a robust likelihood-based survival analysis was performed using the Rbsurv package (version 2.42.0; http://www.korea.ac.kr/~stat2242/) in R software. All samples from the training set were again randomly divided into a sub-training set with N × (1-p) samples and a sub-validation set with N × p samples, in which p=one third of the patients. Each candidate lncRNA of the training set was fitted into a univariable cox regression model in the training set and the corresponding estimated parameters were obtained. This procedure was repeated 10 times independently to obtain the 10 log-likelihood of each lncRNA. The best gene, g (1), was selected, which had the largest mean log-likelihood. The next best gene, with the second largest mean log-likelihood, was calculated using the two-gene model and the one with the largest mean log likelihood that was considered the most optimal was selected for analysis. This procedure was further continued for a series of predictive models. Akaike's information criterion (AICs) were computed for all candidate models and the smallest AIC (1651.52) model was finally selected. Following the robust likelihood-based survival model, the 29 prognosis-associated genes were selected.
Cox multivariate regression analysis
The prognosis-associated lncRNAs were used for establishing a multivariate survival model using the Survival package in the R software. This procedure was performed on the training set and the genes were ranked by P-value. The genes with a P<0.05 were selected for a subsequent multivariate survival analysis. The receiver operating characteristic (ROC) curve was obtained using the survivalROC package (version 1.0.3; http://CRAN.R-project.org/package=survivalROC) of R software. The optimal cut-off point with maximal sensitivity and specificity identified from the ROC plot was 0.767. Based on the optimal cut-off point (0.767), the patients in the training set were divided into a low-risk and a high-risk group. Kaplan-Meier analysis was used to estimate the multivariable model identified as aforementioned in this section and log-rank test was performed according to the division of the groups. This procedure was performed for the training set, testing set and the whole dataset obtained from TCGA database.
4-lncRNA signature is an independent prognostic predictor of HNSCC
The patients were also grouped according to sex, age, histological grade and clinical stage, and performed Kaplan-Meier analysis respectively and log-rank test was performed according to the division of the groups.
Nomogram and calibration
Basic clinical information were combined with the prognosis-associated lncRNAs by plotting a nomogram to predict the 3-year and 5-year survival probability of the patients with HNSCC. A calibration plot was used to investigate the performance characteristics of the nomograms. Calibration was used to assess whether actual outcomes were similar to predicted outcomes for each nomogram. For these steps, the rms package (version 5.1–3.1; http://biostat.mc.vanderbilt.edu/rms) of R software was used to create the nomograms and calibration plots.
Target miRNA and protein prediction
LncBase (version 2; carolina.imis.athena-innovation.gr/diana_tools/web/index.php?r=lncbasev2/index) was utilized in order to investigate the association between prognosis-associated lncRNAs and their target miRNAs. The verified targets of the lncRNAs obtained through experiments and the predicted targets (score >0.9) were both downloaded. An lncRNA-miRNA network was constructed using CytoScape (version 3.7.1; cytoscape.org/). Starbase (version 3; starbase.sysu.edu.cn/) was used to identify the proteins that interact with the prognosis-associated lncRNAs. The lncRNA-protein network was also constructed using CytoScape.
Gene ontology (GO) enrichment analysis and gene set enrichment analysis (GSEA)
The online Database for Annotation, Visualization and Integrated Discovery (DAVID; http://david.ncifcrf.gov/summary.jsp) was used to perform GO enrichment analysis to explore the functions of target genes and P<0.05 was considered to indicate a statistically significant difference, which has been previously described (23). Based on the 4-lncRNA signature, which was identified using Cox multivariate regression analysis, patients were divided into a high-risk and a low-risk group. The Kyoto Encyclopedia of Genes and Genomes (version Aug 21, 2018; http://www.genome.jp/kegg/pathway.html) enrichment analysis of the high- and low-risk groups were performed using the GSEA (software.broadinstitute.org/gsea/index.jsp).
Results
Data preparation
According to the flow chart (Fig. 1), a total of 14,461 lncRNA raw count expression profiles of the 497 patients were obtained from TCGA database. Among them, 5,408 lncRNAs were used for further analysis after preprocessing the data. The patients were randomly divided into a training group (249 patients) and testing group (248 patients).
Univariate survival analysis
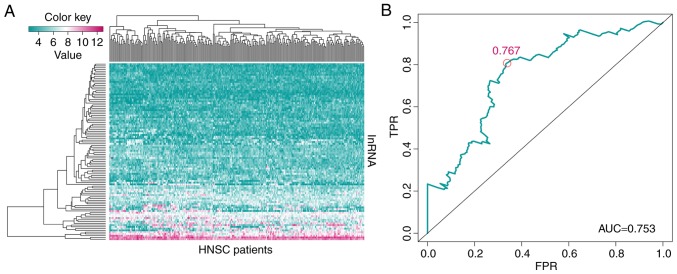
For the 5,408 lncRNAs, a univariate survival analysis was performed on the training set, and 890 significant prognosis-associated lncRNAs (P<0.05) were identified. The top 100 significant prognosis-associated lncRNAs are presented in the hierarchical cluster heat map in Fig. 2A.
Figure 2.
Construction of the 4-lncRNA based risk model. (A) Heat map of the top 100 significant lncRNAs associated with the prognosis of patients with HNSCC in the univariate survival analysis. The color key represents the expression level of lncRNA (the pink color indicates high expression and high risk, and the blue indicates low expression and low risk). (B) Receiver operating characteristic analysis of sensitivity and specificity of the survival time estimated via the 4-lncRNA based risk model. The red circle represents the optimal cut-off point. lncRNA, long non-coding RNA; HNSCC, head and neck squamous cell carcinoma; TPR, true positive rate; FPR, false positive rate; AUC, area under the curve.
Robust likelihood-based survival analysis
In order to select candidate lncRNAs for the multivariate analysis, a robust likelihood-based survival analysis was performed on the 890-prognosis-associated lncRNAs for all patients. The candidate lncRNAs were ranked by n-log-likelihood and P<0.05 was considered to indicate a statistically significant result. The top 29 prognosis-associated lncRNAs were selected for further analysis as candidate lncRNAs, which are presented in Table I.
Table I.
Significant prognosis-associated lncRNA screened by forward selection in all patients.
| lncRNA | nloglik | AIC |
|---|---|---|
| CTD_2506J14.1 | 840.91 | 1683.82 |
| RP11_388P9.2 | 833.53 | 1671.06 |
| LINC01123 | 828.52 | 1663.05 |
| LINC01152 | 822.70 | 1653.41 |
| RP11_147L13.8 | 821.28 | 1652.57 |
| ATP6V1B1_AS1 | 820.15 | 1652.31 |
| CASC8 | 819.71 | 1653.42 |
| AC007879.7 | 819.68 | 1655.36 |
| RP11_356J5.12 | 819.26 | 1656.52 |
| TSTD3 | 817.89 | 1655.79 |
| RP11_337N6.3 | 814.76 | 1651.52 |
| LA16c_390H2.4 | 814.76 | 1653.52 |
| PRKG1_AS1 | 814.60 | 1655.20 |
| MIR4435_1HG | 814.60 | 1657.20 |
| LINC00460 | 813.63 | 1657.26 |
| RP11_523O18.5 | 813.04 | 1658.09 |
| LINC01232 | 810.84 | 1655.67 |
| SH3BP5_AS1 | 810.82 | 1657.65 |
| RP11_1379J22.2 | 808.62 | 1655.24 |
| ALMS1-IT1 | 806.64 | 1653.27 |
| RP5_1171I10.5 | 806.62 | 1655.24 |
| RP11_110I1.14 | 802.38 | 1648.76 |
| C1orf147 | 801.31 | 1648.62 |
| RP11-359J14.2 | 800.53 | 1649.07 |
| LINC00998 | 799.16 | 1648.33 |
| RP11_295I5.3 | 797.17 | 1646.34 |
| RP11_624L4.1 | 795.73 | 1645.47 |
| CTB-178M22.2 | 792.30 | 1640.60 |
| RP11-347C18.5 | 789.47 | 1636.95 |
lncRNA, long non-coding RNA; nloglik, n-log-likelihood; AIC, Akaike's information criterion.
Multivariate survival analysis and construction of a 4-lncRNA prognostic model
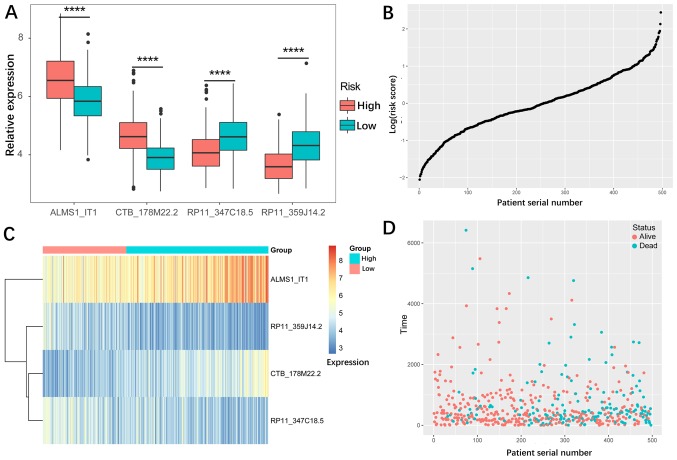
To further investigate the association between these 29 candidate lncRNAs and determine the prognosis of patients with HNSCC, a multivariate cox regression analysis of the candidate lncRNAs was performed on the training; the results of which are presented in Table II. The lncRNAs with a P-value <0.05 (four lncRNAs: ALMS1-IT1, RP11-359J14.2, CTB-178M22.2 and RP11-347C18.5) were selected (Table III) and used to construct a cox proportional hazard model of the training set. According to the cox multivariate analysis, a prediction risk value was obtained. The optimal cut-off value that divided the high-risk and low-risk groups was found via a ROC (0.767; Fig. 2B). The patients were divided into a high-risk and low-risk group using the optimal cut-off value. Fig. 3A and C presents the expression of the four lncRNAs, and two of these lncRNAs (ALMS1-IT1 and CTB-178M22.2) had higher expression levels in the high-risk group, while the other two lncRNAs (RP11-359J14.2 and RP11-347C18.5) had lower expression in the high-risk group, suggesting that ALMS1-IT1 and CTB-178M22.2 are risk factors, and that RP11-359J14.2 and RP11-347C18.5 are protective factors for patients with HNSCC. Fig. 3B and D present the predicted risk value and survival information (time and vital status) for the patients. By ranking the patients according to their risk score (the × axis represents the patient serial number), it was observed that a high predicted risk value was associated with higher mortality rate of patients.
Table II.
Results of the multivariate cox regression analysis of the 29 candidate lncRNA.
| lncRNA | Hazard ratio | 95% CI | P-value |
|---|---|---|---|
| CTB-178M22.2 | 1.73 | 1.20–2.49 | 0.003 |
| RP11-347C18.5 | 0.62 | 0.39–0.97 | 0.035 |
| ALMS1-IT1 | 1.35 | 1.01–1.79 | 0.040 |
| RP11-359J14.2 | 0.60 | 0.37–1.00 | 0.048 |
| CTD_2506J14.1 | 0.58 | 0.33–1.03 | 0.061 |
| LINC00460 | 1.14 | 0.96–1.36 | 0.147 |
| PRKG1_AS1 | 1.26 | 0.92–1.72 | 0.153 |
| RP5_1171I10.5 | 1.16 | 0.92–1.47 | 0.217 |
| C1orf147 | 0.80 | 0.54–1.17 | 0.251 |
| LA16c_390H2.4 | 1.36 | 0.78–2.38 | 0.283 |
| LINC01152 | 1.12 | 0.90–1.40 | 0.325 |
| RP11_624L4.1 | 1.17 | 0.84–1.65 | 0.356 |
| CASC8 | 0.92 | 0.74–1.14 | 0.444 |
| RP11_1379J22.2 | 0.84 | 0.53–1.32 | 0.444 |
| RP11_523O18.5 | 0.81 | 0.46–1.42 | 0.458 |
| SH3BP5_AS1 | 1.14 | 0.75–1.74 | 0.532 |
| RP11_356J5.12 | 1.08 | 0.82–1.42 | 0.580 |
| TSTD3 | 1.16 | 0.68–1.97 | 0.585 |
| MIR4435_1HG | 1.11 | 0.76–1.64 | 0.590 |
| AC007879.7 | 0.94 | 0.73–1.21 | 0.629 |
| ATP6V1B1_AS1 | 1.07 | 0.80–1.44 | 0.641 |
| RP11_388P9.2 | 1.12 | 0.68–1.87 | 0.652 |
| LINC01123 | 1.06 | 0.82–1.35 | 0.670 |
| RP11_337N6.3 | 0.93 | 0.65–1.33 | 0.685 |
| RP11_110I1.14 | 1.09 | 0.72–1.64 | 0.689 |
| LINC00998 | 0.92 | 0.59–1.44 | 0.715 |
| RP11_295I5.3 | 0.92 | 0.53–1.60 | 0.768 |
| RP11_147L13.8 | 0.97 | 0.61–1.54 | 0.883 |
| LINC01232 | 1.02 | 0.71–1.45 | 0.917 |
lncRNA, long non-coding RNA; CI, confidence interval.
Table III.
Significant lncRNAs with P-value <0.05 in cox multivariate analysis.
| lncRNA | Coef | Exp(coef) | Se(coef) | Z | Pr(>|z|) |
|---|---|---|---|---|---|
| ALMS1-IT1 | 0.3595 | 1.4327 | 0.1067 | 3.369 | 0.000755 |
| RP11-359J14.2 | −0.4993 | 0.6069 | 0.1926 | −2.593 | 0.009523 |
| CTB-178M22.2 | 0.6062 | 1.8335 | 0.1577 | 3.844 | 0.000121 |
| RP11-347C18.5 | −0.4924 | 0.6111 | 0.1797 | −2.74 | 0.006150 |
lncRNA, long non-coding RNA; coef, cox coefficient.
Figure 3.
Expression profiles of the 4-lncRNA signature. (A) Expression of the four lncRNAs in the high-risk and low-risk groups. The expression levels of all four lncRNAs were significantly different between the two groups. (B) Risk distribution of the lncRNA signature prediction value. (C) Heat map of the expression profiles of the four lncRNA in the high-risk and low-risk groups. (D) Survival information (time and vital status) of patients with head and neck squamous cell carcinoma. lncRNA, long non-coding RNA. ****P<0.0001.
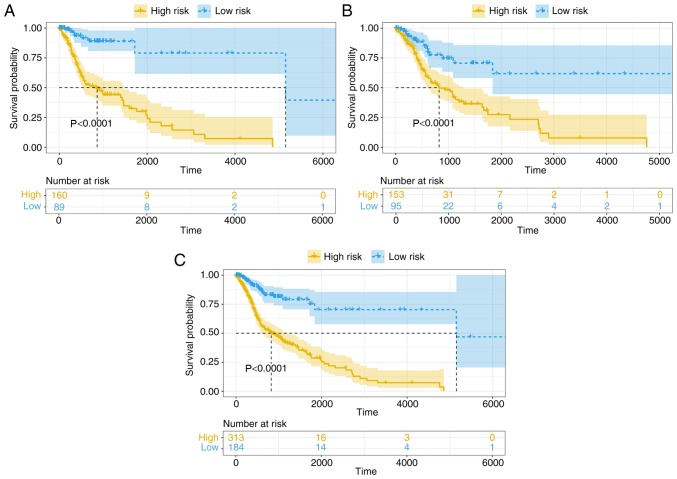
Kaplan-Meier survival analysis was performed on the training group to distinguish high-risk and low-risk patients (Fig. 4A). This was further validated in the testing group and all patient groups (Fig. 4B and C). In all sets, the 4-lncRNA based risk model was significantly associated with the OS of patients with HNSCC (P<0.0001), indicating that the 4-lncRNA model could be used for predicting the prognosis of patients with HNSCC.
Figure 4.
Kaplan-Meier survival analysis of patients in the high-risk and low-risk groups. The patients were allocated to high and low risk groups using the 4-long non-coding RNA model in the (A) training set, (B) testing test and (C) complete set.
4-lncRNA signature is an independent prognostic predictor of HNSCC
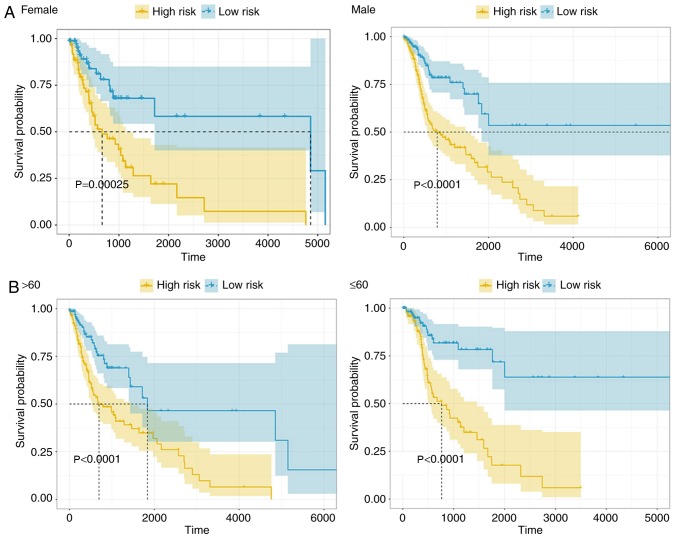
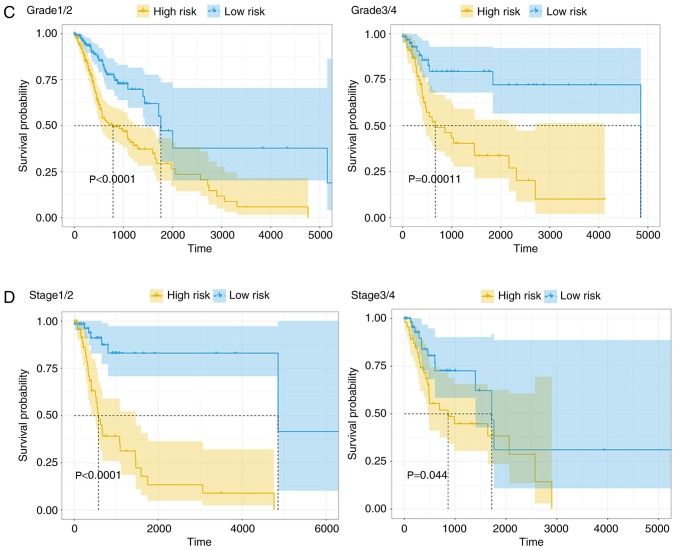
In order to detect the possible contribution of other factors, such as sex, age, histological grade (24) and clinical stage (24) on patient survival, the patients were also grouped according to these variables and the 4-lncRNA signature was applied to the different subgroups. There were 360 males and 133 females in the HNSCC cohort, and the model was able to distinguish between patients of the high- and low-risk groups in both male and female subgroups (Fig. 5A). In addition, the high-risk patients had significantly shorter OS time in both the male and female subgroups, indicating that the 4-lncRNA signature was independent of sex. The high- and low-risk groups were also distinguishable in both younger (age, ≤60 years; n=217) and older (age, >60 years; n=276) patient groups, and low-risk patients had a significantly longer OS time (Fig. 5B). Based on tumor histology, the patients were divided into grade I/II and grade III/IV groups. The OS time was significantly different between the high- and low-risk groups regardless of tumor grade (Fig. 5C), indicating that the 4-lncRNA signature was independent of tumor histological grade. Finally, the patients were classified into clinical stage I/II and stage III/IV groups, and both groups were distinguishable from each other. The patients in the high-risk group had a significantly poorer prognosis than those in the low-risk group (Fig. 5D), indicating that the 4-lncRNA signature is suitable for use in tumor stage subgroups. Taken together, the 4-lncRNA signature can be applied to patients with HNSCC that have been classified into subgroups on the basis of their clinical characteristics, and that it is an independent predictor for the prognosis of HNSCC.
Figure 5.
Kaplan-Meier survival analysis of patients with head and neck squamous cell carcinoma classified into specific cohorts. Log-rank test was performed to estimate difference in OS between the low-risk and high-risk patients within the different cohorts. Grouping was based on (A) sex and (B) age. Kaplan-Meier survival analysis of patients with head and neck squamous cell carcinoma classified into specific cohorts. Log-rank test was performed to estimate difference in OS between the low-risk and high-risk patients within the different cohorts. Grouping was based on (C) histological grade and (D) tumor stage.
Nomogram and calibration
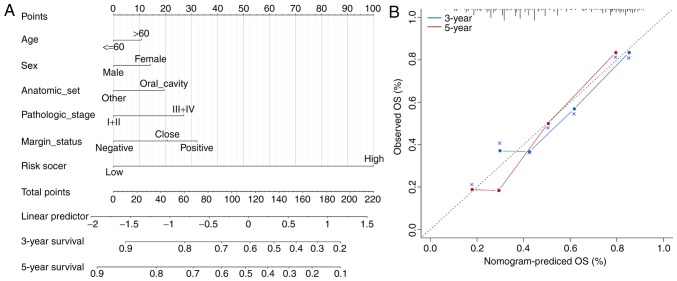
To combine the basic clinical information with the 4-lncRNA prognostic model for predicting survival rate, a cox multivariable probability hazard model was constructed and a nomogram was plotted. Basic clinical information included age, sex, tumor location, pathological stage and margin status. A 3-year and 5-year survival rate-predicting model is presented in Fig. 6A. In a nomogram, the 4-lncRNA prognostic model is combined with the basic clinical information, and the survival rate of patients with HNSCC could be predicted by calculating points. The nomogram was demonstrated to have good accuracy and stability when assessed with a calibration test (Fig. 6B).
Figure 6.
Combination of clinical features and calibration plot. (A) Combination of the 4-long non-coding RNA risk model with other clinical information. Nomogram prediction of 3-year and 5-year survival probability. Pathologic stage refers to tumor stage. (B) Calibration of each model in terms of agreement between predicted and observed 3-year or 5-year outcomes. Model performance is presented on the plot, which is highly relative to the 45-degree line, representing perfect prediction. OS, overall survival.
Target miRNA and protein
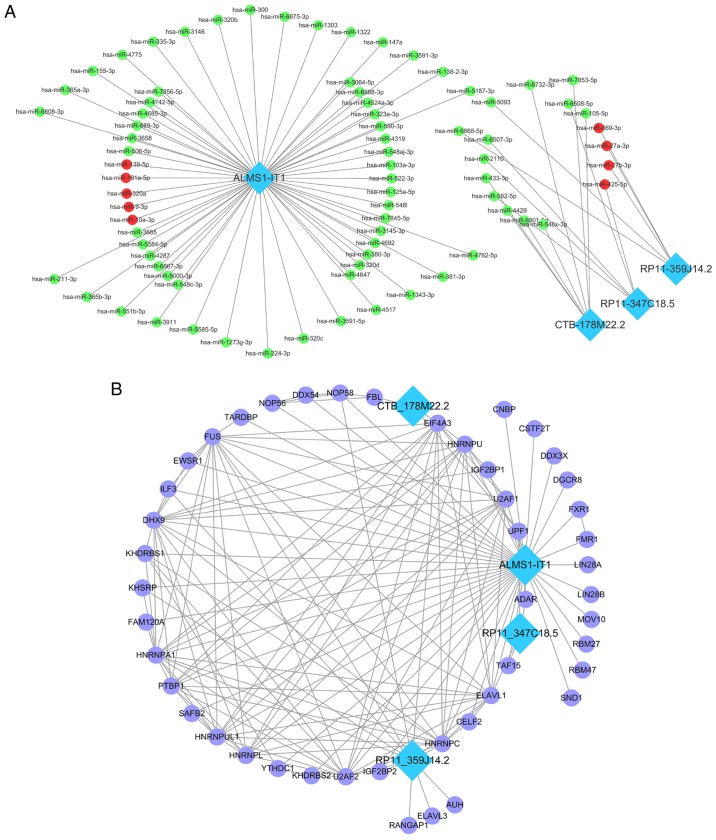
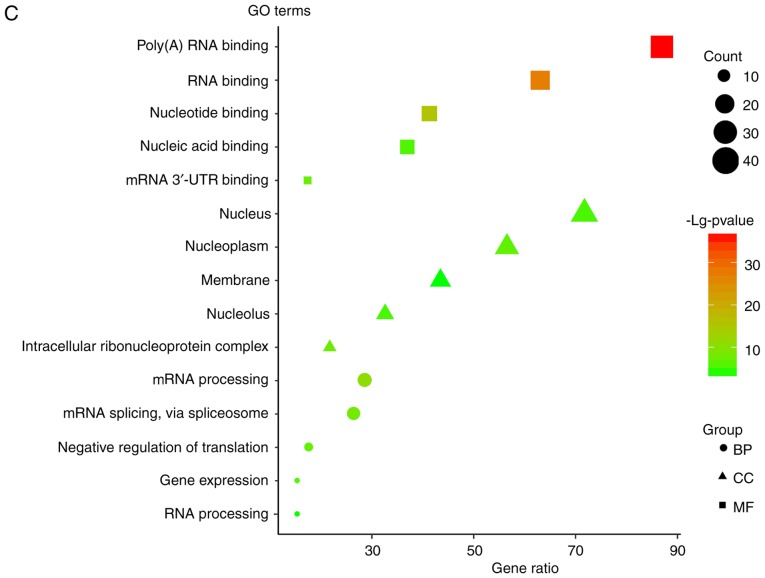
To investigate the lncRNA-miRNA interaction network regulated by the four lncRNAs, the target miRNAs were identified using lncBase (Fig. 7A). There are target miRNAs that have been verified by experiments and predicted by computer. For verified targeted miRNAs, there were five targeted miRNAs for ALMS1-IT1, one targeted miRNA for RP11-347C18.5 and three targeted miRNAs for RP11-359J14.2. For the predicted targeted miRNAs (threshold score >0.9), there were 57 targeted miRNAs for ALMS1-IT1, two targeted miRNAs for RP11-359J14.2, seven targeted miRNAs for CTB-178M22.2 and four targeted miRNAs for RP11-347C18.5. As for the lncRNA-protein network, the Starbase database was searched (Fig. 7B) and the results revealed that there were 41 proteins that interacted with ALMS1-IT1, three proteins that interact with CTB-178M22.2, four proteins that interact with RP11-347C18.5 and 13 proteins that interact with RP11-359J14.2. The functional enrichment analysis of the target proteins is presented in Fig. 7C. It was revealed that these genes are mainly involved in gene expression regulation. In addition, it was observed that in both miRNA-lncRNA and protein-lncRNA interactions, ALMS1-IT1 had the most targets, which suggested that ALMS1-IT1 plays a highly essential role in the regulation of the prognosis of patients with HNSCC.
Figure 7.
Target miRNA and protein. (A) MicroRNA-lncRNA interaction network for the four lncRNA obtained via LncBase. Red dots represent targets verified by experiments and green dots represent predicted targets. (B) Protein-lncRNA interaction network for the four lncRNAs obtained via StarBase. lncRNA, long non-coding RNA; GO, Gene Ontology; 3′-UTR, 3′-untranslated region; BP, biological process; CC, cellular component; MF, molecular function. (C) GO enrichment analysis for the protein targets of the four lncRNAs. lncRNA, long non-coding RNA; GO, Gene Ontology; 3′-UTR, 3′-untranslated region; BP, biological process; CC, cellular component; MF, molecular function.
GSEA analysis
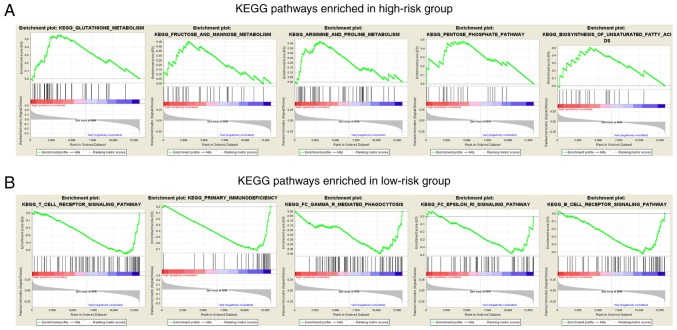
In order to investigate the biological pathways affected by the four lncRNAs, a GSEA analysis was performed to identify the pathways enriched in the low-risk and the high-risk groups. From the results, it was revealed that the pathways in the high-risk group were primarily associated with nutrient metabolism, including that of amino acids, fatty acids and carbohydrates (Fig. 8A). The enriched pathways associated with nutrient metabolism in the high-risk group may provide nutrients and energy for the carcinoma cells to proliferate so that patients in the high-risk group have a worse prognosis and higher mortality rate. As for the low-risk group, pathways concerning immune regulation, such as the regulation of T cells and B cells, were significantly enriched (Fig. 8B). This may suggest that well-regulated immune function is a key factor that contributes to better prognosis and higher survival rates in the low-risk group compared with the high-risk group.
Figure 8.
GSEA analysis. (A) Top five GSEA enrichment analysis results of the KEGG pathways for the high-risk group. Pathways associated with nutrient metabolism of cancer cells were significantly enriched in the high-risk group. (B) Top five GSEA enrichment analysis results of the KEGG pathways in the low-risk group. Pathways associated with immune regulation against cancer were significantly enriched in the low-risk group. GSEA, Gene Set Enrichment Analysis; KEGG, Kyoto Encyclopedia of Genes and Genomes.
Discussion
HNSCC is usually accompanied by high mortality, and early stage diagnosis is very hard to achieve, leading to late stage diagnosis in the majority of patients (25). Surgical resection and radiotherapy are currently the main methods of treatment in HNSCC (26); however, these therapies do not work efficiently, meaning that the survival rate of patients with HNSCC remains at 50% (27). Therefore, finding new and effective diagnostic and prognostic biomarkers for early diagnosis and risk prediction is urgently required. At present, the molecular biological basis of oncology is developing rapidly and a number of candidate molecules involved have been identified to perform well in risk assessments as diagnostic biomarkers, and for targeted therapies. Various mRNAs and miRNA-based models have been widely reported as prognostic markers and potential therapy targets during the past years for many different types of cancer, including HNSCC (28,29). Recently, the utilization of lncRNAs as diagnostic markers, prognostic markers and therapy targets has been emerging for different types of cancer, including bladder cancer (30), gastric cancer (31) and thyroid cancer (32). Therefore, the present study focused on the function of lncRNAs and a 4-lncRNA based model was identified that is associated with the survival of patients with HNSCC and the functions of the 4 lncRNAs (ALMS1-IT1, RP11-359J14.2, CTB-178M22.2 and RP11-347C18.5) were analyzed.
In the present study, a 4-lncRNA model was identified that is significantly associated with the prognosis of patients with HNSCC. The RNA-seq data and clinical data of the patients with HNSCC patients from TCGA database was used to construct an lncRNA-based risk model using univariate analyses, robust likelihood analyses and multivariate analyses on the training set. The optimal cut-off value was obtained using the ROC, which was used to divide patients into a high-risk and a low-risk group. As a result, a 4-lncRNA model was created and validated in the testing set and complete set, as well. The patients in the high-risk group had a shorter survival time and lower survival rate compared with patients in the low-risk group. These results indicate the important role of the four lncRNAs in the molecular pathogenesis, progression and prognosis of patients with HNSCC. By combining the 4-lncRNA model with some basic clinical information, a nomogram was constructed to predict the 3-year and 5-year survival probability of patients with HNSCC (33). This increases the reliability of prognosis prediction and provides clinicians with a reference for the next steps of treatment. Using the nomogram, it was evident that the 4-lncRNA risk model was more significant and reliable for the prediction of prognosis compared with other clinical factors.
Comparing the expression of the 4 lncRNAs, it was revealed that ALMS1-IT1 and CTB-178M22.2 were upregulated in the high-risk group and, therefore, negatively associated with the prognosis of patients, while RP11-359J14.2 and RP11-347C18.5 were downregulated in the high-risk group and therefore revealed to be positively associated with the prognosis of patients. To the best of our knowledge, there have been no previous reports on these four lncRNAs, indicating that they have been newly identified in the present study. A previous study reported a 3-lncRNA (AC002066.1, AC013652.1 and AC016629.3) signature that could predict the survival of patients with HNSCC (34) and these lncRNAs are different to those identified in the present study. Another report identified a 5-lncRNA based model for predicting the survival of patients with HNSCC, in which a weighted correlation network analysis was used to identify prognosis-associated lncRNAs (35). A recent study by Zhang et al (36) identified 15 prognostic lncRNAs using a differentially expressed gene analysis, in which ALMS1-IT1 was the common lncRNA and the others were different from the lncRNAs used for the construction of the predictive model. The present study utilized a robust likelihood-based survival analysis to screen for candidate lncRNAs associated with prognosis (15–17,37,38) and identified a 4-lncRNA risk model, which includes lncRNAs that had not been previously reported. These three models were compared using the area under the curve of the ROCs, and the results indicated that the 4-lncRNA model in the present study was the best option for predicting the prognosis of patients with HNSCC (Fig. S1). Another previous study by Nohata et al (39) looking for independent lncRNA prognostic predictors for the OS of patients with HNSCC in TCGA database identified 55 lncRNAs associated with poor prognosis. By comparing the results of the present study with those of Nohata et al (39), it was revealed that only ALMS1-IT1 from the 4-lncRNA signature was present in the 55 lncRNAs. This difference can be attributed to the different methods used for data processing, as well as the approach for prognosis-associated lncRNAs (39). Due to the differences among the four lncRNAs resulting in different risk levels for patients, the biological functions of the four lncRNAs were predicted in the present study. lncRNAs have various mechanisms of performing their complex biological functions, such as targeting miRNA and combining with proteins (40). Therefore, the miRNA targets and protein targets of the four lncRNAs were identified in the LncBase and StarBase databases in order to determine the interaction network. The results revealed that ALMS1-IT1 had the most target miRNAs and proteins, which indicates that ALMS1-IT1 plays an essential role in the prognosis of HNSCC. The Gene Ontology enrichment analysis revealed that the proteins that interact with the four lncRNAs are involved in the regulation of RNA binding. The GSEA analysis revealed that nutrient metabolism-associated pathways were enriched in the high-risk group, indicating that dysregulation of cancer cell metabolism contributes to poor prognosis, which is in accordance with previous studies (41,42). Cancer cells have the ability to acquire necessary nutrients from a nutrient-poor environment and utilize these nutrients in order to maintain cell viability and build new biomass, in which the metabolic alterations provide energetic and anabolic demands for cell proliferation; resulting in cancer cell metabolism being regarded as a hallmark of cancer (43). As for the low-risk group, immune regulation-associated pathways were enriched, indicating that enhanced immunity could lead to improved prognosis, which is in accordance with previous study (44). Therefore, the four lncRNAs may play a very important role in the biological regulation of cancer cells and affect tumor progression. However, numerous other factors must be considered when constructing an lncRNA-based model. Guglas et al (45) suggested that conservation of a biomarker at the nucleotide sequence level, tissue specific expression level, transcription initiation level from regions rich in repeats, and high isoform heterogeneity, need to be taken into consideration, since lncRNA isoforms can have different functions. In addition, Guglas et al (45) indicated that lncRNAs may have the potential to serve as biomarkers in HNSCC, since lncRNAs are easy to detect and are relatively stable. However, sampling methods, material storage methods, as well as lncRNA quantification all need to be unified in order to do so. In addition, when combining bioinformatics tools for the global expression analysis of lncRNA in HNSCC, the results must be validated using different methodologies (45). As Guglas et al (45) has suggested, one can compare cancer tissue with adjacent non-cancer samples from the same patient or with samples from healthy donors without a history of cancer, but analyzing adjacent non-cancer samples might be problematic due to the disturbance of tumor influence or inflammation. In the present study, no tissue samples were collected as the lncRNA profile of tumor samples from patients with HNSCC were downloaded from TCGA project and subsequently analyzed. In this respect, tissue conservation can be guaranteed. As medical technologies become increasingly more advanced, RNA-seq will cost less in the future and the procedure will be more standardized, making it an even more promising method of predicting the prognosis of patients with HNSCC via biomarker detection. Despite this, further studies are required in order to reveal and validate lncRNA function in the prognosis of HNSCC.
There were some limitations and shortcomings to the present study. First, the present study primarily focused on data mining and data analysis, which are based on methodology and the results were not validated using experiments. Further experiments are required in order to verify the results of the present study. Secondly, the datasets obtained were limited as only one HNSCC dataset from TCGA could be obtained that contained both RNA-seq data and clinical follow-up information from patients with HNSCC. Other datasets that match the requirements of the present study could be used to further validate the results of the present study; as such, additional datasets should be included to obtain improved results in future studies. Thirdly, when constructing an lncRNA signature for prognosis, the application of such a model should be taken into consideration. lncRNA can easily be obtained from fresh tumor samples, but extracting lncRNAs from archived formalin-fixed paraffin-embedded blocks can be difficult due to their instability, making it almost impossible to analyze older samples. In addition, since different methods of detecting lncRNAs may lead to different results, the procedure of detection, quantification and determination of transcriptional activity of lncRNAs must be standardized (45). Therefore, the four newly identified prognosis-associated lncRNAs in the present study deserve more attention, and future research should validate these results using experiments.
In the present study, a 4-lncRNA based risk model that is associated with the prognosis of patients with HNSCC was constructed and validated. The 4-lncRNA risk model could predict survival time and rate of patients with HNSCC, and may serve as a prognostic marker in the clinical setting. The targets and biological functions of the four lncRNAs were also revealed. These results could be used as potential prognostic and therapeutic implications for the management of patients with HNSCC in the future.
Supplementary Material
Acknowledgements
Not applicable.
Funding
No funding was received.
Availability of data and materials
The datasets used and/or analyzed during the current study are available from the corresponding author on reasonable request.
Authors' contributions
LX and AC conceptualized the study. LX was involved in data curation, performed formal analysis and designed the study; AC was involved in project administration, supervised the study and wrote, reviewed, and edited the manuscript. XZ and AC analyzed data. XZ constructed the figures. LX and XZ were wrote the original draft of the manuscript.
Ethics approval and consent to participate
Not applicable.
Patient consent for publication
Not applicable.
Competing interests
The authors declare that they have no competing interests.
References
- 1.Zhang L, Zhang W, Wang YF, Liu B, Zhang WF, Zhao YF, Kulkarni AB, Sun ZJ. Dual induction of apoptotic and autophagic cell death by targeting survivin in head neck squamous cell carcinoma. Cell Death Dis. 2015;6:e1771. doi: 10.1038/cddis.2015.139. [DOI] [PMC free article] [PubMed] [Google Scholar]
- 2.Liotta F, Querci V, Mannelli G, Santarlasci V, Maggi L, Capone M, Rossi MC, Mazzoni A, Cosmi L, Romagnani S, et al. Mesenchymal stem cells are enriched in head neck squamous cell carcinoma, correlates with tumour size and inhibit T-cell proliferation. Br J Cancer. 2015;112:745–754. doi: 10.1038/bjc.2015.15. [DOI] [PMC free article] [PubMed] [Google Scholar]
- 3.Polanska H, Raudenska M, Gumulec J, Sztalmachova M, Adam V, Kizek R, Masarik M. Clinical significance of head and neck squamous cell cancer biomarkers. Oral Oncol. 2014;50:168–177. doi: 10.1016/j.oraloncology.2013.12.008. [DOI] [PubMed] [Google Scholar]
- 4.Rothenberg SM, Ellisen LW. The molecular pathogenesis of head and neck squamous cell carcinoma. J Clin Invest. 2012;122:1951–1957. doi: 10.1172/JCI59889. [DOI] [PMC free article] [PubMed] [Google Scholar]
- 5.Galot R, Le Tourneau C, Guigay J, Licitra L, Tinhofer I, Kong A, Caballero C, Fortpied C, Bogaerts J, Govaerts AS, et al. Personalized biomarker-based treatment strategy for patients with squamous cell carcinoma of the head and neck: EORTC position and approach. Ann Oncol. 2018;29:2313–2327. doi: 10.1093/annonc/mdy452. [DOI] [PubMed] [Google Scholar]
- 6.Cech TR, Steitz JA. The noncoding RNA revolution-trashing old rules to forge new ones. Cell. 2014;157:77–94. doi: 10.1016/j.cell.2014.03.008. [DOI] [PubMed] [Google Scholar]
- 7.Wang KC, Chang HY. Molecular mechanisms of long noncoding RNAs. Mol Cell. 2011;43:904–914. doi: 10.1016/j.molcel.2011.08.018. [DOI] [PMC free article] [PubMed] [Google Scholar]
- 8.Lai EC. Micro RNAs are complementary to 3′UTR sequence motifs that mediate negative post-transcriptional regulation. Nat Genet. 2002;30:363–364. doi: 10.1038/ng865. [DOI] [PubMed] [Google Scholar]
- 9.Ponting CP, Oliver PL, Reik W. Evolution and functions of long noncoding RNAs. Cell. 2009;136:629–641. doi: 10.1016/j.cell.2009.02.006. [DOI] [PubMed] [Google Scholar]
- 10.Iyer MK, Niknafs YS, Malik R, Singhal U, Sahu A, Hosono Y, Barrette TR, Prensner JR, Evans JR, Zhao S, et al. The landscape of long noncoding RNAs in the human transcriptome. Nat Genet. 2015;47:199–208. doi: 10.1038/ng.3192. [DOI] [PMC free article] [PubMed] [Google Scholar]
- 11.Liu F, Xing L, Zhang X, Zhang X. A Four-Pseudogene classifier identified by machine learning serves as a novel prognostic marker for survival of osteosarcoma. Genes (Basel) 2019;10:E414. doi: 10.3390/genes10060414. [DOI] [PMC free article] [PubMed] [Google Scholar]
- 12.Zhu X, Tian X, Yu C, Shen C, Yan T, Hong J, Wang Z, Fang JY, Chen H. A long non-coding RNA signature to improve prognosis prediction of gastric cancer. Mol Cancer. 2016;15:60. doi: 10.1186/s12943-016-0544-0. [DOI] [PMC free article] [PubMed] [Google Scholar]
- 13.Qi P, Du X. The long non-coding RNAs, a new cancer diagnostic and therapeutic gold mine. Mod Pathol. 2013;26:155–165. doi: 10.1038/modpathol.2012.160. [DOI] [PubMed] [Google Scholar]
- 14.Zhao G, Fu Y, Su Z, Wu R. How Long Non-Coding RNAs and MicroRNAs mediate the endogenous RNA Network of head and neck squamous cell carcinoma: A Comprehensive Analysis. Cell Physiol Biochem. 2018;50:332–341. doi: 10.1159/000494009. [DOI] [PubMed] [Google Scholar]
- 15.Mao X, Qin X, Li L, Zhou J, Zhou M, Li X, Xu Y, Yuan L, Liu QN, Xing H. A 15-long non-coding RNA signature to improve prognosis prediction of cervical squamous cell carcinoma. Gynecol Oncol. 2018;149:181–187. doi: 10.1016/j.ygyno.2017.12.011. [DOI] [PubMed] [Google Scholar]
- 16.Chen H, Sun X, Ge W, Qian Y, Bai R, Zheng S. A seven-gene signature predicts overall survival of patients with colorectal cancer. Oncotarget. 2017;8:95054–95065. doi: 10.18632/oncotarget.10982. [DOI] [PMC free article] [PubMed] [Google Scholar]
- 17.Luo D, Deng B, Weng M, Luo Z, Nie X. A prognostic 4-lncRNA expression signature for lung squamous cell carcinoma. Artif Cells Nanomed Biotechnol. 2018;46:1207–1214. doi: 10.1080/21691401.2017.1366334. [DOI] [PubMed] [Google Scholar]
- 18.Zhao X, Sun S, Zeng X, Cui L. Expression profiles analysis identifies a novel three-mRNA signature to predict overall survival in oral squamous cell carcinoma. Am J Cancer Res. 2018;8:450–461. [PMC free article] [PubMed] [Google Scholar]
- 19.Suer I, Guzel E, Karatas OF, Creighton CJ, Ittmann M, Ozen M. MicroRNAs as prognostic markers in prostate cancer. Prostate. 2019;79:265–271. doi: 10.1002/pros.23731. [DOI] [PubMed] [Google Scholar]
- 20.Zhang X, Feng H, Li Z, Li D, Liu S, Huang H, Li M. Application of weighted gene co-expression network analysis to identify key modules and hub genes in oral squamous cell carcinoma tumorigenesis. Onco Targets Ther. 2018;11:6001–6021. doi: 10.2147/OTT.S171791. [DOI] [PMC free article] [PubMed] [Google Scholar]
- 21.Xing L, Zhang X, Tong D. Systematic profile analysis of prognostic alternative messenger RNA splicing signatures and splicing factors in head and neck squamous cell carcinoma. DNA Cell Biol. 2019;38:627–638. doi: 10.1089/dna.2019.4644. [DOI] [PubMed] [Google Scholar]
- 22.Shen S, Wang G, Shi Q, Zhang R, Zhao Y, Wei Y, Chen F, Christiani DC. Seven-CpG-based prognostic signature coupled with gene expression predicts survival of oral squamous cell carcinoma. Clin Epigenetics. 2017;9:88. doi: 10.1186/s13148-017-0392-9. [DOI] [PMC free article] [PubMed] [Google Scholar]
- 23.Xing L, Zhang X, Feng H, Liu S, Li D, Hasegawa T, Guo J, Li M. Silencing FOXO1 attenuates dexamethasone-induced apoptosis in osteoblastic MC3T3-E1 cells. Biochem Biophys Res Commun. 2019;513:1019–1026. doi: 10.1016/j.bbrc.2019.04.112. [DOI] [PubMed] [Google Scholar]
- 24.Amin MB, Greene FL, Edge SB, Compton CC, Gershenwald JE, Brookland RK, Meyer L, Gress DM, Byrd DR, Winchester DP. The eighth edition AJCC Cancer Staging Manual: Continuing to build a bridge from a population-based to a more ‘personalized’ approach to cancer staging. CA Cancer J Clin. 2017;67:93–99. doi: 10.3322/caac.21388. [DOI] [PubMed] [Google Scholar]
- 25.Eytan DF, Blackford AL, Eisele DW, Fakhry C. Prevalence of comorbidities and effect on survival in survivors of human papillomavirus-related and human papillomavirus-unrelated head and neck cancer in the United States. Cancer. 2019;125:249–260. doi: 10.1002/cncr.31800. [DOI] [PubMed] [Google Scholar]
- 26.Coskun HH, Medina JE, Robbins KT, Silver CE, Strojan P, Teymoortash A, Pellitteri PK, Rodrigo JP, Stoeckli SJ, Shaha AR, et al. Current philosophy in the surgical management of neck metastases for head and neck squamous cell carcinoma. Head Neck. 2015;37:915–926. doi: 10.1002/hed.23689. [DOI] [PMC free article] [PubMed] [Google Scholar]
- 27.Marur S, Forastiere AA. Head and neck squamous cell carcinoma: Update on epidemiology, diagnosis, and treatment. Mayo Clin Proc. 2016;91:386–396. doi: 10.1016/j.mayocp.2015.12.017. [DOI] [PubMed] [Google Scholar]
- 28.Guo W, Chen X, Zhu L, Wang Q. A six-mRNA signature model for the prognosis of head and neck squamous cell carcinoma. Oncotarget. 2017;8:94528–94538. doi: 10.18632/oncotarget.21786. [DOI] [PMC free article] [PubMed] [Google Scholar]
- 29.Jamali Z, Asl Aminabadi N, Attaran R, Pournagiazar F, Ghertasi Oskouei S, Ahmadpour F. MicroRNAs as prognostic molecular signatures in human head and neck squamous cell carcinoma: A systematic review and meta-analysis. Oral Oncol. 2015;51:321–331. doi: 10.1016/j.oraloncology.2015.01.008. [DOI] [PubMed] [Google Scholar]
- 30.Quan J, Pan X, Zhao L, Li Z, Dai K, Yan F, Liu S, Ma H, Lai Y. LncRNA as a diagnostic and prognostic biomarker in bladder cancer: A systematic review and meta-analysis. Onco Targets Ther. 2018;11:6415–6424. doi: 10.2147/OTT.S167853. [DOI] [PMC free article] [PubMed] [Google Scholar]
- 31.Song P, Jiang B, Liu Z, Ding J, Liu S, Guan W. A three-lncRNA expression signature associated with the prognosis of gastric cancer patients. Cancer Med. 2017;6:1154–1164. doi: 10.1002/cam4.1047. [DOI] [PMC free article] [PubMed] [Google Scholar]
- 32.You X, Yang S, Sui J, Wu W, Liu T, Xu S, Cheng Y, Kong X, Liang G, Yao Y. Molecular characterization of papillary thyroid carcinoma: A potential three-lncRNA prognostic signature. Cancer Manag Res. 2018;10:4297–4310. doi: 10.2147/CMAR.S174874. [DOI] [PMC free article] [PubMed] [Google Scholar]
- 33.Zhang JX, Song W, Chen ZH, Wei JH, Liao YJ, Lei J, Hu M, Chen GZ, Liao B, Lu J, et al. Prognostic and predictive value of a microRNA signature in stage II colon cancer: A microRNA expression analysis. Lancet Oncol. 2013;14:1295–1306. doi: 10.1016/S1470-2045(13)70491-1. [DOI] [PubMed] [Google Scholar]
- 34.Wang P, Jin M, Sun CH, Li YS, Wang X, Sun YN, Tian LL, Liu M. A three-lncRNA expression signature predicts survival in head and neck squamous cell carcinoma (HNSCC) Biosci Rep. 2018;38:BSR20181528. doi: 10.1042/BSR20181528. [DOI] [PMC free article] [PubMed] [Google Scholar]
- 35.Liu G, Zheng J, Zhuang L, Lv Y, Zhu G, Pi L, Wang J, Chen C, Li Z, Liu J, et al. A prognostic 5-lncRNA expression signature for head and neck squamous Cell Carcinoma. Sci Rep. 2018;8:15250. doi: 10.1038/s41598-018-33642-1. [DOI] [PMC free article] [PubMed] [Google Scholar]
- 36.Zhang B, Wang H, Guo Z, Zhang X. Prediction of head and neck squamous cell carcinoma survival based on the expression of 15 lncRNAs. J Cell Physiol. 2019;234:18781–18791. doi: 10.1002/jcp.28517. [DOI] [PubMed] [Google Scholar]
- 37.Wang Y, Ren F, Chen P, Liu S, Song Z, Ma X. Identification of a six-gene signature with prognostic value for patients with endometrial carcinoma. Cancer Med. 2018;7:5632–5642. doi: 10.1002/cam4.1806. [DOI] [PMC free article] [PubMed] [Google Scholar]
- 38.Wang Z, Chen G, Wang Q, Lu W, Xu M. Identification and validation of a prognostic 9-genes expression signature for gastric cancer. Oncotarget. 2017;8:73826–73836. doi: 10.18632/oncotarget.17764. [DOI] [PMC free article] [PubMed] [Google Scholar]
- 39.Nohata N, Abba MC, Gutkind JS. Unraveling the oral cancer lncRNAome: Identification of novel lncRNAs associated with malignant progression and HPV infection. Oral Oncol. 2016;59:58–66. doi: 10.1016/j.oraloncology.2016.05.014. [DOI] [PMC free article] [PubMed] [Google Scholar]
- 40.Quinn JJ, Chang HY. Unique features of long non-coding RNA biogenesis and function. Nat Rev Genet. 2016;17:47–62. doi: 10.1038/nrg.2015.10. [DOI] [PubMed] [Google Scholar]
- 41.Pavlova NN, Thompson CB. The emerging hallmarks of cancer metabolism. Cell Metab. 2016;23:27–47. doi: 10.1016/j.cmet.2015.12.006. [DOI] [PMC free article] [PubMed] [Google Scholar]
- 42.DeBerardinis RJ, Chandel NS. Fundamentals of cancer metabolism. Sci Adv. 2016;2:e1600200. doi: 10.1126/sciadv.1600200. [DOI] [PMC free article] [PubMed] [Google Scholar]
- 43.Vazquez A, Kamphorst JJ, Markert EK, Schug ZT, Tardito S, Gottlieb E. Cancer metabolism at a glance. J Cell Sci. 2016;129:3367–3373. doi: 10.1242/jcs.181016. [DOI] [PMC free article] [PubMed] [Google Scholar]
- 44.Woo SR, Corrales L, Gajewski TF. Innate immune recognition of cancer. Annu Rev Immunol. 2015;33:445–474. doi: 10.1146/annurev-immunol-032414-112043. [DOI] [PubMed] [Google Scholar]
- 45.Guglas K, Bogaczynska M, Kolenda T, Ryś M, Teresiak A, Bliźniak R, Łasińska I, Mackiewicz J, Lamperska K. lncRNA in HNSCC: Challenges and potential. Contemp Oncol (Pozn) 2017;21:259–266. doi: 10.5114/wo.2017.72382. [DOI] [PMC free article] [PubMed] [Google Scholar]
Associated Data
This section collects any data citations, data availability statements, or supplementary materials included in this article.
Supplementary Materials
Data Availability Statement
The datasets used and/or analyzed during the current study are available from the corresponding author on reasonable request.


