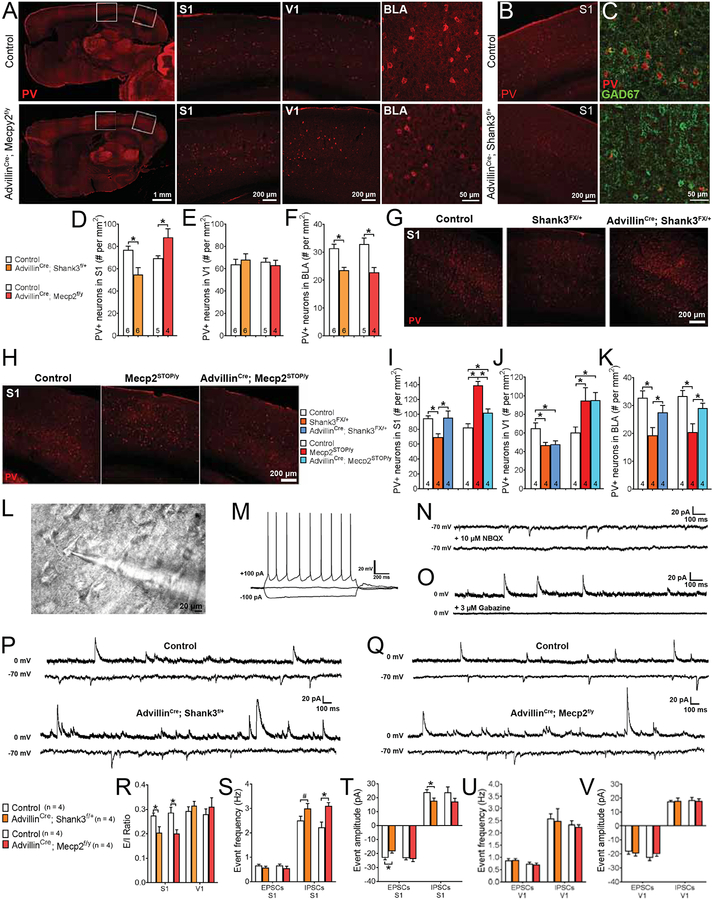
Figure 2. Loss of either Shank3 or Mecp2 in peripheral somatosensory neurons leads to abnormal brain interneuron development and microcircuit properties in a region-specific manner.
(A) Representative immunohistochemistry (IHC) images of parvalbumin (PV) immunoreactivity in control or AdvillinCre; Mecp2f/y mutant mice, showing full sagittal brain sections and corresponding magnified sections of primary somatosensory cortex (S1) and primary visual cortex (V1), or coronal sections of basolateral amygdala (BLA).
(B) Representative IHC images of coronal brain sections, showing PV immunoreactivity in control or AdvillinCre; Shank3f/+ mutant mice.
(C) Representative IHC images of coronal S1 brain sections, showing PV and GAD67 immunoreactivity in control or AdvillinCre; Shank3f/+ mutant mice.
(D-F) Quantification of the number of PV-positive (PV+) neurons in S1 (D), V1 (E), and BLA (F) in mutant mice and their control littermates. Student’s unpaired t-test, *, p < 0.05.
(G) Representative IHC images of coronal S1 brain sections, showing PV immunoreactivity in control, Shank3FX/+, or AdvillinCre; Shank3FX/+ mutant mice.
(H) Representative IHC images of coronal S1 brain sections, showing PV immunoreactivity in control, Mecp2STOP/y, or AdvillinCre; Mecp2STOP/y mutant mice.
(I-K) Quantification of the number of PV+ neurons in S1 (I), V1 (J), and BLA (K) in mutant mice and their control littermates. One-way ANOVA with post-hoc Tukey’s test, *, p < 0.05; #, p < 0.10.
(L) Example image of a coronal S1 slice with a layer 2/3 pyramidal neuron in whole cell patch clamp recording configuration.
(M) Example firing pattern of a layer 2/3 pyramidal neuron in whole cell patch clamp recording configuration during current injection steps.
(N) Example traces from a layer 2/3 pyramidal neuron showing spontaneous excitatory postsynaptic currents (sEPSCs) in normal bath solution or following application of NBQX (10 μM) to block AMPA receptors.
(O) Example traces from a layer 2/3 pyramidal neuron showing spontaneous inhibitory postsynaptic currents (sIPSCs) in normal bath solution or following application of gabazine (3 μM) to block GABAA receptors.
(P) Representative traces showing sEPSCS (−70 mv hold) and sIPSCs (0 mV hold) from S1 slices of control or AdvillinCre; Shank3f/+ mutant mice.
(Q) Representative traces showing sEPSCs (−70 mv hold) and sIPSCs (0 mV hold) from S1 slices of control or AdvillinCre; Mecp2f/y mutant mice.
(R) Quantification of excitatory/inhibitory (E/I) ratios in S1 or V1 slices from control and mutant mice. Two-way ANOVA with post-hoc Sidak’s test, *, p < 0.05.
(S-T) Quantification of sEPSC and sIPSC event frequency (S) and event amplitude (T) in S1 slices from control and mutant mice. Two-way ANOVA with post-hoc Sidak’s test, *, p < 0.05; #, p < 0.10.
(U-V) Quantification of sEPSC and sIPSC event frequency (U) and event amplitude (V) in V1 slices from control and mutant mice. Two-way ANOVA with post-hoc Sidak’s test, *, p < 0.05.

