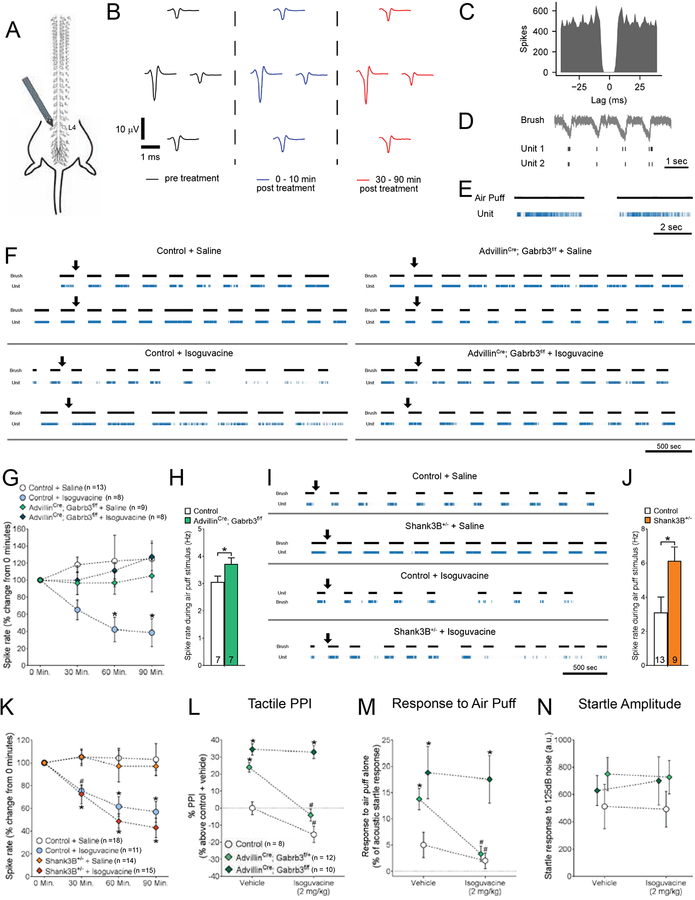
Figure 6. Isoguvacine attenuates tactile sensitivity through reduced excitability of peripheral, low-threshold mechanosensory neurons.
(A) Diagram for in vivo dorsal root ganglion (DRG) multi-unit electrode recordings, showing tetrode placement into the left L4 ganglia.
(B) Example single unit identified during the spike sorting process. Average waveform at each electrode site.
(C) Example inter-spike interval for a single unit identified during the spike sorting process.
(D) Activity traces of two putative single units in response to a brush stimulus.
(E) Activity traces of a putative single unit in response to a light air puff stimulus (1 PSI).
(F) Representative activity raster plots for multiple putative LTMRs in multiple mice over the duration of a recording experiment in controls and AdvillinCre; Gabrb3f/f mice. Mice received a subcutaneous injection of either saline or isoguvacine (2 mg/kg) during the experiment, and activity of light-touch responsive units in response to a light brush stimulus was assessed over a 90-minute period. Arrows indicate time of injection.
(G) Relative firing frequency of LTMRs in response to a brush stimulus over the duration of each recording experiment, following subcutaneous injection of either saline or isoguvacine (2 mg/kg). Repeated measures, two-way ANOVA with post-hoc Dunnett’s test [F (3,136) = 9.326, P < 0.0001], *p < 0.05.
(H) Average baseline spike rate of LTMRs in response to an air puff stimulus (1 PSI), in control and AdvillinCre; Gabrb3f/f mice. Student’s t-test, *p = 0.490.
(I) Representative activity raster plots for putative LTMRs in multiple mice over the duration of recordings in controls and Shank3B+/− mice. Mice received a subcutaneous injection of either saline or isoguvacine (2 mg/kg) during the experiment, and activity of light-touch responsive units was assessed over a 90-minute period. Arrows indicate time of injection.
(J) Average baseline spike rate of LTMRs in response to an air puff stimulus (1 PSI), in control and Shank3B+/− mice. Student’s t-test, *p = 0.0291.
(K) Relative firing frequency of LTMRs in response to a brush stimulus over the duration of each recording experiment, following subcutaneous injection of either saline or isoguvacine (2 mg/kg). Repeated measures, two-way ANOVA with post-hoc Dunnett’s test [F (3, 216) = 22.69, P < 0.0001], *p < 0.05.
(L) Percent inhibition of the startle response to a 125 dB noise, when the startle noise is preceded by a light air puff in control, AdvillinCre; Gabrb3f/+ and AdvillinCre; Gabrb3f/f mice following i.p. administration of 2 mg/kg isoguvacine (i.p., 2 mg/kg). Two-way ANOVA with post-hoc Sidak’s test, *, p < 0.05 for comparisons between mutant group to control littermates with saline; #, p < 0.05, for comparisons between mutant condition with saline to same mutant group with isoguvacine.
(M) Response to a light air puff stimulus alone in mice following i.p. administration of either saline or 2 mg/kg isoguvacine treatment. Responses are expressed as percent of startle response to a 125 dB noise. Two-way ANOVA with post-hoc Sidak’s test, *, p < 0.05 for comparisons between mutant group to control littermates with saline; #, p < 0.05, for comparisons between mutant condition with saline to same mutant group with isoguvacine.
(N) Magnitude of startle response to a 125 dB noise in mice following i.p. administration of either saline or 2 mg/kg isoguvacine treatment. Two-way ANOVA with post-hoc Sidak’s test, *, p < 0.05.

