Abstract
The lakes on the Qinghai-Tibet Plateau (QTP) are the largest and highest lake group in the world. Gymnocypris selincuoensis is the only cyprinid fish living in lake Selincuo, the largest lake on QTP. However, its genetic resource is still blank, limiting studies on molecular and genetic analysis. In this study, the transcriptome of G. selincuoensis was first generated by using PacBio Iso-Seq and Illumina RNA-seq. A full-length (FL) transcriptome with 75,435 transcripts was obtained by Iso-Seq with N50 length of 3,870 bp. Among all transcripts, 75,016 were annotated to public databases, 64,710 contain complete open reading frames and 2,811 were long non-coding RNAs. Based on all- vs.-all BLAST, 2,069 alternative splicing events were detected, and 80% of them were validated by reverse transcription polymerase chain reaction (RT-PCR). Tissue gene expression atlas showed that the number of detected expressed transcripts ranged from 37,397 in brain to 19,914 in muscle, with 10,488 transcripts detected in all seven tissues. Comparative genomic analysis with other cyprinid fishes identified 77 orthologous genes with potential positive selection (Ka/Ks > 0.3). A total of 56,696 perfect simple sequence repeats were identified from FL transcripts. Our results provide valuable genetic resources for further studies on adaptive evolution, gene expression and population genetics in G. selincuoensis and other congeneric fishes.
Keywords: single-molecule sequencing, transcriptome, alternative splicing, gene expression, Gymnocypris selincuoensis
1. Introduction
The lakes on the Qinghai-Tibet Plateau (QTP) are the largest and highest lake group in the world. The lake Selincuo (4,530 m asl) is the largest lake among them. Gymnocypris selincuoensis is the only cyprinid fish living in lake Selincuo, which adapts to the extreme environment with cold climate, high-altitude and limited resources. Two obvious characteristics of this cyprinid fish were late-maturing and slow-growing. The males and females of G. selincuoensis reach sexual maturity at the age of 8 and 9 which are much older than other cyprinid fishes, such as Hypophthalmichthys molitrix, Cyprinus carpio and Carassius auratus.1–5 With the climate warming trend on the QTP, the reproductive phenology of G. selincuoensis has advanced 2.9 days per decade on average.6 The average age of G. selincuoensis reaching the weight of 500 g is age 14–16 which is also older than other cyprinid fishes.7,8 As a migration fish species, G. selincuoensis lives in river before age 5, then inhabits in lake, and returns to river during the reproductive season, indicating its adaptation to both saline and fresh water environments.8 Hence, G. selincuoensis is a good model species for studies on adaptive evolution, population genetics and climate change. In our previous studies, much progress has been made in G. selincuoensis, which mainly focused on studying the life history, biogeography, and reproduction and growth under climate change.6–11 However, the genomic or gene resources are still blank in this species, limiting the studies on molecular or genetic analysis.
The transcriptome represents all the genes expressed in one cell or a population of cells. A reference transcriptome provides valuable information for studying gene expression and evolution, discovering alternative splicing (AS) events and long non-coding RNAs (lncRNAs), and developing molecular markers.12–15 During the last decade, transcriptomic analysis has vastly increased our understanding on the molecular adaptation to various environments. Gene expression, evolutionary selection and AS are believed to be associated with local adaptation in natural environments. For example, differentially expressed genes associated with the immune function have been identified between lake and river sticklebacks, supporting the hypothesis that parasites contribute to adaptation of sticklebacks in lake and river habitats.16,17 Six transcriptome sequences exhibiting signals of strong diversifying selection have been identified between two sympatric and cologically divergent species, benthic Amphilophus astorquii and limnetic Amphilophus zaliosus.18 A high degree of AS events has been detected among cichlid species with disparities in jaw morphology, indicating AS may play an important role in cichlid adaptive radiation.19
The transcriptomes of many model and non-model organisms have been generated by short-read sequencing on next-generation sequencing platforms.20 However, owing to the inherent length limitations, short-read sequencing do not provide full-length (FL) transcript sequences, limiting their utility for discovering alternative spliced isoforms.21,22 Furthermore, short-read sequencing may generate low-quality transcripts, leading to incorrect annotations.23,24 Recently, long-read sequencing technology (e.g. PacBio) can help overcome these limitations by providing sequence information of FL cDNA molecules without the need for further assembly.25 This technique has been successively used for transcriptome analysis in a few plant and animal species, providing useful information for reliable transcriptome assemble and annotation and identification of AS.21,22,26–30 Owing to the relatively high cost, long-read sequencing has not been directly used to quantify gene expression for the moment.
In this study, we sequenced and analysed the transcriptome of G. selincuoensis by using PacBio Iso-Seq and Illumina RNA-seq technologies. The aims of this study include: (i) generation and annotation of an FL reference transcriptome for G. selincuoensis; (ii) detecting alternatively spliced transcript isoforms; (iii) exploring gene expression patterns among various tissues; (iv) identifying potential positively selected genes; and (v) development of gene-associated microsatellite markers. Our results would increase our understanding of the complexity of the transcriptome of G. selincuoensis and provide a valuable genetic resource for further studies on gene expression, adaptive evolution, population genetics, conservation and phylogeny in such species and other Gymnocypris fishes.
2. Materials and methods
2.1 Sample collection and RNA preparation
Three wild females of G. selincuoensis were collected during the reproductive season from the Zageng Tsangpo River (31°48.770′ N; 88°25.420′ E), a primary tributary of lake Selincuo on 8 May 2018. After anaesthesia with MS222, seven tissues including brain, heart, liver, kidney, gill, muscle and ovary were sampled immediately and stored in liquid nitrogen until RNA extraction. All experimental animal programmes involved in this study were approved by the Animal Care and Use Committee at the Institute of Hydrobiology, Chinese Academy of Sciences.
For each tissue from each fish, total RNA was extracted using EZNA HP Total RNA Kit (Omega Bio-tek, USA) following the manufacturer’s instructions. RNA degradation and contamination were verified by ethidium bromide staining of 28s and 18s ribosomal RNA on a 1% agarose gel. RNA integrity was checked using an Agilent 2100 Bioanalyzer (Agilent Technologies, Palo Alto, CA, USA). The concentration of each RNA sample was determined using Qubit RNA HS Assay Kit in Qubit 2.0 Fluorometer (Life Technologies, Carlsbad, CA, USA). For PacBio Iso-Seq, 1 µg of each RNA sample was pooled together for cDNA library construction. For Illumina RNA-Seq, an equal amount of total RNA from three fish was pooled for each tissue, indexed cDNA libraries were then prepared for each tissue sample. The polyA containing mRNA was extracted using oligo-dT attached magnetic beads.
2.2 PacBio Iso-Seq library preparation and sequencing
The Iso-Seq library was prepared according to the Pacific Biosciences protocol. Briefly, 1 µg of polyA mRNA was reversely transcribed into cDNA using the Clontech SMARTer PCR cDNA Synthesis Kit. The optimal amplification cycle number was determined for generating dsDNA. After amplification, PCR product was purified using AMPure PB beads (Pacific Biosciences, Menlo Park, CA, USA) and was subjected to construction of SMRTbell library using SMRTBell Template Prep Kit (Pacific Biosciences, Menlo Park, CA, USA). The library was then sequenced on a Pacific Biosciences RSII sequencer using P2.1–C2.1 chemistry with 20 h movies (Pacific Biosciences, Menlo Park, CA, USA).
2.3 Illumina RNA-seq and de novo assembly
The Illumina library for each tissue sample was constructed using the TruSeq RNA Sample Prep Kit (Illumina, San Diego, CA, USA) following the manufacturer’s instructions. Briefly, the polyA mRNA was fragmented using divalent cations at elevated temperature. The RNA fragments were reverse transcribed into first strand cDNA using reverse transcriptase and random primers, followed by second-strand cDNA synthesis, end repair and ligation of the adapters. The ligated fragments were purified and enriched through PCR to generate the final cDNA library. Finally, seven transcriptomic libraries were sequenced on Illumina HiSeq X Ten platform to obtain 150 bp pair-end reads. The raw paired-end reads were filtered using fastp 0.18.0 with the following parameters: -q 28 -u 20 -l 50 -3 -W 4 -M 30.31 The clean paired-end reads from each library were merged together and then de novo assembled by using Trinity 2.8.4 software with the default parameters.32
2.4 PacBio Iso-Seq data processing and error correction
PacBio Iso-Seq data were processed using the SMRTlink 5.1 software. Briefly, effective subreads were obtained from the raw reads (parameters: –minLength = 200, –minReadScore = 0.65). Circular consensus sequence (CCS) reads were generated from subread BAM files using the parameters of max_drop_fraction 0.8, min_passes 2 and min_predicted_accuracy 0.8. By searching for the presence of poly(A) signal, 5′ and 3′ primers, full-length non-chimera (FLNC) reads and non-full-length (NFL) were identified from CCS reads. Consensus isoforms were produced by clustering FLNC reads using the iterative clustering for error correction (ICE) algorithm, and polished by NFL reads using the Arrow algorithm. Additional nucleotide errors in the polished consensus isoforms were corrected using the Illumina RNA-seq short reads with the software LoRDEC (parameters: -k 21, -s 3). Finally, the FL reference transcriptome was obtained after a further clustering with CD-HIT-EST (c = 0.95).33
2.5 Functional annotation and CDS prediction
The FL transcripts were annotated based on the following databases with the latest releases until 12 August 2018: NCBI non-redundant protein sequences (Nr), non-redundant nucleotide sequences (Nt), Cluster of Orthologous Groups of proteins (COG/KOG), Swissprot, Pfam, Gene Ontology (GO) and KEGG Ortholog database (KEGG). Four kinds of software were used for functional annotation with the e-value of 1e−10, including BLAST34 for Nt, Diamond35 for Nr, KOG, Swissprot and KEGG, Hmmscan36 for Pfam and Blast2GO37 for GO. The ANGLE pipeline was used to predict open reading frames (ORFs) of each FL transcript.38
2.6 Prediction of lncRNAs
The lncRNAs were predicted by using four methods, including PLEK,39 CNCI (Coding-Non-Coding Index),40 CPC (Coding Potential Calculator)41 and Pfam protein structure domain analysis,42 with default parameters. These methods can effectively distinguish protein-coding and non-coding transcripts. Transcripts were removed that did not pass any of these analyses, the intersection of the four results were then selected as lncRNAs.
2.7 Identification and validation of AS events
Owing to the absence of an annotated reference genome in G. selincuoensis, the de novo detection of AS events was performed based on the all- vs.-all BLAST according to the method described by Liu et al.28 For example, in an exon skipping event, there should be two High-scoring Segment Pair (HSP) in the alignment of two transcripts. In the shorter transcript, the base pair coordinates representing the end of HSP1 and the start of HSP2 should be sequentially continuous, and in another transcript, the base pair coordinates between the end of HSP1 and the start of HSP2 should be the skipped exon (recorded here as ‘AS Gap’). Twenty AS events were randomly selected to be validated by RT-PCR. For each transcript pair containing putative AS events, primer pairs were designed in the flanking region of ‘AS Gap’. First-stand cDNA was synthesized using M-MLV Reverse Transcriptase (TaKaRa, Japan) with oligo (dT) primer following the manufacturer’s protocol. PCR products were checked using 2.0% agarose gel stained with ethidium bromide.
2.8 Quantification and validation of gene expression levels
The Illumina shorts reads of each RNA-seq library were aligned to the FL reference transcriptome to obtain unique mapped reads by using bowtie2 software43 (parameters: –end-to-end –no-mixed –no-discordant –gbar 1000 -k 200). The expression level of each transcript for each tissue was calculated and normalized into FPKM (fragments per kilobase of transcript per million fragments mapped) values by RSEM software.44 A cut-off value of 1 FPKM was used as the detection limit.45 The expression level of each transcript in each tissue was classified into five categories including very low, low, moderate, high and very high with the FPKM values of 1–3, 3–10, 10–50, 50–100 and >100, respectively. The tissue-specific transcripts are represented by 50-fold higher FPKM level in one tissue compared with all other tissues. Twenty transcripts including 16 tissue-specific transcripts were randomly selected to assess the reliability of our quantification analysis, by quantitative real-time PCR (qRT-PCR).
2.9 Identification of orthologs and evolution analysis
The transcriptome of G. selincuoensis was compared with other three cyprinid fishes, including Danio rerio, Ctenopharyngodon idellus and C. carpio which all have reference genomes and annotations. The protein-coding sequences of D. rerio (GRCz11), C. idellus and C. carpio were downloaded from the websites NCBI, http://www.ncgr.ac.cn/grasscarp and http://www.carpbase.org, respectively. The orthologous groups among the four species were identified by suing OrthoFinder software (version 2.3.1)46 with default parameters. Sequences of each one-to-one orthologous gene were aligned using ParaAT 1.0.47 The non-synonymous substitution rates (Ka), synonymous substitution rates (Ks) and Ka/Ks ratio for each alignment were calculated by KaKs_calculator 2.048 using the YN algorithm.
2.10 Detection of microsatellite markers
Microsatellite markers (also known as simple sequence repeats, SSRs) were identified from the FL reference transcriptome using MISA (http://pgrc.ipk-gatersleben.de/misa/misa.html), with parameters as default. The minimum repeat time for core repeat motifs was set as following: 10 for mononucleotide, 6 for dinucleotides and 5 for trinucleotides, tetranucleotides, pentanucleotides and hexanucleotides. Based on the structural organization of the repeat motifs, SSRs were classified into perfect and complicated (compound or interrupted) SSRs.
3. Results
3.1 FL reference transcriptome
A total of 5,819,071 subreads were generated from PacBio Iso-Seq with a mean length of 2,833 bp, which yielded 337,042 CCS reads. CCS reads comprised 273,664 FLNC reads and 62,427 NFL reads. After isoform-level clustering (ICE algorithm) and polishing (Arrow algorithm), a total of 134,126 FL polished consensus isoforms were generated from FLNC reads, with a total of 446.23 Mb nucleotide bases. By error correction with Illumina RNA-seq clean data, all consensus isoforms were retained with 3.08 Mb nucleotide bases collected. Finally, the FL reference transcriptome containing 75,435 FL transcripts were obtained after clustering with CD-HIT-EST, with a total of 264.73 Mb nucleotide bases. The average length of all transcripts was 3,509 bp, and the N50 value was 3,870 (Table 1).
Table 1.
Summary for the transcriptome of G. selincuoensis using PacBio Iso-Seq and Illumina RNA-seq
| Parameters | PacBio Iso-Seq | Illumina RNA-seq |
|---|---|---|
| Sequencing data | ||
| Number of subreads or raw reads | 5,819,071 | 489,641,866 |
| Number of CCS or clean reads | 273,664 | 443,484,534 |
| Full-length or assembled transcriptome | ||
| Number of transcripts | 75,435 | 532,241 |
| Number of nucleotide bases (Mb) | 264.73 | 433.65 |
| GC content (%) | 44.74 | 41.41 |
| Mean length (bp) | 3,509 | 815 |
| Smallest length (bp) | 201 | 183 |
| Largest length (bp) | 14,751 | 56,378 |
| N50 length (bp) | 3,870 | 1,479 |
| Length range of transcripts (bp) | ||
| <500 | 107 | 325,013 |
| 500–1,000 | 371 | 108,697 |
| 1,000–2,000 | 7,035 | 50,754 |
| 2,000–3,000 | 24,434 | 20,884 |
| >3,000 | 43,488 | 26,893 |
3.2 De novo assembly from short reads
The Illumina RNA-seq generated 489.64 million raw reads for all tissue samples. After trimming and filtering, a total of 443.48 million clean reads were obtained for further analysis, with the number of reads for each tissue sample ranging from 60.03 to 68.41 million. Based on these clean reads, Trinity software de novo assembled 680,616 transcripts from 397,627 ‘genes’. After clustering by CD-HIT-EST, a total of 532,241 transcripts were generated with a total of 433.65 Mb nucleotide bases. The average length and N50 length were 815 and 1,479 bp (Table 1).
3.3 Comparison between FL and de novo transcripts
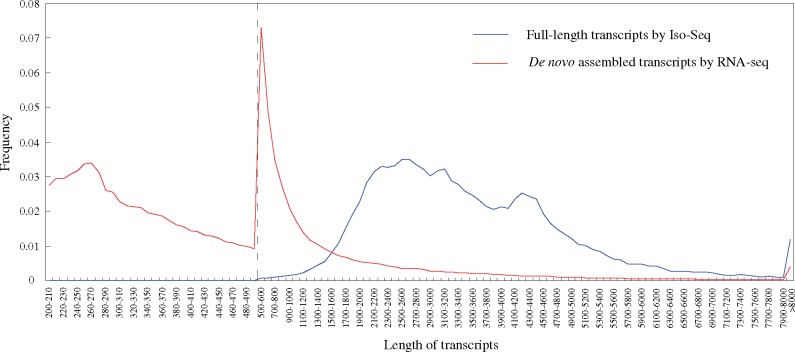
The average length and N50 length of FL transcripts were both larger than that of de novo transcripts (Table 1). Most FL transcripts had the length ranging from 1,500 to 5,000 bp, accounting for 85.03% of the total number (Fig. 1). However, 87.67% of de novo transcripts had the length <1,500 bp. The results of comparison by Blastn showed that 314,567 (59.10%) de novo transcripts exhibited similarity to 94.5% of the FL transcripts, and 28.00% of them were annotated in Nr database. Of the de novo transcripts with no Blastn hit, 71.95% had the length <500 bp, and only 11.13% were assigned to Nr database.
Figure 1.
The length distribution of transcripts obtained by Iso-Seq and RNA-seq.
3.4 Functional annotation of FL transcripts
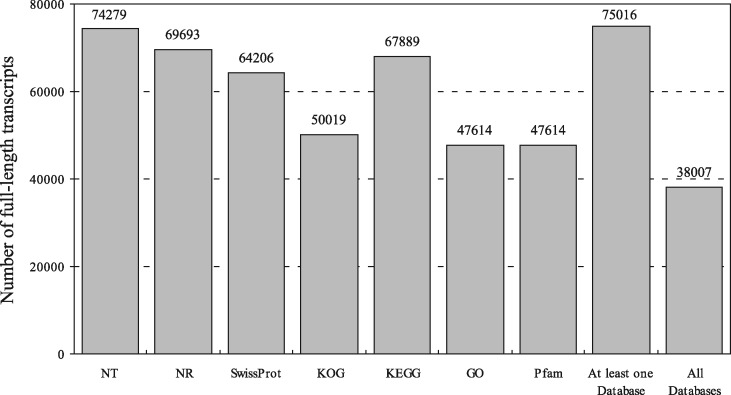
Through comparison with public databases, a total of 74,279 (98.47%), 69,693 (92.39%), 64,206 (85.11%), 50,019 (66.31%), 67,889 (90.0%), 47,614 (63.12%) and 47,614 (63.12%) FL transcripts had significant hits against Nt, Nr, Swissprot, KOG, KEGG, GO and Pfam databases, respectively (Fig. 2). Of all transcripts, 99.44% (75,016) were successfully annotated in at least one database, and 50.38% (38,007) were annotated in all of the databases. For Nt and Nr annotation, 99.23% and 93.80% of homologous hits were assigned to five fish species, respectively, including Sinocyclocheilus rhinocerous, Sinocyclocheilus angustiporus, Sinocyclocheilus grahami, C. carpio and Danio rerio (Supplementary Fig. S1). GO annotations generated 54 Level 2 GO terms (Supplementary Fig. S2). Among them, the three most abundant terms under the biological process category were ‘cellular process’ (20.44%), ‘metabolic process’ (17.57%) and ‘single-organism process’ (13.84%). Within the cellular component category, ‘cell part’ (18.16%) and ‘cell’ (18.16%) were the most abundant terms. Of the 11 terms in the molecular function category, ‘binding’ (52.60%) and ‘catalytic activity’ (29.26%) had the highest number of transcripts. For KEGG annotation, transcripts were mainly assigned to more than 370 signalling pathways in 44 Level 2 KEGG groups (Supplementary Fig. S3). Among these Level 2 pathways, the signal transduction pathway had the largest number of transcripts (19,108), followed by endocrine system (8,259), immune system (8,171) and cancers: overview (6,825). The COG-annotated transcripts were classed into 26 categories, with the most number of transcripts in signal transduction mechanisms (10,735), followed by general function prediction only (10,169), post-translational modification, protein turnover, chaperones (5,511) and transcription (3,693) (Supplementary Fig. S4). A total of 75,729 coding sequences were predicted from 73,790 transcripts by ANGLE programme, with the average length of 1,380.56 nucleotides (Supplementary Fig. S5). Among them, 64,710 (87.69%) transcripts were recognized as complete ORFs based on the presence of start and stop codons.
Figure 2.
The number of full-length transcripts annotated with Nt, Nr, Swissprot, KOG, KEGG, GO and Pfam databases.
3.5 lncRNAs prediction
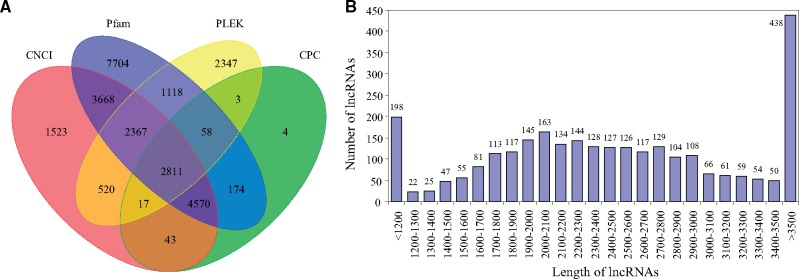
The numbers of lncRNAs predicted from FL transcripts by PLEK, CNCI, CPC, and Pfam were 9,241, 15,519, 7,680 and 22,470, respectively (Supplementary Table S1). The intersection of these four results yielded 2,811 lncRNA transcripts (Fig. 3). The average length of lncRNA transcripts was 2,586.4 bp. The length of lncRNA transcripts was mainly ranged from 1,700 to 3,000 bp, accounting for 58.9% of the total number.
Figure 3.
The features of long non-coding RNAs (lncRNAs) in G. selincuoensis. (A) Venn graph of lncRNA transcripts from PLEK, CNCI, CPC and Pfam analysis. (B) The length distribution of lncRNA transcripts.
3.6 De novo detection and validation of AS events
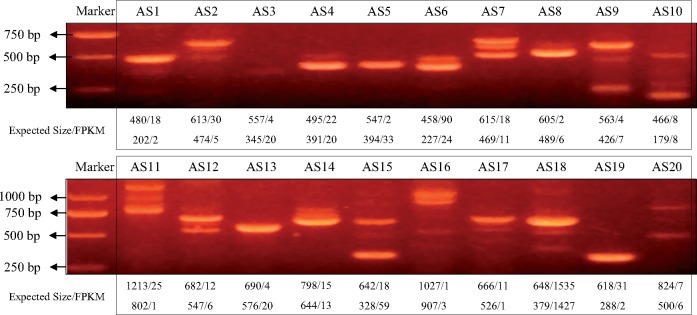
A total of 2,069 pairs of FL transcripts that might represent AS events were detected based on the all- vs.-all BLAST with high identity settings (e-value of 1e−20, pairwise identity of 95%) (Supplementary Table S2). The average length of ‘AS Gap’ in AS events was 586.3 bp. Among the 20 AS events selected for RT-PCR (Supplementary Table S3), 16 (80%) were validated by agarose gel electrophoresis which generated obvious separated gel bands for each AS event (Fig. 4). The gel banding pattern and the size of the fragments were consistent with the AS isoforms generated from Iso-Seq. For the remaining four AS events, RT-PCR products all generated a single gel band. The single band represents the higher expressed isoform in AS3, AS5 and AS13, and the lower expressed isoform in AS19. The detection of AS events was also performed based on Illumina RNA-Seq data. A total of 3,797 pairs of de novo assembled transcripts that might represent AS events were identified by using the same method used for FL transcripts. Among them, 996 (26.23%) AS events were validated by results of FL transcript analysis.
Figure 4.
RT-PCR validation of 20 alternative splicing events identified by Iso-Seq.
3.7 Tissue gene expression atlas
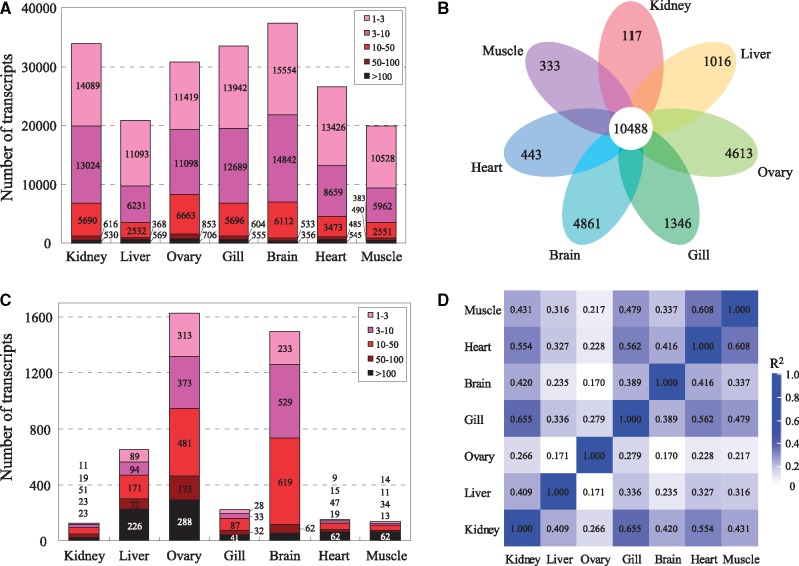
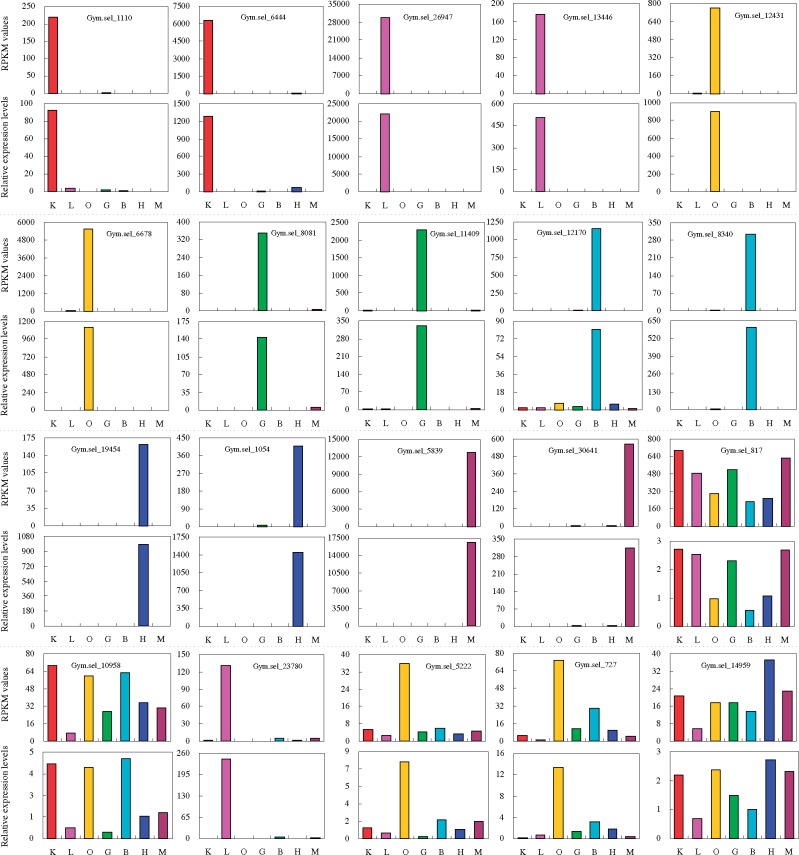
With a cut-off of 1 FPKM, the number of detected FL transcripts ranged from 37,397 (49.58%) in brain to 19,914 (26.40%) in muscle (Fig. 5A). A total of 10,488 transcripts were expressed in all tissues (Fig. 5B). Of the detected transcripts, the largest fraction showed very low expression (1–3 FPKM) followed by low expression (3–100 FPKM) in each tissue, however, only 1.91% and 1.96% on average showed high (50–100 FPKM) and very high (>100 FPKM) expression, respectively. There were 55 and 80 transcripts that showed very low and very high expression in all tissues, respectively. The results of tissue-by-tissue comparison showed that ovary (1,628) and brain (1,494) had the largest number of tissue-specific transcripts, followed by liver (652) and gill (221), with the lowest number in kidney (127), heart (152) and muscle (134) (Fig. 5C). Based on the global expression profiles (Supplementary Table S4), the highest correlation coefficient was observed between gill and kidney (R2 = 0.655), followed by pairs of heart-muscle (R2 = 0.608), heart-gill (R2 = 0.562) and heart- kidney (R2 = 0.554) (Fig. 5D). The expressions of the selected 20 transcripts were all validated by qRT-PCR (Supplementary Table S5, Fig. 6). The Spearman correlation coefficient between FPKM values and relative expression levels obtained by qRT-PCR was 0.95.
Figure 5.
Analysis of gene expression in seven tissues of G. selincuoensis. (A) The number of transcripts with different expression abundances in various tissues based on FPKM values. (B) Venn diagram of detected transcripts (with a cut-off of 1 FPKM) in each tissue. (C) The number of tissue-specific transcripts in each tissue. The tissue-specific transcripts are represented by 50-fold higher FPKM level in one tissue compared with all other tissues. (D) Heat map showing the pairwise Spearman correlations among various tissues.
Figure 6.
Quantitative real-time PCR confirmation of the transcript expression obtained by high-throughput sequencing. K: kidney; L: liver; O: ovary; G: gill; B: brain; H: heart; M: muscle.
3.8 Identification of genes under positive selection
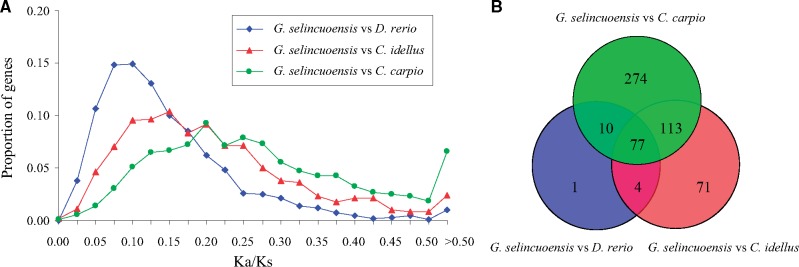
Orthofinder analysis revealed that the numbers of one-to-one orthologous genes between G. selincuoensis and D. rerio, C. idellus and C. carpio were 4,862, 9,011 and 5,635, respectively. Among them, 1,565 one-to-one orthologous genes (single copy genes) present in the four species. The Ka/Ks peak between G. selincuoensis and C. carpio was higher than that observed between G. selincuoensis and other two fishes (Fig. 7A). Only two, one and four orthologous genes with strong positive selection (Ka/Ks > 1.0) were detected between G. selincuoensis and D. rerio, C. idellus and C. carpio, respectively, and none of them present in all three pairs. A total of 77 orthologous genes with Ka/Ks >0.3 were observed between G. selincuoensis and other three species (Supplementary Table S6, Fig. 7B). Of them, 45 were assigned to GO terms, such as ‘binding’, ‘catalytic activity’, ‘metabolic process’ and ‘reproduction’ (Supplementary Fig. S6).
Figure 7.
Comparative analysis of the one-to-one orthologous genes between G. selincuoensis and other cyprinid fishes. (A) Distribution of Ka/Ks ratio. (B) Venn diagram of orthologous genes with Ka/Ks >0.3.
3.9 Detection of microsatellite markers
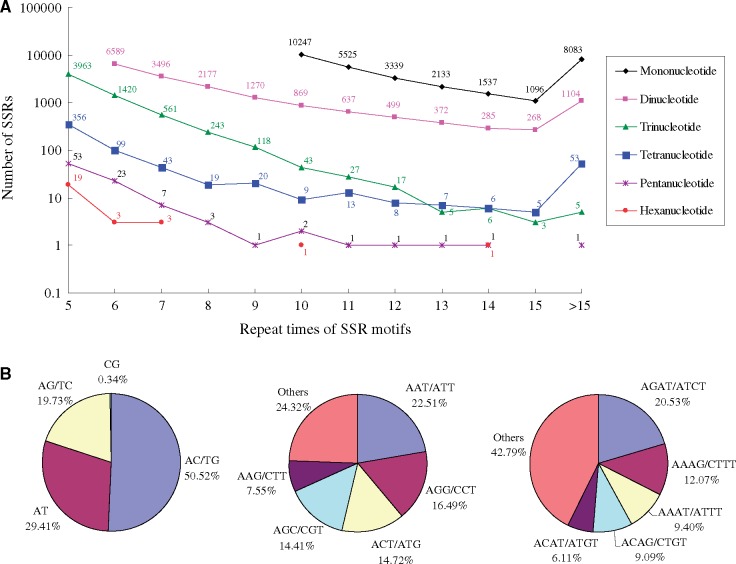
Using software MISA, a total of 56,696 perfect and 12,257 complicated SSRs were identified from 40,609 FL transcripts. The perfect SSRs include 31,960 mononucleotide SSRs, 17,566 dinucleotide SSRs, 6,411 trinucleotide SSRs, 638 tetranucleotide SSRs, 94 pentanucleotide SSRs and 27 hexanucleotide SSRs (Fig. 8A). The number of SSRs gradually decreased along with increasing repeat times of the SSR motifs. Among the dinucleotide SSRs, the most abundant motif was AC/GT (8,874, 50.52%), followed by AT (5,167, 29.41%) and AG/TC (3,465, 19.73%) (Fig. 8B). For trinucleotide, tetranucleotide, pentanucleotide and hexanucleotide SSRs, the most abundant motifs were AAT/ATT (1,443, 22.51%), AGAT/ATCT (131, 20.53%), ATTTG/AAACT (10, 10.64%) and AGCATC (4, 14.81%), respectively.
Figure 8.
Summary of SSRs isolated from the full-length transcripts of G. selincuoensis. (A) The number of SSRs with different repeat times and motifs. (B) The dominant motifs of dinucleotide, trinucleotide and tetranucleotide SSRs.
4. Discussion
Long-read sequencing technology can capture FL transcripts without the need for further assembly, making it more popular in transcriptome analysis.25 In this study, by using RNA-seq and PacBio Iso-Seq, the transcriptome of G. selincuoensis were firstly reported and compared. The average length and N50 length of the FL transcripts (3,509 and 3,870 bp) were much longer than that of the de novo assembled transcripts of the same fish species (815 and 1,479 bp) as well as other fish species.49–52 The de novo assembled transcripts had the larger number than the FL transcripts, however, the length were mainly <1,500 bp in the former and ranged from 1,500 to 5,000 bp in the latter. The percentage of FL transcripts containing complete ORF region in G. selincuoensis (87.7%) was much higher than that observed in other fishes with RNA-seq, such as Oncorhynchus mykiss (57.1%),49Oreochromis mossambicus (13.6%),53Leuciscus waleckii (18.0%)54 and C. carpio (26.2%).55
The public databases such as GO, KEGG, Swissprot and Pfam have been widely used for functional annotation of transcriptome sequences. Nt and Nr consist of non-redundant nucleotide and protein sequences deposited in GenBank and other DNA databases, representing the largest nucleotide and protein databases. In this study, 98.47% and 92.39% of FL transcripts were annotated in Nt and Nr, respectively, indicating that the transcripts contain few non-coding sequences, such as lncRNAs and intergenic sequences. For other databases used for blastx annotation, the highest percentage of transcripts was annotated in KEGG, accounting for 90.0% of all transcripts, followed by 85.11% in Swissprot and 66.31% in KOG. The percentage of annotated transcripts may be related to the number of deposited sequences in the databases. KEGG contains nearly 30.00 million KEGG genes and 22,639 KEGG Orthology,56 Swissprot contains ∼0.56 million proteins,57 and KOG is composed of ∼0.11 million proteins and 4,852 clusters of orthologs.58 The percentages of annotated transcripts in this study were higher than those reported by short-read RNA-Seq analysis, indicating the advantage of long-read sequencing for obtaining real transcriptome transcripts.
PacBio long-read transcriptome sequencing is advantageous over the short-read RNA-Seq in the identification of AS events.59,60 Recently, a pipeline based on all- vs.-all BLAST was proposed by Liu et al.28 to identify AS events from long-read sequences without using a reference sequence. In this study, by using the same pipeline, 2,069 AS events were detected from 75,435 the FL transcripts, with a higher proportion than that detected in Amborella trichopoda.28 Based on RT-PCR, the percentage of confirmed AS events was 80% (16/20) which was similar to that in A. trichopoda (82.9%). Interestingly, among three of the four AS events validated unsuccessfully, the clear band on the agarose gel all represents the higher expressed isoform, and the missing band represents the lower expressed isoform with FPKM values <1 in all tissues. The extremely low expression of one isoform may lead to the failure of RT-PCR validation of AS events. The amplified fragment of the isoform with very low expression is difficult to be detected by agarose gel electrophoresis.
In this study, the gene expression level of each tissue was quantified by mapping Illumina shorts reads to the PacBio FL transcripts. The percentage of housekeeping transcripts (with a minimum of 1 FPKM value in each tissue) (13.9%) was lower than that detected in O. mykiss (17.0%), and higher than O. kisutch.49,61 The difference may be due to variations in sequencing technologies and number of studied tissues. Using various sequencing technologies, a wide range of percentages of housekeeping genes were reported in mouse and human.45,62–64 Different numbers of expressed transcripts were detected among various tissues with the largest number in brain followed by kidney and gill, and the lowest number in liver and muscle, which was similar to that observed in O. mykiss,49O. kisutch,62 mouse63 and human.45 The distribution of the number of tissue-specific transcripts among tissues was also similar to that observed in O. mykiss, O. kisutch, with the largest number in ovary and brain and the lowest number in muscle. Significant correlations in expression were observed between any pairs of heart, gill and kidney, owing to that they all belong to the blood and immune system. The gene expression atlas in this study would provide basic information for researches of genetics and genomics in G. selincuoensis.
Comparative genomic analysis has been widely used to study the genetic bases of adaptation evolution.65 When the reference genome sequence is not available, transcriptome sequence especially obtained by long-read sequencing is a valuable and effective resource for comparative genomic analyses in non-model organisms. In this study, based on one-to-one orthologous genes, G. selincuoensis had a closest evolutionary relationship with C. carpio when compared to D. rerio and C. idellus. However, the mean and peak of Ka/Ks values between G. selincuoensis and C. carpio were both higher than that between G. selincuoensis and other two fishes, indicating that accelerated evolution occurred in G. selincuoensis after split from C. carpio. The accelerated evolution may be associated with the uplift of the QTP. Among the orthologous genes with potential positive selection in G. selincuoensis, Zp3 (zona pellucida sperm-binding protein 3) and Nanog (homeobox transcription factor Nanog) were associated with reproduction and may be involved in adaption to the strong ultraviolet (UV) radiation on the QTP. In G. selincuoensis, fertilization is external, and eggs and sperms are exposed to the strong UV radiation after the shedding from the mature gonads.
Each FL transcript contains 0.75 (56.696/75,435) perfect SSR on average in G. selincuoensis. This SSR frequency was higher than that detected by RNA-Seq in previous studied fishes, such as C. carpio (0.36),66Ctenopharyngodon idella (0.05),15H. molitrix (0.16)67 and G. przewalskii (0.15).68 The difference was mainly due to variation in sequencing technology, de no assembled transcripts had a higher proportion of transcripts with short length, leading to fewer detected rate of SSRs. The most abundant motifs of mononucleotide, dinucleotide and trinucleotide SSRs were A/T, AC/GT and AAT/ATT, respectively, which has already been reported in other fish species.15,66,68 SSRs obtained in this study were closely related to expressed functional genes, and would be useful for future genetic and genomic analyses in G. selincuoensis.
5. Conclusion
In summary, we present here the first transcriptome of G. selincuoensis by using PacBio Iso-Seq and RNA-seq. The FL reference transcriptome comprised 75,435 transcripts with the N50 value of 3,870. Among these FL transcripts, 99.44% were annotated to Nt, Nr, Swissprot, KOG, KEGG, GO and Pfam databases. A number of AS events were detected and validated from the FL transcripts. An atlas of gene expression was obtained by mapping RNA-seq shorts reads to the FL transcripts. Seventy-seven orthologous genes with potential positive selection were identified by comparative genomic analysis. Furthermore, a large number of gene-associated SSRs were identified. Our results would provide an important and valuable foundation for further studies on adaptive evolution, population genetics, conservation and phylogeny in G. selincuoensis and other congeneric fishes.
Supplementary Material
Acknowledgements
We thank Dr Xiaoyun Sui for her assistance during field sampling.
Accession numbers
The sequencing data generated by PacBio Iso-Seq and Illumina RNA-seq have been deposited in the Genome Sequence Archive (GSA; http://gsa.big.ac.cn/) under accession number PRJCA001266.
Funding
This study was supported by the Strategic Priority Research Program of the Chinese Academy of Sciences (XDB31040101 and XDA20050204), the Second Comprehensive Scientific Expedition to the Qinghai-Tibet Plateau, National Natural Science Foundation of China (31601844) and National Basic Research Program of China (2014FY210700).
Conflict of interest
None declared.
References
- 1. Chen Y.F., He D.K., Cai B., Chen Z.M.. 2004, The reproductive strategies of an endemic Tibetan fish, Gymnocypris selincuoensis, J. Freshwater Ecol., 19, 255–62. [Google Scholar]
- 2. Li S., Wang R.. 1990, Maturity speed and genetic analysis of silver carp (Hypophthalmichthys molitrix) and bighead (Aristichthys nobilis) from Changjiang and Zhujiang river systems, J. Fisheries China, 14, 189–97. [Google Scholar]
- 3. Feng X., Yu X., Fu B., et al. 2018, A high-resolution genetic linkage map and QTL fine mapping for growth-related traits and sex in the Yangtze River common carp (Cyprinus carpio haematopterus), BMC Genomics, 19, 230. [DOI] [PMC free article] [PubMed] [Google Scholar]
- 4. Lorenzoni M., Ghetti L., Pedicillo G., Carosi A.. 2010, Analysis of the biological features of the goldfish Carassius auratus in lake Trasimeno (Umbria, Italy) with a view to drawing up plans for population control, Folia Zool., 59, 142–56. [Google Scholar]
- 5. Liu S., Sun Y., Zhang C., Luo K., Liu Y.. 2004, Production of gynogenetic progeny from allotetraploid hybrids red crucian carp× common carp, Aquaculture, 236, 193–200. [Google Scholar]
- 6. Tao J., He D., Kennard M.J., et al. 2018, Strong evidence for changing fish reproductive phenology under climate warming on the Tibetan Plateau, Glob. Change Biol., 24, 2093–104. [DOI] [PubMed] [Google Scholar]
- 7. Chen Y.F., He D.K., Cai B.. 2001, Status and sustainable utilization of fishery resources of Selincuo lake, northern Tibet, Biodivers. Sci., 9, 85–9. [Google Scholar]
- 8. Chen Y., He D., Cao W., Duan Z.. 2002, Growth of selincuo schizothoracini (Gymnocypris selincuoensis) in selincuo lake, Tibeten Platean, Acta Zool. Sin., 48, 667–76. [Google Scholar]
- 9. He D., Chen Y.. 2007, Molecular phylogeny and biogeography of the highly specialized grade schizothoracine fishes (Teleostei: Cyprinidae) inferred from cytochrome b sequences, Chinese Sci. Bull., 52, 777–88. [Google Scholar]
- 10. Ding C., Chen Y., He D., Tao J.. 2015, Validation of daily increment formation in otoliths for Gymnocypris selincuoensis in the Tibetan Plateau, China, Ecol. Evol., 5, 3243–9. [DOI] [PMC free article] [PubMed] [Google Scholar]
- 11. Tao J., Chen Y., He D., Ding C.. 2015, Relationships between climate and growth of Gymnocypris selincuoensis in the Tibetan Plateau, Ecol. Evol., 5, 1693–701. [DOI] [PMC free article] [PubMed] [Google Scholar]
- 12. Carruthers M., Yurchenko A.A., Augley J.J., Adams C.E., Herzyk P., Elmer K.R.. 2018, De novo transcriptome assembly, annotation and comparison of four ecological and evolutionary model salmonid fish species, BMC Genomics, 19, 32. [DOI] [PMC free article] [PubMed] [Google Scholar]
- 13. Seeb J.E., Carvalho G., Hauser L., Naish K., Roberts S., Seeb L.W.. 2011, Single-nucleotide polymorphism (SNP) discovery and applications of SNP genotyping in nonmodel organisms, Mol. Ecol. Resour., 11, 1–8. [DOI] [PubMed] [Google Scholar]
- 14. Zhou Z.C., Dong Y., Sun H.J., et al. 2014, Transcriptome sequencing of sea cucumber (Apostichopus japonicus) and the identification of gene-associated markers, Mol. Ecol. Resour., 14, 127–38. [DOI] [PubMed] [Google Scholar]
- 15. Wan Q., Su J.. 2015, Transcriptome analysis provides insights into the regulatory function of alternative splicing in antiviral immunity in grass carp (Ctenopharyngodon idella), Sci. Rep., 5, 12946. [DOI] [PMC free article] [PubMed] [Google Scholar]
- 16. Lenz T.L., Eizaguirre C., Rotter B., Kalbe M., Milinski M.. 2013, Exploring local immunological adaptation of two stickleback ecotypes by experimental infection and transcriptome-wide digital gene expression analysis, Mol. Ecol., 22, 774–86. [DOI] [PMC free article] [PubMed] [Google Scholar]
- 17. Huang Y., Chain F.J., Panchal M., et al. 2016, Transcriptome profiling of immune tissues reveals habitat-specific gene expression between lake and river sticklebacks, Mol. Ecol., 25, 943–58. [DOI] [PMC free article] [PubMed] [Google Scholar]
- 18. Elmer K.R., Fan S., Gunter H.M., et al. 2010, Rapid evolution and selection inferred from the transcriptomes of sympatric crater lake cichlid fishes, Mol. Ecol., 19, 197–211. [DOI] [PubMed] [Google Scholar]
- 19. Singh P., Börger C., More H., Sturmbauer C.. 2017, The role of alternative splicing and differential gene expression in cichlid adaptive radiation, Genome Biol. Evol., 9, 2764–81. [DOI] [PMC free article] [PubMed] [Google Scholar]
- 20. Ekblom R., Galindo J.. 2011, Applications of next generation sequencing in molecular ecology of non-model organisms, Heredity, 107, 1–15. [DOI] [PMC free article] [PubMed] [Google Scholar]
- 21. Abdel-Ghany S.E., Hamilton M., Jacobi J.L., et al. 2016, A survey of the sorghum transcriptome using single-molecule long reads, Nat. Commun., 7, 11706. [DOI] [PMC free article] [PubMed] [Google Scholar]
- 22. Wang B., Tseng E., Regulski M., et al. 2016, Unveiling the complexity of the maize transcriptome by single-molecule long-read sequencing, Nat. Commun., 7, 11708. [DOI] [PMC free article] [PubMed] [Google Scholar]
- 23. Au K.F., Sebastiano V., Afshar P.T., et al. 2013, Characterization of the human ESC transcriptome by hybrid sequencing, Proc. Natl. Acad. Sci. USA, 110, E4821–30. [DOI] [PMC free article] [PubMed] [Google Scholar]
- 24. Li Y., Fang C., Fu Y., et al. 2018, A survey of transcriptome complexity in Sus scrofa using single-molecule long-read sequencing, DNA Res., 25, 421–37. [DOI] [PMC free article] [PubMed] [Google Scholar]
- 25. Rhoads A., Au K.F.. 2015, PacBio sequencing and its applications, Genomics. Proteomics Bioinformatics, 13, 278–89. [DOI] [PMC free article] [PubMed] [Google Scholar]
- 26. Chen S.Y., Deng F., Jia X., Li C., Lai S.J.. 2017, A transcriptome atlas of rabbit revealed by PacBio single-molecule long-read sequencing, Sci. Rep., 7, 7648. [DOI] [PMC free article] [PubMed] [Google Scholar]
- 27. Cheng B., Furtado A., Henry R.J.. 2017, Long-read sequencing of the coffee bean transcriptome reveals the diversity of full-length transcripts, Gigascience, 6, 1–13. [DOI] [PMC free article] [PubMed] [Google Scholar]
- 28. Liu X., Mei W., Soltis P.S., Soltis D.E., Barbazuk W.B.. 2017, Detecting alternatively spliced transcript isoforms from single-molecule long-read sequences without a reference genome, Mol. Ecol. Resour., 17, 1243–56. [DOI] [PubMed] [Google Scholar]
- 29. Nudelman G., Frasca A., Kent B., et al. 2018, High resolution annotation of zebrafish transcriptome using long-read sequencing, Genome Res., 28, 1415–25. [DOI] [PMC free article] [PubMed] [Google Scholar]
- 30. Workman R.E., Myrka A.M., Wong G.W., Tseng E., Welch K.C. Jr, Timp W.. 2018, Single-molecule, full-length transcript sequencing provides insight into the extreme metabolism of the ruby-throated hummingbird Archilochus colubris, Gigascience, 7, 1–12. [DOI] [PMC free article] [PubMed] [Google Scholar]
- 31. Chen S., Zhou Y., Chen Y., Gu J.. 2018, fastp: an ultra-fast all-in-one FASTQ preprocessor, Bioinformatics, 34, i884–90. [DOI] [PMC free article] [PubMed] [Google Scholar]
- 32. Haas B.J., Papanicolaou A., Yassour M., et al. 2013, De novo transcript sequence reconstruction from RNA-seq using the Trinity platform for reference generation and analysis, Nat. Protoc., 8, 1494–512. [DOI] [PMC free article] [PubMed] [Google Scholar]
- 33. Fu L., Niu B., Zhu Z., Wu S., Li W.. 2012, CD-HIT: accelerated for clustering the next-generation sequencing data, Bioinformatics, 28, 3150–2. [DOI] [PMC free article] [PubMed] [Google Scholar]
- 34. Camacho C., Coulouris G., Avagyan V., et al. 2009, BLAST+: architecture and applications, BMC Bioinformatics, 10, 421. [DOI] [PMC free article] [PubMed] [Google Scholar]
- 35. Buchfink B., Xie C., Huson D.H.. 2015, Fast and sensitive protein alignment using DIAMOND, Nat. Methods, 12, 59–60. [DOI] [PubMed] [Google Scholar]
- 36. Finn R.D., Clements J., Eddy S.R.. 2011, HMMER web server: interactive sequence similarity searching, Nucleic Acids Res., 39, W29–37. [DOI] [PMC free article] [PubMed] [Google Scholar]
- 37. Conesa A., Götz S., García-Gómez J.M., Terol J., Talón M., Robles M.. 2005, Blast2GO: a universal tool for annotation, visualization and analysis in functional genomics research, Bioinformatics, 21, 3674–6. [DOI] [PubMed] [Google Scholar]
- 38. Shimizu K., Adachi J., Muraoka Y.. 2006, ANGLE: a sequencing errors resistant program for predicting protein coding regions in unfinished cDNA, J. Bioinform. Comput. Biol., 4, 649–64. [DOI] [PubMed] [Google Scholar]
- 39. Li A., Zhang J., Zhou Z.. 2014, PLEK: a tool for predicting long non-coding RNAs and messenger RNAs based on an improved k-mer scheme, BMC Bioinformatics, 15, 311. [DOI] [PMC free article] [PubMed] [Google Scholar]
- 40. Sun L., Luo H., Bu D., et al. 2013, Utilizing sequence intrinsic composition to classify protein-coding and long non-coding transcripts, Nucleic Acids Res., 41, e166. [DOI] [PMC free article] [PubMed] [Google Scholar]
- 41. Kong L., Zhang Y., Ye Z.Q., et al. 2007, CPC: assess the protein-coding potential of transcripts using sequence features and support vector machine, Nucleic Acids Res., 35, W345–9. [DOI] [PMC free article] [PubMed] [Google Scholar]
- 42. Finn R.D., Bateman A., Clements J., et al. 2014, Pfam: the protein families database, Nucleic Acids Res., 42, D222–30. [DOI] [PMC free article] [PubMed] [Google Scholar]
- 43. Langmead B., Salzberg S.L.. 2012, Fast gapped-read alignment with Bowtie 2, Nat. Methods, 9, 357–9. [DOI] [PMC free article] [PubMed] [Google Scholar]
- 44. Li B., Dewey C.N.. 2011, RSEM: accurate transcript quantification from RNA-Seq data with or without a reference genome, BMC Bioinformatics, 12, 323. [DOI] [PMC free article] [PubMed] [Google Scholar]
- 45. Fagerberg L., Hallström B.M., Oksvold P., et al. 2014, Analysis of the human tissue-specific expression by genome-wide integration of transcriptomics and antibody-based proteomics, Mol. Cell. Proteomics, 13, 397–406. [DOI] [PMC free article] [PubMed] [Google Scholar]
- 46. Emms D.M., Kelly S.. 2015, OrthoFinder: solving fundamental biases in whole genome comparisons dramatically improves orthogroup inference accuracy, Genome Biol., 16, 157. [DOI] [PMC free article] [PubMed] [Google Scholar]
- 47. Zhang Z., Xiao J., Wu J., et al. 2012, ParaAT: a parallel tool for constructing multiple protein-coding DNA alignments, Biochem. Biophys. Res. Commun., 419, 779–81. [DOI] [PubMed] [Google Scholar]
- 48. Wang D., Zhang Y., Zhang Z., Zhu J., Yu J.. 2010, KaKs_Calculator 2.0: a toolkit incorporating gamma-series methods and sliding window strategies, Genomics Proteomics Bioinformatics, 8, 77–80. [DOI] [PMC free article] [PubMed] [Google Scholar]
- 49. Salem M., Paneru B., Al-Tobasei R., et al. 2015, Transcriptome assembly, gene annotation and tissue gene expression atlas of the rainbow trout, PLoS One, 10, e0121778. [DOI] [PMC free article] [PubMed] [Google Scholar]
- 50. Zhang R., Ludwig A., Zhang C., et al. 2015, Local adaptation of Gymnocypris przewalskii (Cyprinidae) on the Tibetan Plateau, Sci. Rep., 5, 9780. [DOI] [PMC free article] [PubMed] [Google Scholar]
- 51. Feng X., He D., Shan G., Tao J., Chen Y.. 2017, Integrated analysis of mRNA and miRNA expression profiles in Ptychobarbus dipogon and Schizothorax oconnori, insight into genetic mechanisms of high altitude adaptation in the schizothoracine fishes, Gene Rep., 9, 74–80. [Google Scholar]
- 52. Zhu C., Pan Z., Wang H., Chang G., Wu N., Ding H.. 2017, De novo assembly, characterization and annotation for the transcriptome of Sarcocheilichthys sinensis, PLoS One, 12, e0171966. [DOI] [PMC free article] [PubMed] [Google Scholar]
- 53. Zhu W., Wang L., Dong Z., et al. 2016, Comparative transcriptome analysis identifies candidate genes related to skin color differentiation in red tilapia, Sci. Rep., 6, 31347. [DOI] [PMC free article] [PubMed] [Google Scholar]
- 54. Xu J., Ji P., Wang B., et al. 2013, Transcriptome sequencing and analysis of wild Amur Ide (Leuciscus waleckii) inhabiting an extreme alkaline-saline lake reveals insights into stress adaptation, PLoS One, 8, e59703. [DOI] [PMC free article] [PubMed] [Google Scholar]
- 55. Ji P., Liu G., Xu J., et al. 2012, Characterization of common carp transcriptome: sequencing, de novo assembly, annotation and comparative genomics, PLoS One, 7, e35152. [DOI] [PMC free article] [PubMed] [Google Scholar]
- 56. Kanehisa M., Goto S., Sato Y., Furumichi M., Tanabe M.. 2012, KEGG for integration and interpretation of large-scale molecular data sets, Nucleic Acids Res., 40, D109–14. [DOI] [PMC free article] [PubMed] [Google Scholar]
- 57. Boeckmann B., Bairoch A., Apweiler R., et al. 2003, The SWISS-PROT protein knowledgebase and its supplement TrEMBL in 2003, Nucleic Acids Res., 31, 365–70. [DOI] [PMC free article] [PubMed] [Google Scholar]
- 58. Tatusov R.L., Fedorova N.D., Jackson J.D., et al. 2003, The COG database: an updated version includes eukaryotes, BMC Bioinformatics, 4, 41. [DOI] [PMC free article] [PubMed] [Google Scholar]
- 59. Tilgner H., Grubert F., Sharon D., Snyder M.P.. 2014, Defining a personal, allele-specific, and single-molecule long-read transcriptome, Proc. Natl. Acad. Sci. USA, 111, 9869–74. [DOI] [PMC free article] [PubMed] [Google Scholar]
- 60. Weirather J.L., Afshar P.T., Clark T.A., et al. 2015, Characterization of fusion genes and the significantly expressed fusion isoforms in breast cancer by hybrid sequencing, Nucleic Acids Res., 43, e116. [DOI] [PMC free article] [PubMed] [Google Scholar]
- 61. Kim J.H., Leong J.S., Koop B.F., Devlin R.H.. 2016, Multi-tissue transcriptome profiles for coho salmon (Oncorhynchus kisutch), a species undergoing rediploidization following whole-genome duplication, Mar. Genomics, 25, 33–7. [DOI] [PubMed] [Google Scholar]
- 62. Su A.I., Wiltshire T., Batalov S., et al. 2004, A gene atlas of the mouse and human protein-encoding transcriptomes, Proc. Natl. Acad. Sci. USA, 101, 6062–7. [DOI] [PMC free article] [PubMed] [Google Scholar]
- 63. Jongeneel C.V., Delorenzi M., Iseli C., et al. 2005, An atlas of human gene expression from massively parallel signature sequencing (MPSS), Genome Res., 15, 1007–14. [DOI] [PMC free article] [PubMed] [Google Scholar]
- 64. Ramsköld D., Wang E.T., Burge C.B., Sandberg R.. 2009, An abundance of ubiquitously expressed genes revealed by tissue transcriptome sequence data, PLoS Comput. Biol., 5, e1000598. [DOI] [PMC free article] [PubMed] [Google Scholar]
- 65. Star B., Nederbragt A.J., Jentoft S., et al. 2011, The genome sequence of Atlantic cod reveals a unique immune system, Nature, 477, 207–10. [DOI] [PMC free article] [PubMed] [Google Scholar]
- 66. Li G., Zhao Y., Liu Z., et al. 2015, De novo assembly and characterization of the spleen transcriptome of common carp (Cyprinus carpio) using Illumina paired-end sequencing, Fish Shellfish Immun., 44, 420–9. [DOI] [PubMed] [Google Scholar]
- 67. Fu B., He S.. 2012, Transcriptome analysis of silver carp (Hypophthalmichthys molitrix) by paired-end RNA sequencing, DNA Res., 19, 131–42. [DOI] [PMC free article] [PubMed] [Google Scholar]
- 68. Tong C., Zhang C., Zhang R., Zhao K.. 2015, Transcriptome profiling analysis of naked carp (Gymnocypris przewalskii) provides insights into the immune-related genes in highland fish, Fish Shellfish Immun., 46, 366–77. [DOI] [PubMed] [Google Scholar]
Associated Data
This section collects any data citations, data availability statements, or supplementary materials included in this article.


