Abstract
Purpose
PET quantification based on standardized uptake values (SUV) is hampered by several factors, in particular by variability in PET acquisition settings and data analysis methods. Quantitative PET/CT studies acquired during a multicentre trial require harmonization of imaging procedures to maximize study power. The aims of this study were to determine which phantoms are most suitable for detecting differences in image quality and quantification, and which methods for defining volumes of interest (VOI) are least sensitive to these differences.
Methods
The most common accreditation phantoms used in oncology FDG PET/CT trials were scanned on the same scanner. These phantoms were those used by the Society of Nuclear Medicine Clinical Trials Network (SNM-CTN), the European Association of Nuclear Medicine/National Electrical Manufacturers Association (EANM/NEMA) and the American College of Radiology (ACR). In addition, tumour SUVs were derived from ten oncology whole-body examinations performed on the same PET/CT system. Both phantom and clinical data were reconstructed using different numbers of iterations, subsets and time-of-flight kernel widths. Subsequently, different VOI methods (VOIA50%, VOImax, VOI3Dpeak, VOI2Dpeak) were applied to assess the impact of changes in image reconstruction settings on SUV and recovery coefficients (RC).
Results
All phantoms demonstrated sensitivity for detecting changes in SUV and RC measures in response to changes in image reconstruction settings and VOI analysis methods. The SNM-CTN and EANM/NEMA phantoms showed almost equal sensitivity in detecting RC differences with changes in image characteristics. Phantom and clinical data demonstrated that the VOI analysis methods VOIA50% and VOImax gave SUV and RC values with large variability in relation to image characteristics, whereas VOI3Dpeak and VOI2Dpeak were less sensitive to these differences.
Conclusion
All three phantoms may be used to harmonize parameters for data acquisition, processing and analysis. However, the SNM-CTN and EANM/NEMA phantoms are the most sensitive to parameter changes and are suitable for harmonizing SUV quantification based on 3D VOIs, such as VOIA50% and VOI3Dpeak, and VOImax. Variability in SUV quantification after harmonization could be further minimized using VOI3Dpeak analysis, which was least sensitive to residual variability in image quality and quantification.
Keywords: PET/CT, Quantification, Standardization, Harmonization, Accreditation
Introduction
The use of 18F-FDG, in combination with a hybrid PET and X-ray CT scanner, is a valuable, noninvasive clinical tool for oncology applications. To date, FDG PET/CT is widely used for both diagnosis and staging of various malignancies [1, 2]. Moreover, quantitative FDG PET/CT imaging is also a valuable tool for assessment of an individual’s response to therapy and for clinical trials of novel cancer therapies because it can measure metabolic changes, which are a better indicator of response than anatomical size changes [3–6]. Success with this approach has been demonstrated in several studies using FDG for evaluation of therapy-induced changes in metabolic activity in cancers including lung [7] and gastrointestinal cancer [8].
The standardized uptake value (SUV) is the standard semiquantitative measure derived from whole-body FDG PET/CT examinations. SUV represents the tissue radioactivity concentration at a certain time normalized to injected dose and body weight [9]. There are, however, several factors that can give rise to bias in SUV measurements [10–12]. Some of these are related directly to patient preparation and execution of the PET examination, such as fasting period and uptake time, others relate to the calibration of the system. Detailed overviews of all these factors are available [10–12]. With respect to technical or physics related factors, some of the most important ones are choice of volumes of interest (VOI) and both acquisition and reconstruction settings, the latter because of their impact on spatial image resolution and partial volume effects [9, 13]. Consequently, variability in SUV can be expected for scans acquired at different centres when no common imaging procedure is in place [14–16]. It is well known, however, that different PET/CT scanners with corresponding image analysis platforms cannot always use common a priori parameters due to differences in algorithms and/or their implementation. This has led to the concept of harmonized image acquisition and analysis approaches, where a number of performance parameters or image characteristics (e.g. spatial resolution, signal to noise level, etc.) are first specified a posteriori in order to define required acquisition, processing and analysis settings for the different systems. In other words, sites need and may use different PET/CT systems, reconstruction methods and settings, but these should be used, calibrated and set in such a way that at the end comparable image characteristics and SUVs between different sites are obtained. Such a harmonization approach ensures comparable quantitative data in a multicentre study. A posteriori determination of acquisition, processing and analysis parameters can be achieved by implementing an intercentre cross-calibration procedure for all sites participating in a clinical trial [17]. Even after a rigorous cross calibration or harmonization procedure across imaging sites, however, residual differences in SUV may still be present and could pose problems in multicentre clinical studies. In such cases, data analysis procedures and/or use of VOI methods that are not sensitive to residual differences in (quantitative) image characteristics could be employed to further reduce differences in SUV between imaging sites [18].
As part of harmonizing PET/CT performance between sites, several organizations, including the American College of Radiology (ACR), the Society of Nuclear Medicine Clinical Trials Network (SNM-CTN) and the European Association of Nuclear Medicine (EANM), have set up PET/CT validation procedures as part of site accreditation for multicentre oncology trials. Unfortunately, these organizations use different phantoms and specifications to assess PET/CT system performance. The purpose of the present study was to compare these different scanner validation procedures for their ability to detect differences in quantitative image characteristics. To this end, all accreditation experiments were performed on the same PET/CT scanner and image characteristics were modified by varying reconstruction settings, thereby simulating differences in image characteristics that can be encountered in a multicentre study. The second aim of this study was to assess which VOI method, used for deriving various SUV measures, is least sensitive to residual variability in image quality.
Materials and methods
Phantom study
Three phantoms that have been proposed for scanner validation/accreditation purposes were investigated: the National Electrical Manufacturers Association (NEMA) NU2 image quality phantom, the ACR phantom and the SNM-CTN anthropomorphic thorax phantom.
NEMA NU2 image quality phantom
The modified NEMA NU2 image quality phantom (Data Spectrum, Hillsborough, NC), as used by the EARL accreditation program and described in NEMA Standards Publication NU 2–2001 [19]. The phantom has an interior length of 18 cm and contains six fillable spheres of 10, 13, 17, 22, 28 and 37 mm diameter. The large (9,700 ml) background compartment of the phantom was filled with a 1.7 kBq ml−1 FDG solution. All spheres were filled with an activity concentration of 17 kBq ml−1, resulting in a sphere to background activity concentration ratio (SBR) of 10. The phantom was filled as described by Boellaard et al. [17].
ACR phantom
The ACR phantom, which is a fillable cylindrical phantom with a diameter of 20 cm [20]. Attached to the lid of the phantom are seven thin-walled cylinders. Four with diameters of 8, 12, 16 and 25 mm are fillable. The other three have a diameter of 25 mm and are permanently filled with nonradioactive air, water and Teflon. The phantom was filled according to the specifications described in the ACR manual. In brief, the background compartment (5,700 ml) was filled with a 4.5 kBq ml−1 FDG solution and all cylinders with an 11.3 kBq ml−1 FDG solution, resulting in a cylinder to background ratio of 2.5.
SNM-CTN phantom
The SNM-CTN anthropomorphic thorax phantom, called PET simulator, contains several spheres located at different positions within the phantom. As this phantom is used in the SNM-CTN accreditation programme for which lesion detectability is one of the performance criteria for accreditation, we cannot disclose any details on the number, size and location of these spheres. This phantom was filled according to the SNM-CTN guidelines, resulting in a SBR of approximately 4. A summary of the main characteristics of the three phantoms is presented Table 1.
Table 1.
Overview of phantoms
| Phantom | Characteristics | Realistic simulation |
|---|---|---|
| ACR | Contains uniform contrast and resolution objects. Widely used (more than 1,000 sites) | Least anthropomorphic |
| NEMA NU-2 image quality | Widest range of spheres to assess quantitative performance. Reasonable level of attenuation | Somewhat anthropomorphic |
| SNM-CTN | Anthropomorphic, geometry very close to real patient | Most anthropomorphic |
Scanner
All studies were performed using a Gemini TF PET/CT scanner (Philips Healthcare, Cleveland, OH). This is a fully 3D time-of-flight (ToF) PET scanner combined with a 64-slice Brilliance CT scanner. The PET component consists of lutetium-yttrium oxyorthosilicate (LYSO) crystals and has an axial field of view of 180 mm. The transaxial spatial resolution is 4.8 mm [21]. All scans were performed using the vendor-provided whole-body PET/CT acquisition protocols and a 50 % bed overlap.
Patient study
Ten randomly selected patients, diagnosed with oesophageal, lung and colorectal cancer and lymphoma, were included. All patients underwent a whole-body protocol with 2 min per bed position following a typical FDG administration of 185 MBq. All scans were performed using the whole-body PET/CT acquisition protocol as provided and recommended by the vendor. This protocol was executed in our hospital using an acquisition of 2 min per bed position and the default reconstruction algorithm plus settings as shown in Table 2. Furthermore, a 50 % bed overlap was applied. The injected dose was adjusted based on patient weight and the studies were performed according to European guidelines [17]. The two most FDG-avid lesions per patient were identified and used for assessment of SUV. Data were taken from on-going clinical investigations which were current at the time of the present study. A general waiver for the use of these studies and data for scientific purposes was provided by the Medical Ethics Review Committee of the hospital.
Table 2.
Reconstruction protocols
| Recon_1 | Recon_2 | Recon_3 | Default | Recon_4 | Recon_5 | |
|---|---|---|---|---|---|---|
| Subsets | 20 | 20 | 20 | 33 | 33 | 33 |
| Iterations | 1 | 2 | 3 | 3 | 3 | 3 |
| ToF kernel width (cm) | 14.1 | 14.1 | 14.1 | 14.1 | 18.7 | 18.7 |
| Blob radiusa | 2.5 | 2.5 | 2.5 | 2.5 | 2.5 | 1.3 |
Spherical elements with overlapping boundaries used for discretization of the image domain
Reconstruction protocol
Phantom and patient data were reconstructed using a line of response ordered-subsets expectation maximization (OSEM) reconstruction method including ToF information with 33 subsets, three iterations and a ToF kernel width of 14.1 cm (default settings). Images were reconstructed with an image matrix size of 144 × 144 and a voxel size of 4 × 4 × 4 mm. Attenuation correction was performed using the CT transmission data and scatter was estimated using a ToF single scatter simulation algorithm as implemented by the manufacturer. To vary image characteristics, including image resolution and noise, additional reconstructions were performed while changing the number of iterations, the number of subsets and the ToF kernel width. A detailed overview of the various reconstructions settings used in this study is presented in Table 2. The purpose of varying image reconstruction settings was to simulate variability in image quality and resolution as seen in a multicentre setting, but without the corresponding “added complexity” of interpatient variability.
Analysis
The three most commonly used and recommended VOI definition methods were applied to determine the SUV of lesions (clinical data) or SUV recovery coefficients (RC) in the spheres (SNM-CTN and EANM/NEMA phantom data only) which can be determined as the ratio of the measured to known activity concentrations. The VOI methods used in this study were: a 3D isocontour at 50 % of the maximum voxel value within the tumour adjusted for local background (VOIA50%) [13, 17], a maximum, i.e. the voxel with the highest uptake within the tumour (VOImax) and a 3D peak, using a spherical VOI of 1.2 cm diameter positioned around the voxel with the highest uptake (VOI3Dpeak) [13, 22]. The methods were implemented using software developed inhouse. The implementation and use of these methods have been described in detail by Cheebsumon et al. [23]. In brief, each method is initialized by a user-defined starting point within the tumour after which the maximum voxel value within the tumour is identified. Next, 3D region growing is performed to derive the various 3D VOIs.
For comparison, 2D peak regions of interest (ROIs) were defined in the ACR phantom (VOI2Dpeak), as specified in the ACR phantom manual. These circular ROIs of 1.2 cm diameter were located centrally in each of the small cylinders of the ACR phantom and were defined in seven transaxial slices. For the EANM/NEMA and SNM-CTN phantoms, VOI2Dpeak was located centrally in each visible sphere in a single axial plane.
For the phantom studies, RCs for all spheres and VOIs were calculated as the ratios of measured activity concentrations within the VOIs to the known (true) activity concentrations within the spheres. The precision of the latter measurement was better than 2 % as calculated based on three repeated measurements. In patients true activity concentrations in the lesions were not known. Therefore, SUV obtained by applying each of the four VOIs to the two identified lesions per patient were compared, concentrating on differences in SUV depending on the VOI method or image characteristics.
The largest differences (LD) in SUV and RC between reconstructions (i.e. the differences between the highest and lowest SUV and RC) were used to quantify sensitivity to image quality. In the phantom studies, this parameter was calculated for each sphere and phantom as LDRC = RChighest – RClowest among reconstructions for each sphere, and with the clinical data for each lesion as LDSUV = SUVhighest – SUVlowest among reconstructions perlesion. Clinicaldata werealso analysed in relation to lesion metabolic volume, based on the volume of the VOIA50%.
The LD was chosen as it is a direct measure of the changes in RC and SUV as functions of the image characteristics and VOI methods. A large change in LD represents a high sensitivity for a change in SUV in relation to image characteristics and VOI method.
It should be pointed out that the reconstructions used were only those that allowed automated generation of VOIA50%, VOI3Dpeak and VOImax for all phantoms and spheres/tumours, i.e. they contained a high degree of filtering, as a low number of iterations would have resulted in very low image contrasts, making VOI generation impossible. This approach guaranteed that LDs were compared in a consistent manner among the various VOI methods, phantom and clinical studies and within a clinically relevant range.
Results
Comparison of phantoms
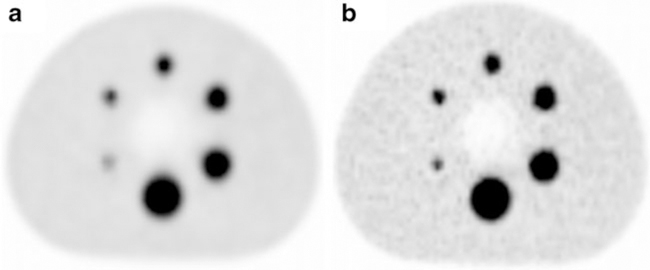
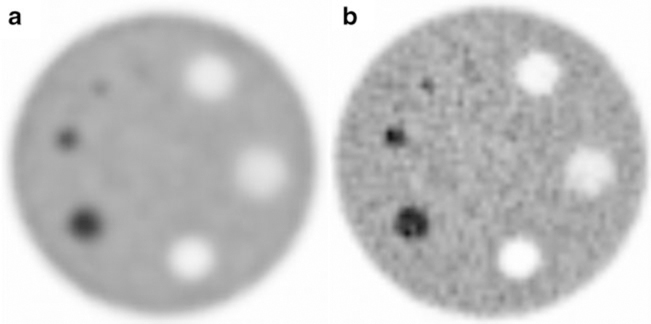
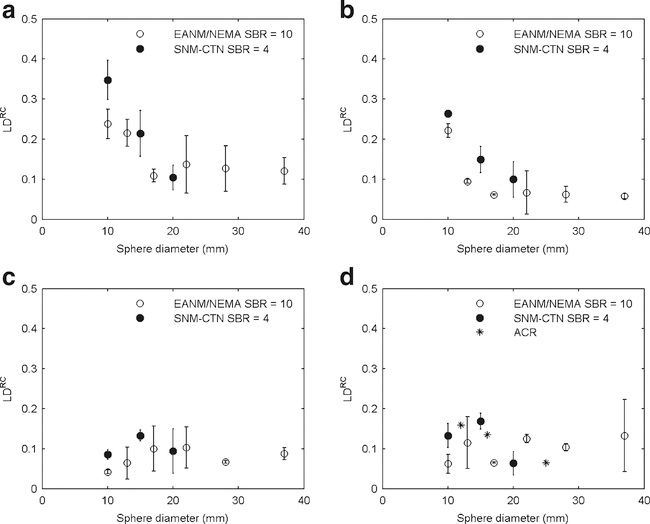
Figures 1 and 2 qualitatively illustrate image quality in relation to reconstruction settings for the NEMA NU2 and ACR phantoms. The SNM-CTN phantom is not shown because this phantom is also used to assess the lesion detectability performance by the SNM-CTN and revealing some of the sphere locations could potentially interfere with the SNM-CTN accreditation programme. Figure 3 shows LDs in RC in relation to sphere diameter and for each of the four different VOI methods. For VOIA50% and VOImax, similar differences in LDRC were seen for the SNM-CTN and EANM/NEMA phantoms. Furthermore, the use of VOI3Dpeak and VOI2Dpeak yielded LDRC in the same range regardless of the phantom being evaluated.
Fig. 1.
Transverse images of the EANM/NEMA phantom reconstructed with the a recon_1 and b recon_5 protocols (see Table 2). Images are in order of increasing resolution
Fig. 2.
Transverse images of the ACR phantom reconstructed with the a recon_1 and b recon_5 protocols (see Table 2). Images are in order of increasing resolution
Fig. 3.
LDRC in relation to sphere diameter for the EANM/NEMA, SNM-CTN and ACR phantoms and SBRs of 10 and 4 for a VOImax, b VOIA50%, c VOI3Dpeak and d VOI2Dpeak. The LDRC values shown were derived from two experiments (except for the ACR phantom). The 8-mm data are omitted to avoid unbalanced comparison because for the 8-mm sphere it was not possible to derive all VOIs for all phantoms
Comparison of VOI definition methods
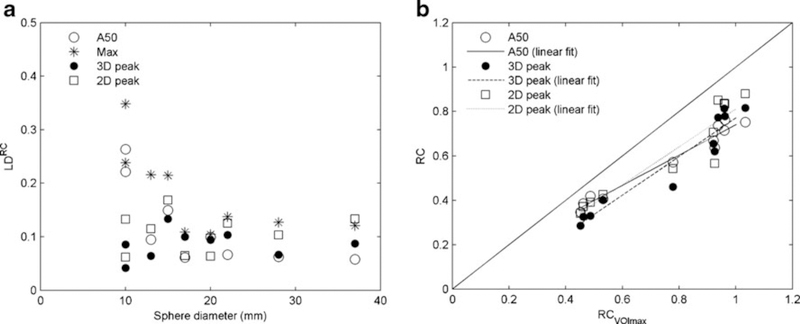
Figure 4a shows pooled data from all phantoms. VOImax provided the highest variability in LDRC, followed by VOIA50%, while, in general, VOI2Dpeak and VOI3Dpeak resulted in the smallest variability in LDRC. As also shown in Fig. 4a, for spheres with diameters larger than 15 mm, LDRC was fairly constant. For sphere diameters smaller than 15 mm, however, variability increased for VOImax and the VOIA50%. VOIA50%, VOI3Dpeak and VOI2Dpeak showed strong correlations with VOImax (0.97, 0.92 and 0.87, respectively). The slope of the regression line for VOIA50%, however, was lower than that for VOI3Dpeak and VOI2Dpeak (0.70 vs. 0.82 and 0.85, respectively; Fig. 4b). This latter implies that on average, the use of VOIA50% may result in a somewhat smaller range of SUV/RC between patients/lesions or spheres/phantoms than those obtained with VOI3Dpeak.
Fig. 4.
a LDRC in relation to sphere diameter for four VOI definition methods using data from all three phantoms, b RCs derived using different VOI methods in relation to VOImax (default reconstruction settings). Note that for the ACR phantom, containing high-contrast cylindrical objects, only 2D ROIs were applied. Therefore, we could not compare all VOI methods in this phantom and consequently, no results for the ACR phantom are shown
Patient study: SUV sensitivity to image quality for various VOIs
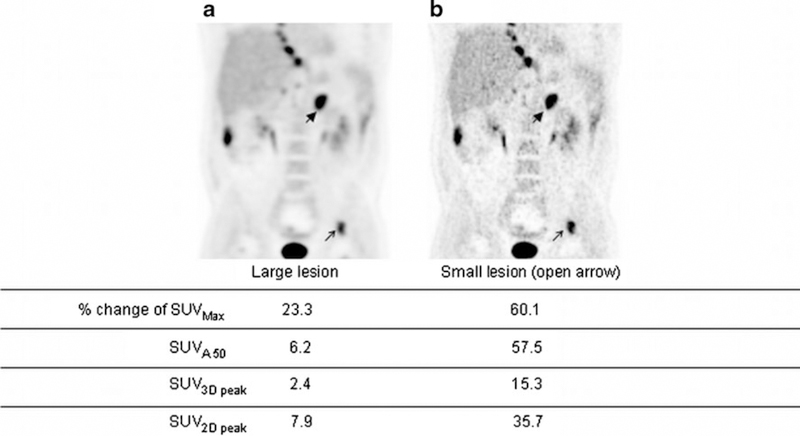
Images reconstructed with various numbers of iterations, numbers of subsets and ToF kernel widths for a typical patient study are shown in Fig. 5. Figure 5a shows the image with the lowest resolution and Fig. 5b shows the image using a larger ToF kernel width and blob radius (highest resolution and/or level of convergence of the settings used). SUVmax showed the largest percentage change, followed by SUVA50%, SUV2Dpeak and SUV3Dpeak. This indicates that SUVmax was the most sensitive VOI method amongst the four tested to changes in image characteristics (caused by differences in convergence by changing the iterative reconstruction settings).
Fig. 5.
Coronal whole-body images reconstructed using two different sets of image reconstruction protocols: a recon_1, b recon_5 (see Table 2) in order of increasing image resolution. % change reflects largest change due to variation in reconstruction settings
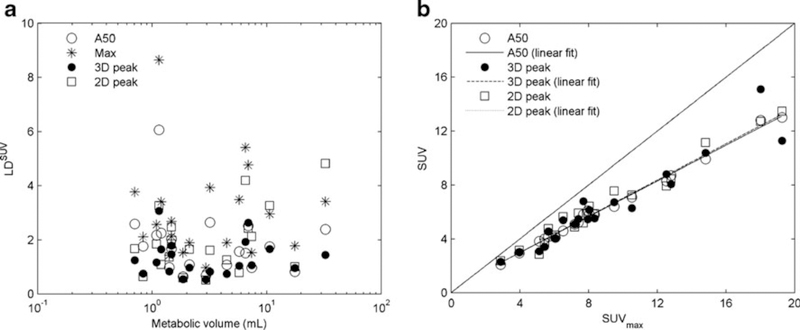
LDSUV in relation to metabolic volume for several VOI methods is illustrated in Fig. 6a. In line with the phantom results, SUV3Dpeak seemed to be less sensitive to image quality than either SUVA50% or SUVmax.In Fig. 6b SUVA50% and SUV3Dpeak are plotted against SUVmax using images reconstructed with default settings. Again, a strong correlation between the various SUV measures was observed(SUVmax vs.SUVA50%, SUV3Dpeak and SUV2Dpeak, 0.99, 0.90 and 0.92, respectively). Slopes for the SUVA50%, SUV3Dpeak and SUV2Dpeak data were 0.66, 0.67 and 0.68 respectively, indicating a 34 %, 33 % and 32 % smaller intersubject range in SUV than for SUVmax.
Fig. 6.
a LDSUV in relation to metabolic volume in ten patients using the four VOI definition methods, b SUV derived using different VOI methods in relation to SUVmax (default reconstruction settings)
Discussion
The use of different reconstruction settings, VOI definition methods and SBRs reflects to some extent the differences in PET image characteristics that may be encountered in multicentre trials. The authors realize that it is not possible to cover the entire range of variabilities in image characteristics by changing the reconstruction settings on a single PET system, and this is a limitation of the present study. Therefore, a more extensive evaluation is warranted which should include different PET/CT systems of the same and different types. This would give more comprehensive information on the usefulness of different phantoms and data analysis methods in a multicentre setting. Yet, by using exactly the same phantom scanned on exactly the same PET/CT system and changing image characteristics by changing the reconstruction settings, experimental uncertainty (in filling the phantoms and collecting the data) is minimized, and the experimental set-up used may therefore provide useful insights into the utility of the various phantoms and VOI for obtaining harmonized SUVs.
All phantoms showed a change in RC depending on changes in phantom characteristics and reconstruction settings. Based on these phantom data the following conclusions may be drawn. First, the ACR phantom contains high-contrast cylindrical objects positioned at the lid of the phantom. Therefore, this phantom is mainly suitable for the assessment of SUV2Dpeak data based on a 2D circular ROI, as also indicated in the ACR phantom manual. Consequently, VOIA50%, VOI3Dpeak and VOImax were not estimated for this phantom. With VOI2Dpeak, LDRC was sensitive to reconstruction settings (Fig. 3d), although to a lesser degree than those seen with VOImax for the SNM-CTN and EANM/NEMA phantoms. An advantage of the ACR phantom is that it is relatively easy to fill and that robust measurement specifications are provided by the ACR. Moreover, the presence of a large uniform background compartment also makes this phantom suitable for cross-calibration of the PET/CT system against the dose calibrator used for assaying administered dose in a single phantom experiment. A drawback of the ACR phantom is that the contrast objects are cylindrical and short rather than spherical, and therefore it is less sensitive to processing and image reconstruction parameters.
Both the SNM-CTN and modified EANM/NEMA phantoms were more sensitive for detecting differences in SUV and RC with changes in reconstruction settings, which in turn was facilitated by the ability to use the VOIA50%, VOIMax, VOI3Dpeak and VOI2Dpeak measures. The SNM-CTN phantom was initially designed to assess lesion detectability. It is also anthropomorphic in appearance. The present study showed that the phantom may also be suitable for assessing SUV and RC. A potential drawback of the phantom might be that the spheres are located in different background regions (so each sphere may have a different SBR) and that the range of sphere sizes is limited. Moreover, at present harmonizing specifications for sphere SUV RCs have not yet been provided by the SNM-CTN, although they are expected in the future. The EANM/NEMA phantom has a sensitivity for detecting differences in SUV and RC with changes in image characteristics similar to that of the SNM-CTN phantom. From a physics point of view, the phantom has the advantage of providing RCs for a larger range of sphere sizes, and the spheres are located in a uniform background. In this respect the phantom may be more suitable for use in accreditation programmes attempting to harmonize image quality and quantification (e.g. resolution), but is less suitable for assessing lesion detectability performance than the SNM-CTN phantom (as the latter is more anthropomorphic).
Despite differences between the various accreditation phantoms there are also clear similarities, the most important one being the use of spheres of different sizes as contrast objects. Therefore, as shown recently by Boellaard et al. [13], it seems possible to cross-calibrate harmonizing SUV and RC specifications of the three phantoms, although the SNM-CTN and EANM/NEMA phantoms seem to be more alike in using spherical contrast objects. This cross-calibration of QC programmes could allow mutual acceptance of scanner validation programmes in order to avoid redundant accreditations. However, a prerequisite is that the EANM, ACR and SNM-CTN strive for harmonization of RC specifications (lower and upper limits for RC for each sphere per phantom), which would ensure resolution matching between various image sites after scanner validation/site accreditation. Moreover, those specifications should result in mutually consistent image quality and resolution.
The results obtained from the phantom data when using different VOI methods suggest similar sensitivity to illustrate RC variability in relation to reconstruction settings for VOIA50% and VOImax, while a substantially lower sensitivity was seen when using VOI3Dpeak and VOI2Dpeak. A possible limitation of the present phantom study is the limited number of experiments that we were able to perform due to limited availability of the phantoms. Therefore, clinical evaluations (ten patients, two lesions per patient) were also included in the present study. Similar conclusions can be drawn from the clinical data (Fig. 6). The use of SUV based on VOImax resulted in larger LDsSUV than SUV based on the VOIA50%, while SUV based on VOI3Dpeak and VOI2Dpeak gave the smallest values of LDSUV. Again, this illustrates that use of VOI3Dpeak may provide SUVs that are less sensitive to changes in image characteristics [22]. A possible explanation might be that use of fixed sized 1.2-cm diameter regions or VOIs basically represents a smoothed estimate of the highest uptake value. The inherent (large 1.2-cm) smoothing when using fixed sized regions reduces the effects of differences in image spatial resolution, and consequently smaller differences in SUV between various reconstructions can be expected. In addition, differences in SUV between various reconstructions for spheres equal to or smaller than 1.2 cm are further reduced as partial volume effects (partly) occur within the dimensions of the VOI3Dpeak. Because of the reduced variability of VOI3Dpeak in relation to image characteristics, it is suggested that VOI3Dpeak may be an attractive VOI method for SUV quantification in multicentre trials to compensate for residual differences in image quality and quantification after harmonization and scanner validation has been performed.
Recent findings by Lodge et al. [24] also indicate that SUV based on VOI3Dpeak may be more robust with respect to changes in pixel size, thus making it preferable for use in multicentre studies. Moreover, SUV based on VOI3Dpeak may suffer less from noise-induced bias than SUV based on VOImax [13, 25]. Unfortunately, the method is not yet widely commercially available, and there is the potential for increased variability from fluctuations in VOI boundary locations. Therefore, the use of SUV based on VOImax is still required, because it is easy to obtain, is not observerdependent and is widely available at present. Moreover, SUVs based on VOIA50% and VOI3Dpeak have a smaller intersubject range than those obtained with VOImax, which was observed in both phantom and clinical data. The latter implies that VOImax would be more sensitive to noise as well as to physiological differences in tracer uptake between lesions and between patients. Therefore, it is recommended that SUVs based on both VOIMax and VOI3Dpeak be measured such that the potential benefits and drawbacks of these two methods can be further explored, while retaining clinical feasibility [26].
Conclusion
The phantom and clinical studies in our institutions confirm the need for harmonizing scanners amongst different institutions when carrying out multicentre trials. All three phantoms tested in this study are suitable for the purpose of harmonizing the quantitative performance of various scanners. The ACR phan-tom is suitable for evaluating the quantification obtained using a 2D peak ROI. Both the SNM-CTN and EANM/NEMA phantoms allow the use of VOIA50%, VOI3Dpeak and VOImax ROIs to be evaluated, which show more potential for image quality and quantification harmonization. After harmonization of image characteristics across multiple institutions, a VOI definition method that is least sensitive to residual differences in image quality/resolution should be used to further reduce the effects of these residual interinstitution differences in image quality on SUV. SUVs based on VOI3Dpeak seem to be a promising candidate for the latter purpose.
Acknowledgments
The authors would like to thank the staff of the Department of Nuclear Medicine & PET Research for assistance in performing the PET scans. The authors are also grateful to members of AAPM TG 145, QIBA, QIN and the SNM-CTN for many useful discussions. The study was financially supported in part by Philips Healthcare and by U.S. NCI Contract 24XS036–004 (RIDER).
Footnotes
Conflicts of interest: None.
Contributor Information
Nikolaos E. Makris, Department of Radiology & Nuclear Medicine, VU University Medical Centre, De Boelelaan 1117, 1081 HV Amsterdam, The Netherlands
Marc C. Huisman, Department of Radiology & Nuclear Medicine, VU University Medical Centre, De Boelelaan 1117, 1081 HV Amsterdam, The Netherlands
Paul E. Kinahan, Imaging Research Laboratory, Department of Radiology, University of Washington, Seattle, WA, USA
Adriaan A. Lammertsma, Department of Radiology & Nuclear Medicine, VU University Medical Centre, De Boelelaan 1117, 1081 HV Amsterdam, The Netherlands
Ronald Boellaard, Department of Radiology & Nuclear Medicine, VU University Medical Centre, De Boelelaan 1117, 1081 HV Amsterdam, The Netherlands.
References
- 1.Gupta T, Master Z, Kannan S, Agarwal JP, Ghsoh-Laskar S,Rangarajan V, et al. Diagnostic performance of post-treatment FDG PET or FDG PET/CT imaging in head and neck cancer: a systematic review and meta-analysis. Eur J Nucl Med Mol Imaging. 2011;38:2083–95. [DOI] [PubMed] [Google Scholar]
- 2.Ung YC, Maziak DE, Vanderveen JA, Smith CA, Gulenchyn K,Lacchetti C, et al. 18Fluorodeoxyglucose positron emission tomography in the diagnosis and staging of lung cancer: a systematic review. J Natl Cancer Inst. 2007;99:1753–67. [DOI] [PubMed] [Google Scholar]
- 3.Hicks RJ. Role of 18F-FDG PET in assessment of response in nonsmall cell lung cancer. J Nucl Med. 2009;50 Suppl 1:31S–42S. [DOI] [PubMed] [Google Scholar]
- 4.Czernin J, Weber WA, Herschman HR. Molecular imaging in thedevelopment of cancer therapeutics. Annu Rev Med. 2006;57:99–118. [DOI] [PubMed] [Google Scholar]
- 5.Frank R, Hargreaves R. Clinical biomarkers in drug discovery anddevelopment. Nat Rev Drug Discov. 2003;2:566–80. [DOI] [PubMed] [Google Scholar]
- 6.Weber WA. Assessing tumor response to therapy. J Nucl Med.2009;50 Suppl 1:1S–10S. [DOI] [PubMed] [Google Scholar]
- 7.Weber WA, Petersen V, Schmidt B, Tyndale-Hines L, Link T,Peschel C, et al. Positron emission tomography in non-small-cell lung cancer: prediction of response to chemotherapy by quantitative assessment of glucose use. J Clin Oncol. 2003;21:2651–7. [DOI] [PubMed] [Google Scholar]
- 8.Stroobants S, Goeminne J, Seegers M, Dimitrijevic S, Dupont P,Nuyts J, et al. 18FDG-Positron emission tomography for the early prediction of response in advanced soft tissue sarcoma treated with imatinib mesylate (Glivec). Eur J Cancer. 2003;39:2012–20. [DOI] [PubMed] [Google Scholar]
- 9.Thie JA. Understanding the standardized uptake value, its methods, and implications for usage. J Nucl Med. 2004;45:1431–4. [PubMed] [Google Scholar]
- 10.Adams MC, Turkington TG, Wilson JM, Wong TZ. A systematicreview of the factors affecting accuracy of SUV measurements. AJR Am J Roentgenol. 2010;195:310–20. [DOI] [PubMed] [Google Scholar]
- 11.Boellaard R Standards for PET image acquisition and quantitativedata analysis. J Nucl Med. 2009;50 Suppl 1:11S–20S. [DOI] [PubMed] [Google Scholar]
- 12.Kinahan PE, Fletcher JW. Positron emission tomography-computedtomography standardized uptake values in clinical practice and assessing response to therapy. Semin Ultrasound CT MR. 2010;31:496–505. [DOI] [PMC free article] [PubMed] [Google Scholar]
- 13.Boellaard R, Krak NC, Hoekstra OS, Lammertsma AA. Effectsof noise, image resolution, and ROI definition on the accuracy of standard uptake values: a simulation study. J Nucl Med. 2004;45:1519–27. [PubMed] [Google Scholar]
- 14.Fahey FH, Kinahan PE, Doot RK, Kocak M, Thurston H,Poussaint TY. Variability in PET quantitation within a multicenter consortium. Med Phys. 2010;37:3660–6. [DOI] [PMC free article] [PubMed] [Google Scholar]
- 15.Beyer T, Czernin J, Freudenberg LS. Variations in clinical PET/CToperations: results of an international survey of active PET/CT users. J Nucl Med. 2011;52:303–10. [DOI] [PubMed] [Google Scholar]
- 16.Graham MM, Badawi RD, Wahl RL. Variations in PET/CT methodology for oncologic imaging at U.S. academic medical centers: an imaging response assessment team survey. J Nucl Med. 2011;52:311–7. [DOI] [PMC free article] [PubMed] [Google Scholar]
- 17.Boellaard R, O’Doherty MJ, Weber WA, Mottaghy FM, Lonsdale MN, Stroobants SG, et al. FDG PET and PET/CT: EANM procedure guidelines for tumour PET imaging: version 1.0. Eur J Nucl Med Mol Imaging. 2010;37:181–200. [DOI] [PMC free article] [PubMed] [Google Scholar]
- 18.Kelly MD, Declerck JM. SUVref: reducing reconstructiondependent variation in PET SUV. EJNMMI Res. 2011;1:16. [DOI] [PMC free article] [PubMed] [Google Scholar]
- 19.National Electrical Manufacturers Association; NEMA standardspublication NU 2–2001: performance measurements of positron emission tomographs. Rosslyn: National Electrical Manufacturers Association; 2001. [Google Scholar]
- 20.American Association of Physicists in Medicine; PET phantominstructions for evaluation of PET image quality. http://www.aapm.org/meetings/amos2/pdf/49-14437-10688-860.pdf. College Park, MD: American Association of Physicists in Medicine; 2012. Accessed 24 May 2013 [Google Scholar]
- 21.Surti S, Kuhn A, Werner ME, Perkins AE, Kolthammer J, Karp JS.Performance of Philips Gemini TF PET/CT scanner with special consideration for its time-of-flight imaging capabilities. J Nucl Med. 2007;48:471–80. [PubMed] [Google Scholar]
- 22.Wahl RL, Jacene H, Kasamon Y, Lodge MA. From RECIST toPERCIST: evolving considerations for PET response criteria in solid tumors. J Nucl Med. 2009;50 Suppl 1:122S–50S. [DOI] [PMC free article] [PubMed] [Google Scholar]
- 23.Cheebsumon P, Yaqub M, van Velden FH, Hoekstra OS, Lammertsma AA, Boellaard R. Impact of [18F]FDG PET imaging parameters on automatic tumour delineation: need for improved tumour delineation methodology. Eur J Nucl Med Mol Imaging. 2011;38:2136–44. [DOI] [PMC free article] [PubMed] [Google Scholar]
- 24.Lodge MA, Chaudhry MA, Wahl RL. Noise considerations forPET quantification using maximum and peak standardized uptake value. J Nucl Med. 2012;53:1041–7. [DOI] [PMC free article] [PubMed] [Google Scholar]
- 25.Doot RK, Scheuermann JS, Christian PE, Karp JS, Kinahan PE.Instrumentation factors affecting variance and bias of quantifying tracer uptake with PET/CT. Med Phys. 2010;37:6035–46. [DOI] [PMC free article] [PubMed] [Google Scholar]
- 26.Vanderhoek M, Perlman SB, Jeraj R. Impact of the definition ofpeak standardized uptake value on quantification of treatment response. J Nucl Med. 2012;53:4–11. [DOI] [PMC free article] [PubMed] [Google Scholar]


