

Abstract
Atypical cadherin Celsr3, a regulator of planar cell polarity, is critical for the development of the axonal blueprint. We previously showed that expression of Celsr3 is necessary to establish forebrain connections such as the anterior commissure and thalamocortical and corticospinal tracts. The requirement for Celsr3 during hippocampal wiring and its action in the hippocampus remain largely unexplored. Here, we compared the connectivity and maturation of the hippocampal formation in Celsr3|Foxg1 and Celsr3|Dlx mice. Celsr3 is inactivated in the whole telencephalon, including the hippocampal primordium, in Celsr3|Foxg1 mice, and in the early basal telencephalon, including ganglionic eminences and ventral diencephalon, in Celsr3|Dlx mice. Behavioral tests showed that both mutants were hyperactive and had impaired learning and memory. Abnormal cytoarchitecture of CA1, CA3, and dentate gyrus was found in the Celsr3|Foxg1 mutant, in which afferent and efferent hippocampal pathways, as well as intrinsic connections, were dramatically disrupted. In Celsr3|Dlx mutant mice, hippocampal cytoarchitecture was mildly affected and extrinsic and intrinsic connectivity moderately disturbed. In both mutants, pyramidal neurons in CA1 harbored atrophic dendritic trees, with decreased synapse density and increased proportion of symmetric versus asymmetric synapses, and long-term potentiation was altered. In contrast, mutant hippocampal neurons extended neurites that were normal, even longer than those of control neurons, indicating that anomalies in vivo are secondary to defective connections. Postnatal neurogenesis was preserved and mutant interneurons were able to migrate to the hippocampus. Thus, like in neocortex, Celsr3 is required for hippocampal development, connectivity and function, and for pyramidal cell maturation.
Introduction
The hippocampus or archicortex plays a critical role in learning and memory. Interference with hippocampal wiring, such as interruption of CA1–CA3 connections (Okada and Okaichi, 2009), reduction of hippocampal commissure (Schimanski et al., 2002), genetic ablation of entorhinal afferents (Suh et al., 2011), or lesion of medial septal afferents (Okada and Okaichi, 2010) consistently generates profuse learning and memory deficits. In addition, the subgranular layer of the dentate gyrus (DG) is a privileged site of adult neurogenesis (Hodge and Hevner, 2011), which plays a significant role in the plasticity of hippocampal circuits in response to changing environmental demands (Kelsch et al., 2010). Due to this critical role in brain function, developmental abnormalities in hippocampal networks are thought to contribute to neurodevelopmental disorders, such as autism, schizophrenia, epilepsy, and Down syndrome (Lavenex et al., 2007).
Hippocampal areas develop as a protomap in the medial field of the dorsal telencephalic vesicle, under control of the cortical hem (Subramanian and Tole, 2009). Although a primordium can be identified as early as embryonic day 15.5 (E15.5) in mice (Grove and Tole, 1999), the architectonic development, wiring, and maturation of the hippocampal formation proceed mostly postnatally. The mature hippocampus is divided into two main regions, the CA1 and CA3, capped by the DG, itself divided into suprapyramidal and infrapyramidal blades. Different sensory modalities are integrated in the entorhinal and adjacent parahippocampal cortex, which project to the DG via the perforant and direct pathways. Mossy fiber (MF) axons from the DG connect to pyramidal cells in CA3, which connect to CA1. The main projection of CA1 is to the subiculum. Hippocampal efferent axons in the fimbria/fornix originate mainly from the subiculum, and also from CA3 and CA1; they terminate mainly in association cortex, septum, and limbic systems (Sørensen, 1985; Witter and Amaral, 2004). Although this wiring diagram is well known, the mechanisms that orchestrate its development and maturation remain less clearly understood.
The atypical cadherin Celsr3 and the seven pass receptor Fzd3 are critical regulators of axonal guidance and brain wiring (Wang et al., 2002; Tissir et al., 2005). Because both genes/proteins belong to the core planar cell polarity (PCP) group, this points to a key role of PCP signaling during brain development (Wang and Nathans, 2007; Goodrich, 2008; Tissir and Goffinet, 2010). Using mice with region-specific inactivation of Celsr3, we previously studied neocortical regionalization and maturation in the absence of thalamic afferences and extracortical efferences (Zhou et al., 2008, 2010). Here, we show that Celsr3 mutant mice display behavioral deficits compatible with hippocampal dysfunction, and that Celsr3 inactivation alters the connectivity but not the arealization of the hippocampal formation. This is accompanied by defective maturation of dendrites and synapses of pyramidal neurons, leading to defective function as assessed by long-term potentiation (LTP). In contrast, postnatal neurogenesis, as well as the migration of interneurons, is relatively unaffected, and Celsr3 mutant principal hippocampal neurons are able to form neurites in primary culture in vitro. Together with previous studies using hnRNA to downregulate Celsr3 expression in hippocampal neurons and slices (Shima et al., 2007), our work provides the first indication in vivo that PCP proteins and signaling are implicated in hippocampal maturation, wiring, and function, with possible implications for plasticity and regeneration.
Materials and Methods
Mutant mice
All animal procedures were performed according to guidelines and approved by competent ethics committees at Jinan University. The production of mice with regional activation of Celsr3 and control animals was described before (Zhou et al., 2008). Mice of either sex were used in this study.
Behavioral studies
Morris water maze.
A water tank 70 cm in diameter and 35 cm in height was filled with water to a depth of 16.5 cm and maintained at a temperature of 24 ± 1°C. Four equally positioned points divided the maze into quadrants. During training, the escape platform (10 × 10 cm2) was submerged to a depth of 0.5 cm. Mice were placed into the pool and allowed to search for the platform for 180 s for four trials (once from each quadrant). Animals were pretrained before recording and guided to the platform if they could not find it at the end of the test, in which case the latency was recorded as 180 s. At least six mice in each group, aged postnatal day (P) 17–21, were studied on 3 consecutive days. Data were recorded with a video camera and analyzed using EthoVision XT 7.0 (Noldus).
Histology and immunohistochemistry
For histological examination, paraffin sections were stained with cresyl violet to assess neuronal density and architectonics, and with Luxol Fast Blue to visualize myelin sheets. The thickness of cell layers and cell density in CA1 and CA3 was estimated in matched coronal sections, using ImageJ. Cholinergic fibers were detected using acetylcholinesterase histochemistry (Hedreen et al., 1985) as follows. Animals were perfused with 4% paraformaldehyde (PFA) and 10-μm-thick coronal sections were prepared with a cryostat. After two rinses in 0.1 m acetate buffer, pH 6.0, sections were incubated in a water solution containing 0.04% (w/v) acetylthiocholine iodide (A5751; Sigma) and 0.003% (w/v) potassium ferricyanate, at room temperature for 30 min. Following five rinses in 0.1 m acetate buffer, sections were treated with 1% ammonium sulfide for 1 min, and then five changes of 0.1 m sodium nitrate. Fibers were visualized by treatment with 0.1% AgNO3 for 1 min. Fiber density was assessed by using a 10 × 10 mm reticle positioned in the eyepiece of the microscope and by counting intersections of fibers with two sides of the reticle (Rózsa et al., 1983). MFs were stained using the Neo-Timm stain (Babb et al., 1991) as follows. Brains were fixed by transcardial perfusion with 30 ml sodium sulfide (Na2S, 11.7 g; NaH2PO4, 11.9 g in 1000 ml distilled water) followed by 30 ml 4% PFA, and again by 30 ml sodium sulfide. Frozen sections (30 μm thick) were developed in the dark for 50–70 min, in a 120:60:20 mixture of arabic gum (50% w/v), hydroquinone (5.6% w/v; H9003; Sigma), citric acid–sodium citrate buffer (citric acid, 25.5 g; sodium citrate, 23.5 g in 100 ml distilled water), and stained in 17% AgNO3 at 26°C. MF density in CA3 was measured using ImageJ, and the density of MF terminals in the stratum pyramidale or oriens in CA3 were ranked for 0–5 as described previously (Holmes et al., 1999). For immunohistochemistry, 4 μm paraffin or 10 μm frozen sections were used. Primary antibodies were as follows: mouse anti-parvalbumin (1:1000; Millipore), rabbit anti-Ki67 (1:500; Abcam), mouse anti-calbindin (1:3000; Sigma), rabbit anti-calretinin (1:400; Invitrogen), rabbit anti-serotonin (1:2000; Sigma), mouse anti-Reelin G10 (Reln, 1:2000) (de Bergeyck et al., 1998), and rabbit anti-caspase-3 (1:500; Cell Signaling Technology). Signal was detected with a mouse-rabbit ABC kit (PK-6200, Universal; Vector Laboratories) and the donkey anti-mouse Alexa Fluor 546 (1:1000; Invitrogen).
DiI tracing
DiI crystals (D3911; Invitrogen) were implanted in target areas using tungsten needles. P4–P7 animals were perfused with 4% PFA and the whole brains were removed; under a stereomicroscope, a crystal was inserted into the entorhinal cortex and brains were incubated in PBS (0.01 m) containing 0.08% NaN3, at 37°C, for 4–6 weeks. DiI implantation in CA1 was performed in vibratome sections, which were subsequently incubated at 37°C for 2–3 weeks. Samples were sectioned in the coronal plane using a vibratome and sections were examined by fluorescence microscopy.
Electrophysiological recordings of LTP
LTP was recorded in 400 μm acute hippocampal slices prepared with a tissue chopper (SL-10; Narishige) from P18–P20 litter-matched animals. Artificial CSF (ACSF) used for slice preparation and perfusion was composed containing the following (in mm): 126.0 NaCl, 1.6 KCl, 2.0 CaCl2, 1.0 MgCl2, 1.2 NaH2PO4, 18.0 NaHCO3, and 11.0 glucose, oxygenated for at least 20 min before use and equilibrated to a pH of 7.35–7.45. A recording glass microelectrode (2–3MΩ, filled with ACSF) was inserted to a depth of 200 μm in the stratum radiatum of the dorsal CA1 region, and a concentric bipolar electrode (with a tip of 300–500 μm) was used to stimulate CA3. Field potentials were recorded with an EPC-10 amplifier (HEKA) in the fast current-clamp mode. Potential was sampled at 10 kHz (PULSE software; HEKA) and digitally filtered at 3 kHz for real-time display. The stimulator (Master-8; A.M.P.I.) was driven by the EPC-10, and 0.4 ms pulses were delivered via a constant-current isolator (ISO-Flex; A.M.P.I.). Stimulation intensity was adjusted so that field EPSP (fEPSP) reached 40% of the maximum evoked potential; the onset slope was measured at the quasilinear portion after onset. For baseline measurement, single-pulse stimulations were delivered at intervals of 15 s for baseline measurement. After recording stable EPSPs for 20 min, LTP was induced by high-frequency stimulation (HFS) composed of two 1 s trains of 100 Hz pulses, with a 60 s interval. EPSPs were recorded for 60 min following HFS. The EPSP slope was normalized to the mean baseline slope during the last 10 min before HFS, and plotted over time. Potentiation was defined as the mean normalized EPSP slope during the last 10 min (50–60 min after HFS) of recording. Data are presented as mean ± SEM and analyzed with Student's t test; p < 0.05 was considered significant.
Golgi stain and morphological analysis of pyramidal cells
The Golgi–Cox stain was performed on 150-μm-thick frozen brain sections, using the FD Rapid GolgiStain kit (FD NeuroTechnologies) according to the manufacturer's protocol. For each mouse genotype, 25 well individualized CA1 neurons were selected, and sequential optical sections of 1392 × 1040 pixels were taken at 1 μm intervals along the z-axis using an upright microscope (Leica, DM6000B). The Imaris software (BitPlane AG) was used for tridimensional reconstruction and measurement of total branch number and dendritic length. The complexity of basal and apical dendritic trees was estimated using Sholl analysis (Sholl, 1953). To measure spine density, eight neurons of each genotype were selected and matching regions of five secondary dendrites were photographed using a 100× objective for counting of spine numbers in 50 μm segments.
Electron microscopy
Mice were deeply anesthetized with ketamine (80 mg/kg), and perfused with a solution containing 2% glutaraldehyde and 2% PFA in 0.15 m phosphate buffer, pH 7.4. Whole brains were kept in the same fixative overnight at 4°C. Coronal 50-μm-thick vibratome sections were postfixed with 0.5% osmium tetroxide for 1 h, dehydrated in a graded ethanol series (30–50%-70–95%, 5 min each) followed by 3× 10 min 100% ethanol and 3× 15 min propylene oxide, and embedded in EMbed 812 (Electron Microscope Sciences) at 60°C for 48 h. Small samples (∼1 mm2) containing the CA1 region were glued on resin blocks with Cryze glue. Areas of interest were defined in 1-μm-thick sections stained with toluidine blue. Thin sections were collected on 200 mesh grids, and stained with 2% uranyl acetate for 30 min and 1% lead citrate for15 min. Images were captured with a Philips 400 electron microscope. In each region—stratum oriens (basal dendrites), the proximal stratum radiatum (proximal dendrites), and the distal stratum radiatum (distal dendrites)—20 fields were selected under 17,500× magnification and synapses were counted blindly in each field (4*4.8 μm2) by two different observers. To distinguish the two main types of synapses (asymmetric and symmetric), 10 fields were selected and photographed under 30,000×, magnification.
Primary neuronal cultures and neurite analysis
Celsr3 heterozygous (Celsr3+/−) mice were bred and E18.5 embryos were collected for neuronal culture. Hippocampi were dissected out under a stereomicroscope and collected separately in cold HBSS. Tail samples were collected for genotyping. The hippocampal tissue was cut into small pieces and triturated by pipetting. Cells were harvested after centrifugation at 1000 rpm, and washed in DMEM-F12 (Invitrogen) for two more times. Cells from each embryo were separately plated on polylysine-coated coverslips, in 24-well plates, at a density of 0.5 × 10⁵ cells/ml, in DMEM-F12 medium supplemented with B27 (Invitrogen), and 1 ml cell suspension was added to one coverslip. After culture for 5 d in vitro (5 DIV), cells were fixed with 4% PFA and immunostained with mouse anti-β3 tubulin (1:1000; Cell Signaling Technology). Pictures of 10 well developed neurons on each coverslip were captured under fluorescence microscope with 40× objective, and neurites were analyzed using the Imaris software (BitPlane AG).
Statistics
Results are expressed as mean ± SEM. The χ2 test was used to compare MF terminals; the parametric Bonferroni and nonparametric Kruskal–Wallis H tests were used to analyze dendrite branching with the Sholl method (Sholl, 1953). Other results were analyzed using SPSS 17; p values <0.05 and <0.01 were considered significant and highly significant, respectively.
Results
Animal models
Mice with regional inactivation of Celsr3 were described in detail previously (Zhou et al., 2008). Briefly, in Celsr3|Foxg1 mice, Celsr3 is inactivated at early developmental stages in the whole telencephalon. In Celsr3|Dlx mice, inactivation is complete in the early basal telencephalon and ventral diencephalon. In both Celsr3|Foxg1 and Celsr3|Dlx mice, all components of the internal capsule (thalamocortical, corticothalamic, and subcerebral projections) are absent. Celsr3|Foxg1 and Celsr3|Dlx mice look hypotrophic, although they are able to eat, drink, move, and swim; they do not survive later than P21.
Celsr3|Foxg1 and Celsr3|Dlx mutant mice display profuse behavioral deficits
By P18–P20, brain maturation is almost complete, enabling us to perform limited behavioral investigations in both mutant strains. Celsr3|Foxg1 and Celsr3|Dlx mutant mice swam well enough to undergo water maze tests. After pretraining, control mice found the platform within a few seconds (Fig. 1A). In contrast, mutant mice swam randomly and did not show any preference for the quadrant containing the platform, most of them being unable to reach the platform at the end of the test (Fig. 1B,C). In studies of six mice of each group on 3 consecutive days, the latency was increased in mutants compared with controls (p < 0.01), with no significant difference between Celsr3|Foxg1 and Celsr3|Dlx mice (Fig. 1D).
Figure 1.

Celsr3|Foxg1 and Celsr3|Dlx mice have behavioral deficits. In the Morris water maze test, after pretraining, normal mice could find the platform (P) in a few seconds (A). In contrast, Celsr3|Foxg1 and Celsr3|Dlx mice swam randomly and did not have any preference for the quadrant containing the platform (B, C). The latency was significantly increased in the mutants compared with controls, with no significant difference between the mutant strains (D). All tests were repeated three times on 3 consecutive days, using P17–P21 mice. **p < 0.01, n = 6 in each group.
Although forebrain connectivity defects in mutants are too widespread to draw a conclusion from behavioral tests in terms of hippocampal function, anomalies in the hippocampus were considered a possible origin, prompting us to investigate the organization, connectivity, and physiology of the hippocampal formation.
Inactivation of Celsr3 alters hippocampal architectonics and intrinsic wiring
To assess the intrinsic organization of the hippocampus, we examined cresyl violet-stained preparations. In Celsr3|Foxg1 mice, the dorsal hippocampus was more globular and the DG smaller than in normal mice (Fig. 2A,B). Somewhat similar, albeit more subtle anomalies were seen in Celsr3|Dlx animals (Fig. 2C). Using three brains from each group and eight selected sections in the dorsal hippocampus, we estimated that the thickness of the principal cell layer was increased by 35 and 60%, respectively, in CA1 and CA3 of Celsr3|Foxg1 samples (Fig. 2D,E,G,H,J). Cell density was decreased by ∼30% in CA1 and CA3 in Celsr3|Foxg1, but less so in Celsr3|Dlx mutant mice (Fig. 2F,I,K).
Figure 2.

Hippocampal architecture is altered, more in Celsr3|Foxg1 than in Celsr3|Dlx mice. Coronal sections from P18 brains were stained with cresyl violet. Compared with normal mice (A) the dorsal hippocampus in Celsr3|Foxg1 mice (B) was more globular, the DG blunted, and the cellular layer in CA1 and CA3 increased in thickness (D, E, G, H, J). Similar albeit more subtle anomalies were found in Celsr3|Dlx mice (C, F, I). Cell density was significantly lower in Celsr3|Foxg1 than Celsr3|Dlx and control mice (K). D–F and G–I are higher magnifications of CA1 and CA3, as illustrated in insets A–C, respectively. **p < 0.01.
We next studied local hippocampal circuits. MFs arise from granule cells in DG and innervate CA3 pyramidal cells, forming a main bundle (MB) and a small infrapyramidal bundle (IPB) (Bagri et al., 2003). They were studied using Timm's stain (Ramírez-Amaya et al., 2001), and calbindin immunohistochemistry (Chen et al., 2000). In control mice, MFs emerged from the hilus of DG and extended laterally to CA3, forming well defined MB and IPB (Fig. 3A). Although their patterning was not changed in mutants, the thickness of MF bundles was much reduced, particularly in Celsr|Foxg1 mice (Fig. 3B). Furthermore, the IPB did not extend out of the hilus in Celsr3|Foxg1 mice, although it was present in Celsr3|Dlx mutants (Fig. 3C). The number of stained axon terminals in CA3 was decreased in both mutants, much more in Celsr3|Foxg1 than Celsr3|Dlx mice (Fig. 3D–F,J; p < 0.01 in all comparisons). Using calbindin immunostaining, the MB and IPB bundles were stained in control and Celsr3|Dlx mice (Fig. 3G,I), whereas only the MB could be seen in Celsr3|Foxg1samples (Fig. 3H).
Figure 3.
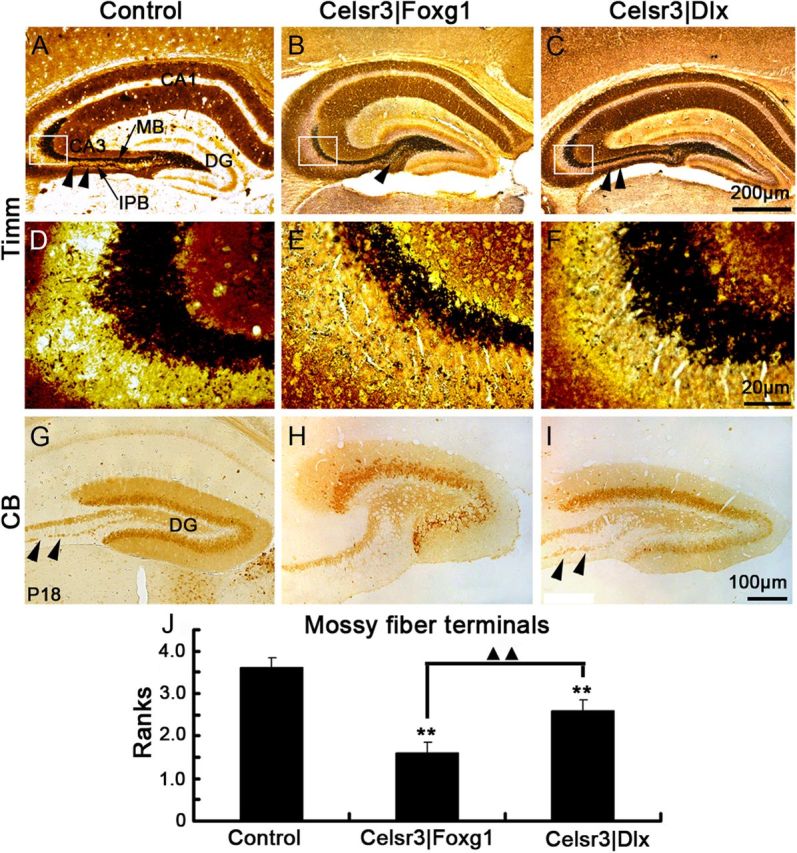
MF projections are defective in both mutants. Timm staining shows the MFs originating from the DG and extending to CA3, forming a MB (arrow in A) and a smaller IPB (arrowheads). The MB was much reduced, and the IPB absent in Celsr3|Foxg1 (B). A similar but more subtle phenotype was noted in Celsr3|Dlx, in which the MB was thin, but IPB was present (C). D–F, MFs in CA3 at higher magnification in selected areas from A–C (insets). There is a significant decrease in MF terminals in mutants compared with controls, more in Celsr3|Foxg1 than in Celsr3|Dlx mice (J). CB immunohistochemistry disclosed identical results, with the MB present in control and Celsr|Dlx (arrowheads), but absent in Celsr3|Foxg1 (G–I). **, compared with control, p < 0.01; ▴▴, comparison between mutants, p < 0.01. n = 5 in each group.
To visualize the projection from CA3 to CA1, we implanted small DiI crystals in CA1 in coronal vibratome slices. Retrogradely labeled cell bodies were seen in CA3, and prominent fibers were found running between CA1 and CA3 in normal and Celsr3|Dlx mice (Fig. 4A,C,D,F). In contrast, very few cell bodies and fibers could be found in Celsr3|Foxg1 mice (Fig. 4B,E; n = 3), even following implantation of larger crystals, showing that CA1–CA3 connections are defective in that mutant.
Figure 4.

Inactivation of Celsr3 alters CA3–CA1 connections and axonal innervation from entorhinal cortex. Following implantation of small DiI crystal in CA1 in slices from normal mice, labeled cell bodies were detected in CA3, with fibers running between CA3 and CA1 (A, D). A comparable result was found in Celsr3|Dlx slices (C, F), but few if any cell bodies and fibers were visible in Celsr3|Foxg1 mice (B, E). In control mice, insertion of a large crystal in the entorhinal cortex resulted in labeling of axons in the molecular layer of the DG (G, J). In contrast, no labeled axons were seen in the DG of Celsr3|Foxg1 mice (H, K). Some axons from EC reach the DG in Celsr3|Dlx mice, although they are less abundant than in normal mice (I, L). D–F are higher magnification of selected regions in A--C, and J–L are higher magnification of selected boxed regions in G–I. In Fast Blue-stained sections, the alveus of hippocampus was located below the white matter in control and Celsr3|Dlx mice, in which it was diminutive (M, O, arrows), but it was not visible in Celsr3|Foxg1 mice (N). The insert in M′ is the example of area for higher magnification in M–O. EC, entorhinal cortex; WM, white matter; alv, alveus of the hippocampus; Ctx, cortex; V, ventral; D, dorsal; L, lateral; M, medial.
Those data show that hippocampal architectonics and intrinsic connections are affected strongly in Celsr3|Foxg1, and mildly in Celsr3|Dlx mutant mice.
Celsr3 inactivation results in defective extrinsic hippocampal connections
The main input to the hippocampal formation originates from the entorhinal cortex (van Groen et al., 2003). Following insertion of DiI crystals in entorhinal cortex, perforant fibers were visible in the molecular layer of the DG, in control and to a lesser extent in Celsr3|Dlx mice (Fig. 4G,I,J,L). In contrast, no labeled axons could be seen in the DG of Celsr3|Foxg1 mice (Fig. 4H,K; n = 4), indicating that few if any afferent fibers from the entorhinal cortex are able to reach the hippocampus. Most entorhinal fibers enter the hippocampus via the perforant path, whereas a small number travel via the alveus of the hippocampus (alv) (Witter and Amaral, 2004). In Luxol Fast Blue stained sections, the alveus was stained in control and Celsr3|Dlx mice (Fig. 4M,O), but not in Celsr3|Foxg1 mice (Fig. 4N).
In addition to input from entorhinal cortex, the hippocampus also receives profuse cholinergic projections from the medial septal nucleus and the nucleus of the diagonal band of Broca, as well as a robust serotoninergic innervation from the medial and dorsal raphe nuclei (Witter and Amaral, 2004; Bombardi, 2012). We studied cholinergic and serotoninergic fibers using cholinesterase histochemistry and serotonin immunohistochemistry. In CA1, cholinergic fibers were significantly reduced in Celsr3|Foxg1, but normal in Celsr3|Dlx samples (Fig. 5A–C,N), whereas they were decreased in both mutants at the level of CA3 (Fig. 5D–F,N). This indicates that a proportion of cholinergic fibers are still able to reach the hippocampus by traveling retrogradely in the fornix and fimbria. The density of serotoninergic fibers was dramatically reduced in CA1 and CA3 in both mutants (Fig. 5G–L,O), more in Celsr3|Foxg1, in which the decrease was superior to 80%, than in Celsr3|Dlx (p < 0.01, n = 3). Because neither Foxg1 nor Dlx5/6 are expressed in serotoninergic nuclei (Hébert and McConnell, 2000; Stenman et al., 2003), these results suggest that Celsr3 is required in guidepost cells along the pathway followed by serotoninergic fibers.
Figure 5.

Hippocampal cholinergic and serotoninergic afferents are reduced in both mutant hippocampi. Compared with control and Celsr3|Dlx mice, cholinergic fiber density was significantly decreased in CA1 in Celsr3|Foxg1 mice (p < 0.01, A–C, N), whereas it was decreased in both Celsr3|Foxg1 and Celsr3|Dlx mice at the level of CA3 (p < 0.01, D–F, N). Serotoninergic fibers were visualized in CA1 and CA3, using anti-5-HT immunohistochemistry (G–L). A reduction in fiber density was found in both mutants, in CA1 and CA3 areas, more in Celsr3|Foxg1 mice than in Celsr3|Dlx mice (O). The projections of cholinergic (in green) and serotoninergic (in red) fibers, and the selected areas of CA1 and CA3 in A–L, are illustrated in M. Hip, hippocampus; BF, basal forebrain; RN, raphe nuclei. **, compared with controls, p < 0.01; ▴▴, comparison between mutants, p < 0.01.
Most efferent fibers from the hippocampal region follow the fimbria–fornix (Adelmann et al., 1996; Witter and Amaral, 2004). The size of the fimbria, estimated in coronal sections stained by cresyl violet, was most diminutive in Celsr3|Foxg1 mice (Fig. 6A–C,J). Compared with control and Celsr3|Dlx mice (Fig. 6D,F,G,I), Celsr3|Foxg1 mice had almost no fornix and no ventral and dorsal hippocampal commissure (Fig. 6E,H). Together with CA1, the subiculum is the main output structure of the hippocampal formation (Witter, 2006). In Celsr3|Foxg1 mice, the size of the subiculum was decreased by ∼71% (p < 0.01) and by ∼19% in Celsr3|Dlx samples (Fig. 7A–F,M). Labeling with anti-caspase-3 antibody, we found the apoptotic cells in the subiculum were increased with ∼10 folds in Celsr3|Foxg1 and 2 folds in Celsr3|Dlx samples compared with the normal ones (p < 0.01, Fig. 7G–L,N).
Figure 6.

Celsr3 inactivation affects fimbria, fornix, and hippocampal commissure development. In Nissl-stained sections, compared with that in littermate controls, the fimbria (fi; double arrow) was most diminutive in Celsr3|Foxg1 mice and atrophic in Celsr3|Dlx (A–C). In both mutants, the fimbria was significantly reduced compared with controls, and it was smaller in Celsr3|Foxg1 than in Celsr3|Dlx mice (J). In Fast Blue-stained sections, the fornix and ventral hippocampal commissure (vhc) were visible in control and Celsr3|Dlx mice (D, F, arrows), but almost absent in Celsr3|Foxg1mice (E). Similarly, the dorsal hippocampal commissure (dhc) was visible in control (G) and Celsr3|Dlx (I), but not in Celsr|Foxg1 mice (H). LV, lateral ventricle; CC, corpus callosum; D3V, dorsal third ventricle. **, compared with control, p < 0.01; ▴▴, comparison between mutants, p < 0.01.
Figure 7.
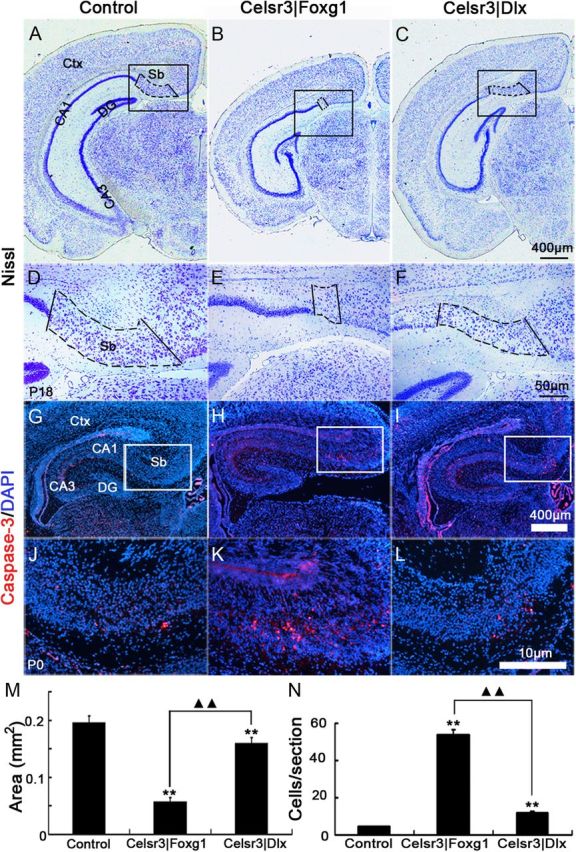
The subiculum is affected in mutant hippocampi. In caudal coronal sections stained with cresyl violet, the subiculum (Sb, boxed areas) was clearly identified between CA1 and cingulate cortex (A–F). It was almost absent in Celsr3|Foxg1 mice and diminutive in Celsr3|Dlx mice (M). On P0 coronal sections, the caspase-3-positive cells in subiculum were significantly increased in mutants, much more in Celsr3|Foxg1 mice than in Celsr3|Dlx mice (G–L, N). Boxed regions in A–C are shown at higher magnification in D–F and boxed regions in G–I are shown at higher magnification in J–L. Ctx, cortex. **, mutants compared with the control, p < 0.01; ▴▴, comparison between mutants, p < 0.01.
Inactivation of Celsr3 perturbs the maturation of pyramidal neurons
As mentioned above, the pyramidal cell layer in CA1 and CA3 is abnormally organized in Celsr3|Foxg1, and to a lesser extent in Celsr3|Dlx mice. To study the morphology of CA1 pyramidal neurons, we used Golgi–Cox impregnation and reconstructed tridimensional basal and apical dendritic trees in 25 pyramidal neurons selected from three brains of each genotype (Fig. 8A–C). In both Celsr3|Foxg1and Celsr3|Dlx mice, pyramidal dendrites were less branched and had shorter total length than those in normal mice, especially in the apical field (Fig. 8D,E), a phenotype confirmed by the Sholl analysis (Fig. 8F). Furthermore, spine density was significantly decreased in mutants compared with normal animals, particularly in Celsr3|Foxg1 mutants (Fig. 8A′–C′,G), with a modest difference between mutants.
Figure 8.

Pyramidal neurons are atrophic in both mutant strains. A–C, Examples of reconstructed Golgi-impregnated pyramidal neurons in CA1, in the three genotypes. In Celsr3|Foxg1 and Celsr3|Dlx mutants, total branches and dendritic length were significantly decreased compared with controls (D, E, p < 0.01, n = 25 neurons in each group). In mutants, dendritic atrophy was observed in the basal area, as shown by Sholl analysis (F, p < 0.01; Kolmogorov–Smirnov test). Spine density in the basal area was decreased in mutant versus normal mice (p < 0.01), and there was a significant difference between the two mutants (p < 0.05) (G). Examples of reconstructed spines are shown in A′–C′. **, comparison with the control, p < 0.01; ▴, comparison between mutants, p < 0.05.
We next compared synapse density in selected sectors of pyramidal cell dendrites in CA1. By counting synapses in 20 fields at three (basal, proximal, and distal) locations relative to the cell body, we found that their density was significantly decreased in mutant cells, more in Celsr3|Foxg1 than in Celsr3|Dlx mice (Fig. 9A–I,J). Because most synapses were asymmetric type I, presumably excitatory, this sharp decrease in mutant samples may reflect abnormal connectivity due, for example, to decreased input from CA3. By examining 10 fields in each area (basal, proximal, and distal), we estimated the proportion of symmetric type II synapses to 4.22 ± 0.67% of total synaptic profiles in normal, 15.18 ± 2.05% in Celsr3|Foxg1, and 15.31 ± 1.48% in Celsr3|Dlx samples (Fig. 9K). Given that most type II synapses correspond to GABAergic input from inhibitory neurons, the relative increase in their density in mutants provides evidence that interneurons are relatively spared, and that the atrophy of pyramidal neurons coupled with decreased glutamatergic input are likely to account for the decreased synapse numbers.
Figure 9.

Synapse density is decreased and the proportion of symmetric synapses increased in mutants. Synapses (arrows) were analyzed using electron microscopy, in basal dendrites (A–C), and in proximal (D–F) and distal segments of apical dendrites (G–I). In all three zones, synapse density was significantly decreased in Celsr3|Foxg1 and Celsr3|Dlx, and there was also a significant difference between mutants (J). The proportion of symmetric/asymmetric synapses was significantly increased in both mutants (K). **, compared with control, p < 0.01; ▴▴ and ▴, comparison between Celsr3|Foxg1 and Celsr3|Dlx, with p < 0.01 and p < 0.05, respectively.
LTP is defective in Celsr3|Foxg1 and Celsr3|Dlx mice
As described above, Celsr3 inactivation affects wiring and synapses in the mutant hippocampus, which is associated with an impairment of learning and memory. To assess putative physiological consequences, we studied LTP induced by tetanic stimulation at the Schaffer collateral-CA1 synapse. LTP was induced in all genotypes, with a sharp increase in the EPSP slope right after HFS, followed by a slow decay to a level higher than the baseline before HFS (Fig. 10A). In normal slices, the average EPSP slope 50–60 min after HFS was 174.6 ± 3.3% relative to baseline, for 137.1 ± 2.8% and 143.9 ± 2.4%, respectively in Celsr3|Foxg1 and Celsr3|Dlx mice. The potentiation of EPSP slopes in Celsr3|Foxg1 and Celsr3|Dlx was significantly lower than that in normal mice (Fig. 10B, p < 0.01). These results suggest strongly that Celsr3 inactivation affects hippocampal function.
Figure 10.

LTP is reduced in Celsr3|Foxg1 and Celsr3|Dlx mice. The fEPSP was recorded in acute hippocampal slices. Compared with normal slices, the time course of EPSP slope normalized to baseline shows decreased LTP following HFS in both mutants. Periods a and b correspond to the 10 min before HFS and the 50–60 min after HFS, used to estimate average EPSP (A). Averaged LTP was significantly reduced in both mutant strains, compared with normal mice (B). **p < 0.01, compared with the control.
Celsr3-deficient hippocampal neurons develop normal in vitro
To verify that defective wiring is not due to a cell intrinsic defect that would prevent normal neurite extension by Celsr3 mutant neurons, we cultured E18.5 primary hippocampal neurons from normal and Celsr3−/− hippocampi. As shown in Figure 11, after 5 DIV, neurons from both genotypes were comparable in their ability to extend long neurites. Quantitative analysis of total neurite length and number showed that Celsr3-deficient cells even extended significantly longer and more ramified neurites than their normal counterpart, thereby confirming data previously generated by hnRNA interference with Celsr2 and Celsr3 in early postnatal rat hippocampal slices and E18 primary hippocampal neuronal culture (Shima et al., 2007).
Figure 11.

Celsr3-deficient hippocampal neurons develop normal neurites in vitro. Normal and Celsr3 mutant E18 hippocampal neurons extended neurites after 5 DIV, as demonstrated using β3-tubulin immunohistochemistry (A, B). Quantitative analysis of total neurite length and number showed that Celsr3-deficient cells grew significantly longer and more ramified neurites than their normal counterparts (C, D). n is the number of neurons for analysis; **p < 0.01.
Loss of Celsr3 does not primarily affect interneuron migration
Like cortical interneurons, hippocampal GABAergic inhibitory interneurons are generated in the medial and caudal ganglionic eminences in the basal telencephalon, and reach the hippocampus by tangential migration (Anderson et al., 1997; Fishell, 2007). The role of Celsr3 in this process is somewhat controversial. Although no evident defect was found in constitutive Celsr3 mutant mice (Tissir et al., 2005) and the different classes of interneurons are normally present in the neocortex of young Celsr3|Dlx mice (Zhou et al., 2010), another study described decreased tangential interneuron migration at late embryonic stages (Ying et al., 2009). That interneurons reach the hippocampus does not guarantee that they differentiate into appropriate subclasses, a bewildering variety of which is found in the hippocampal formation (Danglot et al., 2006). To address that question, we performed immunohistochemical studies of established interneuron markers Calbindin (CB), Calretinin (CR), Parvalbumin (PV) and Reelin (Reln), all of which were detected in normal and mutant hippocampi with similar distribution patterns (Fig. 12). CR and Reln-positive cells were found in comparable density in mutant and control samples (Fig. 12A–F,M). Intriguingly, the density of PV-positive cells was somewhat decreased, and that of CB-positive neurons increased in the Celsr3|Foxg1 and Celsr3|Dlx hippocampi, particularly in CA1 (Fig. 12G–L,M). The onset of expression of those four makers is different: Reln at E10.5 (Alcántara et al., 1998), CR at E11.5 (Abbott and Jacobowitz, 1999), and PV and CB after birth (Rami et al., 1987; Nitsch et al., 1990). Presumably, inactivation of Celsr3 does not influence the early migration of interneurons such as Reln and CR-positive cells, although it may affect postnatal maturation of some interneurons such as PV and CB-positive cells, presumably as an indirect consequence of defects of hippocampal organization and wiring.
Figure 12.

Interneurons migrate to hippocampus in mutants. At P18, coronal sections of the dorsal hippocampus were stained using four interneuron markers. Strongly CR-ir cells were found in the DG, and sparse cells in the whole hippocampus (A–C). Reln-positive cells were abundant in the whole hippocampus (D–F), whereas PV was mainly expressed in the cell layers of CA1, CA2, and CA3 (G–I). CB-positive cells were located in the DG, and some were dispersed in CA1 and CA3 (J–L). In Celsr3|Foxg1 and Celsr3|Dlx, there were more CB-positive cells in CA1 than in controls. PV (+) cell density was significantly decreased and CB (+) cell density was increased in Celsr3|Foxg1 and Celsr3|Dlx, compared with control mice (M). **, comparison with controls, p < 0.01.
Inactivation of Celsr3 does not impair postnatal neurogenesis
The DG is a privileged site of postnatal neurogenesis. We estimated precursor proliferation using immunostaining for Ki67, an established cell cycle marker (Kee et al., 2002). Ki67-immunoreactive (ir) cells were found in the subgranular zone (SGZ) of the DG, the niche of adult progenitors, in all genotypes (Fig. 13). Positive cells were aligned along a “V” in normal and Celsr3|Dlx mice, and organized into a “U” shape in Celsr3|Foxg1 mutant mice. In Celsr3|Foxg1mice, a few proliferating cells were found out of the SGZ (Fig. 13B,E). Quite unexpectedly, the number of the Ki67-ir cells was significantly increased in both mutants (Fig. 13G). This indicates that the mature hippocampus maintains and may even increase its neurogenic potential when many connections and landmarks in the region are disturbed.
Figure 13.

Postnatal neurogenesis is preserved in the mutants. In cresyl violet-stained sections, a layer of strongly stained cells was present in the subgranular layer of the DG (A–C, arrowheads); the shape of the DG was distorted in Celsr3|Foxg1 (B). Ki67-ircells were visible in both control and mutants (D–F), and their number was significantly increased in Celsr3|Foxg1and Celsr3|Dlx samples (G) relative to controls. **p < 0.01.
Discussion
Our results show that inactivation of the atypical cadherin Celsr3, a core PCP member, in different sectors of the forebrain results in drastic anomalies in the architectonics, intrinsic and extrinsic wiring in the hippocampal formation, in blunted maturation of dendritic trees and spines in hippocampal pyramids, in decreased synapse density and defective LTP. Our findings are schematically summarized in Figure 14, and we will briefly discuss some implications in relation to the regulation of PCP, and to the functional anatomy and plasticity of the hippocampal formation.
Figure 14.

Schematic drawing of the hippocampal formation with summary of the main alterations found in Celsr3|Foxg1 and Celsr3|Dlx mutant mice. A, Summary of normal hippocampal networks. The main input is from projection neurons in entorhinal cortex (EC) to DG via the perforant path (yellow), and output from CA1 projection neurons via subiculum or fimbria (blue). Intrinsic connections include MFs from DG to CA3 (red) and Schaffer collaterals from CA3 to CA1 (green). In addition, pyramidal neurons in CA3 send efferent projection via the fimbria. B, Summary of the wiring deficits in Celsr3|Foxg1 mice, in which Celsr3 is inactivated in the whole hippocampus and EC. Defective axon projections are indicated by asterisks. C, Summary of the moderate defects of hippocampal wiring in Celsr3|Dlx mice, in which Celsr3 is inactivated in Dlx5/6-positive interneurons. Sb, subiculum; Sch, Schaffer collaterals; mf, mossy fibers; pp, perforant path; fi, fimbria.
PCP signaling regulates hippocampal maturation
Celsr3 belongs to a group of so-called “core” PCP genes/proteins which, in addition to Celsr1–3, include Fzd3 and 6, Dvl1–3, Vangl1–2, and Prickle-like 1–4 (Wang and Nathans, 2007; Tissir and Goffinet, 2010). Constitutive inactivation of Fzd3 and Celsr3 in mice generates very similar phenotypes, suggesting that both proteins are part of a PCP-related mechanism that regulates development, particularly of some major axonal tracts (Wang et al., 2002; Tissir et al., 2005). Both mutants die at birth and the hippocampus was not examined in detail in those initial studies, but further work using diffusion tensor imaging showed that the fornix and hippocampal commissure are absent or reduced in Fzd3 mutant mice (Wang et al., 2006). Our observations confirm that Fzd3 and Celsr3 cooperate closely during hippocampal development as they do in other parts of the brain (Shafer et al., 2011, Tissir et al., 2005; Zhou et al., 2008, 2010; Qu et al., 2010). This prompts the question whether the hippocampal wiring anomalies in our conditional Celsr3 mutant mice would be phenocopied by region-specific inactivation of other PCP genes. This should be testable when conditional mutants become available, although genetic redundancy among several paralogs, the implication of some PCP genes such as Dvl1–3 in canonical Wnt signaling, and the role of noncanonical Wnt factors (Gao et al., 2011) will probably complicate the analysis.
Like other cadherins and their fly ortholog Flamingo/starry night (Fmi), Celsr1–3 is believed to act via homophilic binding (Shima et al., 2007). Genetic and cell biological studies in Drosophila epithelial sheets, especially the wing, show that Fmi is expressed symmetrically on both sides of adjacent cells, whereas Frizzled is confined to one border and Van Gogh to the other. This asymmetric distribution is essential to the planar organization of epithelial sheets (Bayly and Axelrod, 2011). It is tempting to propose that an analogous pattern of expression, for example, with Celsr3 expressed both in axonal growth cones and guidepost cells, and Fzd3 at only one of them, could trigger a PCP signal responsible for steering growth cones at critical choice points (Zhou et al., 2008; Tissir and Goffinet, 2010).
Different sectors of the hippocampal formation can largely develop in isolation
The main sectors of the hippocampal formation, DG, CA1, CA3, and subiculum, are largely disconnected and isolated from each other in Celsr3|Foxg1 mutant mice (Fig. 14B), in which Cre is expressed widely and from E10.5 in the forebrain and ventral diencephalon, and Celsr3 inactivated in all excitatory and inhibitory neurons of the hippocampus, as well as in entorhinal cortex, septum, and several other hippocampal afferents and projection targets. Despite drastic connectivity deficits, the different sectors remain identified anatomically, strongly suggesting that hippocampal determination under control of the hem, as well as architectonic development and to some extent cellular differentiation, is largely independent of connections. This situation is similar to the normal formation of the protomap in the neocortex isolé in Celsr3|Dlx mutant mice (Zhou et al., 2010). This mutant mouse thus allows investigations of neuronal maturation in the DG, CA1, CA3, and subiculum in the virtual absence of extrinsic connections. In the Celsr3|Foxg1 neocortex, pyramidal cells are relatively hypoexcitable, probably because a sufficient density of inhibitory interneurons is present, whereas excitatory inputs from thalamic and other sources are defective. Similarly, in the hippocampus, pyramidal cells are atrophic, with reduced synapse density and defective function as assessed by LTP. Normal development of neurites in primary neuronal culture confirms that the neuronal atrophy phenotype is likely due to noncell autonomous effects of abnormal wiring on neuronal differentiation, rather than to anomalies of cell determination.
Celsr3 expression in GABAergic neurons is required during hippocampal maturation
The data observed in Celsr3|Dlx mutant mice are even more intriguing (Fig. 14C). In Dlx5/6-Cre mice, Cre is strongly expressed in postmitotic neurons in basal telencephalon, including derivatives from all three ganglionic eminences, and in some diencephalic regions such as ventral thalamus (Stenman et al., 2003). However, there is no Cre activity in the hippocampal primordium, subiculum, and entorhinal cortex. Whereas the neocortex is isolated in Celsr3|Dlx mice, presumably due to inactivation of Celsr3 in guidepost cells in basal telencephalon (Zhou et al., 2010), the hippocampal phenotype is more complex. Some long-range connections, such as serotoninergic afferents, are fully defective. Because a PCP-related mechanism involving Fzd3 and Celsr3 regulates anterior–posterior organization of monoaminergic axons in the brainstem (Fenstermaker et al., 2010), this defective progression of serotoninergic axons could be due to Celsr3 inactivation in guidepost cells along their complex pathway in the brainstem, lateral forebrain bundle, and fornix. It is more difficult to explain the other defects observed in Celsr3|Dlx mutants. Entorhinal afferents and some hippocampal efferents in the fimbria and fornix might come in contact with Dlx5/6-positive, probably future GABAergic, cells migrating from ganglionic eminences, which could provide transient guidance cues, a model that has been proposed in other contexts (Métin and Godement, 1996). There is a contrast between the subtle anomalies of hippocampal connectivity and the drastic alterations in pyramidal cell maturation and LTP. A possible explanation could be that GABAergic interneurons, in which Celsr3 is inactivated, have stronger local and long-range effects than commonly thought. In this respect, it would be interesting to investigate in our mutants the recently described long-range GABAergic projections between hippocampus and entorhinal area (Melzer et al., 2012).
Although Celsr3 expression is sharply downregulated postnatally, it persists at low levels in the adult hippocampus, particularly in the hilus of the DG and CA3 (Tissir and Goffinet, 2006). The key role of Celsr3, as well as Fzd3, in hippocampal development and wiring, raises the issue of the implication of PCP genes during hippocampal plasticity and regeneration following lesion, a complex question that could benefit from the animal models presented here.
Footnotes
This work was supported by grants from the Program for New Century Excellent Talents in University (NCET-09-0109, L. Z.), National Basic Research Program of China (973 Program, 2011CB504402), the National Natural Science Foundation of China (31070955, L.Z.), the Fundamental Research Funds for the Central Universities, People's Republic of China (11610604, 11609101), and the Ph.D. Programs Foundation of Ministry of Education of China (23611004, L.Z.). We thank Kenneth Campbell for the gift of Dlx5/6-Cre mice, Jean Hebert for Foxg1-Cre mice, Bin Jiang for help with LTP recordings, and Qi Han for neurite analysis of Golgi staining.
References
- Abbott LC, Jacobowitz DM. Developmental expression of calretinin-immunoreactivity in the thalamic eminence of the fetal mouse. Int J Dev Neurosci. 1999;17:331–345. doi: 10.1016/s0736-5748(99)00037-4. [DOI] [PubMed] [Google Scholar]
- Adelmann G, Deller T, Frotscher M. Organization of identified fiber tracts in the rat fimbria-fornix: an anterograde tracing and electron microscopic study. Anat Embryol (Berl) 1996;193:481–493. doi: 10.1007/BF00185879. [DOI] [PubMed] [Google Scholar]
- Alcántara S, Ruiz M, D'Arcangelo G, Ezan F, de Lecea L, Curran T, Sotelo C, Soriano E. Regional and cellular patterns of reelin mRNA expression in the forebrain of the developing and adult mouse. J Neurosci. 1998;18:7779–7799. doi: 10.1523/JNEUROSCI.18-19-07779.1998. [DOI] [PMC free article] [PubMed] [Google Scholar]
- Anderson SA, Eisenstat DD, Shi L, Rubenstein JL. Interneuron migration from basal forebrain to neocortex: dependence on Dlx genes. Science. 1997;278:474–476. doi: 10.1126/science.278.5337.474. [DOI] [PubMed] [Google Scholar]
- Babb TL, Kupfer WR, Pretorius JK, Crandall PH, Levesque MF. Synaptic reorganization by mossy fibers in human epileptic fascia dentata. Neuroscience. 1991;42:351–363. doi: 10.1016/0306-4522(91)90380-7. [DOI] [PubMed] [Google Scholar]
- Bagri A, Cheng HJ, Yaron A, Pleasure SJ, Tessier-Lavigne M. Stereotyped pruning of long hippocampal axon branches triggered by retraction inducers of the semaphorin family. Cell. 2003;113:285–299. doi: 10.1016/s0092-8674(03)00267-8. [DOI] [PubMed] [Google Scholar]
- Bayly R, Axelrod JD. Pointing in the right direction: new developments in the field of planar cell polarity. Nat Rev Genet. 2011;12:385–391. doi: 10.1038/nrg2956. [DOI] [PMC free article] [PubMed] [Google Scholar]
- Bombardi C. Neuronal localization of 5-HT2A receptor immunoreactivity in the rat hippocampal region. Brain Res Bull. 2012;87:259–273. doi: 10.1016/j.brainresbull.2011.11.006. [DOI] [PubMed] [Google Scholar]
- Chen H, Bagri A, Zupicich JA, Zou Y, Stoeckli E, Pleasure SJ, Lowenstein DH, Skarnes WC, Chédotal A, Tessier-Lavigne M. Neuropilin-2 regulates the development of selective cranial and sensory nerves and hippocampal mossy fiber projections. Neuron. 2000;25:43–56. doi: 10.1016/s0896-6273(00)80870-3. [DOI] [PubMed] [Google Scholar]
- Danglot L, Triller A, Marty S. The development of hippocampal interneurons in rodents. Hippocampus. 2006;16:1032–1060. doi: 10.1002/hipo.20225. [DOI] [PubMed] [Google Scholar]
- de Bergeyck V, Naerhuyzen B, Goffinet AM, Lambert de Rouvroit C. A panel of monoclonal antibodies against reelin, the extracellular matrix protein defective in reeler mutant mice. J Neurosci Methods. 1998;82:17–24. doi: 10.1016/s0165-0270(98)00024-7. [DOI] [PubMed] [Google Scholar]
- Fenstermaker AG, Prasad AA, Bechara A, Adolfs Y, Tissir F, Goffinet A, Zou Y, Pasterkamp RJ. Wnt/planar cell polarity signaling controls the anterior-posterior organization of monoaminergic axons in the brainstem. J Neurosci. 2010;30:16053–16064. doi: 10.1523/JNEUROSCI.4508-10.2010. [DOI] [PMC free article] [PubMed] [Google Scholar]
- Fishell G. Perspectives on the developmental origins of cortical interneuron diversity. Novartis Found Symp. 2007;288:21–35. discussion 35–44:96, 98. [PubMed] [Google Scholar]
- Gao B, Song H, Bishop K, Elliot G, Garrett L, English MA, Andre P, Robinson J, Sood R, Minami Y, Economides AN, Yang Y. Wnt signaling gradients establish planar cell polarity by inducing Vangl2 phosphorylation through Ror2. Dev Cell. 2011;20:163–176. doi: 10.1016/j.devcel.2011.01.001. [DOI] [PMC free article] [PubMed] [Google Scholar]
- Goodrich LV. The plane facts of PCP in the CNS. Neuron. 2008;60:9–16. doi: 10.1016/j.neuron.2008.09.003. [DOI] [PMC free article] [PubMed] [Google Scholar]
- Grove EA, Tole S. Patterning events and specification signals in the developing hippocampus. Cereb Cortex. 1999;9:551–561. doi: 10.1093/cercor/9.6.551. [DOI] [PubMed] [Google Scholar]
- Hébert JM, McConnell SK. Targeting of cre to the Foxg1 (BF-1) locus mediates loxP recombination in the telencephalon and other developing head structures. Dev Biol. 2000;222:296–306. doi: 10.1006/dbio.2000.9732. [DOI] [PubMed] [Google Scholar]
- Hedreen JC, Bacon SJ, Price DL. A modified histochemical technique to visualize acetylcholinesterase-containing axons. J Histochem Cytochem. 1985;33:134–140. doi: 10.1177/33.2.2578498. [DOI] [PubMed] [Google Scholar]
- Hodge RD, Hevner RF. Expression and actions of transcription factors in adult hippocampal neurogenesis. Dev Neurobiol. 2011;71:680–689. doi: 10.1002/dneu.20882. [DOI] [PMC free article] [PubMed] [Google Scholar]
- Holmes GL, Sarkisian M, Ben-Ari Y, Chevassus-Au-Louis N. Mossy fiber sprouting after recurrent seizures during early development in rats. J Comp Neurol. 1999;404:537–553. doi: 10.1002/(sici)1096-9861(19990222)404:4<537::aid-cne9>3.0.co;2-#. [DOI] [PubMed] [Google Scholar]
- Kee N, Sivalingam S, Boonstra R, Wojtowicz JM. The utility of Ki-67 and BrdU as proliferative markers of adult neurogenesis. J Neurosci Methods. 2002;115:97–105. doi: 10.1016/s0165-0270(02)00007-9. [DOI] [PubMed] [Google Scholar]
- Kelsch W, Sim S, Lois C. Watching synaptogenesis in the adult brain. Annu Rev Neurosci. 2010;33:131–149. doi: 10.1146/annurev-neuro-060909-153252. [DOI] [PubMed] [Google Scholar]
- Lavenex P, Banta Lavenex P, Amaral DG. Postnatal development of the primate hippocampal formation. Dev Neurosci. 2007;29:179–192. doi: 10.1159/000096222. [DOI] [PubMed] [Google Scholar]
- Melzer S, Michael M, Caputi A, Eliava M, Fuchs EC, Whittington MA, Monyer H. Long-range-projecting GABAergic neurons modulate inhibition in hippocampus and entorhinal cortex. Science. 2012;335:1506–1510. doi: 10.1126/science.1217139. [DOI] [PubMed] [Google Scholar]
- Métin C, Godement P. The ganglionic eminence may be an intermediate target for corticofugal and thalamocortical axons. J Neurosci. 1996;16:3219–3235. doi: 10.1523/JNEUROSCI.16-10-03219.1996. [DOI] [PMC free article] [PubMed] [Google Scholar]
- Nitsch R, Bergmann I, Küppers K, Mueller G, Frotscher M. Late appearance of parvalbumin-immunoreactivity in the development of GABAergic neurons in the rat hippocampus. Neurosci Lett. 1990;118:147–150. doi: 10.1016/0304-3940(90)90613-e. [DOI] [PubMed] [Google Scholar]
- Okada K, Okaichi H. Functional differentiation and cooperation among the hippocampal subregions in rats to effect spatial memory processes. Behav Brain Res. 2009;200:181–191. doi: 10.1016/j.bbr.2009.01.011. [DOI] [PubMed] [Google Scholar]
- Okada K, Okaichi H. Functional cooperation between the hippocampal subregions and the medial septum in unreinforced and reinforced spatial memory tasks. Behav Brain Res. 2010;209:295–304. doi: 10.1016/j.bbr.2010.02.007. [DOI] [PubMed] [Google Scholar]
- Qu Y, Glasco DM, Zhou L, Sawant A, Ravni A, Fritzsch B, Damrau C, Murdoch JN, Evans S, Pfaff SL, Formstone C, Goffinet AM, Chandrasekhar A, Tissir F. Atypical cadherins Celsr1-3 differentially regulate migration of facial branchiomotor neurons in mice. J Neurosci. 2010;30:9392–9401. doi: 10.1523/JNEUROSCI.0124-10.2010. [DOI] [PMC free article] [PubMed] [Google Scholar]
- Rami A, Bréhier A, Thomasset M, Rabié A. Cholecalcin (28-kDa calcium-binding protein) in the rat hippocampus: development in normal animals and in altered thyroid states. An immunocytochemical study. Dev Biol. 1987;124:228–238. doi: 10.1016/0012-1606(87)90474-x. [DOI] [PubMed] [Google Scholar]
- Ramírez-Amaya V, Balderas I, Sandoval J, Escobar ML, Bermúdez-Rattoni F. Spatial long-term memory is related to mossy fiber synaptogenesis. J Neurosci. 2001;21:7340–7348. doi: 10.1523/JNEUROSCI.21-18-07340.2001. [DOI] [PMC free article] [PubMed] [Google Scholar]
- Rózsa AJ, Guss RB, Beuerman RW. Neural remodeling following experimental surgery of the rabbit cornea. Invest Ophthalmol Vis Sci. 1983;24:1033–1051. [PubMed] [Google Scholar]
- Schimanski LA, Wahlsten D, Nguyen PV. Selective modification of short-term hippocampal synaptic plasticity and impaired memory extinction in mice with a congenitally reduced hippocampal commissure. J Neurosci. 2002;22:8277–8286. doi: 10.1523/JNEUROSCI.22-18-08277.2002. [DOI] [PMC free article] [PubMed] [Google Scholar]
- Shafer B, Onishi K, Lo C, Colakoglu G, Zou Y. Vangl2 promotes Wnt/planar cell polarity-like signaling by antagonizing Dvl1-mediated feedback inhibition in growth cone guidance. Dev Cell. 2011;20:177–191. doi: 10.1016/j.devcel.2011.01.002. [DOI] [PMC free article] [PubMed] [Google Scholar]
- Shima Y, Kawaguchi SY, Kosaka K, Nakayama M, Hoshino M, Nabeshima Y, Hirano T, Uemura T. Opposing roles in neurite growth control by two seven-pass transmembrane cadherins. Nat Neurosci. 2007;10:963–969. doi: 10.1038/nn1933. [DOI] [PubMed] [Google Scholar]
- Sholl DA. Dendritic organization in the neurons of the visual and motor cortices of the cat. J Anat. 1953;87:387–406. [PMC free article] [PubMed] [Google Scholar]
- Sørensen KE. The connections of the hippocampal region. New observations on efferent connections in the guinea pig, and their functional implications. Acta Neurol Scand. 1985;72:550–560. doi: 10.1111/j.1600-0404.1985.tb00914.x. [DOI] [PubMed] [Google Scholar]
- Stenman J, Toresson H, Campbell K. Identification of two distinct progenitor populations in the lateral ganglionic eminence: implications for striatal and olfactory bulb neurogenesis. J Neurosci. 2003;23:167–174. doi: 10.1523/JNEUROSCI.23-01-00167.2003. [DOI] [PMC free article] [PubMed] [Google Scholar]
- Subramanian L, Tole S. Mechanisms underlying the specification, positional regulation, and function of the cortical hem. Cereb Cortex. 2009;19(Suppl 1):i90–95. doi: 10.1093/cercor/bhp031. [DOI] [PubMed] [Google Scholar]
- Suh J, Rivest AJ, Nakashiba T, Tominaga T, Tonegawa S. Entorhinal cortex layer III input to the hippocampus is crucial for temporal association memory. Science. 2011;334:1415–1420. doi: 10.1126/science.1210125. [DOI] [PubMed] [Google Scholar]
- Tissir F, Goffinet AM. Expression of planar cell polarity genes during development of the mouse CNS. Eur J Neurosci. 2006;23:597–607. doi: 10.1111/j.1460-9568.2006.04596.x. [DOI] [PubMed] [Google Scholar]
- Tissir F, Goffinet AM. Planar cell polarity signaling in neural development. Curr Opin Neurobiol. 2010;20:572–577. doi: 10.1016/j.conb.2010.05.006. [DOI] [PubMed] [Google Scholar]
- Tissir F, Bar I, Jossin Y, De Backer O, Goffinet AM. Protocadherin Celsr3 is crucial in axonal tract development. Nat Neurosci. 2005;8:451–457. doi: 10.1038/nn1428. [DOI] [PubMed] [Google Scholar]
- van Groen T, Miettinen P, Kadish I. The entorhinal cortex of the mouse: organization of the projection to the hippocampal formation. Hippocampus. 2003;13:133–149. doi: 10.1002/hipo.10037. [DOI] [PubMed] [Google Scholar]
- Wang Y, Nathans J. Tissue/planar cell polarity in vertebrates: new insights and new questions. Development. 2007;134:647–658. doi: 10.1242/dev.02772. [DOI] [PubMed] [Google Scholar]
- Wang Y, Thekdi N, Smallwood PM, Macke JP, Nathans J. Frizzled-3 is required for the development of major fiber tracts in the rostral CNS. J Neurosci. 2002;22:8563–8573. doi: 10.1523/JNEUROSCI.22-19-08563.2002. [DOI] [PMC free article] [PubMed] [Google Scholar]
- Wang Y, Guo N, Nathans J. The role of Frizzled3 and Frizzled6 in neural tube closure and in the planar polarity of inner-ear sensory hair cells. J Neurosci. 2006;26:2147–2156. doi: 10.1523/JNEUROSCI.4698-05.2005. [DOI] [PMC free article] [PubMed] [Google Scholar]
- Witter MP. Connections of the subiculum of the rat: topography in relation to columnar and laminar organization. Behav Brain Res. 2006;174:251–264. doi: 10.1016/j.bbr.2006.06.022. [DOI] [PubMed] [Google Scholar]
- Witter MP, Amaral DG. Hippocampal formation. In: Paxinos G, editor. The rat nervous system. London: Elsevier; 2004. pp. 635–704. [Google Scholar]
- Ying G, Wu S, Hou R, Huang W, Capecchi MR, Wu Q. The protocadherin gene Celsr3 is required for interneuron migration in the mouse forebrain. Mol Cell Biol. 2009;29:3045–3061. doi: 10.1128/MCB.00011-09. [DOI] [PMC free article] [PubMed] [Google Scholar]
- Zhou L, Bar I, Achouri Y, Campbell K, De Backer O, Hebert JM, Jones K, Kessaris N, de Rouvroit CL, O'Leary D, Richardson WD, Goffinet AM, Tissir F. Early forebrain wiring: genetic dissection using conditional Celsr3 mutant mice. Science. 2008;320:946–949. doi: 10.1126/science.1155244. [DOI] [PMC free article] [PubMed] [Google Scholar]
- Zhou L, Gall D, Qu Y, Prigogine C, Cheron G, Tissir F, Schiffmann SN, Goffinet AM. Maturation of “neocortex isole” in vivo in mice. J Neurosci. 2010;30:7928–7939. doi: 10.1523/JNEUROSCI.6005-09.2010. [DOI] [PMC free article] [PubMed] [Google Scholar]