

Abstract
Perception involves motor control of sensory organs. However, the dynamics underlying emergence of perception from motor-sensory interactions are not yet known. Two extreme possibilities are as follows: (1) motor and sensory signals interact within an open-loop scheme in which motor signals determine sensory sampling but are not affected by sensory processing and (2) motor and sensory signals are affected by each other within a closed-loop scheme. We studied the scheme of motor-sensory interactions in humans using a novel object localization task that enabled monitoring the relevant overt motor and sensory variables. We found that motor variables were dynamically controlled within each perceptual trial, such that they gradually converged to steady values. Training on this task resulted in improvement in perceptual acuity, which was achieved solely by changes in motor variables, without any change in the acuity of sensory readout. The within-trial dynamics is captured by a hierarchical closed-loop model in which lower loops actively maintain constant sensory coding, and higher loops maintain constant sensory update flow. These findings demonstrate interchangeability of motor and sensory variables in perception, motor convergence during perception, and a consistent hierarchical closed-loop perceptual model.
Introduction
Unlike most artificial sensors, mammalian sensory organs usually acquire information via movements (Lederman and Klatzky, 1987; Sathian, 1989; König and Luksch, 1998; Ahissar and Arieli, 2001; Najemnik and Geisler, 2005; Schroeder et al., 2010). The activation of individual receptors in sensory organs is determined by the interaction between sensor movements and the physical features of external objects. Indeed, motor variables had been shown to affect perception in most sensory modalities (see Discussion). The fact that motor and sensory variables are part of the same chain of processing suggests that motor variables are not limited to modulations of sensory processing, but rather are equal players in perception. Thus, motor and sensory variables are expected to be interchangeable, i.e., changes in either sensory or motor variables can induce perceptual changes to the same extent. In the extreme case, motor changes alone should account for changes in perceptual acuity.
Such interchangeability is implied in several theories and studies of perception (Gibson, 1962; Ahissar and Vaadia, 1990; Jarvilehto, 1999; O'Regan and Noë, 2001; Diamond et al., 2008; Friston, 2010) but was not demonstrated quantitatively so far. Whenever motor variables had been shown to affect perceptual changes, concurrent changes in sensory processing could not be ruled out, primarily because the entire ensemble of sensory variables underlying perception could not be accessed. Therefore, it was not possible to quantify the relative contribution of motor variables to perceptual performance, and especially to determine whether changes in motor strategies alone, without any change in sensory processing, could improve perceptual acuity.
Motor involvement in perception may vary along a continuum of forms. In one extreme case motor and sensory signals may interact within an open-loop scheme in which motor signals determine sensory sampling but are not affected by sensory processing. In the other extreme case motor and sensory signals may be affected by each other within a closed-loop scheme. These two extreme schemes predict different motor dynamics during the perceptual process. An open-loop scheme predicts motor dynamics, which is independent of sensory information. A closed-loop scheme predicts strong coupling between the two. A typical behavior of closed loops is convergence toward a steady state that is characterized by gradual changes of loop variables until a steady behavior is reached (Wiener, 1949; Powers, 1973; Hopfield, 1982; Ahissar and Kleinfeld, 2003; Chakrabarti and Basu, 2008).
To determine the dynamics of a perceptual process, and the relative contribution of motor and sensory variables, we designed a tactile task that allowed reduction of the number of variables determining task-related sensory acquisition. We show that with the strategy selected by our participants there were only three directly relevant overt variables: two motor and one sensory. We found that during this perceptual process these two motor variables were kept constant while other related motor variables exhibited a convergence behavior. Perceptual improvements, obtained by training, involved changes in hand velocity and coordination but, interestingly, not at all changes in the acuity of sensory readout or decision criteria.
Materials and Methods
The experiments were conducted in accordance with institutional guidelines and were approved by the institutional review board. Informed consents were obtained from all participants.
Human participants and experimental setup
Eight human participants, four females and four males aged 17–36, seven right-handed and one left-handed, were blindfolded, ear plugged, and fitted with artificial whiskers (truncated transparent PVC cones 345 mm long with diameters of 1.8 mm at the base and 1.2 mm at the tip) on their fingers, which mimicked rat whiskers (Fig. 1A). The base of each artificial whisker was glued to an electronic force sensor (FS20 load cell; Measurement Specialties; with resolutions of 0.0025 g-force and 1 ms), which was glued to a narrow strip of Velcro tape wrapped around a participant's finger. A 3D position sensor (V-scope, LVS-11-pro; Litek; with resolutions of 0.1 mm and 30 ms) was connected to the strip of Scotch tape on the side of the finger opposite the force sensor. The participants were tested in three consecutive sessions: “Session 1,” “Session 2,” and “Session 3” (control session); Sessions 2 and 3 where conducted on the same day, 1–5 d after the first session. In Session 2, hand positions were measured in only seven of the eight participants. Each experiment was recorded by a video camera mounted on the ceiling.
Figure 1.

Performance of bilateral object localization via manual whisking. A, Experimental setup. Participants sat centered between two poles, one of which was randomly selected to be more posterior by 1–20 cm. Attachment of an artificial whisker, position sensor, and force sensor to an index finger is depicted. B, Position (top) and force signals (bottom) from left and right hands during a single trial. Position signal indicates distance of the whisker base from the posterior wall. Force signal indicates contact time and force at the whisker base. C, Psychophysical curves. Relationships between participants' perceptual reports and differences in touch time (Δt) or pole position (Δx) were normalized for the first two sessions. Data were fitted by sigmoid functions after boxcar averaging (width 0.1 of full scale; Table 1). D, Average thresholds attained in three consecutive sessions (error bars indicate SEM). E, Effect of hand coordination on performance. Psychometric functions were computed, as in C, for Δx and Δx − ΔH with data pooled from first and second sessions (Table 1). F, Localization accuracy (% correct) as a function of ΔH/V for all trials in both first and second sessions. G, Confusion matrix of participants' perceptual reports. Data from both first and second sessions. Percentage of “left” (blue) and “right” (red) perceptual reports are shown for each combination of cues determined from Δx (rows) and Δt (columns). Scale bar, 100%.
Tactile object localization task
Participants sat on a chair that was positioned between two cloth-wrapped (which attenuated auditory cues) metal poles. Both poles were positioned at the same radial distance from the participant. The radial position of each pole was such that when the hands and fingers of the participants were fully extended, whisker–pole contact occurred 20 cm from the whisker base. Participants were instructed to “report which pole is more posterior in the horizontal plane by using the whiskers”; no further instructions or limitations were given. Each session started with a position offset between the poles (Δx = xL − xR, where xL and xR are the distances of the left and right poles from the posterior wall, respectively) of 16 cm. Offsets in subsequent trials followed a staircase paradigm, and thus, were reduced to 10log10(Δx of previous trial) − 0.1 if a correct answer was given and increased to 10log10(Δx of previous trial) + 0.2 otherwise (Knutsen et al., 2006). Verbal feedback (“correct”/“wrong”) was provided by the experimenter after each trial in all sessions. We assume that this correcting feedback facilitated perceptual improvement (Herzog and Fahle, 1997) but had no significant effect on the motor-sensory strategies selected by our participants or on intratrial dynamics. Before the beginning of the first session, participants were given one practice trial at a pole offset of 16 cm. In the third session, the hands of each participant were moved one by one by the experimenter, in a random order in each trial, to a location where the whisker touched the pole. Participants were not allowed to detach their whiskers from the poles (perform “whisking”) during these trials, but were allowed to “refresh” contact by pressing on and releasing off the pole.
Data analysis
Mutual information between Δx and Δt for every |Δx| (Fig. 2A) was calculated by for |Δx| for which enough data points (>3) were available, Therefore for the first session there is no mutual information (MI) analysis for |Δx| = 1, 2 cm, which almost no participant reached in the staircase paradigm.
Figure 2.

Factors underlying improvement of localization between sessions across all participants. A, MI between Δx and Δt as a function of |Δx|. B, C, E, H, Median and quartile as exhibited in the first and second sessions of Δt, Δx, V, and ΔH, respectively. D, G, Average V and ΔH as a function of |Δx|. F, I, Ratio of V and ΔH across sessions as a function of the ratio of thresholds across sessions.
The derivatives of the positions of the participants' hands were calculated, for every data point, by fitting a cubic spline curve to 41 data points (20 before and 20 after the point). Velocity, acceleration, and jerk were calculated analytically by the first, second, and third derivatives of the spline, respectively. Jerk-cost was calculated by the numerical integral of the squared jerk values, and normalized by whisking duration () (Flash and Hogan, 1985) and was used here as a measure of motion smoothness.
Theoretical derivations
The participants were asked to determine whether the left or right poles are more posterior, i.e., whether Δx > 0 or Δx < 0. During each trial, they acquired a sample of the spatial difference (Δx′) in each cycle (Δx′{n} = Δx′1,…, Δx′n; n = 1, 2,…,N, N is the overall number of cycles in a trial). The perceptual probability is hence given by the following:
 |
We assume that (1) the probability of each pole arrangement is a priori identical, P(Δx) = const. and P(Δx < 0) = P(Δx > 0);(2) the perceived spatial difference between poles given poles arrangement in a given cycle, P(Δxi′|Δx), is independent between cycles within a given trial; and (3) P(Δx′i|Δx) is identical for all cycles within a given trial. Thus, P(Δx′i|Δx) are independent and identically distributed. This results in the following:
 |
We take p(Δx′i|Δx) to be a Gaussian distribution around Δx:
 |
where σ is the measurement uncertainty. The perceptual probability then assumes the following form:
 |
 |
where erf is the error function [] and erfc is the complementary error function [].
Results
Motor-sensory coding and interchangeability
Human participants were asked to report which of two poles presented bilaterally to their body was more posterior. The poles were positioned at radial distances of ∼1 m (depending on participants arm length; see Materials and Methods), reachable via artificial whiskers that were attached to a participant's fingers, thus confining sensory information to contact angle, time, and force (Fig. 1A). Finger position, the force applied on it, and task performance were continuously measured. Although participants (n = 8) were free to choose their sensing strategy, all eight employed a temporal-order strategy in which they moved both hands in a coordinated manner (Fig. 1B, upper trace), and interpreted their first contact with a pole as indicating a more posterior position of that pole. Using this strategy, the participants transformed the spatial offset between the poles (Δx) into a temporal delay between right and left contacts (Δt) (Fig. 1B, lower trace). Consequently, perceptual reports of participants correlated strongly with Δt [MI(Δt; Perceptual reports) = 0.97 bits, out of a maximum of 1 bit] and significantly less with Δx [MI(Δx; Perceptual reports) = 0.30 bits] (Fig. 1C; Table 1).
Table 1.
Sigmoid fit parameters for Figure 1, C and E
| a | b | n | R2 | |
|---|---|---|---|---|
| Figure 1C | ||||
| Δt first session | 91.5 | −0.012 | 24.41 | 0.948 |
| Δx first session | 92.2 | −0.05 | 2.48 | 0.935 |
| Δt second session | 100 | 0.007 | 23.25 | 0.9993 |
| Δx second session | 92.7 | −0.04 | 4.38 | 0.988 |
| Figure 1E | ||||
| Δx | 96.1 | 0.42 | 0.162 | 0.953 |
| Δx − ΔH | 101.3 | 0.04 | 0.215 | 0.990 |
a, Sigmoid upper asymptote; b, sigmoid center point; and n, sigmoid slope.
A staircase paradigm was used to reveal the spatial resolution of pole localization (see Materials and Methods). During their first session, participants achieved, on average, a spatial resolution of <TR> = 7.6 cm (where <TR> means average of staircase threshold over participants). When retested on a different day (Session 2), all participants exhibited significantly better spatial resolutions [<TR> = 3.4 cm, p(first vs second session) < 0.001, paired t test; Figure 1, C and D, and Table 1]. This observed improvement depended on active strategies, since elimination of active hand movements, which opened the motor-sensory loop, resulted in reduced performance: when each participant's hand was brought to the pole by the experimenter (in the third session, see Materials and Methods), their performance was similar to that exhibited in the first session (Fig. 1D; <TR> = 6.7 cm, p(first vs third session) = 0.49; p(second vs third session) = 0.018, paired t test). This observation also indicates that the improved perception of spatial offsets by our participants was not based on improved proprioceptive sensing of hand position.
The time delay (Δt) used by our participants as a perceptual cue is determined by the spatial offset between the poles (Δx), by hand dis-coordination (ΔH, the difference in the positions of the hands at the moment of touching the first of the two poles), and hand velocity (V, assuming for simplicity the same velocity for both hands), as follows:
 |
where the right two terms represent the temporal code and temporal error, respectively. This equation shows that the only variables that were directly relevant to performing the task using the strategy selected by our participants were Δt, ΔH, and V. Indeed, perceptual reports correlated better with [Δx − ΔH] than with Δx (Fig. 1E; Table 1), and localization accuracy was inversely related to the temporal error, ΔH/V (Fig. 1F; R2 = 0.93). Furthermore, participants whose hands were more coordinated, i.e., whose mean ΔH was smaller, attained lower localization thresholds (linear regressions of R2 = 0.33 and 0.67, p = 0.18 and 0.02, in the first and second sessions, respectively, n = 7). Analysis of localization errors further illustrated the use of Δt as the perceptual cue by our participants (Fig. 1G). In 78% of the trials in which there was a clear discrepancy between the polarities of the spatial and temporal offsets, participants reported pole location according to the temporal offset. Yet, obviously, sensory coding does not fully explain the reports of the participants; the data here reflects a left-side bias common to trials with and without space–time discrepancy (Fig. 1G; see Discussion).
In principle, the improved perceptual resolution, i.e., the decreased threshold, between Sessions 1 and 2 could either be mediated by improving the readout resolution of Δt (Craig and Belser, 2006) or by changing the mapping between Δx and Δt such that the same Δx is represented by a larger Δt. No significant change was observed in Δt readout between the first and second sessions (Fig. 1C; Table 1); the maximal slope of the psychometrical curve of Δt remained unchanged. In contrast, a clear and robust change in the mapping of spatial to temporal cues via hand movements occurred between the two sessions. During the second session, Δt conveyed significantly more information about Δx for small (<10 cm) Δx offsets (Fig. 2A), increasing the mutual information between Δx and perceptual reports. As a result, despite the significant change in the distribution of Δx values (Fig. 2C), the distribution of Δt values remained unchanged between the first and second sessions (Fig. 2B). Δt values were kept within the range of 150–200 ms (152.7 < Δtfirst < 197.5 ms and 153.6 < Δtsecond < 194.7 ms; 95% confidence intervals of the means).
The changes we observed in localization resolution and accuracy could be obtained by decreasing V and |ΔH|, respectively (Eq. 1). In fact, on average both V and ΔH were reduced in the second session, but only when small (i.e., difficult) spatial offsets (|Δx| < 10 cm) were introduced (Fig. 2D,G). This indicates that motor changes were controlled in a stimulus-dependent manner. In addition, better motor control in the second session was indicated by a dramatic decrease in the trial-by-trial variability of V and |ΔH| (V, from 147 to 22 cm2/s2, p < 10−6, F test; |ΔH|, from 15.6 to 8.1 cm2, p < 10−4, F test).
Although all participants improved their thresholds between Sessions 1 and 2, their improvement strategies differed. V and |ΔH| were reduced in participants who started with high values, and increased with participants who started with low values. As a result, participants converged on smaller ranges of V and |ΔH| in the second session (Fig. 2E,H). V changes were strongly correlated with threshold changes (Fig. 2F, R2 = 0.83). Changes in |ΔH| were not correlated with threshold improvements (Fig. 2I).
Dynamics of motor sampling
The results so far indicate that motor variables are interchangeable with sensory variables in determining perceptual resolution and accuracy; in the paradigm presented here, changes in motor variables alone accounted for almost all perceptual improvements between sessions. We thus examined the dynamics with which motor variables were used to acquire sensory information while perceiving object location.
Whisking patterns varied across participants and trials (Fig. 3A). In general, participants tended to make more whisking cycles when challenged with smaller Δx offsets in both Sessions 1 and 2 (linear regression, R2 = 0.88). The dependency of N on Δt, our participants' sensory cue, took an exponential-like form (Fig. 3B).
Figure 3.

Kinematics of whisking cycles. A, Eight trial trajectories from two participants. In each trial, the position of the left (red) and right (green) hands are plotted as a function of trial time (note that scales differ). Colored vertical bars indicate contact onset times. Δx and the participant's perceptual report are denoted for each trial. B, Average number of whisking cycles in a trial as a function of Δt in Sessions 1 and 2 (n = 8 participants). Fitting parameters for Equation 5: Pdec = 0.77, σ = 379 ms, N∞ = 1.16, and R2 = 0.921 in Session 1; Pdec = 0.85, σ = 279 ms, and N∞ = 1.17, and R2 = 0.877 in Session 2 (p > 0.05, t test for each parameter). C, Average normalized whisking amplitude, duration and set point as a function of whisking cycle number. Fitting parameters of Equation 10: amplitude: aE = 6.74, α = 0.70, R2 = 0.93; duration: aT = 8.05, α = 0.71, R2 = 0.97; set point: aS = 8.44, α = 0.75, R2 = 0.94. D, Right and left hand set points as a function of whisking cycle number. Fitting parameters for (based on Eq. 10): right hand: as = 8.46, α = 0.58, b = 9.28 cm, c = 122.1 cm, R2 = 0.89; left hand: as = 8.79, α = 0.53, b = 8.99 cm, c = 124.1 cm, R2 = 0.89. E, Average normalized |ΔH| and V as a function of whisking cycle number. Data for graphs C–E were pooled from Sessions 1 and 2.
To characterize motor-sensory dynamics, we analyzed the behavior of motor variables determining sensory sampling along individual trials. In trials where more than one whisking cycle was employed, participants tended to gradually decrease cycle duration and amplitude, and to advance cycle onset position (“set point”), exhibiting saturation behavior: changes became gradually smaller as the trial proceeded (Fig. 3C). With our participants, left-hand set point increased more, and therefore was closer to the actual pole position than the right hand (Fig. 3D), possibly due to superior accuracy of position proprioception of nondominant hands (Goble and Brown, 2008).
Interestingly, V and ΔH did not change during the trial (Fig. 3E). As a result (Eq. 1), Δt did not change during the trial [p (a = 0) > 0.4, where “a” is the slope of regression between Δt and cycle #, for trials with 3–6 cycles]. Moreover, although their mean values were changed significantly between sessions, the profiles of V and ΔH during each cycle remained constant (Fig. 4) (Kelso et al., 1979; Andrews and Coppola, 1999). Yet, these profiles were carried out in a smoother fashion during Session 2. The jerk-cost (Flash and Hogan, 1985) of the entire cycle movement (normalized by duration, see Materials and Methods) was reduced by 45% in Session 2 (p < 0.05, t test).
Figure 4.

Mean cycle patterns for V (top) and ΔH (bottom) for all trials of Sessions 1 and 2 for seven participants (P1–P7). In each panel, mean values are normalized and plotted as a function of protraction phase between onset (“0”) and contact with the pole (“1”).
The dynamics of motor sampling (Fig. 3) appeared to follow a gradual process during which motor variables approached certain asymptotic values. This behavior is typical to closed-loop systems, while they approach steady states. Moreover, the fact that those variables that gradually changed were those that did not determine sensory coding directly (Fig. 3C), while the code-determining variables remained unchanged during a trial (Fig. 3E), resembles a closed-loop optimal control scheme (Todorov and Jordan, 2002), which in this case controls sensory coding. Closed-loop optimal control is a method of automatic control in which the operating conditions of the controlled object are maintained such that a criterion function, called performance criterion, target function, or objective function, is maximized (Korovin, 1979; Todorov, 2004). Closed-loop optimal control is usually used when the behavior of the controlled object is uncertain, such as when controlling resonance circuits, chemical reactors, or crushing processes. Given the inherent uncertainty of sensory coding, we tried to see whether our results can be explained by a closed-loop optimal control of sensory coding (Powers, 1973). Due to the coordinated movement of the two hands, the motor-sensory strategy selected by our participants can be considered as an active version of the well studied temporal order judgment task (Hirsh and Sherrick, 1961; Pöppel, 2004), the performance of which was shown to be captured by a Bayesian integration model (Miyazaki et al., 2006). Consequently, we used Bayes' theory for modeling the accumulation of sensory information over cycles.
Bayesian accumulation of perceptual confidence
The perception of relative object location, i.e., which pole is more posterior, can be modeled as a binary probabilistic decision-making process, updated using Bayes theorem upon each new contact (see Materials and Methods). The perceptual probability the participant updates along a trial is denoted by P(n) = P(Δx > 0|Δx′{n}), where Δx′{n} = {Δx′1,…, Δx′n} is the sequence of perceived spatial differences Δx′i and Δx is the physical difference between the poles. In other words, the participant's brain updates the probability of the left pole being more posterior upon perceiving the spatial difference after each cycle, i. Bayes theorem in this scenario, incorporating our assumptions (see Materials and Methods), is given by the following:
 |
We have shown that the strategy used by our participants represents the spatial difference Δx by the temporal difference Δt (Eq. 1). Furthermore, we have shown that the latter remains constant throughout the trial. Hence, the perceptual probability at cycle n acquires the following form (see Materials and Methods; Eq. M.2):
 |
 |
 |
Here, σ relates to the measurement uncertainty and Δt′ is the perceived temporal difference between the poles contacts. As Δt was kept more or less constant for each trial, by keeping ΔH and V constant (Fig. 3E), we take Δt′ = 〈Δt〉 when using Equation 3, in the analysis of the average (over participants and identical trials) dependence of N (the total number of cycles in a trial) on task difficulty.
We define the perceptual confidence as follows:
 |
where H(P(N)) is the entropy; the confidence is set such that 0 ≤ C(N) ≤ 1 and should be maximized. We assume that participants made a decision when (after N cycles) a specific confidence level was reached, C(N) ≥ Cdec, where Cdec does not depend on task difficulty. This inequality is equivalent to |P(N) − 0.5| ≥ Pdec − 0.5 since C(N) is a monotonous and symmetric function of P(N) around P(N) = 0.5, hence there is a monotonous function f(C(N)) such that |P(N) − 0.5| = f(C(N)). It then follows (Eq. 3) that the number of cycles required to reach a decision threshold Cdec is inversely related to α. Specifically, the number of cycles required to reach a perceptual confidence that is greater than Cdec is given by the following: N = ln(Pdec−1 − 1)/ln(α). Given Equation 3, the dependency described in Figure 3B is given by the general equation as follows:
 |
Where we added N∞, to account for the asymptotically easiest task, 〈Δt〉 → ∞, which still requires at least one cycle.
To extract the model parameters, Cdec, σ, N∞, we have fitted the predicted behavior to the data presented in Figure 3B, for both sessions (Fig. 3B, red and blue curves). Equation 5 could explain the data in both sessions to a similar extent (Fig. 3B; R2 = 0.92 and 0.877 in Sessions 1 and 2, respectively; the difference between sessions was not significant: p > 0.05, t test). Equation 5 explained our data slightly better than a strict exponent (N(Δt′) = ae−Δt′/b + c), with the fitting parameters a = 3.495, b = 242 ms, c = 1.29: root mean square error = 0.20 (R2 = 0.90) versus 0.21 (R2 = 0.89) cycles, respectively, for the entire data from both sessions. Fitting the entire data from both sessions to the model in Equation 5 revealed that Cdec = 0.82, σ = 317 ms, and N∞ = 1.17. The value of σ alludes to the overall perceptual uncertainty, which in this task is primarily affected by sensory temporal uncertainty and motor-related uncertainties. This value matches experimental observations: uncertainties of bilateral temporal order judgments at confidence levels of ∼0.8 are in the order of 100 ms (Laasonen et al., 2001; Zampini et al., 2003; Pöppel, 2004; Zampini et al., 2005) and variability of hand coordination of our participants mapped to temporal uncertainties in the order of 200 ms (Fig. 2D,G). The value of the confidence decision threshold Cdec resembles values of introspective confidence levels reported during other tactile tasks (Gamzu and Ahissar, 2001). The asymptotic value of N∞ corresponds to the minimal number of cycles required even for the easiest task, i.e., one cycle.
Minimal energy model of motor sampling
In analogy with the optimal control scheme (Todorov and Jordan, 2002), we postulate that the objective of the participants was to maximize their perceptual confidence while minimizing the energetic costs associated with the process. Unlike the conventional optimal control scheme, in which the objective is external (e.g., reaching a target), the objective here is internal. Hence, the motor goal and motor energetic cost terms are mapped here to the perceptual confidence and motor-sensory energetic cost terms, respectively. The latter is the sum of a motor energy term, proportional to the square of the velocity, and a sensory energy term. Metabolic costs of sensory processing, as measured via changes in blood oxygenation and flow, had been consistently shown to be related to the amount of change in sensory content (Frostig et al., 1990; Malonek and Grinvald, 1996; Rees et al., 1997). In the terminology adapted here, under the assumption that the absolute value of the rate of change in perceptual confidence in our experiments was monotonic with the rate of change in the sensory content, this is mapped to the square of the change in perceptual probability over time, (we take the square of the time derivative to have a differentiable function, as the absolute value is not differentiable at zero); the greater or faster the change, the greater the cost of sensory processing.
To formulate the motor energetic cost we approximate each cycle (Fig. 3A) as a sinusoidal trajectory: x(t;n) = xmax (n)sin(2πt/T(n)), where n = 1,…, N is the cycle number. Here, we take , i.e., that the average velocity is constant between trials. This approximation is valid for our data since the patterns of motion remained constant and sinusoidal-like (Fig. 4), and only their amplitudes and durations changed from cycle to cycle.
The objective function can then be formulated in the following equation:
 |
Here, the first term is the task term, i.e., maximization of perceptual confidence; the second term represents the motor energy cost, and the third term is the processing cost, where ΔP(n) = P(n) − P(n − 1) is the change in perceptual probability from cycle to cycle. The terms are added to each other because we assume no interaction between the terms. Such additive functions are widely assumed in objective functions and are indirectly supported by reasonably good fits with experimental data (Izawa et al., 2008; Simpkins et al., 2008).
Equation 6 is developed as follows. First, we segmented time to cycles, assuming there is no interaction between cycles. Next, we applied a discrete update of the perceptual probability. Finally, we used the fact that average velocities were kept constant between trials.
The goal is to find a motor policy that will maximize this objective function. The participants can control the motor strategy via several motor variables; here we consider a control via changes in the duration of each cycle, T(n). It can be shown that assuming control via whisking amplitude or set point would yield similar results. We define the functional that depends on the duration-per-cycle function as follows:
 |
We assume that each cycle can be controlled independently by the participants. The functional does not include the term C(N) because C(n) did not depend on T(n) in our experiments: V and ΔH at touch were constant over cycles and did not depend on T, hence the coding sensory variable, Δt, and the resulting C(n) did not depend on T. Furthermore, the functional is also independent between cycles, i.e., it has no “memory” or cross-terms between different cycles. Hence, each cycle can be minimized independently as follows:
 |
Here, fn(T(n)) is the cost of each cycle, which depends on cycle duration. It is minimized by equating its derivative, with respect to the duration, to zero. The final result states that cost minimization is achieved by making each cycle's duration proportional to the (expected) change in perceptual probability.
Several comments are in order. The first is a symmetric interpretation of the motor and processing costs: the position relates to an external (physical) state whereas the perceptual probability relates to an internal (cognitive) state. A change in either incurs a cost in a similar manner. The second comment relates to the temporal pattern of control. Motion control is assumed to be continuous in its basic level, within each whisking cycle, and discrete in a higher level in which perceptual probability and cycle-related motor variables are updated once per cycle. Third, the empirical finding that average velocities remain constant between trials leads to the conclusion, within the boundaries of our model, that the rate of perceptual change is actively maintained constant. In other words, the participants' optimal policy is to gradually decrease each cycle's duration as perceptual confidence gradually converges. This maintenance of balance between motor and processing energetic costs (shorter motor cycles per smaller perceptual changes) results in a constant sensory update flow (in units of time along the trial: shorter intersample intervals per smaller perceptual updates).
One thus gets that the duration of each cycle should be proportional to the perceptual change (Eq. 8) and should thus decay with the number of cycles (Eq. 3) as follows:
 |
Furthermore, since contact velocity was kept constant with cycles, it entailed that E(n) ∝ vcontact × T(n) ∝ ΔP(n), i.e., cycle amplitude E(n) should also decrease, as indeed observed. Finally, the set point S(n) = 1 − E(n) (set point plus amplitude equals the contact position, which was constant for each trial) must increase with decreased amplitude (as observed) to establish continued contact. We thus get the following:
 |
 |
We fitted each of the three modulated variables, namely, amplitude (E), duration (T), and set point (S) of a cycle, to a function of this form (Eqs. 9, 10), assuming that the motor variables in a given cycle did not depend on the total number of cycles in that trial.
Discussion
This work addressed the dynamic characteristics of the process of perceiving object position, and the relative contribution of motor and sensory variables to this process. Addressing this topic requires identification and monitoring of all relevant motor and sensory variables. This is usually impossible because the motor and sensory variables used by each individual, shaped by her or his idiosyncratic lifetime experience, are not known. We thus challenged human participants with a novel tactile task, in which interactions with external objects were allowed only via artificial whiskers. Analysis of participants' behavior and reports, hand positions, and contact times revealed that all our participants employed the same strategy for solving this task: they moved both hands as synchronized and as coordinated as possible and judged the spatial offset between the poles by reading out the temporal offsets between bilateral contacts. Under this strategy, the number of overt variables underlying perceptual acuity was reduced to three, all measured during the experiments: two motor (hand velocity and coordination) and one sensory (readout of a temporal delay). Using this task we showed that it is possible to improve localization acuity by changing the two motor variables alone without any change in the acuity of sensory readout. We further showed that the dynamics of motor variables during each perceptual trial resembled the dynamics of convergence processes in closed loops. Using mathematical modeling we showed that our data fit a scheme of hierarchical closed loops in which lower loops control sensation reliability and higher loops control sensory update flow. Constant sensation reliability was obtained here by keeping constant velocity and interhand difference, and constant update flow was kept by decreasing cycle duration.
Convergence versus repeated sampling
In these experiments, perception of object location emerged in each trial via an iterative process, during which participants made multiple contacts with the poles, where the number of contacts increased exponentially with task difficulty. During this process, several motor variables (hand set points, whisking amplitude, cycle duration) exhibited saturating exponential behaviors, which converged to steady values (Fig. 3C). Thus, rather than merely repeating the same sampling motion again and again, the tactile system exhibited systematic dynamics, typical to closed loops when approaching a steady state (Wiener, 1949; Powers, 1973; Hopfield, 1982; Ahissar, 1998; Ahissar and Kleinfeld, 2003).
If a perceptual system indeed converges to a steady state, such a state is expected to be optimized for perception. The actual ensemble of motor and sensory variables that compose such a state, and their values, are most likely determined by experience and by the task in hand (O'Regan and Noë, 2001; Purves et al., 2001). In the current case, the ensemble of relevant motor variables included variables that directly determined sensory coding (V and ΔH), and other variables that affected motor-scanning patterns (whisking amplitude, duration, and set point). Interestingly, the coding-determining variables, V and ΔH, were kept constant during this process (Fig. 3E), suggesting that they were treated as “controlled parameters” (Todorov and Jordan, 2002) in a control strategy that is aimed at optimizing sensation (Najemnik and Geisler, 2005; Simony et al., 2008; Gordon and Ahissar, 2011) rather than motion (Osu et al., 2004; Doya, 2007; Dayan and Daw, 2008; Nagengast et al., 2009).
A schematic description of the perceptual process
Our data suggest a hierarchical scheme of closed loops, with at least two levels. Fitting our data to a Bayesian perceptual process (Fig. 3) resulted in two levels of controlled variables (Fig. 5A). In a low level, constant sensation reliability is maintained by keeping hand velocity and interhand difference constant. In a higher level, constant sensory update flow is maintained by decreasing cycle duration. According to our data, the control mechanism, sensory readout mechanisms, and the internal confidence threshold did not change between sessions. The improvement in perceptual acuity, between sessions, was achieved here primarily by changing the mapping between Δx to Δt, via changing hand velocity (Figs. 5B, 2D–F).
Figure 5.
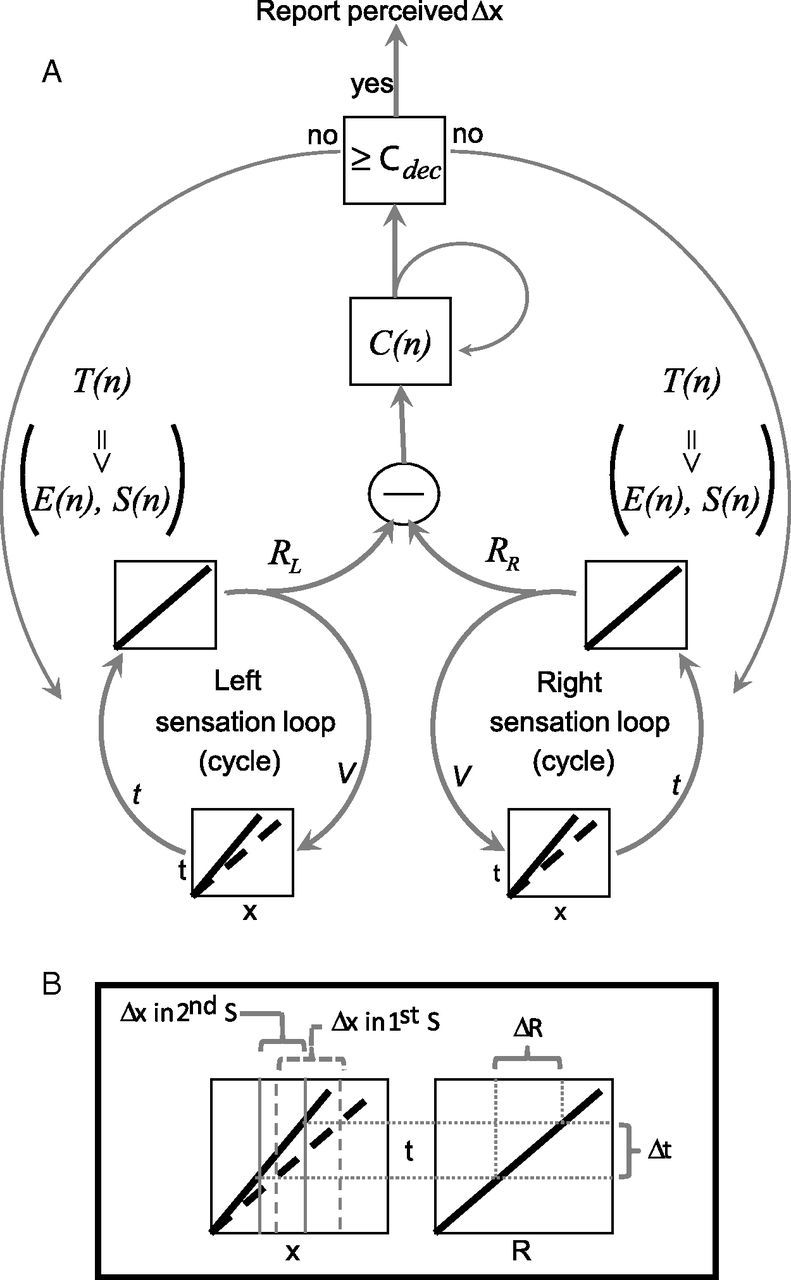
A conceptual model for hierarchical motor-sensory convergence implicated by this study. A, Left and right sensation loops control hand velocity (V) to convert position signals (x) to temporal signals (t); two different conversions, related to two different V values, are indicated by the solid and dashed curves. The same loops recode the t signals as internal representations (R). The bilateral R signals are subtracted from each other, and the difference is integrated in C(n) according to Equations 3 and 4. The left and right sensation loops continuously execute whisking cycles as long as C < Cdec, with cycle duration, and as a result also set point and amplitude, being controlled by higher loops. When C ≥ Cdec, the system exits the active sensation mode and reports the perceived offset. B, Dependence of space-to-time conversion on hand velocity. When V decreases, as occurred in Session 2, smaller Δx offsets are mapped to Δt delays that previously (e.g., in Session 1) represented larger Δx offsets. The transformation from t to R remains unchanged.
The tactile system of our participants also controlled hand coordination (ΔH). Closed-loop control of perceptual accuracy via hand coordination would predict that the reporting bias of our participants (Fig. 1G) stemmed from coordination errors. If the perceptual system assumes balanced hand coordination while the hands are actually offset (Fig. 3D; p < 0.001 Pearson χ2 test), it would indeed be inclined to perceive objects positioned more posterior on the side of the more forward hand, as was the case with our participants.
Our theoretical model suggests that the tactile system makes an effort to keep a constant sensory update flow to maximize perceptual confidence while minimizing motor energy and processing costs during perceptual accumulation. In the current experiment, participants' hands were outstretched throughout the trials, which may contribute to fatigue and attempt to minimize movement energy. Furthermore, it is known that processing and accumulation of new information has a metabolic cost (Laughlin et al., 1998) whose theoretical considerations were previously addressed (Schmidhuber, 1997; Polani, 2009; Still, 2009). Balancing between the amount of novel information (Gordon and Ahissar, 2011, 2012) and movement and processing costs suggested that a constant update flow may be a selected perceptual strategy in this study. Yet, although this interpretation emerged from formalization that is self-consistent and consistent with our data, it is probably not unique in that sense and thus not the only possible interpretation of our data.
Motor versus sensory plasticity
The strong motor bias observed here for rapid improvements may reflect different time scales of motor and sensory adaptation processes. Adjustment of sensory processing (Ahissar et al., 1998; Ego-Stengel et al., 2001) is complicated by the necessity to adjust a cascade of readout circuits in a sequential order (Ahissar and Ahissar, 1994). This is a slow process (Karni and Sagi, 1993; Ahissar and Hochstein, 1997) that is most likely based on selection (Ziv and Smith, 1996) and stabilization of synaptic connections (Xu et al., 2009). In contrast, adjustment of motor patterns is a faster process, based primarily on reorganization of spiking patterns (Georgopoulos, 1986; Aertsen et al., 1991; Hatsopoulos et al., 2007). This difference in the adaptation of sensory and motor processes may explain a learning strategy in which adaptation to a new environment is initiated by motor adjustments, and then slowly stabilized by sensory adjustments.
Interchangeability of motor and sensory variables in perception
The importance of motor strategies for perception has already been demonstrated for sight, taste, smell, and touch (Halpern, 1983; Lederman and Klatzky, 1987; Jones and Hunter, 1993; Turvey, 1996; Ahissar and Arieli, 2001; Cascio and Sathian, 2001; Gamzu and Ahissar, 2001; Bahar et al., 2004; Cullen, 2004; Najemnik and Geisler, 2005; Sailer et al., 2005; Kepecs et al., 2006; Land, 2006; Ahissar and Knutsen, 2008; Knutsen et al., 2008; Laubrock et al., 2008; Wilson, 2008; Chiel et al., 2009; Curtis and Kleinfeld, 2009; Knutsen and Ahissar, 2009; Ko et al., 2010). Furthermore, inextricable links between motor and sensory functions in the brain had been repeatedly indicated (Carmena et al., 2003; Caputi, 2004; Avenanti et al., 2007; Matyas et al., 2010; Li et al., 2011). However, the relative contribution of motor and sensory variables to perceptual accuracy and resolution could not be analyzed quantitatively in these studies because not all task-relevant sensory and motor variables could be isolated and monitored. Thus, the degree of the actual motor-sensory interchangeability could not be assessed and compared with theoretical predictions (Ahissar and Vaadia, 1990; Jarvilehto, 1999; Ahissar and Arieli, 2001; O'Regan and Noë, 2001; Diamond et al., 2008; Friston, 2010). The contribution of the current study is in providing a boundary for motor-sensory interchangeability. It shows that motor and sensory variables are in principle fully interchangeable, at least during the perception of object position, such that in certain conditions changes in motor variables alone can improve perceptual acuity without any changes in the acuity of sensory readout (Fig. 1C). This potential for complete motor-sensory interchangeability means that the brain can distribute changes in processing along the entire motor-sensory loop, depending on the task at hand. This conclusion is in line with the inextricable coupling between neuronal motor and sensory subsystems cited above.
Almost every experiment applies a reductionist approach, in which a reduced set of components of a system is studied, usually in unnatural conditions. To study visual perception, for example, unnatural stimuli such as flashing stimuli are often applied to subjects with immobilized heads for durations that do not allow significant eye movements. Such experiments revealed fundamental operational principles of subcomponents of the brain. Moreover, use of artificial media such as prism goggles enabled the exposure of mechanisms of plasticity that would remain hidden otherwise. Likewise, our artificial whisker sensors and localization task enabled the exposure of an extreme case of sensory-motor interchangeability and the dynamics of tactile perception. The paradigm presented here can be further used to expose features related solely to the motor branch of the natural motor-sensory acquisition loop and to investigate the dependency of perceptual accuracy and resolution on the motor dynamics of the sensors.
Notes
Supplemental elaborated derivation of Equation M.1 for this article is available at http://www.weizmann.ac.il/neurobiology/labs/ahissar/unpub/Wh_Eq_M.1-2.pdf. This material has not been peer reviewed.
Footnotes
This work was supported by European Union Grant BIOTACT (ICT-215910), Israeli Science Foundation Grant No. 749/10, United States-Israel Binational Science Foundation Grant No. 2007121, and the Minerva Foundation, funded by the Federal German Ministry for Education and Research. E. Ahissar holds the Helen Diller Family Professorial Chair of Neurobiology. A.S. was supported by the Adams Fellowship Program of the Israel Academy of Sciences and Humanities. We thank R. Malach, D. Sagi, D. Shore, and N. Ulanovsky for helpful discussions; and B. Schick for reviewing the manuscript. We thank S. Haidarliu for drawing Figure 1A.
References
- Aertsen A, Vaadia E, Abeles M, Ahissar E, Bergman H, Karmon B, Lavner Y, Margalit E, Nelken I, Rotter S. Neural interactions in the frontal cortex of a behaving monkey: signs of dependence on stimulus context and behavioral state. J Hirnforsch. 1991;32:735–743. [PubMed] [Google Scholar]
- Ahissar E. Temporal-code to rate-code conversion by neuronal phase-locked loops. Neural Comput. 1998;10:597–650. doi: 10.1162/089976698300017683. [DOI] [PubMed] [Google Scholar]
- Ahissar E, Ahissar M. Plasticity in auditory cortical circuitry. Curr Opin Neurobiol. 1994;4:580–587. doi: 10.1016/0959-4388(94)90060-4. [DOI] [PubMed] [Google Scholar]
- Ahissar E, Arieli A. Figuring space by time. Neuron. 2001;32:185–201. doi: 10.1016/s0896-6273(01)00466-4. [DOI] [PubMed] [Google Scholar]
- Ahissar E, Kleinfeld D. Closed-loop neuronal computations: focus on vibrissa somatosensation in rat. Cereb Cortex. 2003;13:53–62. doi: 10.1093/cercor/13.1.53. [DOI] [PubMed] [Google Scholar]
- Ahissar E, Knutsen PM. Object localization with whiskers. Biol Cybern. 2008;98:449–458. doi: 10.1007/s00422-008-0214-4. [DOI] [PubMed] [Google Scholar]
- Ahissar E, Vaadia E. Oscillatory activity of single units in a somatosensory cortex of an awake monkey and their possible role in texture analysis. Proc Natl Acad Sci U S A. 1990;87:8935–8939. doi: 10.1073/pnas.87.22.8935. [DOI] [PMC free article] [PubMed] [Google Scholar]
- Ahissar E, Abeles M, Ahissar M, Haidarliu S, Vaadia E. Hebbian-like functional plasticity in the auditory cortex of the behaving monkey. Neuropharmacology. 1998;37:633–655. doi: 10.1016/s0028-3908(98)00068-9. [DOI] [PubMed] [Google Scholar]
- Ahissar M, Hochstein S. Task difficulty and the specificity of perceptual learning. Nature. 1997;387:401–406. doi: 10.1038/387401a0. [DOI] [PubMed] [Google Scholar]
- Andrews TJ, Coppola DM. Idiosyncratic characteristics of saccadic eye movements when viewing different visual environments. Vis Res. 1999;39:2947–2953. doi: 10.1016/s0042-6989(99)00019-x. [DOI] [PubMed] [Google Scholar]
- Avenanti A, Bolognini N, Maravita A, Aglioti SM. Somatic and motor components of action simulation. Curr Biol. 2007;17:2129–2135. doi: 10.1016/j.cub.2007.11.045. [DOI] [PubMed] [Google Scholar]
- Bahar A, Dudai Y, Ahissar E. Neural signature of taste familiarity in the gustatory cortex of the freely behaving rat. J Neurophysiol. 2004;92:3298–3308. doi: 10.1152/jn.00198.2004. [DOI] [PubMed] [Google Scholar]
- Caputi AA. Contributions of electric fish to the understanding of sensory processing by reafferent systems. J Physiol Paris. 2004;98:81–97. doi: 10.1016/j.jphysparis.2004.03.002. [DOI] [PubMed] [Google Scholar]
- Carmena JM, Lebedev MA, Crist RE, O'Doherty JE, Santucci DM, Dimitrov DF, Patil PG, Henriquez CS, Nicolelis MA. Learning to control a brain-machine interface or reaching and grasping by primates. PLoS Biol. 2003;1:E42. doi: 10.1371/journal.pbio.0000042. [DOI] [PMC free article] [PubMed] [Google Scholar]
- Cascio CJ, Sathian K. Temporal cues contribute to tactile perception of roughness. J Neurosci. 2001;21:5289–5296. doi: 10.1523/JNEUROSCI.21-14-05289.2001. [DOI] [PMC free article] [PubMed] [Google Scholar]
- Chakrabarti BK, Basu A. Neural network modeling. Prog Brain Res. 2008;168:155–168. doi: 10.1016/S0079-6123(07)68013-3. [DOI] [PubMed] [Google Scholar]
- Chiel HJ, Ting LH, Ekeberg O, Hartmann MJ. The brain in its body: motor control and sensing in a biomechanical context. J Neurosci. 2009;29:12807–12814. doi: 10.1523/JNEUROSCI.3338-09.2009. [DOI] [PMC free article] [PubMed] [Google Scholar]
- Craig JC, Belser AN. The crossed-hands deficit in tactile temporal-order judgments: the effect of training. Perception. 2006;35:1561–1572. doi: 10.1068/p5481. [DOI] [PubMed] [Google Scholar]
- Cullen KE. Sensory signals during active versus passive movement. Curr Opin Neurobiol. 2004;14:698–706. doi: 10.1016/j.conb.2004.10.002. [DOI] [PubMed] [Google Scholar]
- Curtis JC, Kleinfeld D. Phase-to-rate transformations encode touch in cortical neurons of a scanning sensorimotor system. Nat Neurosci. 2009;12:492–501. doi: 10.1038/nn.2283. [DOI] [PMC free article] [PubMed] [Google Scholar]
- Dayan P, Daw ND. Decision theory, reinforcement learning, and the brain. Cogn Affect Behav Neurosci. 2008;8:429–453. doi: 10.3758/CABN.8.4.429. [DOI] [PubMed] [Google Scholar]
- Diamond ME, von Heimendahl M, Knutsen PM, Kleinfeld D, Ahissar E. ‘Where’ and ‘what’ in the whisker sensorimotor system. Nat Rev Neurosci. 2008;9:601–612. doi: 10.1038/nrn2411. [DOI] [PubMed] [Google Scholar]
- Doya K. Reinforcement learning: computational theory and biological mechanisms. HFSP J. 2007;1:30–40. doi: 10.2976/1.2732246. [DOI] [PMC free article] [PubMed] [Google Scholar]
- Ego-Stengel V, Shulz DE, Haidarliu S, Sosnik R, Ahissar E. Acetylcholine-dependent induction and expression of functional plasticity in the barrel cortex of the adult rat. J Neurophysiol. 2001;86:422–437. doi: 10.1152/jn.2001.86.1.422. [DOI] [PubMed] [Google Scholar]
- Flash T, Hogan N. The coordination of arm movements: an experimentally confirmed mathematical model. J Neurosci. 1985;5:1688–1703. doi: 10.1523/JNEUROSCI.05-07-01688.1985. [DOI] [PMC free article] [PubMed] [Google Scholar]
- Friston K. The free-energy principle: a unified brain theory? Nat Rev Neurosci. 2010;11:127–138. doi: 10.1038/nrn2787. [DOI] [PubMed] [Google Scholar]
- Frostig RD, Lieke EE, Ts'o DY, Grinvald A. Cortical functional architecture and local coupling between neuronal activity and the microcirculation revealed by in vivo high-resolution optical imaging of intrinsic signals. Proc Natl Acad Sci U S A. 1990;87:6082–6086. doi: 10.1073/pnas.87.16.6082. [DOI] [PMC free article] [PubMed] [Google Scholar]
- Gamzu E, Ahissar E. Importance of temporal cues for tactile spatial-frequency discrimination. J Neurosci. 2001;21:7416–7427. doi: 10.1523/JNEUROSCI.21-18-07416.2001. [DOI] [PMC free article] [PubMed] [Google Scholar]
- Georgopoulos AP. On reaching. Annu Rev Neurosci. 1986;9:147–170. doi: 10.1146/annurev.ne.09.030186.001051. [DOI] [PubMed] [Google Scholar]
- Gibson JJ. Observations on active touch. Psychol Rev. 1962;69:477–491. doi: 10.1037/h0046962. [DOI] [PubMed] [Google Scholar]
- Goble DJ, Brown SH. Upper limb asymmetries in the matching of proprioceptive versus visual targets. J Neurophysiol. 2008;99:3063–3074. doi: 10.1152/jn.90259.2008. [DOI] [PubMed] [Google Scholar]
- Gordon G, Ahissar E. Reinforcement active learning hierarchical loops. Proceedings of international joint conference on neural networks (JCNN); San Jose, CA: IEEE; 2011. pp. 3008–3015. [Google Scholar]
- Gordon G, Ahissar E. Hierarchical curiosity loops and active sensing. Neural Netw. 2012;32:119–129. doi: 10.1016/j.neunet.2012.02.024. [DOI] [PubMed] [Google Scholar]
- Halpern BP. Tasting and smelling as active, exploratory sensory processes. Am J Otolaryngol. 1983;4:246–249. doi: 10.1016/s0196-0709(83)80066-0. [DOI] [PubMed] [Google Scholar]
- Hatsopoulos NG, Xu Q, Amit Y. Encoding of movement fragments in the motor cortex. J Neurosci. 2007;27:5105–5114. doi: 10.1523/JNEUROSCI.3570-06.2007. [DOI] [PMC free article] [PubMed] [Google Scholar]
- Herzog MH, Fahle M. The role of feedback in learning a vernier discrimination task. Vis Res. 1997;37:2133–2141. doi: 10.1016/s0042-6989(97)00043-6. [DOI] [PubMed] [Google Scholar]
- Hirsh IJ, Sherrick CE., Jr Perceived order in different sense modalities. J Exp Psychol. 1961;62:423–432. doi: 10.1037/h0045283. [DOI] [PubMed] [Google Scholar]
- Hopfield JJ. Neural networks and physical systems with emergent selective computational abilities. Proc Natl Acad Sci U S A. 1982;79:2554–2558. doi: 10.1073/pnas.79.8.2554. [DOI] [PMC free article] [PubMed] [Google Scholar]
- Izawa J, Rane T, Donchin O, Shadmehr R. Motor adaptation as a process of reoptimization. J Neurosci. 2008;28:2883–2891. doi: 10.1523/JNEUROSCI.5359-07.2008. [DOI] [PMC free article] [PubMed] [Google Scholar]
- Jarvilehto T. The theory of the organism-environment system: III. Role of efferent influences on receptors in the formation of knowledge. Integr Physiol Behav Sci. 1999;34:90–100. doi: 10.1007/BF02688715. [DOI] [PubMed] [Google Scholar]
- Jones LA, Hunter IW. A perceptual analysis of viscosity. Exp Brain Res. 1993;94:343–351. doi: 10.1007/BF00230304. [DOI] [PubMed] [Google Scholar]
- Karni A, Sagi D. The time course of learning a visual skill. Nature. 1993;365:250–252. doi: 10.1038/365250a0. [DOI] [PubMed] [Google Scholar]
- Kelso JA, Southard DL, Goodman D. On the nature of human interlimb coordination. Science. 1979;203:1029–1031. doi: 10.1126/science.424729. [DOI] [PubMed] [Google Scholar]
- Kepecs A, Uchida N, Mainen ZF. The sniff as a unit of olfactory processing. Chem Senses. 2006;31:167–179. doi: 10.1093/chemse/bjj016. [DOI] [PubMed] [Google Scholar]
- Knutsen PM, Ahissar E. Orthogonal coding of object location. Trends Neurosci. 2009;32:101–109. doi: 10.1016/j.tins.2008.10.002. [DOI] [PubMed] [Google Scholar]
- Knutsen PM, Pietr M, Ahissar E. Haptic object localization in the vibrissal system: behavior and performance. J Neurosci. 2006;26:8451–8464. doi: 10.1523/JNEUROSCI.1516-06.2006. [DOI] [PMC free article] [PubMed] [Google Scholar]
- Knutsen PM, Biess A, Ahissar E. Vibrissal kinematics in 3D: tight coupling of azimuth, elevation, and torsion across different whisking modes. Neuron. 2008;59:35–42. doi: 10.1016/j.neuron.2008.05.013. [DOI] [PubMed] [Google Scholar]
- Ko HK, Poletti M, Rucci M. Microsaccades precisely relocate gaze in a high visual acuity task. Nat Neurosci. 2010;13:1549–1553. doi: 10.1038/nn.2663. [DOI] [PMC free article] [PubMed] [Google Scholar]
- König P, Luksch H. Active sensing–closing multiple loops. Z Naturforsch C. 1998;53:542–549. doi: 10.1515/znc-1998-7-808. [DOI] [PubMed] [Google Scholar]
- Korovin SK. The great soviet encyclopedia (1970–1979) Ed 3. Toronto, ON, Canada: The Gale Group; 1979. Optimal control. [Google Scholar]
- Laasonen M, Service E, Virsu V. Temporal order and processing acuity of visual, auditory, and tactile perception in developmentally dyslexic young adults. Cogn Affect Behav Neurosci. 2001;1:394–410. doi: 10.3758/cabn.1.4.394. [DOI] [PubMed] [Google Scholar]
- Land MF. Eye movements and the control of actions in everyday life. Prog Retin Eye Res. 2006;25:296–324. doi: 10.1016/j.preteyeres.2006.01.002. [DOI] [PubMed] [Google Scholar]
- Laubrock J, Engbert R, Kliegl R. Fixational eye movements predict the perceived direction of ambiguous apparent motion. J Vis. 2008;8:13.1–17. doi: 10.1167/8.14.13. [DOI] [PubMed] [Google Scholar]
- Laughlin SB, de Ruyter van Steveninck RR, Anderson JC. The metabolic cost of neural information. Nat Neurosci. 1998;1:36–41. doi: 10.1038/236. [DOI] [PubMed] [Google Scholar]
- Lederman SJ, Klatzky RL. Hand movements: a window into haptic object recognition. Cogn Psychol. 1987;19:342–368. doi: 10.1016/0010-0285(87)90008-9. [DOI] [PubMed] [Google Scholar]
- Li Z, O'Doherty JE, Lebedev MA, Nicolelis MA. Adaptive decoding for brain-machine interfaces through Bayesian parameter updates. Neural Comput. 2011;23:3162–3204. doi: 10.1162/NECO_a_00207. [DOI] [PMC free article] [PubMed] [Google Scholar]
- Malonek D, Grinvald A. Interactions between electrical activity and cortical microcirculation revealed by imaging spectroscopy: implications for functional brain mapping. Science. 1996;272:551–554. doi: 10.1126/science.272.5261.551. [DOI] [PubMed] [Google Scholar]
- Matyas F, Sreenivasan V, Marbach F, Wacongne C, Barsy B, Mateo C, Aronoff R, Petersen CC. Motor control by sensory cortex. Science. 2010;330:1240–1243. doi: 10.1126/science.1195797. [DOI] [PubMed] [Google Scholar]
- Miyazaki M, Yamamoto S, Uchida S, Kitazawa S. Bayesian calibration of simultaneity in tactile temporal order judgment. Nat Neurosci. 2006;9:875–877. doi: 10.1038/nn1712. [DOI] [PubMed] [Google Scholar]
- Nagengast AJ, Braun DA, Wolpert DM. Optimal control predicts human performance on objects with internal degrees of freedom. PLoS Comput Biol. 2009;5:e1000419. doi: 10.1371/journal.pcbi.1000419. [DOI] [PMC free article] [PubMed] [Google Scholar]
- Najemnik J, Geisler WS. Optimal eye movement strategies in visual search. Nature. 2005;434:387–391. doi: 10.1038/nature03390. [DOI] [PubMed] [Google Scholar]
- O'Regan JK, Noë A. A sensorimotor account of vision and visual consciousness. Behav Brain Sci. 2001;24:939–973. doi: 10.1017/s0140525x01000115. discussion 973–1031. [DOI] [PubMed] [Google Scholar]
- Osu R, Kamimura N, Iwasaki H, Nakano E, Harris CM, Wada Y, Kawato M. Optimal impedance control for task achievement in the presence of signal-dependent noise. J Neurophysiol. 2004;92:1199–1215. doi: 10.1152/jn.00519.2003. [DOI] [PubMed] [Google Scholar]
- Polani D. Information: currency of life? HFSP J. 2009;3:307–316. doi: 10.2976/1.3171566. [DOI] [PMC free article] [PubMed] [Google Scholar]
- Pöppel E. Lost in time: a historical frame, elementary processing units and the 3-second window. Acta Neurobiol Exp (Wars) 2004;64:295–301. doi: 10.55782/ane-2004-1514. [DOI] [PubMed] [Google Scholar]
- Powers WT. Feedback: beyond behaviorism. Science. 1973;179:351–356. doi: 10.1126/science.179.4071.351. [DOI] [PubMed] [Google Scholar]
- Purves D, Lotto RB, Williams SM, Nundy S, Yang Z. Why we see things the way we do: evidence for a wholly empirical strategy of vision. Philos Trans R Soc Lond B Biol Sci. 2001;356:285–297. doi: 10.1098/rstb.2000.0772. [DOI] [PMC free article] [PubMed] [Google Scholar]
- Rees G, Howseman A, Josephs O, Frith CD, Friston KJ, Frackowiak RS, Turner R. Characterizing the relationship between BOLD contrast and regional cerebral blood flow measurements by varying the stimulus presentation rate. Neuroimage. 1997;6:270–278. doi: 10.1006/nimg.1997.0300. [DOI] [PubMed] [Google Scholar]
- Sailer U, Flanagan JR, Johansson RS. Eye-hand coordination during learning of a novel visuomotor task. J Neurosci. 2005;25:8833–8842. doi: 10.1523/JNEUROSCI.2658-05.2005. [DOI] [PMC free article] [PubMed] [Google Scholar]
- Sathian K. Tactile sensing of surface features. Trends Neurosci. 1989;12:513–519. doi: 10.1016/0166-2236(89)90112-4. [DOI] [PubMed] [Google Scholar]
- Schmidhuber J. Discovering neural nets with low Kolmogorov complexity and high generalization capability. Neural Netw. 1997;10:857–873. doi: 10.1016/s0893-6080(96)00127-x. [DOI] [PubMed] [Google Scholar]
- Schroeder CE, Wilson DA, Radman T, Scharfman H, Lakatos P. Dynamics of active sensing and perceptual selection. Curr Opin Neurobiol. 2010;20:172–176. doi: 10.1016/j.conb.2010.02.010. [DOI] [PMC free article] [PubMed] [Google Scholar]
- Simony E, Saraf-Sinik I, Golomb D, Ahissar E. Sensation-targeted motor control: every spike counts? Focus on: “whisker movements evoked by stimulation of single motor neurons in the facial nucleus of the rat”. J Neurophysiol. 2008;99:2757–2759. doi: 10.1152/jn.90432.2008. [DOI] [PubMed] [Google Scholar]
- Simpkins A, de Callafon R, Todorov E. Optimal trade-off between exploration and exploitation. Proceedings of the American Conference on Control; Washington: Seattle; 2008. pp. 33–38. [Google Scholar]
- Still S. Information-theoretic approach to interactive learning. Europhys Lett. 2009;85:28005. [Google Scholar]
- Todorov E. Optimality principles in sensorimotor control. Nat Neurosci. 2004;7:907–915. doi: 10.1038/nn1309. [DOI] [PMC free article] [PubMed] [Google Scholar]
- Todorov E, Jordan MI. Optimal feedback control as a theory of motor coordination. Nat Neurosci. 2002;5:1226–1235. doi: 10.1038/nn963. [DOI] [PubMed] [Google Scholar]
- Turvey MT. Dynamic touch. Am Psychol. 1996;51:1134–1152. doi: 10.1037//0003-066x.51.11.1134. [DOI] [PubMed] [Google Scholar]
- Wiener N. Cybernetics. New York: Wiley; 1949. [Google Scholar]
- Wilson RI. Neural and behavioral mechanisms of olfactory perception. Curr Opin Neurobiol. 2008;18:408–412. doi: 10.1016/j.conb.2008.08.015. [DOI] [PMC free article] [PubMed] [Google Scholar]
- Xu T, Yu X, Perlik AJ, Tobin WF, Zweig JA, Tennant K, Jones T, Zuo Y. Rapid formation and selective stabilization of synapses for enduring motor memories. Nature. 2009;462:915–919. doi: 10.1038/nature08389. [DOI] [PMC free article] [PubMed] [Google Scholar]
- Zampini M, Shore DI, Spence C. Audiovisual temporal order judgments. Exp Brain Res. 2003;152:198–210. doi: 10.1007/s00221-003-1536-z. [DOI] [PubMed] [Google Scholar]
- Zampini M, Brown T, Shore DI, Maravita A, Röder B, Spence C. Audiotactile temporal order judgments. Acta Psychol (Amst) 2005;118:277–291. doi: 10.1016/j.actpsy.2004.10.017. [DOI] [PubMed] [Google Scholar]
- Ziv NE, Smith SJ. Evidence for a role of dendritic filopodia in synaptogenesis and spine formation. Neuron. 1996;17:91–102. doi: 10.1016/s0896-6273(00)80283-4. [DOI] [PubMed] [Google Scholar]