

Abstract
Many molecules expressed in the CNS contribute to cognitive functions either by modulating neuronal activity or by mediating neuronal trophic support and/or connectivity. An ongoing discussion is whether signaling of nerve growth factor (NGF) through its high-affinity receptor TrkA contributes to attention behavior and/or learning and memory, based on its expression in relevant regions of the CNS such as the hippocampus, cerebral cortex, amygdala and basal forebrain. Previous animal models carrying either a null allele or transgenic manipulation of Ngf or Trka have proved difficult in addressing this question. To overcome this problem, we conditionally deleted Ngf or Trka from the CNS. Our findings confirm that NGF-TrkA signaling supports survival of only a small proportion of cholinergic neurons during development; however, this signaling is not required for trophic support or connectivity of the remaining basal forebrain cholinergic neurons. Moreover, comprehensive behavioral analysis of young adult and intermediate-aged mice lacking NGF-TrkA signaling demonstrates that this signaling is dispensable for both attention behavior and various aspects of learning and memory.
Introduction
The basal forebrain cholinergic (BFC) system is well known to modulate cognitive functions, particularly attention, learning, and memory (Baxter and Chiba, 1999). Many molecules have been implicated in the survival, maintenance, connectivity, and function of the cholinergic system in the brain. Pertaining to this, BFC neurons (BFCNs) are nerve growth factor (NGF) responsive, with the high-affinity NGF-receptor, TrkA, expressed in the cholinergic cell bodies, and its ligand, NGF, mainly produced in cholinergic neuron target regions, such as the hippocampus and cortex (Large et al., 1986; Lu et al., 1989). While the requirement of NGF-TrkA signaling in developing peripheral neurons both in vitro and in vivo is well established (Huang and Reichardt, 2001), its role in BFCNs has proved more elusive. This is due partly to the short survival of the Ngf and Trka null mutants, because of their severe neuropathies resulting from the loss of sensory and sympathetic neurons (Crowley et al., 1994; Smeyne et al., 1994). Studies from these knock-outs led to the conclusion that the absence of NGF-TrkA signaling affects the maturation of BFCNs, and that atrophy and/or death would start at the time of target innervation (Fagan et al., 1997). Moreover, it was also proposed that NGF-TrkA signaling plays a similar role in striatal cholinergic neurons that are also NGF responsive and express TrkA receptors (Mobley et al., 1989). These neurons are involved in movement regulation (Pisani et al., 2007). This scenario is complicated by the fact that both murine and human Ngf genes encode prepro-NGF precursors (Scott et al., 1983; Ullrich et al., 1983) and are cleaved by convertases to produce mature processed NGF (Seidah et al., 1996). NGF, therefore, binds to two classes of cell surface receptors; mature NGF binds preferentially to the TrkA receptor to mediate cell survival, whereas the immature form, pro-NGF, binds preferentially to the p75NTR to induce neuronal cell death (Lee et al., 2001; Lu et al., 2005). Many populations of neurons in the CNS express p75NTR, including hippocampal, cortical, and BFC neurons. In vivo, partial or complete deletion of p75NTR leads to increased BFCN size and number (Yeo et al., 1997, Naumann et al., 2002), suggesting that p75NTR exerts negative regulation of BFCN survival. However, p75NTR has been shown to regulate diverse functions in the nervous system, including neuronal survival, via interaction with different ligands and coreceptors (Dechant and Barde, 2002). Therefore, to dissect the role of NFG-TrkA signaling during development, maturation, and/or function of the cholinergic system, and to compare the effect of Ngf ablation to that of Trka or p75NTR ablation, we conditionally deleted Ngf or Trka from the CNS. This circumvents effects that arise from deletion of Trka or Ngf in the periphery. We demonstrate that NGF-TrkA signaling supports a small proportion of cholinergic neurons during development, and no further loss occurs throughout their life span. In contrast, this signaling is not required for trophic support or connectivity of the remaining BFC neurons and is dispensable for attention behavior and various aspects of learning and memory in young adult and intermediated-aged animals.
Materials and Methods
Mouse strains
The floxed Trka and floxed Ngf alleles were obtained by homologous recombination in embryonic stem (ES) cells (E14.1) (Minichiello et al., 2002) according to standard procedure. Two positive ES clones derived from each construct were injected into C57BL/6J blastocysts following standard protocols. The resulting chimeras were bred to obtain germline transmission. Mice were kept on a 129:C57BL/6J background. Primers used to genotype the Trka floxed allele by PCR were as follows: P1, 5′-ACA CTG GGT GGC TCA AGG TA-3′; P2, 5′-GTC ACT CCC CAC ATG CCA CC-3′. Those for the Ngf floxed allele were as follows: P1, 5′-CAC TGC TCT ACA CCC ACC CA-3′; P2, 5′-GGC CGA CAA GCA GAA GAA CG-3′; P3, 5′-AGG CAG CCA CAG GGG AAT AG-3′. The NestinCre (NesCre) transgenic mouse line was described previously (Medina et al., 2004). All behavioral analysis was performed on male mice. All animal procedures performed at the Centre for Neuroregeneration conformed to UK legislation (Scientific procedures) ACT 1986 and University of Edinburgh Ethical Review Committee policy; and those performed at the European Molecular Biology Laboratory (Mouse Biology Unit) conformed to national and international laws and policies [EEC Council Directive 86/609, OJ L 358, 1 (December 12, 1987); NIH Guide for the Care and Use of Laboratory Animals, NIH Publication No. 85–23].
Histology
Mice were anesthetized with avertin (500 mg kg−1, i.p.; Sigma-Aldrich) and perfused transcardially with 1× PBS, pH 7.4, followed by 10 ml of 4% paraformaldehyde in PBS. The brains were extracted, fixed overnight in the same fixative at 4°C, and cryoprotected in 30% (w/v) sucrose in PBS at 4°C until they sank to the bottom. Each brain was sectioned at 30 μm on a cryostat (Leica Microsystems), and floating sections were stored in cold TBS containing 0.02% (w/v) NaN3. For the preparation of dorsal root ganglia (DRG) sections, embryos were dissected at E17.5, fixed, and embedded in OCT medium as described for the brains. Transversal sections (10–16 μm thick) of the spinal chord region were cut on a cyrostat at −20°C and transferred directly onto Superfrost Plus slides (Menzel), air dried, and stored at −20°C until use.
Immunostainings
For 3,3′-diaminobenzidine-based immunostaining, tissues were preincubated in 3% (v/v) hydrogen peroxide for 30′ at room temperature (RT) to reduce activity of endogenous peroxidase, and then washed in TBS plus 0.1% (v/v) Tween 20 (Sigma) and blocked with 2% (v/v) normal horse serum (NHS), 0.3% (w/v) carrageenan, and 0.5% (v/v) Triton X-100 in TBS for 2 h at RT. Antibody incubations were performed in TBS containing 1% (v/v) NHS, 0.3% (w/v) carrageen, 0.1% (v/v) Triton X-100, ChAT (1:500; Ab143, Millipore Bioscience Research Reagents), TrkA (1:500; a gift from L. F. Reichardt, University of California, San Francisco, CA), p75NTR (1:400; Ab1554, Millipore Bioscience Research Reagents), and biotin-conjugated secondary antibodies (1:500; The Jackson Laboratory). The staining was developed using the Vectastain ABC system (Vector Laboratories). Sections were then mounted on gelatin-coated slides, dehydrated, and coverslipped in Eukit (VWR International).
For immunofluorescence, sections were washed, incubated in 0.1 m ammonium chloride and 0.1 m glycine for 30 min at RT to reduce autofluorescence, and then blocked with 2% (v/v) NHS (The Jackson Laboratory), 0.3% (w/v) carrageenan, and 0.5% (v/v) Triton X-100 (Sigma) in TBS for 2 h at RT. Primary antibody incubations were performed overnight at 4°C as stated above. Tissues were then washed three times for 10 min each with TBS plus 0.1% (v/v) Tween 20 at RT, incubated with Alexa-labeled secondary antibodies (1:1000; Invitrogen) for 3 h at RT in the same buffer, counterstained with DAPI, and mounted on gelatin-coated slides with Vectashield (Vector Laboratories).
Image analysis
Bright-field images were taken using an Axio Scope (Carl Zeiss) mounted with 20×/0.8 numerical aperture (NA) and 40×/0.75 NA Plan-Apochromat objectives (Carl Zeiss), coupled with an Axio Cam ICC1 color camera (Carl Zeiss). Fluorescent images were taken on an LSM710 Meta confocal microscope (Carl Zeiss) mounted with 40×/0.75 NA and 63×/1.4 NA Plan-Apochromat objectives (Carl Zeiss).
Histochemistry for acetylcholinesterase activity
Staining for acetylcholinesterase (AChE) was performed using a modified Tago method (Di Patre et al., 1993). Briefly, the sections were rinsed quickly in 0.05 m Tris-maleate buffer, pH 5.7, then incubated for 10′ in Tris-maleate buffer containing 6 μg/ml promethazine, and then washed two times in Tris-maleate buffer. Section were incubated 30′ in a 32.5 mm Tris-maleate buffer containing 5 mm sodium citrate, 3 mm cupric sulfate, 0.5 mm potassium ferrocyanide, and 0.52 mg/ml acetylthiocholine iodide, and then rinsed five times in 50 mm Tris-HCl, pH 7.6. Sections were then incubated for 5′ in 50 mm Tris-HCl containing 0.25 mg/ml diaminobenzidine tetrahydrochloride and 3 mg/ml nickel ammonium sulfate. Hydrogen peroxide (0.006%) was added, and sections were incubated for 2–3′. The reaction was stopped by washes with 50 mm Tris-HCl buffer. Sections were transferred onto Superfrost Plus slides, dehydrated in a graded series of alcohols, incubated for 10′ in xylene, and coverslipped with Eukit mounting medium.
Quantification of medial septum cholinergic neuron soma size
For this analysis, 30-μm-thick z-stack images were taken from four ChAT-immunolabeled coronal sections per animal spanning from bregma 0.30 to 1.45 mm. To measure cell size of cholinergic neurons, fluorescent images of ChAT+ neurons were acquired on an LSM710 Meta confocal microscope (Carl Zeiss) mounted with a 40×/0.75 NA objective, and the Imaris (Bitplane) scientific software with ImarisCell module was used to identify and measure the soma of cholinergic neurons. This procedure does not rely on any method of estimation. The actual soma volume is determined by computational integration of the voxels (a volume element, representing a value on a regular grid in three-dimensional space) in the stack having an intensity value for ChAT staining above threshold. A total of 30 to 70 cells per animal (three to four animals per genotype) were analyzed. The data represents the neuronal soma volume relative to the controls (set arbitrarily to 100). Statistical analysis was performed by Student's t test.
Quantification of cholinergic nerve terminal density, ChAT varicosities density, and AChE staining
The density of cholinergic nerve terminals in the frontal cortex was evaluated from four sections per animal spanning approximately from bregma 3.20 to 1.54 mm. Two 30-μm-thick z-stacks of the frontal area were acquired using a confocal microscope mounted with a 40× oil-immersion objective (NA, 1.40). Nerve terminal density was obtained using the software Imaris with the module Surface that measures the fraction of volume of the z-stack with an intensity of ChAT staining above threshold. In the same stacks, the density of ChAT-positive axonal varicosities was measured by scoring the number of bead-like varicosities (size, <1 μm) present on cholinergic axons. For each animal, >1000 varicosities were counted. Analysis at 6 and 12 months of age showed similar results (p = 0.84). The ImageJ (NIH) software was used to measure the density of cholinergic nerve terminals in the CA3 region of the hippocampus. Images were acquired using a confocal microscope as above. Stacks (30 μm thick) were collected with a 40× oil-immersion lens (NA, 1.40), and measurements of integrated density were generated based on the MaxEntropy threshold. For the quantification of the AChE staining, an area containing layers I to VI of the frontal cortex and the hippocampal CA1/2 regions were analyzed. The intensity mean value for each region was calculated by the software ZEN 2011 (Zeiss) and corrected for the background value. A minimum of four sections per animal spanning approximately from bregma 1.98 to −2.46 mm and a minimum of three or four animals per genotype were analyzed. Statistical analysis was performed by Student's t test.
Biochemistry
Preparation of protein lysates
Mice were killed by cervical dislocation, and brains were quickly dissected. Total forebrain or specific subareas of the brain were snap-frozen in liquid nitrogen. For preparation of total protein lysates, the tissue was lysed in NP-40 lysate buffer using a Dounce tissue homogenizer. The lysate was then cleared from insoluble components by centrifugation at 14000 rpm for 30′ and stored at −80°C until use.
Western blotting
Protein concentration were determined using the Bio-Rad Dc protein assay (Bio-Rad); 50 μg of each sample were separated by SDS-PAGE (8% acrylamide; Bio-Rad) and immunoblotted with specific antibodies, ChAT (1:500; Ab144, Millipore Bioscience Research Reagents), ERK1 (1:3000; clone ERK-6B11; Zymed), and tubulin (1:20,000; Sigma). Horseradish peroxidase-conjugated secondary antibodies were used at a dilution of 1:5000. Blots were then processed by the ECL chemiluminescence method (GE Healthcare). For quantification, the bands of the developed films were digitalized and quantified using NIH Image 1.63 software.
NGF immunoassay (ELISA)
To measure NGF protein levels, the Chemikine NGF sandwich enzyme immunoassay kit (CYT304; Millipore Bioscience Research Reagents) was used according to the manufacturer's protocol.
Cell counts
Collecting and preparing tissue for stereology
Every cryostat section of 30 μm thickness was collected for each brain and placed in a 96 well tissue culture plate to maintain the sequential order of the tissue.
Selecting sections to be analyzed
Because the number of tissue sections attainable for the study depends on the tissue thickness cut and the size of the brain sectioned, we first chose the section fraction by examining all slices available to the study. There were 32 sections in total containing the structure of interest in the adult mouse brain. We used one-quarter of the sections. Therefore, one in every four sections containing the structure of interest was used for counts. Sections were stained with a specific marker (ChAT, p75NTR), imaged using a Leica bright-field DMRA microscope coupled with a Leica DC color camera, and all positive cells were counted in each selected section in a determined area of interested [of the medial septum (MS), the nucleus basalis (NB) complex, or the striatum, as outlined below].
Criteria and boundaries of different areas were defined according to the mouse brain atlas from Paxinos and Franklin (2001).
The MS was defined as triangular area with the following anatomical boundaries: lateral, lines connecting the anterior commissures with the midline of the corpus callosum; ventral, horizontal line connecting the inferior edges of the anterior commissures. A section every 120 μm was counted, for a total of eight sections throughout the rostrocaudal extent of the MS.
The nucleus basalis complex was defined as the region containing cholinergic neurons of the nucleus basalis, the substantia innominata, and the globus pallidus. The cells of this region are not clearly distinguishable from the cholinergic neurons of the caudal part of the horizontal limb of the diagonal band (DB). Therefore, also the cells of this part of the diagonal band were included in the counting area for the nucleus basalis complex. This allowed us to count all cholinergic neurons ventrally to the striatum and the internal capsule. The first section counted was the most rostral section through the decussation of the anterior commissures. A section every 120 μm was counted, for a total of eight sections. The ChAT+ cell number in the nucleus basalis complex was quantified on both hemispheres of every selected section and averaged.
The striatal tissue is clearly distinguishable from the surrounding areas. The boundaries are given by the lateral ventricle medially, the external capsule laterally, and the anterior commissure ventrally. The first section counted was the section where the corpus callosum crossed the midline for the first time. Then a section every 240 μm was counted for a total of seven sections. The ChAT+ cell number in the striatum was quantified on both hemispheres of every selected section and averaged.
Cell counting methods
Instead of using the “fractionator function,” all cells were counted in the area of interest either manually or by a computer-assisted method using MetaMorph software for image analysis (Molecular Devices) by two independent investigators. For computer-assisted counting, immunostained sections were imaged, and ChAT-positive cell bodies were automatically counted using intensity threshold and size exclusion as criteria. Quantification was expressed as cells per total area analyzed.
TUNEL staining and counts
TUNEL staining to determine neuronal apoptosis was performed using the In Situ Cell Death Detection Kit (catalog #1 684 809; Roche) according to the manufacturer's protocol. Forebrain serial coronal paraffin sections (8 μm) of mutant and control mice were processed for TUNEL staining to detect apoptotic cells. For each animal, TUNEL-positive cells were counted manually in the area of the medial septum (defined as described above) by staining one of every five sections (three sections per mouse).
Behavioral procedure
Open field
The open field test was performed in a circular arena (60 cm in diameter) made of gray Plexiglas surrounded by walls (20 cm high). Animals were placed in the center of the arena and allowed to explore it over an 8 min period. After the first 4 min an object was placed in the center of the apparatus, and mice were left in the arena for an additional 4 min. Behaviors were videotaped, and the time spent in locomotion, rearing, grooming, and contact with the object was analyzed using EthoVision software (Noldus Information Technology).
Plus maze
The plus maze test was performed in a gray Plexiglas elevated maze with four arms (30 cm long and 5 cm wide) extending from a central starting platform. While two facing arms were closed by gray walls (15 cm high), the other two arms were open. Animals were placed in the center of the apparatus and allowed to explore it for 5 min. Behavior was videotaped, and the time spent in the open arms was analyzed using EthoVision software (Noldus Information Technology).
Morris water maze
The Morris water maze (MWM) test was performed in a circular swimming pool of 1.3 m in diameter filled with opaque water at a temperature of 25 ± 1°C and located in a room containing prominent extramaze cues. A hidden 15-cm-diameter platform was used. Training consisted of 18 trials (6 trials per day) lasting a maximum of 60 s, with an intertrial interval of 30 min. The start position was changed for each trial, with platform left in the same position. After 3 d of training, the mice were subjected to the reversal training for 12 trials (6 trials per day) in which the hidden platform was moved to the opposite quadrant of the pool. Latencies to reach the platform were considered as a dependent variable. Behavior was evaluated by EthoVision software (Noldus Information Technology).
Radial maze
For the radial maze (RAM) test, mice were housed singly with water provided ad libitum and gradually reduced to 85% of their free-feeding body weight, which was maintained for the duration of the experiment by providing the mice with a premeasured amount of chow each day. The maze was built from gray plastic and consisted of eight identical arms radiating 37 cm from a central starting platform (perimeter, 7 × 8 cm).
Fully baited maze.
All arms were baited only once and at the beginning of each daily session, with 20 mg of food pellets placed in a cup at the end of each arm. Animals received one trial per day for 10 consecutive training days. Each daily trial terminated when eight correct choices were made (maximum of 15 choices) or 15 min elapsed. An arm choice was defined as placement of all paws on a maze arm. An error was scored when the mouse entered a previously explored arm. The percentage of errors made over 15 trials was evaluated.
Four-baited-arm maze.
Only four arms were baited at the beginning of each daily session with 20 mg of food pellets. The baited arms were separated by different angles to avoid the mice reaching the solution through the adoption of clockwise patterns. The sequence of baiting remained constant for each mouse. Animals received one trial per day for 14 consecutive training days. Each daily trial terminated when the four baited arms were chosen (maximum of 24 choices) or 20 min elapsed.
Two types of errors were considered: reference memory and working memory errors. The reference memory performance measures the animal's capability to recall which arms were not baited. Working memory performance measures the animal's capability to recall which baited arm has already been visited within the daily trial. Thus, a reference memory error was considered when animals entered into an unbaited arm, while a working memory error was considered when animals reentered into a previously visited baited arm. The percentage of reference memory errors (number of entries into unbaited arms divided by number of total entries times 100) and working memory errors (number of reentries into baited arms divided by number of total entries into baited arms times 100) were considered as dependent variables.
Passive avoidance
For the passive avoidance test, mice were trained in an apparatus in which a straight alley was divided into two compartments. The smaller compartment was made of white Plexiglas. The larger compartment was made of black Plexiglas and was equipped with a removable cover of the same material to allow the compartment to be in darkness. A tensor lamp illuminated the small compartment. The floor of the larger compartment consisted of two oblique stainless-steel plates folded at the bottom through which a constant current could be delivered. On the training day each mouse was placed in the light compartment, facing away from the dark compartment. When the mouse stepped with all four paws into the dark compartment, the door was closed, the step-through latency was recorded, and two footshocks (0.4 mA, 50 Hz, 2 s) were delivered with an interval of 5 s. The maximum initial step-through latency allowed as a criterion for the animals entering the trial was 15 s. The mouse was then removed from the apparatus and returned to its home cage. Retention was tested 24 h later following a similar procedure, except that no shock was administered. A maximum step-through latency of 180 s was allowed in the test session.
Contextual and cued fear conditioning
For the contextual and cued fear conditioning (FC), mice were trained in a conditioning chamber (26 × 22 × 18 cm) made of transparent Plexiglas with a grid metal floor and located in a sound-insulated box lighted by a white tensor lamp (60 W). After an acclimatizing period lasting 120 s, a 30 s tone was administered [conditioned stimulus (CS), 3 kHz, 80 dB]. During the last 2s of tone presentation, a footshock was delivered [unconditioned stimulus (US), 0.5 mA]. Both the CS and US ended simultaneously. Mice were left in the conditioning chamber for an additional period of 30 s and then returned to their home cage. For the contextual fear conditioning (CTX) test, 24 h after training, mice were placed in the same chamber for 5 min. Two hours after the contextual test, mice were tested for cued conditioning in a different chamber made of black Plexiglas with a floor of triangular shape lighted by a blue tensor lamp (60 W), and perfumed with a vanilla essence diffuser. The test lasted 6 min, with the CS administered during the last 3 min.
Attention behavior (two-choice serial reaction time task)
The attention performance was assessed using a two-choice serial reaction time task (2-CSRTT), adapted from the 5-CSSRT (Higgins and Breysse 2008), which is widely used, well established, and the best characterized test for attention deficits. This task requires the animals to detect a visual stimulus and respond by a nose poke in the illuminated hole of the test box. After initial training to nose poke for liquid reward, mice are trained in a 2-CSRTT. The two-hole box is an operant chamber that is fitted with an array of two response apertures into which the mouse can make a nose-poke response. An infrared beam located on each hole detects the mouse nose pokes. The rodent can be rewarded by activation of an internally located dispenser delivering milk on the opposite wall to the two-hole array. The boxes are controlled by customized computer software. Each chamber is enclosed in a sound-attenuating box and equipped with a fan to provide ventilation and mask any extraneous noise. One nose poke in the illuminated unit within a 5 s period is recorded as a correct response and rewarded with the delivery of 0.02 ml of condensed milk for 5 s, after which all lights are turned off for a 10 s intertrial interval (ITI). A nose poke in the left or right unit that is not illuminated is recorded as an “error of commission.” When mice do not make a choice within 5 s, an “error of omission” is recorded, and the 10s ITI starts. The light stimulus is presented randomly on the right or left nose-poke unit initially for 8 s. Animals are typically trained until a high level of good and stable performance is reached (≥80% accuracy, ≤20% omissions). After 3 consecutive days of good performance, the hole illumination is reduced to 4 s, then 2 s, and finally 1 s. Each session consists of 100 trials and lasts a maximum of 30 min. Training typically takes 45–50 sessions. A digitalized camera connected to the test boxes and dedicated software were used to automatically record mouse behavior during the sessions. Attention performance parameters commonly used for the analysis in CSRTT are choice accuracy (percentage correct), response omission (percentage omission), and correct response time. They are defined as follows: choice accuracy (percentage correct) is the percentage of correct responses out of the total number of responses (correct response plus error of commission); response omission (percentage omission) is the percentage of errors of omission from all trials (correct responses plus errors of commission plus errors of omission); correct response latency time is defined as the time from the onset of the stimulus light to the correct nose poke within 5 s. Food restriction is applied to mice during the experiment and for the week before starting the test to motivate them to nose poke for milk reward. Two independent investigators performed these experiments twice, and the results were comparable.
Statistical analysis
For the neuronal counts and biochemical analysis, the experiments were performed on a minimum of three animals from each genotype (unless indicated otherwise). The immunoblot analyses were repeated at least three times for each sample. All results are represented as mean ± SEM. Differences between samples were assessed by Student's t test or ANOVA, depending whether two or more samples were compared. Differences were considered significant at p < 0.05.
Results
Only a subset of BFC neurons requires NGF-TrkA signaling for survival
To directly evaluate the specific role of NGF-TrkA signaling in the development and maintenance of the BFCN population, and to avoid early lethality of the Ngf and Trka null mutant mice (Crowley et al., 1994; Smeyne et al., 1994; Fagan et al., 1997), we have conditionally deleted either the Ngf or Trka gene in the CNS by first generating mice carrying Ngf or Trka floxed alleles (Figs. 1, 2). Ngf or Trka floxed mice were then crossed to mice expressing Cre recombinase under a specific element of the Nestin promoter, which we have demonstrated to express Cre already at embryonic stage 11.5 in CNS neural progenitors (Medina et al., 2004), to obtain Ngflx/lx;NesCretg/+ and Trkalx/lx;NesCretg/+ mice (NgfNesCre and TrkaNesCre, respectively) (Figs. 1, 2). In contrast to the null mutant mouse models, conditional mutants for Ngf or Trka are indistinguishable from control littermates, are fertile, and have a normal life span. We then evaluated the effect of Ngf and Trka conditional deletion in the development and maintenance of the BFCN population by immunohistochemical analysis of choline acetyltransferase (ChAT) and counts of BFCNs in both NgfNesCre and TrkaNesCre mice during postnatal development and adulthood stages (Fig. 3A,B). The results indicate that, in both conditional mutants, by 1 month of age there is 25 to 30% loss of ChAT-positive neurons in the MS that rises to 31 and 39% by 3 months of age for NgfNesCre and TrkaNesCre, respectively, with no further significant depletion until the last time point measured at 20 months of age (Fig. 3A,B,D–G). It was shown previously that total deletion of Trka (Fagan et al., 1997) causes an increase in apototic cells in the medial septum area of mutants at approximately postnatal day 7 (P7). Therefore, we analyzed TUNEL-positive cells at two postnatal development stages, P3 and P7, in the MS of TrkaNesCre and controls. This analysis revealed a greater number of dying cells in conditional mutants compared to controls at P7; however, no difference was evident at P3 (Fig. 3C). This correlates with a reduced number of ChAT-positive cells in the MS of mutants at P7 (Fig. 3A), suggesting that some of the decrease observed in ChAT-positive cell number in conditional mutants may be attributable to cell death, not just to downregulation of ChAT. A significant decrease in ChAT-positive cells was also observed in the NB complex of TrkaNesCre mutants compared to Trkalx/lx controls, whereas no difference was found in the striatal cholinergic interneurons (Fig. 3H). The decrease in ChAT-positive cells observed in the BF of TrkaNesCre mutants is concomitant with a decrease in ChAT protein levels assayed by Western blotting. No such decrease was detected in the striatum (Fig. 3I). A similar finding was observed in the NgfNesCre line: ChAT protein levels were reduced in the NgfNesCre mutant proportionally to the loss of ChAT-positive cells (Fig. 3J). In contrast, the remaining cholinergic neurons in the basal forebrain expressed normal levels of ChAT in both conditional mutants throughout life (Fig. 3D–G). To support these data, we analyzed another marker of cholinergic neurons, p75NTR, in TrkaNesCre mutants and focused on the MS because within the septal/diagonal band complex, virtually all TrkA-positive neurons (>95%) coexpress both ChAT and p75NTR (Sobreviela et al., 1994). Counts of p75NTR-positive neurons in the MS at P90 revealed a significant reduction of cholinergic neurons in TrkaNesCre mice versus controls (Fig. 3K). This is comparable to what is observed counting ChAT-positive neurons in the MS (Fig. 3, compare A, K), suggesting that NGF-TrkA signaling depletion may reduce the number of cholinergic cell bodies and not just the expression of cholinergic markers. Together, these results are in agreement with previous data that propose a critical role for NGF-TrkA signaling in the developmental maturation and survival of a subset of basal forebrain cholinergic neurons (Fagan et al., 1997), and they extend these studies by demonstrating that NGF-TrkA signaling is not required for the survival or maintenance of the remaining BFCNs.
Figure 1.

Generation of CNS-specific Ngf conditional mice. A, Ngf conditional targeting strategy. Schematic representation of the mouse exon 4 Ngf locus. Two LoxP sites flanked Ngf exon 4, while two FRT sites flanked the neo gene. The EcoRV restriction site at the 5′ side of exon 4 was deleted in the targeting construct. A reporter gene coding for EGFP and preceded by an IRES sequence was also introduced following the second loxP sequence. However, EGFP fluorescence was not detectable upon recombination. Successful gene targeting by homologous recombination into ES cells led to the generation of the recombinant Ngflx_neo+ (Ngflxn) allele. The neo gene was subsequently excised in vivo by crossing the Ngf floxed mice with transgenic mice expressing Flp recombinase ubiquitously (Rodríguez et al., 2000), generating the Ngflx_neo− (Ngflx) allele. B, Southern blot analysis of targeted ES cell clones of the Ngflxn allele. The positions of the 5′ and 3′ probes are indicated in A. The genomic DNA for the Southern blot analysis was digested with EcoRI restriction enzyme (3′ probe) and with EcoRV (5′ probe). C, PCR analysis of Ngflxn and Ngflx alleles. The positions of the primers used for PCR analysis are indicated in A. PCR analysis with the primers 2, 3, and 4 showed successful deletion of the neo gene in Ngflx mice. D, Analysis of successful NestinCre-mediated deletion of Ngf in the forebrain. ELISA analysis of NGF concentration in the forebrain of wild-type, Ngflxn/lxn, and Ngflxn/lxn;NesCretg/+ mice. The NGF concentration was reduced by ∼50% in the forebrain of heterozygous mice and abolished in homozygous mutant mice compared to wild type, indicating that Ngf was successfully deleted. In contrast, no NGF reduction was found in Ngflxn/lxn mice, showing that the neo cassette introduced in the recombinant Ngf allele was not interfering with NGF expression. EV, EcorV; EI, EcoRI, X, XhoI; S, SpeI.
Figure 2.

Generation of CNS-specific Trka conditional mice. A, Trka conditional targeting strategy. Schematic representation of exons 11–17 of the wild-type mouse Trka locus; recombinant (neo+) and recombinant (neo−) alleles are also shown. LoxP sites flanked the Trka exons 12–14, whereas FRT sites flanked the neo gene, which was subsequently excised in vivo by crossing the Trka floxed mice with transgenic mice expressing Flp recombinase ubiquitously (Rodríguez et al., 2000). This resulted in the generation of the recombinant Trkalx_neo− (Trkalx) allele. B, Southern blot analysis of targeted ES cell clones of Trkalx_neo+(Trkalxn) using two probes at the 5′ and 3′ sides of the targeting construct, as indicated. BamHI restriction enzyme was used to digest the genomic DNA for the Southern blot analyses. C, PCR analysis of Trkalxn and Trkalx alleles. The positions of the primers used for PCR analysis are indicated in A. The PCR reaction with the primers 1 and 3, which showed successful deletion of the neo gene, was used for routine genotyping of the Trkalx mice. D, Western blot analysis of gp140TrkA protein in forebrains of newborn (P1) wild-type, Trkalx/lx, and Trkalxn/lxn mice. While TrkA protein level was nearly not detectable in forebrain lysates of Trkalxn/lxn mice, removal of the neo cassette restored normal TrkA protein level in Trkalx/lx mice compared to control mice. Tubulin was used to control for loading. E, Western blot analysis showing Cre-mediated removal of TrkA from P1 forebrain lysates of Trkalx mice crossed to NestinCre mice. While TrkA protein levels in wild-type and Trkalx/lx mice were identical, no expression of TrkA was detected in the Trkalx/lx;NesCretg/+ mice (TrkaNesCre). F–K, Forebrain coronal cryosections from 1-month-old TrkaNesCre and control (Trkalx/lx) mice were stained with antibody against TrkA. Although strongly stained neurons were found in all the indicated areas in the control mice, shown is mainly the nucleus basalis (F, G), the medial septum (H, I), and the striatum (J, K); no TrkA-positive cells were found in the TrkaNesCre mice. L–M, Transversal cryosections of the spinal chord region of E17.5 mouse stained with TrkA antibodies. Clear TrkA-positive staining is observed in neurons of the DRG in both control and TrkaNesCre mice. St, Striatum; ic, internal capsule; Gp, globus pallidus; DB-hl, diagonal band horizontal limb. Scale bars: F (for F, G), H (for H, I), 200 μm; J (for (J, K), 100 μm. B, bamHI; S, SacII; X, XhoI.
Figure 3.

CNS-specific deletion of Trka or Ngf affects survival of a small proportion of the BFCNs. A, Time course survival analysis of ChAT-positive cells in the MS of TrkaNesCre mutant and control mice. Stages of analysis were between postnatal day 7 and 20 months (20M) of age. The reduction in ChAT-positive cells was significantly different between mutants and controls at all stages analyzed (P7, p = 0.008; P15, p = 0.0015; 1 month, p = 0.0001; 3, 12, and 20 months, p < 0.0001; 9 months, p = 0.0008; n = 3 to 4 per group). B, Time course survival analysis of ChAT-positive cells in the MS of NgfNesCre mutant and control mice. Stages of analysis were between 1- and 20-month-old animals. The reduction in ChAT-positive cells was significantly different between mutants and controls at all stages analyzed (1 and 3 months, p < 0.0001; 9 months, p = 0.0002; 12 months, p = 0.0019; 20 months, p = 0.0002; n = 3 to 5 per group). C, TUNEL-positive cells in the medial septum of controls and TrkaNesCre mutants expressed as percentage of control littermates at P3 (controls, 100 ± 21%; TrkaNesCre, 78.6 ± 13%) and P7 (controls, 100 ± 40%; TrkaNesCre, 700 ± 60%, p = 0.014; n = 2 for all groups analyzed, values are ±SD). D–G, Histological sections stained with ChAT antibodies showing the MS and diagonal band vertical limb (DB-vl) of TrkaNesCre and NgfNesCre mutants and respective control mice at 20 months of age. H, Survival analysis of ChAT-positive neurons in different brain areas at 3 months of age. A significant difference was observed between TrkaNesCre mutant and control mice also in the nucleus basalis complex (p < 0.05; n = 3 to 4 per group). I, Time course of relative ChAT protein levels in forebrain of TrkaNesCre mutant and control mice. A significant reduction of ChAT expression between TrkaNesCre mutant and control mice was found at all stages analyzed (p < 0.05). No difference in ChAT expression was found in the striatum between mutants and controls. J, Relative ChAT protein levels in total forebrain lysates of NgfNesCre mutant mice at 1 and 6 months of age (p < 0.05), and representative Western blot showing ChAT levels at 6 months of age. K, Counts of p75NTR-positive neurons in the MS of 3-month-old TrkaNesCre mutant and control mice revealed significant reductions in the mutants (p = 0.028; n = 3 for each genotype). L–O, Representative images of p75NTR immunostaining showing normal appearance of cholinergic neurons of the MS and DB-vl in both controls and TrkaNesCre mutant sections. S, Striatum. Scale bars: (in D) D–G, 500 μm; L (for L, M), 200 μm; N (for N, O), 100 μm. *Statistically significant difference.
Intact cholinergic axonal varicosity in the frontal cortex and hippocampus of Trka and Ngf conditional mutants
We have shown here that only a small proportion of the cholinergic neurons are affected in Trka and Ngf conditional mutants throughout their life. We then focused on the analysis of the remaining cholinergic neurons and their morphology, differentiation, and function. First, the soma size of MS cholinergic cells was analyzed at two different stages (6 and 12 months) in both Trka and Ngf conditional mutants. As shown in Figure 4, A–C and D–F, there was no statistical significant difference in cell volume between mutants and controls at either 6 or 12 months of age. Second, we analyzed BF cholinergic cortical and hippocampal innervations using AChE staining, which allows visualization of AChE enzymatic activity in cholinergic fibers, and observed a significant reduction already at 1 month of age and no apparent further decrease with age (Fig. 4G–M, data not shown). This analysis was complemented by ChAT immunofluorescent (IF) staining to quantify the density of cholinergic nerve terminals and their varicosities in the frontal cortex and hippocampus at 6 and 12 months of age in both conditional mutants. A small but significant reduction was observed in the density of cholinergic innervation in the frontal cortex of both Trka and Ngf conditional mutants compared to their controls (Fig. 5A–F, shown at 12 months). Comparable results were obtained at 6 months of age (data not shown). Similarly, quantification of cholinergic nerve terminal density in the CA3 hippocampal region of TrkaNesCre or NgfNesCre mutants also revealed a statistically significant difference compared to controls (Fig. 5M–R, shown at 12 months). However, density of ChAT-stained axonal varicosity, which has been shown to be linked to neuronal activity (Zhang et al., 2011), was measured over the total cholinergic nerve terminals and revealed no difference between controls and TrkaNesCre or NgfNesCre mutants even at 12 months of age (Fig. 5G–L). Therefore, depletion of NGF-TrkA signaling from the CNS in vivo does not significantly affect the differentiation or morphology of the remaining cholinergic neurons in the basal forebrain.
Figure 4.
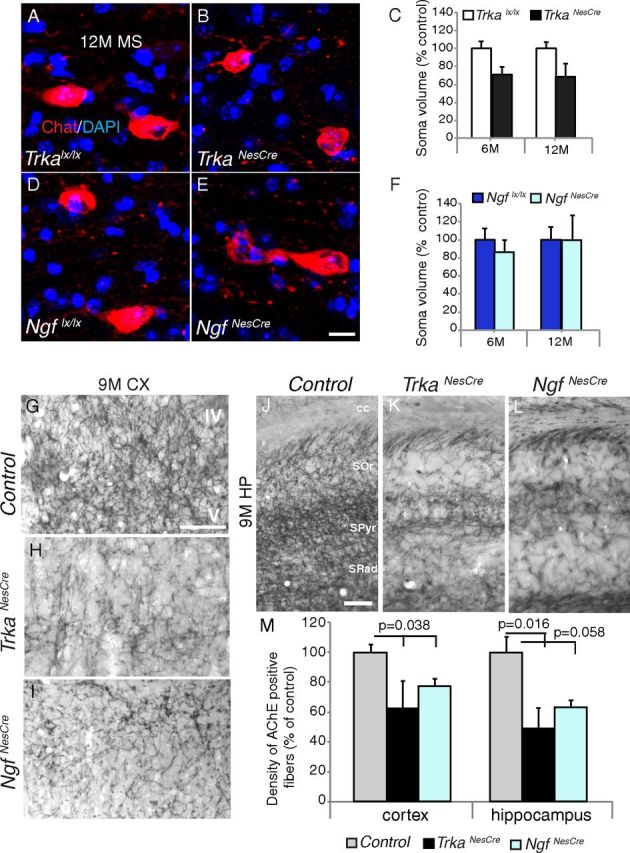
Morphological analysis of cholinergic neurons in Trka and Ngf conditional mutants. A–F, Soma volume quantification of MS cholinergic neurons in 12-month-old (12M) TrkaNesCre and NgfNesCre mutant and control mice stained with ChAT by IF staining. C, F, No significant statistical differences were detected between controls and mutants at both stages analyzed (TrkaNesCre, 6 months, p = 0.07; 12 months, p = 0.09, C; NgfNesCre, 6 months, p = 0.49; 12 months, p = 0.53, F; n = 3–4 mice for each group analyzed, 30 to 70 cells per animal per genotype). G–L, Sections showing somatosensory cortex (CX; G–I) or hippocampal regions (J–L) from control, TrkaNesCre, and NgfNesCre mice at 9 months (9M) of age stained with AChE. M, Quantification of AChE-positive fibers in frontal cortex and hippocampal regions of Trka and Ngf conditional mutants compared to controls [cortex, control, 100 ± 5.59, n = 7 (4 Trkalx/lx, 3 Ngflx/lx); TrkaNesCre, 62.24 ± 18.83, n = 4, p = 0.038; NgfNesCre, 76.64 ± 5.38, n = 3, p = 0.038; hippocampus, control, 100 ± 10.47, n = 7 (4 Trkalx/lx, 3 Ngflx/lx); TrkaNesCre, 48.75 ± 14.08, n = 4, p = 0.016; NgfNesCre, 62.95 ± 4.28, n = 3, p = 0.058]. IV and V indicate cortical layers IV and V, respectively. cc, Corpus callosum; SOr, stratum oriens; SPyr, stratum pyramidale; SRad, stratum radiatum. Scale bars: (in E) A, B, D, E, 10 μm; G (for G–I), J (for J–L), 100 μm.
Figure 5.

Reduction of cholinergic nerve terminal density in BFCN target areas, but normal varicosity in absence of NGF-TrkA signaling. A–E, ChAT-immunolabeled sagittal section images representing a field of innervated frontal cortex in 12-month-old TrkaNesCre and NgfNesCre mutants and control mice, and respective density of cholinergic nerve terminal quantification (C, F; Trkalx/lx, 100 ± 8.85; TrkaNesCre, 67.4 ± 4.38, p = 0.04; Ngflx/lx, 100 ± 8.28; NgfNesCre, 60 ± 2.59, p = 0.01; n = 3–4 for all groups analyzed, mean ± SEM). G, H, J, K, High magnification of the insets in A, B, D, and E, respectively, highlighting the axonal varicosity of cholinergic innervations in 12 month frontal cortex. I, L, Density of cholinergic nerve terminal varicosities. Quantification revealed no differences in mutants compared to controls (TrkaNesCre, p = 0.81; NgfNesCre, p = 0.84; n = 3 for all groups analyzed). M, N, P, Q, Images representing ChAT IF staining in the CA3 hippocampal region of 12-month-old TrkaNesCre and NgfNesCre mice. O, R, Density of cholinergic nerve terminal quantification in the CA3 hippocampal region of 12-month-old TrkaNesCre and NgfNesCre mutants and control mice (Trkalx/lx, 100 ± 12.13, n = 12; TrkaNesCre, 42.80 ± 11.45, n = 6; p = 0.0089; Ngflx/lx, 100 ± 9.81, n = 12; NgfNesCre, 50.42 ± 14.57, n = 5; p = 0.032; mean ± SEM). Scale bars: (in E) A, B, D, E, 20 μm; (in K) G, H, J, K, 5 μm; (in Q) M, N, P, Q, 10 μm.
Loss of NGF-TrkA signaling does not impair attention performance in young adult or intermediate-aged mice
Age-associated dementia involves cognitive impairments including loss of attention, which is mainly attributed to cholinergic system dysfunction (Baxter and Chiba, 1999), and working memory deficits. To establish whether NGF-TrkA signaling contributes to these types of cognitive functions, we first tested cortical- and parahippocampal-dependent cognitive functions of both TrkaNesCre and NgfNesCre mice at 5–6 months of age. We used the 2-CSSRT, a modified version of the 5-CSSRT (Bevins and Besheer, 2006), to measure attention performance. This task has been described previously and has been successfully used to analyze sustained attention in mice (Baron and Meltzer, 2001; Lee et al., 2002). It provides not only indices of attention (accuracy) but also those of executive control over performance such as premature (an index of impulsivity) and perseverative responding (compulsive behavior). No significant differences were found in this test between the TrkaNesCre and control mice (Fig. 6A–G). In particular, after initial training to liquid reward and the apparatus, mice were given one session per day of 40 min duration, and the number of correct responses was recorded. From day 7 onward, the number of correct responses increased rapidly for both groups analyzed (Fig. 6A). The increase in attention demand of the task was tested by decreasing the stimulus (light) length from 8 to 4 s, from 4 to 2 s, and from 2 to 1 s. TrkaNesCre and control mice performed equally at each stimulus length analyzed (8, 4, 2, and 1 s), reaching a similar maximum number of correct responses and requiring a similar number of sessions to pass the criteria (Fig. 6B–D). This indicates that both groups exhibited a similar acquisition/learning of the task and had similar motivation for the reward (Fig. 6E). Similar results were obtained for the NgfNesCre conditional mutants (data not shown). We then analyzed premature responses to test the ability of the animals to adequately suppress or inhibit inappropriate behavior, and as shown in Figure 6F, there were no significant differences between mutants and controls. Similarly, analysis of perseverative responses after correct choices also revealed no significant differences between the two groups (Fig. 6G), suggesting that mutant animals perform well in this task. Finally, to verify that the 2-CSRTT task used would efficiently measure impairment in the central cholinergic system, we treated mice with the cholinergic muscarinic antagonist scopolamine. Mice were injected after reaching their maximum performance at the most stringent level of the task (1 s stimulus length), and the correct responses obtained before and after scopolamine injection were compared. Scopolamine was used at two different doses (0.2 and 0.8 mg/kg), which have been shown previously not to impair the general locomotor activity of the mice (Humby et al., 1999). We found that the higher dose of scopolamine (0.8 mg/kg) significantly impaired the performance of all mice in the 2-CSRTT task (p = 0.018, variation of performance) (Fig. 6F), confirming that this task is an efficient tool to assess impairments of the central cholinergic system. However, at the lower concentration of scopolamine (0.2 mg/kg), the mouse impairment performance was less pronounced compared to the higher concentration but still detectable; interestingly, at this lower concentration, TrkaNesCre mice were more sensitive to the effect of scopolamine compared to control mice but not significantly different (Fig. 6F). These results suggest that despite the partial loss of cholinergic neurons in TrkaNesCre and NgfNesCre mice, the loss of NFG-TrkA signaling in the remaining cholinergic neurons is still not sufficient to impair attention performance.
Figure 6.

Attention performances in the 2-CSRTT. Young adult TrkaNesCre mice (n = 14) and age-matched controls (n = 14) were used in this test. A, Number of correct responses per session for the first 15 d of the test at 8 s stimulus light duration. Both mutant and control mice showed similar learning curves with no significant differences between the two groups (except for day 2, where mutants were performing better than controls; TrkaNesCre, 6.26 ± 0.99 vs controls, 2.85 ± 0.57; p = 0.007). B, Number of sessions needed to reach performance criteria at 8, 4, 2, and 1 s stimulus (light) duration. No significant difference was observed between mutants and control mice in the three blocks of the test (p = 0.76, p = 0.55, p = 0.66, and p = 0.885, respectively). C, Choice accuracy (percentage of correct responses) at 8, 4, 2, and 1 s stimulus duration was also analyzed, and no differences were found between mutants and controls (p = 0.2, p = 0.21, p = 0.77, and p = 0.99, respectively). D, Analysis of latency to a correct response also showed no significant differences in the attention performance between mutants and controls (8 s, p = 0.52; 4 s, p = 0.59; 2 s, p = 0.91; 1 s, p = 0.929). E, Omission is used as an index of motivation of the mice tested. The percentage of omissions was not significantly different between the two groups (8 s, p = 0.16; 4 s, p = 0.09; 2 s, p = 0.1; 1 s, p = 0.39). F, G, The premature responses during the fixed 5 s ITI were also measured (8 s, p = 0.48; 4 s, p = 0.49; 2 s, p = 0.44; 1 s, p = 0.96; F), as well as perseverative responses after correct choices at the different stimulus durations (8 s, p = 0.50; 4 s, p = 0.77; 2 s, p = 0.058; 1 s, p = 0.11; G). No significant differences were found between mutants and controls. H, Attention performance was also studied after scopolamine injections (0.2 or 0.8 mg/kg) at the 1 s stimulus duration level (mutants, n = 5; controls, n = 4). Scopolamine was injected 20 min before the test. Results are expressed as the variation between the means of correct responses obtained in three consecutive sessions before and after scopolamine treatment. Injections of scopolamine at a concentration of 0.8 mg/kg significantly reduced the number of correct responses (*p < 0.05, paired t test comparing the average of correct responses in untreated and treated mice for all the mice treated with 0.8 mg/kg of scopolamine). The responses of each subgroup are also shown.
NGF-TrkA signaling is dispensable for cognitive performance in young adult and intermediate-aged mice
To assess the requirement of NFG-TrkA signaling in cognitive functions during the first year of life, we performed a thorough analysis of various behavioral tasks including open field, plus maze, MWM, RAM, passive avoidance, and FC tasks (at 3–4 and 11 months of age) in TrkaNesCre mutant (that lack the high-affinity receptor for NGF) and control mice (Trkalx/lx). First of all, mice were tested in the open field to assay general locomotor activity levels and anxiety. No significant differences in locomotor, rearing, grooming, and object exploration activities were observed in the open field test in TrkaNesCre mutants at either 3–4 or 11 months of age (Fig. 7A,B). Similar results were obtained for anxiety-like behavior evaluated with a more specific test for anxiety, namely, the elevated plus maze task (Fig. 7C,D). Mice were then subjected to spatial memory tests. We used both the MWM and the RAM (Minichiello et al., 1999) on independent groups of mice (controls and mutants). In the MWM task, mice learn across daily sessions to find a hidden escape platform using extramaze visual cues. Statistical analyses (two-way ANOVAs) performed on the escape latencies recorded during the training session revealed no significant differences between young adult controls and TrkaNesCre mutant mice in the acquisition phase (Fig. 7E). Similarly, no significant differences were scored between 11-month-old TrkaNesCre mutant and control mice (Fig. 7F). A significant effect of learning was found in all groups of mice analyzed, both young adult mice (F(17,306) = 19.76, p < 0.0001) and mice at 11 months of age (F(17,323) = 5.94, p < 0.0001) (Fig. 7E,F). A significant effect of age was also observed when comparing the escape latencies of young adult to those of older mice of both genotypes (11 months) (F(1,20) = 4.47, p < 0.05, control mice). For instance, although both groups (3–4 and 11 months old) of control mice learned to reach the hidden platform during the training (F(17,340) = 5.02, p < 0.0001), 3- to 4-month-old mice displayed a significantly lower escape latency compared with 11-month-old mice (p < 0.05). After the acquisition phase, we tested the flexibility of the animals to develop new strategies by using a reversal trial (moving the hidden platform into a new position). As shown in Figure 7, E and F, no significant differences were observed in the latency to reach the hidden platform in the new location between TrkaNesCre and control mice at both stages analyzed.
Figure 7.

Exploratory, anxiety-related behaviors and spatial memory is not affected in absence of NGF-TrkA signaling in young adult or intermediate-aged animals. A, B, Exploratory behaviors were evaluated in the open field test. No significant differences in the time spent in locomotion (Loc), rearing (Rear), grooming (Groom), or in contact with the object (Contact) were observed between TrkaNesCre and age-matched control mice. C, D, Anxiety levels of young and old TrkaNesCre mice were similar to those shown by their age-matched controls as revealed by the time spent in the open arm of an elevated plus maze. E–H, Spatial memory of TrkaNesCre mutant and control mice was evaluated in the invisible version of Morris water maze and the four-baited-arm radial maze at 3–4 months (3–4M) and 11 months (11M) of age. No significant differences were observed between the TrkaNesCre mutant and control mice in the latencies to reach the hidden platform in the Morris water maze during the acquisition phase (6 trials/d for 3 consecutive days) at either stage analyzed (3–4 months, F(1,18) = 0.99, p > 0.05; 11 months, F(1,20) = 0.51, p > 0.05; E, F). Reversal learning (6 trials/d for 2 consecutive days) in the Morris water maze was evaluated after the acquisition phase by moving the hidden platform in a new position. No significant differences in the latencies to reach the hidden platform were observed between TrkaNesCre and age-matched control mice (3–4 months, F(1,18) = 0.19, p > 0.05; 11 months, F(1,19) = 0.53, p > 0.05). G, H, Learning performance in a four-baited version of the eight-arm radial maze task, expressed as percentage of reference and working memory errors. No significant differences between TrkaNesCre and control mice were observed at 3–4 months (reference memory, F(1,26) = 0.04, p > 0.05; working memory, F(1,26) = 0.18, p > 0.05) or 11 months (reference memory, F(1,25) = 1.8, p > 0.05; working memory, F(1,25) = 0.51, p > 0.05) of age.
While the MWM is an attractive test, being highly specific for hippocampal functions, it also presents certain limitations. One is that it does not allow us to measure simultaneously the various components of memory such as reference and working memories. Alternatively, the RAM, which is also widely used to study spatial memory performance, allows simultaneous measurement of, for instance, working and reference memories. Therefore, mutant and control mice were first subjected to the fully baited arm maze. In this task, spatial learning was expressed as the percentage of errors until eight correct choices were observed or after the maximal permitted number of trials (15). This analysis also showed no differences between TrkaNesCre mutant and control mice at either 3–4 months (F(1,18) = 0.99, p > 0.05; n = 10 for both groups) or 11 months of age (F(1,20)=0.51, p > 0.05; n = 13 for controls, n = 9 for TrkaNesCre mutant mice). A significant effect of learning was found in all groups analyzed (3–4 months, F(9,162) = 19.76, p < 0.0001; 11 months, F(9,180) = 5.94, p < 0.0001) (data not shown). However, to better investigate spatial learning of mutant mice, we submitted independent groups of TrkaNesCre mutant and control mice to a more difficult version of the radial maze task that put more load on spatial discriminative abilities, namely, the four-baited-arm radial maze (Ammassari-Teule et al., 1993). In this version of the RAM, only four of the eight arms were baited with a reward, and the sequence of baiting remained constant during the training. Therefore, the animal had to be able to remember which arms were baited at the beginning of the session, and which ones it already entered (working memory); at the same time it had to avoid nonbaited arms across trials (reference memory). Reentering a previously visited baited arm was considered as a working memory error, while entering into a nonbaited arm was considered a reference memory error. Statistical analyses (two-way ANOVA) showed no significant differences between TrkaNesCre and control mice at 3–4 or 11 months of age in either working or reference memory (Fig. 7G,H). These data demonstrate that various aspects of learning and memory, including spatial, working, and reference memories, as well as short-term and long-term memory are intact in the absence of NGF-TrkA signaling throughout the first year of life. This implies that the hippocampal and hippocampal–cortical pathways required to perform these tasks (Cave and Squire 1991) are intact in TrkaNesCre mutants.
Emotional learning does not require NGF-TrkA signaling
Finally, we also investigated the requirement of NGF-TrkA signaling in emotional learning tasks, namely, the step-through inhibitory avoidance and the contextual and cued fear conditioning. In the step-through inhibitory avoidance task, mice learned to avoid the dark compartment of a bipartite cage in which they received a mild footshock during training. The latency to step through in the dark compartment is considered a memory retention index. Statistical analyses (one-way ANOVA) revealed no significant differences between the latencies of 3- to 4-month-old control and TrkaNesCre mutant mice (Fig. 8A) or between 11-month-old control and TrkaNesCre mutant mice (Fig. 8B). In this task, there was no significant effect of age observed between 3- to 4-month-old and 11-month-old mice of both genotypes (control mice, training, F(1,31) = 0.12, p > 0.05; test, F(1,31) = 0.87, p > 0.05).
Figure 8.

Normal learning in young adult and intermediate-age TrkaNesCre mice submitted to passive avoidance and contextual and cued fear conditioning tasks. A, B, No significant difference in the step-through latencies in the passive avoidance apparatus both before (Training) and 24 h after footshock (Test; training, F(1,32) = 1.15, p > 0.05; test, F(1,32) = 0.26, p > 0.05) were observed in TrkaNesCre and control mice at 3–4 months (3–4M) of age (training, F(1,32) = 1.15, p > 0.05; test, F(1,32) = 0.26, p > 0.05) or at 11 months (11M; training, F(1,25) = 0.32, p > 0.05; test, F(1,25) = 0.30, p > 0.05). C–F, No significant differences were observed when TrkaNesCre and age-matched control mice were compared for the percentage of freezing recorded during the training before footshock presentation (Untrained) and 24 h after training, both with CTX (3–4 months old, F(1,11) = 1.25, p > 0.05; 11 months old, F(1,18) = 0.72, p > 0.05) and in a different context (Pre-CS) with tone presentation (CS, cued memory; Pre-CS, 3–4 months old, F(1,11) = 0.2, p > 0.05; 11 months old, F(1,18) = 0.34, p > 0.05) or during tone presentation (CS, 3–4 months old, F(1,11) = 0.11, p > 0.05; 11 months old, F(1,18) = 3.01, p > 0.05).
In the contextual and cued fear conditioning, immobility (freezing), a natural behavior elicited in mice by aversive stimuli, was recorded and considered as a measure of fear memory. Animals were first trained in the conditioning box, in which a CS and US were paired. Statistical analyses (one-way ANOVA) showed normal acquisition during the training phase between 3- to 4-month-old control and TrkaNesCre mutant mice (F(1,11) = 0.16, p > 0.05) as well as between 11-month-old control and TrkaNesCre mutant mice (F(1,18) = 0.77, p > 0.05). Moreover, no significant differences were observed between 3- to 4-month-old and 11-month-old mice (F(1,15) = 2.8, p > 0.05, control mice). At 24 h, control and TrkaNesCre mutant mice were tested for CTX. No significant differences in the levels of freezing were observed between TrkaNesCre mutant and control mice (Fig. 8C,E). However, an effect of age was evident in this task when comparing 3- to 4-month-old mice with 11-month-old mice of both genotypes; young adult mice froze significantly more (F(1,15) = 4.71, p < 0.05, control mice). Two hours after the CTX test, cued memory was assessed by presentation of the CS in a different setting. No significant differences emerged between TrkaNesCre mutant and control mice either before or during tone presentation at either stage analyzed (Fig. 8D,F). A significant effect of age, however, was observed when comparing the performances of 3- to 4-month-old and 11-month-old mice during the cued memory test in both genotypes; young adult animals froze significantly more than older mice (F(1,15) = 4.81, p < 0.05). These data further reinforce that hippocampal-dependent cognitive functions are not affected and demonstrate that amygdala-dependent cognitive functions do not require NGF-TrkA signaling in young adult and intermediate-aged mice.
Discussion
Whether depletion of NGF in the developing mouse brain is necessary for the survival, maturation or function of BFCNs remains an open question. Previous in vivo studies involving null mutants for either Trka or Ngf have established that while deletion of Trka affects survival of a subset of BFCNs, and the maturation of the remaining ones during the first 2–3 postnatal weeks, deletion of Ngf, in contrast, suggested that cholinergic innervation was normal in the BF target regions, despite reduced staining of ChAT-positive neurons for cholinergic markers and their overall smaller size (Crowley et al., 1994, Fagan et al., 1997). The poor viability and associated neuropathies exhibited by both null mutants has hindered further investigation with these mouse lines.
It has been established that cholinergic deficits and degeneration of cholinergic neurons are early hallmarks of neurodegenerative diseases such as Alzheimer's disease (AD), and it is believed that cholinergic depletion or dysfunction is likely to contribute to the associated cognitive and behavioral impairments (Mufson et al., 2008). Due to the prevalent expression of NGF and TrkA in the cholinergic system and their putative contribution to the above disease mechanisms (Mufson et al., 1997, 2000), we generated conditional alleles for both Ngf and Trka genes. The use of conditional deletions in the developing CNS should allow determination of whether NGF-TrkA signaling is necessary for the survival and maturation of BFCNs, both during and after development, and/or for the function of the cholinergic system in the adult brain.
Here we first demonstrated that both TrkA and NGF support the survival of only a subset of BFCNs during brain development. Second, we showed that NGF-TrkA signaling is not required for the maturation of the surviving BFCNs. Third, the viability and longevity of the conditional mutants, as well as the intact phenotype of the remaining cholinergic neurons, has allowed investigation of the contribution of NGF-TrkA signaling to attention and cognitive functions. Extensive behavioral analysis has revealed that loss of NGF-TrkA signaling does not influence cognitive functions including attention, learning, and memory of young adult and intermediate-aged mice.
Role of TrkA-NGF signaling in BFCNs during and after CNS development
In this report, we demonstrate that NGF-TrkA signaling supports the survival of only a proportion of BFCNs during brain development. These results augment previous data that show a critical role for TrkA signaling for the survival of a subset of BFCNs (36% less ChAT-positive septal neurons) (Fagan et al., 1997). Since a comparable loss occurs in septal cholinergic neurons in Ngf conditional mutants, these data indicate that TrkA mediates this function by transducing NGF signaling. However, in contrast to previous studies, we find that conditional deletion of Trka does not affect striatal neuron survival. We also observe that loss of NGF-TrkA signaling does not significantly influence ChAT-positive soma size in either conditional mutant. This discrepancy could reflect the poor condition/viability of the null mutant mice (Crowley et al., 1994; Smeyne et al., 1994; Fagan et al., 1997). Of note is a recent study that reported a forebrain interneuron-specific deletion of Trka (Sanchez-Ortiz et al., 2012). In contrast to our data, significant phenotypical differences with regard to the BFCNs were reported. Sanchez-Ortiz et al. (2012) did not observe a survival phenotype, but showed a requirement of TrkA for normal ChAT expression and cholinergic connectivity. We found that in both TrkaNesCre and NgfNesCre conditional mutants, NGF-TrkA signaling does not significantly affect ChAT expression in the surviving neurons, but the loss of ChAT expression mainly reflects the partial loss of cholinergic neurons. Moreover, analysis of the BFCN target innervation regions (hippocampus and cortex) by ChAT IF and AChE staining in cholinergic fibers demonstrated that the density of cholinergic nerve terminals was significantly different from that of control mice, reflecting mainly the partial neuronal loss found in these mutants. These results were also supported by the fact that ChAT-positive varicosities of the remaining cholinergic fibers of young adult and intermediate-aged mice were found to be normal. One explanation for these discrepancies may simply be that ChAT expression is not greatly affected in the surviving cholinergic neurons of TrkaNesCre and NgfNesCre mutants, and this allowed us to use it as a specific marker to study the survival, morphology, and connectivity of BFCNs throughout their first year of life and, regarding the BFCN survival study, until 20 months of age. The p75NTR has been shown to colocalize with ChAT and TrkA in MS neurons (Sobreviela et al., 1994), so we also counted MS neurons stained with this marker. This analysis showed a similar loss in cholinergic neurons of conditional mutants, supporting the data obtained with the specific marker ChAT. We analyzed hippocampal and cortical cholinergic innervation by both ChAT and AChE staining. The latter visualizes the enzymatic activity of AChE in cholinergic fibers, and in mouse has been shown to virtually colocalize with ChAT immunostaining in most cholinergic neuron targets, including the cortex and hippocampus (Kitt et al., 1994). In contrast, Sanchez-Ortiz et al. (2012) reported severe loss of cholinergic fibers in the target regions (hippocampus and cortex) based on absence of p75 NTR staining and absence of retrograde tracing of BFCNs using Texas Red-dextran amine, but found no reduction in either number, size, or p75 expression in BFCN soma. One explanation for this could be found in the two different Cre lines and their timing of recombination. While the NesCre line we used drives Cre expression already at E11.5 (Medina et al., 2004), the dlx5/6i-Cre line used by Sanchez-Ortiz et al. (2012) started at E16.5, leading to later deletion of Trka considering that Trka expression in the septal–pallidal region starts at E13.5 (Allen Brain Atlas, http://mouse.brain-map.org).
Because, despite loss of NGF-TrkA signaling, cholinergic connectivity of the surviving neurons was not affected, and ChAT-positive axonal varicosity, a marker of neuronal activity (Zhang et al., 2011), was intact in the BFCN target regions of these mutants, we went on to determine whether the absence of NGF-TrkA signaling would be relevant for cholinergic cognitive functions or learning and memory in general. Conditional mutants were subjected to a variety of different behavioral tasks to investigate different aspects of learning, memory, and attention. No significant differences were found between knock-out and control mice in any behavioral tasks performed and stages analyzed, suggesting that mutants have not only intact septohippocampal and corticohippocampal pathways, but also an intact working memory and attention behavior shown to be necessary for these tasks in both humans and rodents (Squire and Cave 1991). Also, we analyzed emotional learning that involves corticohippocampal as well as amygdalar circuits. We found that this task was unaffected in TrkaNesCre mutants, suggesting an intact fear learning system and intact amygdala cholinergic afferents. This is in contrast to a recent study that proposed a role for TrkA in the regulation of amygdala-dependent function such as tone-cued fear conditioning (Sanchez-Ortiz et al., 2012). The discrepancy between our data and that of Sanchez-Ortiz et al. (2012) may be attributed to the selective elimination of BF cholinergic innervation to the target field, observed in the latter, resulting in the mild amygdala-dependent defect. Alternatively, the mild behavioral phenotype they observed could also be due to a difference in mouse genetic backgrounds used in the two studies. All our studies use strains kept on a 129:C57BL/6J mixed background (Minichiello et al., 1999, 2002). A second possibility is the different Cre lines used in the two studies: while the NestinCre line used here has been extensively characterized for cognitive behavior both in this study and others (Tronche et al., 1999), it is not clear whether the dlx5/6i-Cre line used in the study by Sanchez-Ortiz et al. (2012) has been tested as extensively for cognitive functions.
Possible implication of NGF-TrkA signaling in disease mechanisms
We show here that CNS deletion of either Trka or Ngf leads to very similar phenotypes. This suggests that the p75NTR negative regulation of BFCN survival occurs by interaction with other ligands and/or coreceptors (Dechant and Barde, 2002). Moreover, these data also indicate that BFCNs, after an initial requirement for survival during development, apparently become independent of NFG-TrkA signaling during the first year of life. Therefore, endogenous NGF-TrkA signaling could be specifically directed to function in a neuroprotective role during aging and/or in a neurodegenerative scenario (Sofroniew et al., 2001). In AD patient brains, Trka expression is downregulated, while NGF levels are deregulated. This has led to the classical view that atrophy of cholinergic neurons in AD patients is a consequence of lack of trophic support, resulting from an impaired NGF retrograde transport system, with consequent accumulation of NGF protein in target areas (Mufson et al., 1999, Sofroniew et al., 2001). Furthermore, an increase of pro-NGF has been shown in AD brains (Fahnestock et al., 2001), and in brains of patients affected by mild cognitive impairment (Peng et al., 2004). Since pro-NGF/p75NTR signaling would be present in TrkaNesCre but absent in NgfNesCre conditional mutants, it is essential to now study both conditional mutants during late aging to try to dissect whether the absence of the neuroprotective signaling (NGF-TrkA) and presence only of pro-NGF/p75NTR signaling would lead to neurodegeneration in the TrkaNesCre mutants and to neuroprotection in the NgfNesCre mutants.
Footnotes
This work was supported in part by European Union Grant EU FP6 MEMORIES, 037831 (L.M.) and Italian Ministry of Education, University and Research Grant PRIN 2009KP83CR (V.C.). We thank the European Molecular Biology Laboratory—Monterotondo transgenic service for the production of the Ngf and Trka floxed mice, the EMBL-MR Mouse Phenotyping Facility for assistance and analysis of some of the behavioral experiments, L. F. Reichardt for providing TrkA antibodies, L Tessarollo for providing a plasmid containing an 18 kB Trka genomic locus (exons 1-17), and P. Ernfors for providing a plasmid containing an 12 kB Ngf genomic locus (exon 4).
The authors declare no competing financial interests.
References
- Ammassari-Teule M, Hoffmann HJ, Rossi-Arnaud C. Learning in inbred mice: strain-specific abilities across three radial maze problems. Behav Genet. 1993;23:405–412. doi: 10.1007/BF01067443. [DOI] [PubMed] [Google Scholar]
- Baron SP, Meltzer LT. Mouse strains differ under a simple schedule of operant learning. Behav Brain Res. 2001;118:143–152. doi: 10.1016/s0166-4328(00)00322-3. [DOI] [PubMed] [Google Scholar]
- Baxter MG, Chiba AA. Cognitive functions of the basal forebrain. Curr Opin Neurobiol. 1999;2:178–183. doi: 10.1016/s0959-4388(99)80024-5. [DOI] [PubMed] [Google Scholar]
- Bevins RA, Besheer J. Object recognition in rats and mice: a one-trial non-matching-to-sample learning task to study ‘recognition memory.’. Nat Protoc. 2006;1:1306–1311. doi: 10.1038/nprot.2006.205. [DOI] [PubMed] [Google Scholar]
- Cave CB, Squire LR. Equivalent impairment of spatial and nonspatial memory following damage to the human hippocampus. Hippocampus. 1991;1:329–340. doi: 10.1002/hipo.450010323. [DOI] [PubMed] [Google Scholar]
- Crowley C, Spencer SD, Nishimura MC, Chen KS, Pitts-Meek S, Armanini MP, Ling LH, McMahon SB, Shelton DL, Levinson AD. Mice lacking nerve growth factor display perinatal loss of sensory and sympathetic neurons yet develop basal forebrain cholinergic neurons. Cell. 1994;76:1001–1011. doi: 10.1016/0092-8674(94)90378-6. [DOI] [PubMed] [Google Scholar]
- Dechant G, Barde YA. The neurotrophin receptor p75(NTR): novel functions and implications for diseases of the nervous system. Nat Neurosci. 2002;5:1131–1136. doi: 10.1038/nn1102-1131. [DOI] [PubMed] [Google Scholar]
- Di Patre PL, Mathes CW, Butcher LL. Differential visualization of cholinesterasic neuronal somata and fibers by use of modifications of acetylcholinesterase pharmacohistochemistry. J Histochem Cytochem. 1993;41:129–135. doi: 10.1177/41.1.7678024. [DOI] [PubMed] [Google Scholar]
- Fagan AM, Garber M, Barbacid M, Silos-Santiago I, Holtzman DM. A role for TrkA during maturation of striatal and basal forebrain cholinergic neurons in vivo. J Neurosci. 1997;17:7644–7654. doi: 10.1523/JNEUROSCI.17-20-07644.1997. [DOI] [PMC free article] [PubMed] [Google Scholar]
- Fahnestock M, Michalski B, Xu B, Coughlin MD. The precursor pro-nerve growth factor is the predominant form of nerve growth factor in brain and is increased in Alzheimer's disease. Mol Cell Neurosci. 2001;18:210–220. doi: 10.1006/mcne.2001.1016. [DOI] [PubMed] [Google Scholar]
- Higgins GA, Breysse N. Rodent model of attention: the 5-choice serial reaction time task. Curr Protoc Pharmacol. 2008;5:5.49. doi: 10.1002/0471141755.ph0549s41. [DOI] [PubMed] [Google Scholar]
- Huang EJ, Reichardt LF. Neurotrophins: roles in neuronal development and function. Annu Rev Neurosci. 2001;24:677–736. doi: 10.1146/annurev.neuro.24.1.677. [DOI] [PMC free article] [PubMed] [Google Scholar]
- Humby T, Laird FM, Davies W, Wilkinson LS. Visuospatial attentional functioning in mice: interactions between cholinergic manipulations and genotype. Eur J Neurosci. 1999;11:2813–2823. doi: 10.1046/j.1460-9568.1999.00701.x. [DOI] [PubMed] [Google Scholar]
- Kitt CA, Höhmann C, Coyle JT, Price DL. Cholinergic innervation of mouse forebrain structures. J Comp Neurol. 1994;341:117–129. doi: 10.1002/cne.903410110. [DOI] [PubMed] [Google Scholar]
- Large TH, Bodary SC, Clegg DO, Weskamp G, Otten U, Reichardt LF. Nerve growth factor gene expression in the developing rat brain. Science. 1986;234:352–355. doi: 10.1126/science.3764415. [DOI] [PubMed] [Google Scholar]
- Lee B, Tumu P, Paul IA. Effects of LP-BM5 murine leukemia virus infection on errors and response time in a two-choice serial reaction time task in C57BL/6 mice. Brain Res. 2002;948:1–7. doi: 10.1016/s0006-8993(02)02942-6. [DOI] [PubMed] [Google Scholar]
- Lee R, Kermani P, Teng KK, Hempstead BL. Regulation of cell survival by secreted proneurotrophins. Science. 2001;294:1945–1948. doi: 10.1126/science.1065057. [DOI] [PubMed] [Google Scholar]
- Lu B, Buck CR, Dreyfus CF, Black IB. Expression of NGF and NGF receptor mRNAs in the developing brain: evidence for local delivery and action of NGF. Exp Neurol. 1989;104:191–199. doi: 10.1016/0014-4886(89)90029-0. [DOI] [PubMed] [Google Scholar]
- Lu B, Pang PT, Woo NH. The yin and yang of neurotrophin action. Nat Rev Neurosci. 2005;6:603–614. doi: 10.1038/nrn1726. [DOI] [PubMed] [Google Scholar]
- Medina DL, Sciarretta C, Calella AM, Von Bohlen Und Halbach O, Unsicker K, Minichiello L. TrkB regulates neocortex formation through the Shc/PLCgamma-mediated control of neuronal migration. EMBO J. 2004;23:3803–3814. doi: 10.1038/sj.emboj.7600399. [DOI] [PMC free article] [PubMed] [Google Scholar]
- Minichiello L, Korte M, Wolfer D, Kühn R, Unsicker K, Cestari V, Rossi-Arnaud C, Lipp HP, Bonhoeffer T, Klein R. Essential role for TrkB receptors in hippocampus-mediated learning. Neuron. 1999;24:401–414. doi: 10.1016/s0896-6273(00)80853-3. [DOI] [PubMed] [Google Scholar]
- Minichiello L, Calella AM, Medina DL, Bonhoeffer T, Klein R, Korte M. Mechanism of TrkB-mediated hippocampal long-term potentiation. Neuron. 2002;36:121–137. doi: 10.1016/s0896-6273(02)00942-x. [DOI] [PubMed] [Google Scholar]
- Mobley WC, Woo JE, Edwards RH, Riopelle RJ, Longo FM, Weskamp G, Otten U, Valletta JS, Johnston MV. Developmental regulation of nerve growth factor and its receptor in the rat caudate-putamen. Neuron. 1989;3:655–664. doi: 10.1016/0896-6273(89)90276-6. [DOI] [PubMed] [Google Scholar]
- Mufson EJ, Lavine N, Jaffar S, Kordower JH, Quirion R, Saragovi HU. Reduction in p140-TrkA receptor protein within the nucleus basalis and cortex in Alzheimer's disease. Exp Neurol. 1997;146:91–103. doi: 10.1006/exnr.1997.6504. [DOI] [PubMed] [Google Scholar]
- Mufson EJ, Kroin JS, Sendera TJ, Sobreviela T. Distribution and retrograde transport of trophic factors in the central nervous system: functional implications for the treatment of neurodegenerative diseases. Prog Neurobiol. 1999;57:451–484. doi: 10.1016/s0301-0082(98)00059-8. [DOI] [PubMed] [Google Scholar]
- Mufson EJ, Ma SY, Cochran EJ, Bennett DA, Beckett LA, Jaffar S, Saragovi HU, Kordower JH. Loss of nucleus basalis neurons containing trkA immunoreactivity in individuals with mild cognitive impairment and early Alzheimer's disease. J Comp Neurol. 2000;427:19–30. doi: 10.1002/1096-9861(20001106)427:1<19::aid-cne2>3.0.co;2-a. [DOI] [PubMed] [Google Scholar]
- Mufson EJ, Counts SE, Perez SE, Ginsberg SD. Cholinergic system during the progression of Alzheimer's disease: therapeutic implications. Expert Rev Neurother. 2008;8:1703–1718. doi: 10.1586/14737175.8.11.1703. [DOI] [PMC free article] [PubMed] [Google Scholar]
- Naumann T, Casademunt E, Hollerbach E, Hofmann J, Dechant G, Frotscher M, Barde YA. Complete deletion of the neurotrophin receptor p75NTR leads to long-lasting increases in the number of basal forebrain cholinergic neurons. J Neurosci. 2002;22:2409–2418. doi: 10.1523/JNEUROSCI.22-07-02409.2002. [DOI] [PMC free article] [PubMed] [Google Scholar]
- Paxinos G, Franklin KB. The mouse brain in stereotaxic coordinates. Ed 2. San Diego: Academic; 2001. [Google Scholar]
- Peng S, Wuu J, Mufson EJ, Fahnestock M. Increased proNGF levels in subjects with mild cognitive impairment and mild Alzheimer disease. J Neuropathol Exp Neurol. 2004;63:641–649. doi: 10.1093/jnen/63.6.641. [DOI] [PubMed] [Google Scholar]
- Pisani A, Bernardi G, Ding J, Surmeier DJ. Re-emergence of striatal cholinergic interneurons in movement disorders. Trends Neurosci. 2007;30:545–553. doi: 10.1016/j.tins.2007.07.008. [DOI] [PubMed] [Google Scholar]
- Rodríguez CI, Buchholz F, Galloway J, Sequerra R, Kasper J, Ayala R, Stewart AF, Dymecki SM. High-efficiency deleter mice show that FLPe is an alternative to Cre-loxP. Nat Genet. 2000;25:139–140. doi: 10.1038/75973. [DOI] [PubMed] [Google Scholar]
- Sanchez-Ortiz E, Yui D, Song D, Li Y, Rubenstein JL, Reichardt LF, Parada LF. TrkA gene ablation in basal forebrain results in dysfunction of the cholinergic circuitry. J Neurosci. 2012;32:4065–4079. doi: 10.1523/JNEUROSCI.6314-11.2012. [DOI] [PMC free article] [PubMed] [Google Scholar]
- Scott J, Selby M, Urdea M, Quiroga M, Bell GI, Rutter WJ. Isolation and nucleotide sequence of a cDNA encoding the precursor of mouse nerve growth factor. Nature. 1983;302:538–540. doi: 10.1038/302538a0. [DOI] [PubMed] [Google Scholar]
- Seidah NG, Benjannet S, Pareek S, Savaria D, Hamelin J, Goulet B, Laliberte J, Lazure C, Chrétien M, Murphy RA. Cellular processing of the nerve growth factor precursor by the mammalian pro-protein convertases. Biochem J. 1996;314:951–960. doi: 10.1042/bj3140951. [DOI] [PMC free article] [PubMed] [Google Scholar]
- Smeyne RJ, Klein R, Schnapp A, Long LK, Bryant S, Lewin A, Lira SA, Barbacid M. Severe sensory and sympathetic neuropathies in mice carrying a disrupted Trk/NGF receptor gene. Nature. 1994;368:246–249. doi: 10.1038/368246a0. [DOI] [PubMed] [Google Scholar]
- Sobreviela T, Clary DO, Reichardt LF, Brandabur MM, Kordower JH, Mufson EJ. TrkA-immunoreactive profiles in the central nervous system: colocalization with neurons containing p75 nerve growth factor receptor, choline acetyltransferase, and serotonin. J Comp Neurol. 1994;350:587–611. doi: 10.1002/cne.903500407. [DOI] [PMC free article] [PubMed] [Google Scholar]
- Sofroniew MV, Howe CL, Mobley WC. Nerve growth factor signaling, neuroprotection, and neural repair. Annu Rev Neurosci. 2001;24:1217–1281. doi: 10.1146/annurev.neuro.24.1.1217. [DOI] [PubMed] [Google Scholar]
- Squire LR, Cave CB. The hippocampus, memory, and space. Hippocampus. 1991;1:269–271. doi: 10.1002/hipo.450010313. [DOI] [PubMed] [Google Scholar]
- Tronche F, Kellendonk C, Kretz O, Gass P, Anlag K, Orban PC, Bock R, Klein R, Schütz G. Disruption of the glucocorticoid receptor gene in the nervous system results in reduced anxiety. Nat Genet. 1999;23:99–103. doi: 10.1038/12703. [DOI] [PubMed] [Google Scholar]
- Ullrich A, Gray A, Berman C, Dull TJ. Human beta-nerve growth factor gene sequence highly homologous to that of mouse. Nature. 1983;303:821–825. doi: 10.1038/303821a0. [DOI] [PubMed] [Google Scholar]
- Yeo TT, Chua-Couzens J, Butcher LL, Bredesen DE, Cooper JD, Valletta JS, Mobley WC, Longo FM. Absence of p75NTR causes increased basal forebrain cholinergic neuron size, choline acetyltransferase activity, and target innervation. J Neurosci. 1997;17:7594–7605. doi: 10.1523/JNEUROSCI.17-20-07594.1997. [DOI] [PMC free article] [PubMed] [Google Scholar]
- Zhang ZW, Kang JI, Vaucher E. Axonal varicosity density as an index of local neuronal interactions. PLoS One. 2011;6:e22543. doi: 10.1371/journal.pone.0022543. [DOI] [PMC free article] [PubMed] [Google Scholar]