

Abstract
Newly experienced events are often remembered together with how rewarding the experiences are personally. Although the hippocampus is a candidate structure where subjective values are integrated with other elements of episodic memory, it is uncertain whether and how the hippocampus processes value-related information. We examined how activity of dorsal CA1 and dorsal subicular neurons in rats performing a dynamic foraging task was related to reward values that were estimated using a reinforcement learning model. CA1 neurons carried significant signals related to action values before the animal revealed its choice behaviorally, indicating that the information on the expected values of potential choice outcomes was available in CA1. Moreover, after the outcome of the animal's goal choice was revealed, CA1 neurons carried robust signals for the value of chosen action and they temporally overlapped with the signals related to the animal's goal choice and its outcome, indicating that all the signals necessary to evaluate the outcome of an experienced event converged in CA1. On the other hand, value-related signals were substantially weaker in the subiculum. These results suggest a major role of CA1 in adding values to experienced events during episodic memory encoding. Given that CA1 neuronal activity is modulated by diverse attributes of an experienced event, CA1 might be a place where all the elements of episodic memory are integrated.
Introduction
Autobiographical memories for individual events are often stored with their affective attributes such as how rewarding the experiences are personally. Thus, subjective value of an experienced event (i.e., desirability of event outcome) is an important element of episodic memory in our daily lives. Nevertheless, it is unclear how value-related information is combined with other components of an experienced event to form a unified episodic memory. Value-related information might be integrated with other elements of episodic memory in the hippocampus, a brain structure playing a crucial role in encoding episodic memory (O'Keefe and Nadel, 1978; Squire, 1987). Alternatively, the hippocampus might encode only factual information, which might be integrated with value-related information elsewhere. In this regard, numerous physiological studies have shown that activity of hippocampal neurons can be modulated by reward. However, the majority of these studies simply compared firing rates during rewarded versus unrewarded trials or spatial firing patterns before and after changing reward location (Watanabe and Niki, 1985; Eichenbaum et al., 1987; Breese et al., 1989; Kobayashi et al., 1997; Martin and Ono, 2000; Hollup et al., 2001; Hölscher et al., 2003; Tabuchi et al., 2003; Smith and Mizumori, 2006; Wirth et al., 2009); none of them investigated how neuronal activity is modulated by a quantitative aspect of reward, such as its magnitude, delay, or probability. Hence, these studies do not tell us whether the hippocampus processes information related to value (i.e., quantitative estimate of expected return) (Sutton and Barto, 1998) or it simply transmits information on the occurrence of a meaningful event. In the present study, to resolve this matter, we recorded hippocampal neuronal activity in rats performing a dynamic foraging task. During this task, expected reward values varied dynamically across trials according to the history of the animal's choices and their outcomes, so that neural activity reflecting expected reward values can be separated from the activity that merely registers the receipt of reward (Kim et al., 2009; Sul et al., 2010, 2011).
We examined value-related neuronal activity in CA1 and subiculum, which receive dopaminergic projections from the ventral tegmental area (Swanson et al., 1987; Gasbarri et al., 1997). Numerous brain structures that are targets of dopaminergic projections transmit value-related signals (Lee et al., 2012). Also, a human brain imaging study has shown that stimuli with large expected rewards elicited correlated activation of the hippocampus and ventral tegmental area, which predicted successful retrieval of the experienced stimuli (Adcock et al., 2006). We therefore examined whether CA1 and subicular neuronal activity was correlated with expected reward values that were estimated with a reinforcement learning (RL) model (Sutton and Barto, 1998). We found that both CA1 and subiculum conveyed significant neural signals for the animal's choice and its outcome over multiple trials, indicating that ingredient neural signals for computing values based on past experiences are available in both structures. However, value signals were significantly stronger in CA1, suggesting a major role of CA1 in integrating value information with other elements of episodic memory.
Materials and Methods
Subjects
Experiments were performed with eight young male Sprague Dawley rats (∼9–11 weeks old, 330–350 g). Upon arrival, the animals were individually housed in a colony room and initially allowed free access to food and water. They were then subjected to water deprivation (maintained at >80% ad libitum body weight) with extensive handling for at least 1 week. Once behavioral training began, they were restricted to 30 min of access to water (but with ad libitum access to food) after finishing one behavioral session per day. Experiments were performed in the dark phase of a 12 h light/dark cycle. The experimental protocol was approved by the Ethics Review Committee for Animal Experimentation of the Ajou University School of Medicine, Korea.
Behavioral task
The animals were trained in a dynamic two-armed bandit task on a modified T-maze (Fig. 1A) as described previously (Huh et al., 2009; Kim et al., 2009; Sul et al., 2010). It was a free binary choice task with each choice associated with a different probability of reward that was constant within a block of trials, but changed across blocks with no explicit sensory cues. Each animal was tested for a total of 8 to 13 sessions, and each session consisted of four blocks each consisting of 35–45 trials. Four combinations of reward probabilities were used in each session (0.72/0.12, 0.63/0.21, 0.21/0.63 and 0.12/0.72), and their sequence was determined pseudorandomly with the constraint that the option with the higher-reward probability always changed its location at the beginning of a new block. The beginning of a new trial was defined as the time when the animal arrived at the central stem from either goal, which was detected by a photobeam sensor (Fig. 1A, blue dotted line). A 2 s delay was imposed at the beginning of each trial by raising the distal portion of the central stem. It was lowered at the end of the delay period, allowing the animal to move forward. When the animal arrived at either goal, which was detected by a photobeam sensor that was placed 6 cm ahead of the water delivery nozzle, an auditory tone [conditioned stimulus (CS); 9 and 1 kHz for rewarded and unrewarded trials that were counterbalanced across animals] was delivered for 1 s, and 30 μl of water was delivered at the CS offset in rewarded trials.
Figure 1.

Behavioral task and recording sites. A, Dynamic foraging task. Rats were tested on a modified T maze to choose between two locations (blue circles) that delivered water reward with different probabilities. The maze was divided spatially into four different stages (stem, approach, goal, and return) as indicated by the dotted lines (blue dotted line, beginning of a trial). Arrows indicate alternative movement directions of the animals. B, Recording sites. The photomicrographs are coronal sections of the brain that were stained with cresyl violet. Single units were recorded from the dorsal CA1 (left) and dorsal subiculum (right). The arrows indicate marking lesions. Scale bars: A, 10 cm; B, 1 mm.
The maze was spatially divided into four different stages (Fig. 1A). The time of the animal's entry into the proximal end of the stem stage (Fig. 1A, blue dotted line) corresponds to the beginning of a new trial. The border between the stem and approach stages was approximately where the animal's movement trajectories began to diverge according to the animal's goal choice. The borders between the approach and goal stages corresponded to the positions of the photobeams located in the top alley (6 cm ahead of the water delivery nozzle). Therefore, the onset of the CS corresponded to the beginning of the goal stage. The goal stage was temporally divided into CS (first 1 s during which an auditory tone was presented) and reward (the rest) periods. The animals stayed at the goal throughout the CS period in almost all (98.0%) trials. In addition, they typically licked the water delivery nozzle during the reward period in both rewarded and unrewarded trials. However, the duration of the reward period was longer for rewarded (13.85 ± 11.55 s) than unrewarded (2.84 ± 8.24 s; mean ± SD) trials. The borders between the goal and return stages were defined as the positions in the lateral allies 11 cm away from the water delivery nozzle.
Analysis of behavioral data
Matching law.
The animal's choice behavior during the steady state (last 20 trials in each block) was fit to the following linear regression model (generalized matching law) (Baum, 1974) for each animal:
where CL (or CR) and RL (or RR) are choice frequency and reinforcement frequency (i.e., the frequency of obtaining a reward) for the left (or right) goal, respectively. The coefficient a denotes the sensitivity to the reinforcement ratio, and b is a bias term.
Logistic regression analysis.
The effects of past choices and rewards on the animal's current choice were examined by performing a trial-by-trial analysis of the animal's choices using the following logistic regression model (Kim et al., 2009):
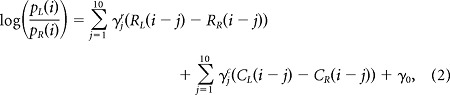 |
where PL(i) [or PR(i)] is the probability of selecting the left (or right) goal in the ith trial. The variables RL(i) [or RR(i)] and CL(i) [or CR(i)] are reward delivery at the left (or right) goal (0 or 1) and the left (or right) goal choice (0 or 1) in the ith trial, respectively. The coefficients γjr and γjc denote the effect of past rewards and choices, respectively, and γ0 is a bias term. The coefficients were estimated from the entire behavioral data set for each animal.
Reinforcement learning model.
Action values for individual trials were estimated using a simple RL model [Rescorla–Wagner rule (Rescorla and Wagner, 1972) or temporal difference Q-learning model (Sutton and Barto, 1998)] as follows. If choice is left, we have the following:
If choice is right we have the following:
where QL(t) and QR(t) denote the left and right action values, respectively (i.e., reward expected from choosing the left or right goal), R(t) represents the reward in the tth trial (1 if rewarded and 0 otherwise), α is the learning rate, and RPE denotes reward prediction error (the difference between actual and expected rewards) (Sutton and Barto, 1998). Actions were chosen in the RL model according to the softmax action selection rule (Sutton and Barto, 1998) as the follows:
where PL(t) is the probability of selecting the left goal, and β is the inverse temperature that determines the degree of exploration in action selection. The parameters α (learning rate; 0.50–0.69; 0.57 ± 0.06) and β (inverse temperature; 1.98–5.30; 3.22 ± 1.09, mean ± SD) of the RL model were estimated for the entire data set from each animal using a maximum likelihood procedure (Sul et al., 2010). How well the animal's choices were accounted for by the RL model was quantified by the negative log likelihood normalized by the number of trials as well as the accuracy of the choices predicted by the model. The prediction accuracy was obtained using a leave-one-out cross-validation procedure in which the results from each session were tested with the model parameters estimated using the data from all the other sessions for each animal.
Neurophysiology
Twelve tetrodes were chronically implanted in the left or right dorsal CA1 (3.8 mm posterior and 2.0 mm lateral to bregma; five animals) or dorsal subiculum (6.0 mm posterior and 2.6 mm lateral to bregma; three animals; Fig. 1B) under deep anesthesia with sodium pentobarbital (50 mg/kg). Recordings began when well-isolated unit signals were obtained from the intended recording region in overtrained animals. Unit signals were amplified with a gain of 10,000, filtered between 600 and 6000 Hz, digitized at 32 kHz and stored on a personal computer using Cheetah data acquisition system (Bozemann). The animal's head position and direction were monitored by tracking a set of light-emitting diodes mounted on the headstage at 60 Hz. When recordings were completed, small marking lesions were made, and recording locations were verified histologically as described previously (Song et al., 2005).
Analysis of neural data
Isolation and classification of units.
Single units were isolated off-line based on various spike waveform parameters using Mclust software (A. D. Redish, Department of Neuroscience, University of Minnesota, Minneapolis, MN) as described previously (Lee et al., 2009). Recorded units were classified based on mean discharge rate and a burst index (the percentage of interspike intervals shorter than one-fourth of each neuron's mean interspike interval; Fig. 2). Low-rate, high-bursting units were classified as putative pyramidal cells in both areas (Ranck, 1973; Sharp and Green, 1994; Staff et al., 2000) and were included in the analysis. The remaining units excluded from the analysis are likely to consist of multiple cell types including inhibitory interneurons. Similar results were obtained, however, when the low-rate, low-bursting units were also included in the analysis (see Fig. 7D). The cutoff values were determined based on the distributions of the indices (mean discharge rates, 7 and 8 Hz for CA1 and subiculum, respectively; burst index, 40%). The majority were putative pyramidal cells (CA1, 325 of 354, 91.8%; subiculum, 115 of 172, 66.9%), and their mean discharge rates were 1.06 ± 0.05 Hz in CA1 and 1.93 ± 0.12 Hz in the subiculum, and their mean percentages of short interspike intervals (less than one-fourth of each neuron's mean interspike interval) were 68.7 ± 0.5% in CA1 and 59.7 ± 0.9% in the subiculum. For the remaining neurons, the mean discharge rates were 12.31 ± 1.92 Hz in CA1 and 7.55 ± 0.69 Hz in the subiculum, and the mean percentages of short interspike intervals were 26.7 ± 1.7% in CA1 and 28.1 ± 1.4% in the subiculum.
Figure 2.

Unit classification. The scatter plots show mean discharge rates and values of the burst index (the percentage of interspike intervals shorter than one-fourth of each neuron's mean interspike interval) for individual CA1 and subicular neurons. Those units with low discharge rates (CA1, <7 Hz; subiculum, <8 Hz) and large burst index values (>40% for both CA1 and subiculum) were classified as putative pyramidal cells.
Figure 7.
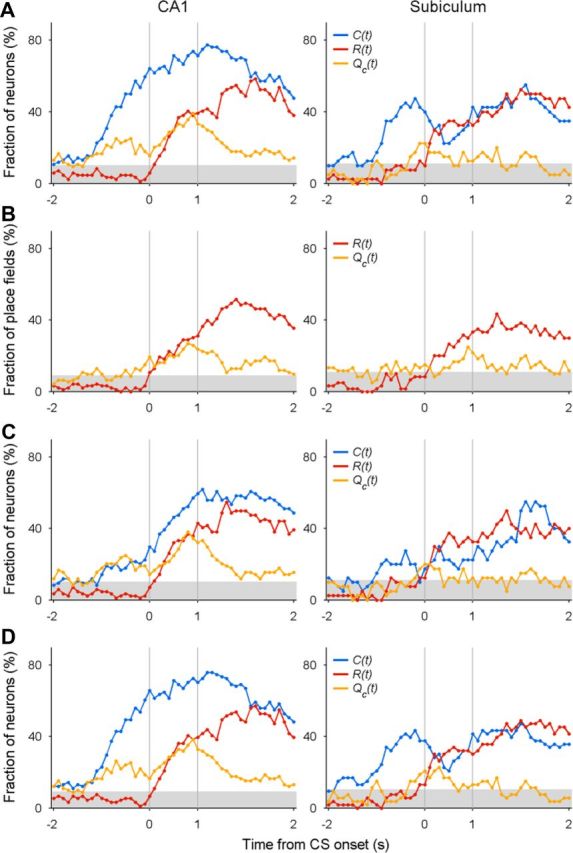
Convergence of neural signals in CA1 (left) and subiculum (right) related to the animal's choice, its outcome and chosen value. A, Temporal profiles of neural signals for the animal's goal choice [C(t)], its outcome [R(t)], and chosen value [Qc(t)] are shown around the time of CS onset (time 0) for those neurons with MPFs in the goal stage. The graphs show fractions of MPFs that significantly modulated their activity according to a given variable in a 1 s moving window advanced in 0.1 s time steps. Values above the shaded areas are significantly higher than the chance level (binomial test, α = 0.05). B, Results from the analysis of individual place fields. C, Results from the regression analysis including the animal's head direction. D, Results from the analysis that included neurons with low firing rates and low burst firing.
Determination of place fields.
Because the animals ran along relatively narrow (8 cm) tracks, the maze was linearized and one-dimensional place fields were determined for each neuron. The animal's movement trajectories were mapped onto straight lines beginning from the lower portion of the central stem (Fig. 1A, blue dotted line). The last 10 cm of the linearized trajectory was removed because sharply curved trajectories in this portion of maze made linearization difficult. A spatial firing rate map was constructed for each neuron by dividing spike counts with occupancies (the amounts of time the animal spent) in 2 cm bins that were smoothed with a 4 cm SD Gaussian curve. A place field was defined as a set of adjacent bins that met the following criteria (Frank et al., 2000; Kjelstrup et al., 2008): (1) there should be five or more adjacent bins in which firing rate of a neuron was above 30% of its maximum firing rate across bins, (2) the mean firing rate of a neuron during the task should exceed 0.1 Hz, (3) the maximum firing rate of a place field should exceed 3 Hz, and (4) the total number of spikes within each place field should be at least 100. Spatial information content per spike (the amount of information about spatial location conveyed by a single spike of a given neuron) was also calculated as described previously (Skaggs et al., 1993).
Merged place fields.
Neural data within a place field that was located on either side of the maze (approach, goal, and return stages; Fig. 1A) were merged with those in the corresponding bins on the opposite side to form a merged place field (MPF; see Fig. 4A) so that neural activity related to the animal's goal choice and other variables, such as choice outcome and action value, can be analyzed simultaneously using a multiple regression model. This was particularly useful for quantitatively comparing strengths of different types of neural signals including choice signals across different stages of the task. Here, side specificity of place fields is captured by the activity related to the animal's goal “choice” in the regression models. Similar conclusions were obtained, however, when individual place fields were analyzed separately (see below). For those neurons that had place fields on both sides of the maze at corresponding locations (when the center of one place field fell within the place field at the opposite side), the union of the two MPFs was considered as a single MPF so that the same neural activity was not analyzed twice (CA1, 22 MPFs; subiculum, 52 MPFs). As a result, 275 CA1 and 136 subicular MPFs were subjected to analysis. In addition, for those place fields located on the central stem, individual place fields were analyzed separately (CA1, n = 70; subiculum, n = 45).
Figure 4.

Place fields on linearized maze. A, Determination of an MPF. After determining place fields for each neuron on the linearized maze, neural data within each place field on either side of the maze (approach, goal and return stages) were merged with those in the corresponding bins on the opposite side of the maze for further analysis, whereas place fields on the central stem were analyzed individually. Appr, Approach stage. B, C, Spatial firing rate maps are shown for all CA1 (B) and subicular (C) putative pyramidal cells that had at least one place field (n = 264 and 99 neurons, respectively). The map for each neuron is in the same format as in A. Those neurons with multiple place fields are indicated by tick marks on the right. Red indicates maximum firing rate that is different for each neuron (CA1, 14.02 ± 10.04 Hz, mean ± SD; range, 3.00–53.05 Hz; subiculum, 12.65 ± 8.06 Hz, 3.11–41.82 Hz), and dark blue indicates no firing. The firing rate maps were sorted according to the relative locations of the first place fields. The gray histogram (B, C) shows the mean normalized firing rate of all neurons shown in each set of maps.
Multiple regression analysis.
Neural signals for the animal's goal choice (C; left or right; dummy variable, 1 and −1), its outcome (R; rewarded or unrewarded; dummy variable, 1 and −1), and their interaction (X = C × R; dummy variable, 1 and −1) in the current and previous trials (t and t − 1, respectively) were estimated using the following multiple regression model:
where S(t) indicates spike discharge rate, A(t) is a set of autoregressive terms (spike discharge rates in the previous five trials), ΔP is the difference in objective reward probabilities within each block (Pleft − Pright; i.e., a variable for behavioral context), ε(t) is the error term, and a0∼a7 are the regression coefficients; B(t) is a set of behavioral variables (each multiplied by its regression coefficient) included in all regression models to account for the effect of the animal's head position and movement speed on trial-by-trial neuronal activity. For the place-field-based analyses, B(t) included mean lateral head position along the trajectory and mean movement speed within each place field. For the temporal window-based analyses, mean head position on the linearized trajectory within each analysis window was additionally included to control for positional variation. Significant fractions of CA1 and subicular neurons modulated their activity according to each component of these behavioral variables (data not shown). The animal's head direction was not included in the regression models, because the animal navigated along stereotyped trajectories and it was highly correlated with the animal's goal choice (left vs right), especially during the approach and return stages (when the animal was running forward). However, adding horizontal and vertical components of mean head direction [cos(θ) and sin(θ), where θ is the mean head direction] to the regression models yielded similar results, except that current choice signals were weakened due to their correlation with the mean horizontal head position (see Fig. 7C; Table 3). Note that the animal's “goal choice” in the approach, goal, and return stages represents which side of the maze the animal is located on. Neural activity related to the animal's goal choice in these stages might represent neural activity related to the animal's spatial location, head direction (when it is not included in the regression model), or different sensory features associated with the two sides of the maze, and its precise origin cannot be determined in this study.
Table 3.
Results obtained with the regression analyses including the animal's head direction
|
Equation 10 (all stages) |
Equation 11 (stem stage) QL(t) or QR(t) |
Equation 12 (goal stage) |
||||||||
|---|---|---|---|---|---|---|---|---|---|---|
| C(t) | R(t) | X(t) | C(t − 1) | R(t − 1) | X(t − 1) | C(t) | R(t) | Qc(t) | ||
| CA1 | ||||||||||
| Original data | 239* (69.3%) | 77* (22.3%) | 94* (27.2%) | 100* (29.0%) | 46* (13.3%) | 29* (8.4%) | 10* (14.3%) | 73* (86.9%) | 36* (42.9%) | 29* (34.5%) |
| + Head direction | 189* (54.8%) | 70* (20.3%) | 97* (28.1%) | 96* (27.8%) | 44* (12.8%) | 28* (8.1%) | 10* (14.3%) | 61* (72.6%) | 35* (41.7%) | 31* (36.9%) |
| Subiculum | ||||||||||
| Original data | 85* (47.0%) | 33* (18.2%) | 45* (24.9%) | 37* (20.4%) | 23* (12.7%) | 17* (9.4%) | 4 (8.9%) | 21* (52.5%) | 14* (35.0%) | 6* (15.0%) |
| + Head direction | 70* (38.7%) | 32* (17.7%) | 39* (21.5%) | 36* (19.9%) | 22* (12.2%) | 19* (10.5%) | 3 (6.7%) | 10* (25.0%) | 12* (30.0%) | 6* (15.0%) |
We repeated the same regression analyses (Eqs. 10–12), but with the horizontal and vertical components of mean head direction included in the regression models. The table shows the numbers (and percentages) of place fields (individual place fields on the central stem and MPFs for the rest of the behavioral stages) that significantly modulated their activity according to the variables of interest in each regression model. The results of the original analysis are also shown for comparison.
*p < 0.05 (above-chance level; binomial test).
Neural signals for action value and chosen value were also estimated using multiple linear regression analyses. The neural data on the central stem (before behavioral manifestation of the animal's goal choice) were analyzed with the following regression model:
where QL(t) and QR(t) denote the action values for the leftward and rightward goal choices, respectively, and Qc(t) is the chosen value in trial t [the value of chosen action in a given trial; i.e., QL(t) in left-choice trials and QR(t) in right-choice trials]. For the analysis of neural data in the goal stage (after choice outcome is revealed), the animal's current goal choice, its outcome, and their interaction were added to Equation 11 as follows:
For the analysis of neural data within individual place fields (instead of MPFs) that were located in the goal stage, the following regression model was used without the choice term:
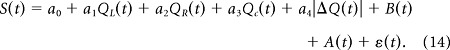
The neural data on the central stem were additionally analyzed with the following regression model to examine their dependence on the absolute difference in action values (|ΔQ(t)| = |QL(t) − QR(t)|) as a measure of goal conflict (Gray and McNaughton, 2000):
 |
The following regression models were used to determine whether neuronal activity of those MPFs in the goal stage is more correlated with RPE or updated chosen value [Qc(t +1)]:
where RPE = R(t) − Qc(t) and Qc(t +1) = Qc(t) + αRPE (α is the learning constant, which was determined separately for each animal).
Identification of sharp wave ripple events.
Sharp wave ripple (SWR) events were identified based on local field potentials that were recorded through one channel of each tetrode as described previously (Frank et al., 2000; Kjelstrup et al., 2008). Briefly, local field potential data were bandpass filtered (150–250 Hz), subjected to Hilbert transformation to determine the SWR envelope, and then smoothed with a Gaussian kernel (σ = 4 ms). SWR events were defined as the time periods during which the smoothed envelope stayed above 3 SD of the mean for at least 15 ms on at least one tetrode. Successive SWR events that were <100 ms apart were considered as a single event, and 20 ms were added to the beginning and end of each SWR event. The identified SWR periods (1457 ± 1022 events per session, mean ± SD) were removed and then the regression analysis examining choice- and outcome-related neural activity (Eq. 10) was applied to the resulting neural data.
Statistical analysis
Statistical significance of a regression coefficient was determined using a t test, and significance of the fraction of neurons (or place fields) for a given variable was determined with a binomial test. Significance of a difference between the expected and the observed numbers of neurons (or place fields) was determined with a χ2 test. Fisher's exact test was used instead of a χ2 test, however, whenever the expected number was equal to or less than five. A p value <0.05 was used as the criterion for a significant statistical difference unless noted otherwise. Data are expressed as mean ± SEM unless noted otherwise.
Results
Behavior
The animals quickly responded to changes in relative reward probabilities and altered their choice strategy accordingly after each block transition (Fig. 3A), so that the animal's choice behavior during the steady state (last 20 trials in each block) was consistent with the generalized matching law (Baum, 1974) (Fig. 3B). A logistic regression analysis revealed that a reward delivered at a particular goal biased the animal to repeat the same goal choice in subsequent trials (Fig. 3C), indicating that the animal's choice behavior was dependent on the history of previous choices and their outcomes. Consistent with these results, the animal's choice behavior was well described by the RL model (Fig. 3A), suggesting that the animals made their trial-by-trial goal choices based on action values computed from the history of previous choices and their outcomes.
Figure 3.

Behavioral performance. A, An example of the animal's choice behavior in a single behavioral session. Tick marks denote trial-by-trial choices of the animal (top, left choice; bottom, right choice; long, rewarded trial; short, unrewarded trial). Block transitions are marked by vertical lines. Numbers on top indicate reward probabilities associated with left and right goal choices in each block. The probability of choosing the left goal (PL) is plotted (moving average of 10 trials) across four blocks of trials (gray line). The black line shows the probability of choosing the left goal predicted by the RL model. B, The relationship between log choice ratio (ordinate) and log reinforcement ratio (abscissa). Steady-state behavioral data (last 20 trials in each block) were fit to the logarithmic form of the generalized matching law (solid line) for each animal. Each data point represents one block of trials. There was a significant positive relationship between log choice ratio and log reinforcement ratio in all animals (p < 0.001 in all animals). C, Regression coefficients from a logistic regression model showing the effects of past rewards (up to 10 trials) on the animal's current goal choice (error bars indicate SEs of coefficient estimates). All animals tended to make the same choice that was rewarded in recent trials, as indicated by positive coefficients. D, Distributions of normalized negative log likelihood of the RL model (orange circles, right y-axis) and the model's prediction of the animal's actual choices (percentage correct; gray circles, left y-axis) in individual sessions are shown for the animals used for CA1 and subicular recordings. Open circles denote individual sessions, and red filled circles indicate the session shown in A. Black filled circles and error bars represent the mean and SEM. E–G, Mean percentages of choosing the goal with the higher reward probability (E) and using win–stay (F) or lose–switch (G) strategies for the animals used for CA1 and subicular recordings. H, I, Choice bias (percentage of the choice for a preferential goal in a given session; H) and mean trial durations (I) for the animals used for CA1 and subicular recordings.
Mean values for normalized negative likelihood of the RL model were 0.47 ± 0.01 and 0.43 ± 0.02 per session for the animals used for CA1 (n = 5) and subicular (n = 3) recordings, respectively, which were not significantly different from each other (Wilcoxon rank-sum test, p = 0.170); the model's predictions of the animal's actual choices based on leave-one-out cross-validation procedure were 77.1 ± 0.9 and 79.1 ± 1.3% correct per session for the animals used for CA1 and subicular recordings, respectively, which were not significantly different from each other either (p = 0.198; Fig. 3D). Likewise, no significant difference was found between the animals used for CA1 and subicular recordings in the mean percentages of trials in which the animal chose the goal with the higher reward probability (p = 1.000) or made its choice using the win–stay (p = 0.786) or lose–switch strategy (p = 0.143; Fig. 3E–G). Choice bias (percentage of the choice for a preferential goal in a given session) and mean trial duration were also similar between the two groups of animals (p = 1.000 and 0.250, respectively; Fig. 3H,I). Thus, no significant difference was found in the behavioral performance between the two groups of animals.
Spatial firing characteristics
We recorded activity of 325 and 115 putative pyramidal cells from the dorsal CA1 and dorsal subiculum, respectively (Figs. 1B, 2). Their mean discharge rates were 1.06 ± 0.05 and 1.93 ± 0.12 Hz on the maze, respectively, and this difference was statistically significant (Wilcoxon rank-sum test; p < 0.001). As reported previously for CA1 (O'Keefe and Dostrovsky, 1971; O'Keefe and Nadel, 1978) and subiculum (Sharp and Green, 1994), the recorded neurons showed spatially selective firing on the maze. A total of 264 CA1 (81.2%) and 99 subicular (86.1%) neurons had at least one place field on the linearized maze. Of these, 86 CA1 (32.6%) and 77 subicular (77.8%) neurons had multiple place fields (Fig. 4). Consistent with previous findings (Barnes et al., 1990; Sharp and Green, 1994), CA1 neurons showed more focused spatial firing than subicular neurons, as reflected by higher spatial information content per spike, smaller field size, and higher infield/outfield firing ratio (Table 1).
Table 1.
Spatial firing characteristics of CA1 and subicular neurons
| CA1 | Subiculum | p value | |
|---|---|---|---|
| Number of place fields | 1.13 ± 0.04 | 2.02 ± 0.12 | <0.001 |
| Place field size (pixels) | 9.23 ± 0.21 | 11.62 ± 0.69 | <0.001 |
| Infield firing rate (Hz) | 5.68 ± 0.28 | 4.94 ± 0.36 | 0.466 |
| Outfield firing rate (Hz) | 0.71 ± 0.04 | 1.43 ± 0.08 | <0.001 |
| Infield/outfield firing ratio | 12.68 ± 0.84 | 4.13 ± 0.32 | <0.001 |
| Spatial information content (bits/spike) | 4.32 ± 0.21 | 3.05 ± 0.20 | <0.001 |
Spatial firing of CA1 and subicular putative pyramidal cells was compared using various indices (mean ± SEM). The last column shows results of statistical comparisons between CA1 and subiculum (Wilcoxon rank-sum test).
Neural activity related to choice and outcome
We analyzed neural activity related to the animal's choice and its outcome and action value in both spatial and temporal domains. Because place-specific firing is a strong characteristic of CA1 (O'Keefe and Dostrovsky, 1971; O'Keefe and Nadel, 1978) and subicular (Sharp and Green, 1994) neurons, we analyzed spike data within each place field (analysis in the spatial domain). In addition, to examine temporal dynamics of valuation-related neural activity, we analyzed neural activity within fixed time windows (analysis in the temporal domain). For the analysis in the spatial domain, those place fields located on either side of the maze (approach, goal, and return stages) were merged with those in the corresponding bins on the opposite side to form MPFs (see Materials and Methods; Fig. 4A) so that neural activity related to the animal's goal choice and other variables can be analyzed together using a multiple regression model.
Of all analyzed place fields (CA1, 70 individual fields on the central stem, 275 MPFs; subiculum, 45 individual fields on the central stem, 136 MPFs), significant fractions conveyed neural signals for the animal's goal choice [C(t), CA1, n = 239, 69.3%, binomial test against the chance level of p = 0.05, p < 0.001; subiculum, n = 85, 47.0%, p < 0.001], its outcome [i.e., reward; R(t), CA1, n = 77, 22.3%, p < 0.001; subiculum, n = 33, 18.2%, p < 0.001], or their interaction [X(t), CA1, n = 94, 27.2%, p < 0.001; subiculum, n = 45, 24.9%, p < 0.001] in the current trial (Eq. 10; Fig. 5A,B). Also, significant fractions conveyed neural signals for the animal's goal choice in the previous trial [C(t − 1), CA1, n = 100, 29.0%, p < 0.001; subiculum, n = 37, 20.4%, p < 0.001], its outcome [R(t − 1), CA1, n = 46, 13.3%, p < 0.001; subiculum, n = 23, 12.7%, p < 0.001], or their interaction [X(t − 1), CA1, n = 29, 8.4%, p = 0.004; subiculum, n = 17, 9.4%, p = 0.009; Eq. 10; Fig. 5C]. Similar results were obtained when the data were analyzed after excluding SWR periods (Table 2), during which sequential reactivation was observed (Carr et al., 2011), indicating that neural signals for the previous choice and its outcome did not result from sequential reactivation occurring during sleep or immobile states. Of those CA1 MPFs encoding choice signals (n = 230), 119 and 111 fired at higher rates at the ipsilateral and contralateral sides to the recorded hemisphere, respectively, which was not significantly different from the even split (χ2 test, p = 0.598). Similarly, of those subicular MPFs encoding choice signals (n = 81), 43 and 38 fired at higher rates at the ipsilateral and contralateral sides of the recorded hemisphere, respectively, which was also not significantly different from the even split (χ2 test, p = 0.579).
Figure 5.
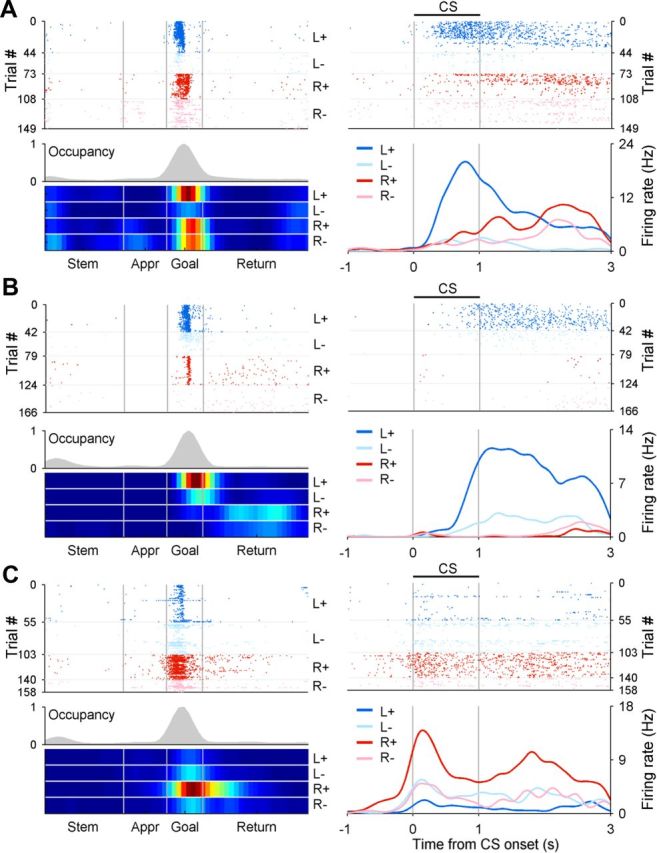
Neuronal activity related to the animal's goal choice and its outcome in the current and previous trials. A–C, Example neurons that modulated their activity according to the combination of the animal's goal choice and its outcome in the current (A, CS period; B, reward period; CA1 neurons) or previous trial (C, subicular neuron). Left, A spatial spike raster plot and trial type-specific spatial firing rate maps along with overall occupancy time (gray histogram) for each neuron (neural activity in the spatial domain). Right, A spike raster plot and trial type-specific spike density functions (computed using a Gaussian kernel with σ = 100 ms) for the same neuron (neural activity in the temporal domain). Trials were grouped according to the animal's goal choice (L, left goal; R, right goal) and its outcome (+, rewarded; −, unrewarded) in the current (A, B) or previous (C) trial. Appr, Approach.
Table 2.
Neural signals for the animal's goal choice and its outcome in the current and previous trial outside SWR events
| C(t) | R(t) | X(t) | C(t − 1) | R(t − 1) | X(t − 1) | |
|---|---|---|---|---|---|---|
| CA1 | ||||||
| Original data | 239* (69.3%) | 77* (22.3%) | 94* (27.2%) | 100* (29.0%) | 46* (13.3%) | 29* (8.4%) |
| SWR excluded | 239* (69.3%) | 75* (21.7%) | 94* (27.2%) | 104* (30.1%) | 46* (13.3%) | 27* (7.8%) |
| Subiculum | ||||||
| Original data | 85* (47.0%) | 33* (18.2%) | 45* (24.9%) | 37* (20.4%) | 23* (12.7%) | 17* (9.4%) |
| SWR excluded | 88* (48.6%) | 31* (17.1%) | 44* (24.3%) | 36* (19.9%) | 23* (12.7%) | 17* (9.4%) |
Shown are the numbers (and percentages) of place fields that significantly modulated their activity according to the animal's goal choice, its outcome, or their interaction in the current and previous trials. Total 345 CA1 place fields (70 individual fields on the central stem and 275 MPFs) and 181 subicular place fields (45 individual fields on the central stem and 136 MPFs) were analyzed. The results of the original analysis are also shown for comparison.
*p < 0.05 (above-chance level; binomial test).
In our task, the arrival of the animal at either goal triggered an auditory tone signaling the availability of reward for 1 s (CS period) before the actual reward was delivered (reward period), so that the onset of the CS period corresponds to the beginning of the goal stage (Fig. 1A). We therefore examined neuronal activity related to the current choice outcome [R(t)] separately for the CS and reward period (first 1 s each). For the analysis of the reward period, those trials in which its duration was <1 s (20.2% of the total trials) were excluded. Of all MPFs whose centers were located within the goal stage (CA1, n = 84; subiculum, n = 40; Fig. 4), substantial fractions conveyed significant choice outcome signals during the CS period (CA1, n = 21, 25.0%, binomial test, p < 0.001; subiculum, n = 14, 35.0%, p < 0.001), indicating that CA1 and subicular neurons responded significantly to the choice outcome even when it was signaled by a CS before the actual reward delivery (Fig. 5A). Overlapping, but different groups of cells showed significant responses to the choice outcome during the first 1 s of the reward period (CA1, n = 37, 44.0%, p < 0.001; subiculum, n = 17, 42.5%, p < 0.001; Fig. 5B). There was a significant tendency for the neurons encoding choice outcome during the CS period to encode choice outcome during the first 1 s of the reward period as well in CA1 (χ2 test, p < 0.001), but not in the subiculum (p = 0.481). Consistent with the previous findings in the striatum (Roitman et al., 2005; Ito and Doya, 2009; Kim et al. 2009), there was a significant tendency for choice outcome-encoding CA1 neurons to decrease their activity in rewarded trials. During the CS period, 7 and 14 CA1 neurons showed significantly higher and lower activity in rewarded trials, respectively, and this difference was not significant (χ2 test, p = 0.127). In contrast, during the first 1 s of the reward period, the numbers of CA1 neurons with significantly higher and lower activity in the rewarded trials were 6 and 31, respectively, and this difference was statistically significant (p < 0.001). The neurons in the subiculum did not show a significant tendency to increase or decrease their activity in either time period (activity increasing vs decreasing neurons, CS period, 8 and 6, respectively; p = 0.593; first 1 s of the reward period, 8 and 9, respectively; p = 0.808).
Neural activity related to action value
For the analysis of value-related neural activity, we first examined whether the recorded neurons significantly modulated their activity according to the action value for the leftward or rightward goal choice [QL(t) and QR(t), respectively] before the animal's goal choice. Of all place fields whose centers were located within the stem stage (CA1, n = 70; subiculum, n = 45; Fig. 4), which approximately corresponds to the time period before the animal revealed its goal choice behaviorally, a significant fraction modulated their activity according to at least one action value [QL(t) or QR(t); p < 0.025; α = 0.05 was corrected for multiple comparisons; Eq. 11] in CA1 (n = 10, 14.3%, binomial test, p = 0.003; Fig. 6A), but not in the subiculum (n = 4, 8.9%, p = 0.187), although this difference was not statistically significant (χ2 test, p = 0.388). There was no significant tendency for action value-encoding CA1 neurons to increase or decrease their firing rates according to action value (activity increasing vs decreasing neurons, 8 and 2, respectively; Fisher's exact test, p = 0.109) or to preferentially encode action value of the goal choice ipsilateral or contralateral to the recorded hemisphere (ipsilateral vs contralateral action value, 5 and 5, respectively; Fisher's exact test, p = 1.000). Similar results were obtained when the same analysis was repeated using neural data within a fixed time window regardless of place-specific firing. Of all putative pyramidal cells with mean firing rate >1 Hz during the last 1 s of the delay period (81 CA1 and 70 subicular neurons; 2 s delay was imposed on the central stem in every trial), a significant fraction modulated their activity according to at least one action value in CA1 (n = 17, 21.0%, binomial test, p < 0.001), but not in the subiculum (n = 6, 8.6%, p = 0.137), and this difference was statistically significant (χ2 test, p = 0.034). Again, there was no significant tendency for action value-encoding CA1 neurons to increase or decrease their firing rates according to action value (activity increasing vs decreasing neurons, 12 and 5, respectively; χ2 test, p = 0.090) or to encode action value of the goal choice ipsilateral or contralateral to the recorded hemisphere (ipsilateral vs contralateral action value, 9 and 8, respectively; p = 0.808).
Figure 6.

Value-related neuronal activity. A, An example CA1 neuron encoding the action value for the leftward choice [QL(t)] on the central stem. B, An example CA1 neuron encoding chosen value [Qc(t)] at the goal. A spatial spike raster plot and spatial firing rate maps are shown for each neuron in the same format as in Figure 3. Trials were grouped into quartiles of action or chosen value (0–1; steps of 0.25) as indicated by different colors. Appr, Approach.
Because the hippocampal formation has been implicated in processing goal conflict (Gray and McNaughton, 2000), we examined whether CA1 and subicular neurons modulated their activity according to the magnitude of value difference between the two options [|ΔQ(t)| = |QL(t) − QR(t)|; Eq. 14]. Of all place fields located within the stem stage (CA1, n = 70; subiculum, n = 45), a significant fraction modulated their activity according to |ΔQ(t)| in CA1 (n = 8, 11.4%, binomial test, p = 0.023), but not in the subiculum (n = 1, 2.3%, p = 0.901), and this difference between CA1 and subiculum was not significant (Fisher's exact test, p = 0.088). Also, of all putative pyramidal cells with mean firing rate >1 Hz during the last 1 s of the delay period (81 CA1 and 70 subicular neurons), significant fractions modulated their activity according to |ΔQ(t)| in CA1 (n = 12, 14.8%, p < 0.001) as well as the subiculum (n = 8, 11.4%, p = 0.023), which were not significantly different from each other (χ2 test, p = 0.540). These results are consistent with a theory postulating a prominent role of the hippocampal formation in processing goal conflict (Gray and McNaughton, 2000).
Convergence of choice, outcome, and chosen value signals in CA1
We then examined whether neural signals necessary to evaluate the choice outcome, namely, neural signals for the animal's goal choice, its outcome, and chosen value [Qc(t), the value of chosen action in a given trial], converged when the choice outcome was revealed at the goal. Of 84 CA1 and 40 subicular MPFs whose centers were located within the goal stage, significant fractions modulated their activity according to the animal's current goal choice (Eq. 12; CA1, n = 73, 86.9%, binomial test, p < 0.001; subiculum, n = 21, 52.5%, p < 0.001), its outcome (CA1, n = 36, 42.9%, p < 0.001; subiculum, n = 14, 35.0%, p < 0.001), or chosen value (CA1, n = 29, 34.5%, p < 0.001; subiculum, n = 6, 15.0%, p = 0.014; Fig. 6B). There was no significant tendency for chosen value-encoding neurons to increase (n = 15 and 4 for CA1 and subiculum, respectively) or decrease (n = 14 and 2, respectively) their firing rates according to chosen value (Fisher's exact test, p = 1.000 and 0.688, respectively). Although all three signals were significant in both brain structures, the signals for the animal's goal choice and chosen value were significantly stronger in CA1 than in the subiculum (χ2 test, p < 0.001 and p = 0.024, respectively). Pairwise analyses of contingency tables revealed a significant tendency for current choice-encoding CA1 neurons to additionally encode current choice outcome and chosen value more frequently than expected when those signals are independently combined (Fisher's exact test, p = 0.020 and 0.013, respectively; all other comparisons, p > 0.05).
Previous studies in the frontal cortex and striatum have shown that these three types of neural signals temporally overlap immediately (within ∼1 s) after the outcome of the animal's goal choice is revealed (Kim et al., 2009; Sul et al., 2010, 2011). We therefore examined temporal profiles of these neural signals around the time of CS onset using the same sets of neurons (84 CA1 and 40 subicular neurons with MPFs in the goal stage; Fig. 7A). Neural signals for the animal's goal choice were strong after the onset of the approach stage and throughout the goal stage. Chosen value signals began to rise ∼1 s before the CS onset in CA1, indicating that expected reward signals emerged in CA1 before the choice outcome was revealed. The chosen value signals further increased during the CS period and then subsided gradually during the reward period, and choice outcome signals arose rapidly after the CS onset, so that neural signals for the animal's goal choice, its outcome, and chosen value coexisted during the CS and early reward period in CA1 (Fig. 7A).
Compared to CA1, chosen value signals were substantially weaker in the subiculum (Fig. 7A). Analyzing the neural data around the CS onset (±1 s from the CS onset; Fig. 7A), we found that the fraction of neurons conveying chosen value signals was significant in CA1 (n = 28 of 84, 33.3%, binomial test, p < 0.001), but not in the subiculum (n = 3 of 40, 7.5%, p = 0.323; Eq. 12), and this difference was statistically significant (χ2 test, p = 0.002). Current goal choice signals were also significantly weaker in the subiculum than in CA1 (45.0 and 70.2%, respectively; p = 0.007). Similar results were obtained when the neurons were selected based on their mean discharge rates around the time of CS onset rather than place-specific firing. When all putative pyramidal neurons with mean firing rates >1 Hz during the 2 s period centered around the CS onset (141 CA1 and 84 subicular neurons) were analyzed, a significantly larger fraction of CA1 neurons conveyed chosen value signals than subicular neurons (29.8 vs 11.9%, respectively; χ2 test, p = 0.002). The difference in the proportion of neurons encoding current choice signals in CA1 and subiculum (76.6 vs 36.9%, respectively) was also significant (p < 0.001). Thus, it is unlikely that the difference in the strength of chosen value signals arose from different discharge characteristics of CA1 and subicular place fields.
The above results indicate that all the signals necessary to evaluate the outcome of the animal's choice in reference to previous experiences converged in CA1 immediately after the outcome of a goal choice was revealed, whereas chosen value signals were significantly weaker in the subiculum. We performed the following additional analyses to exclude several alternative explanations. First, we analyzed individual place fields in the goal stage separately without merging them with the neural data in the corresponding bins at the opposite goal (93 CA1 and 60 subicular place fields) using the regression model without the choice term (Eq. 13). The number of analyzed trials per session was approximately halved in this analysis, so the statistical power was reduced. As a result, the fractions of significant place fields encoding choice outcome or chosen value were lower and more variable compared to the original analysis, especially for the subiculum for which the number of analyzed place fields was smaller. Nevertheless, the temporal profiles of choice outcome and chosen value signals (Fig. 7B) were, overall, similar to those obtained with the original analysis (Fig. 7A). Therefore, the difference between CA1 and subiculum is unlikely due to the use of MPFs in the analysis. Second, we examined the possibility that trial-by-trial variations in the animal's head direction contributed to the observed chosen value signals in CA1. For this, we added the regressors related to the animal's head direction (see Materials and Methods) and reanalyzed activity of those neurons with MPFs in the goal stage (CA1, 84; subiculum, 40) as in the original analysis. Adding the animal's head direction to the regression model (Eq. 12) substantially reduced the proportion of neurons displaying the statistically significant effects of the animal's choice on their activity (before CS onset; Fig. 7C). This was expected, since these two variables are highly correlated. In contrast, the proportion of neurons with value signals was largely unaffected. This was also the case for the other regression analyses; adding head direction had little effect on the results except for weakening current choice signals (Table 3). Third, to test the possibility that our classification of putative pyramidal cells (low-rate, high-bursting units; Fig. 2) might have biased the results, we included those neurons with low firing rates and small burst index values (7 CA1 and 13 subicular neurons that had MPFs in the goal stage) in the analysis. This analysis also yielded similar results (Fig. 7D). Collectively, these additional analyses corroborated the finding that neural signals for the animal's goal choice, its outcome, and chosen value coexisted in CA1 immediately after the choice outcome was revealed, whereas chosen value signals were substantially weaker in the subiculum.
Reward prediction error and updated chosen value
We showed previously that neural signals for chosen value and choice outcome are combined differently across neurons in various regions of the corticobasal ganglia loop to compute RPE or update chosen value immediately (within ∼1 s) after the choice outcome was revealed (Kim et al., 2009; Sul et al., 2010, 2011). These results provided evidence for active involvement of multiple brain structures in the evaluation of choice outcomes in reference to previous experiences. Thus, if CA1 is actively involved in the evaluation of choice outcomes rather than simply transmitting results of the evaluation performed elsewhere, both RPE and updated value signals are expected to be found in CA1. We therefore examined neuronal activity related to RPE and updated chosen value [Qc(t + 1)] during the CS period (1 s) for all CA1 neurons with an MPF in the goal stage (n = 84). Because RPE and updated chosen value are computed by the difference between and weighted sum of choice outcome and chosen value, respectively [i.e., RPE = R(t) − Qc(t) and Qc(t + 1) = (1 − α)Qc(t) + αR(t), where α is the learning rate, and 0 < α < 1] (Sutton and Barto, 1998), activity of those neurons with the opposite signs of the coefficients for chosen value and choice outcome would be modulated by RPE. Conversely, activity of those with the same signs of their coefficients is expected to modulate their activity according to updated chosen value. Accordingly, we examined the distribution of signs of the coefficients for chosen value and choice outcome, and tested whether neuronal activity is better explained by the model containing RPE (Eq. 15) or updated chosen value (Eq. 16). Figure 8 shows the relationship between the standardized regression coefficients for choice outcome and chosen value. There were 42 CA1 neurons encoding choice outcome and/or chosen value during the CS period (colored circles). As expected, activity was better explained by the model containing updated chosen value (Fig. 8, blue) in 27 among 29 neurons that showed the same signs in their coefficients for choice outcome and chosen value. In contrast, activity was usually better explained by the model containing RPE (Fig. 8, red) when the neurons had the opposite signs for these two coefficients (10 of 13 neurons). These results suggest that choice outcome and chosen value signals are combined to compute RPE as well as to update chosen value in CA1.
Figure 8.

Relationship between neural signals related to chosen value and choice outcome in CA1. Neuronal activity during the CS period (1 s) was analyzed for all CA1 neurons with an MPF in the goal stage (n = 84). The graphs show standardized regression coefficients (SRCs) for choice outcome (abscissa) and chosen value (ordinate) in the current trial. Saturated colors indicate those neurons encoding both choice outcome and chosen value, and light colors indicate those that encoded either choice outcome or chosen value during the CS period (Eq. 12). The remaining neurons are indicated in gray. Red and blue symbols indicate those neurons whose activity was better explained (according to R2) by the model containing RPE (Eq. 15) or updated chosen value [Qc(t + 1); Eq. 16], respectively.
Discussion
We examined value-related neuronal activity in the dorsal CA1 and dorsal subiculum in rats performing a dynamic foraging task. Both CA1 and subiculum conveyed conjunctive neural signals for the animal's goal choice and its outcome in the current as well as previous trials, indicating that they signaled consequences of specific goal choices over multiple trials (cf. Eichenbaum et al., 1987). Thus, ingredient neural signals to compute values based on past experiences were available in both structures. On the other hand, whereas CA1 conveyed robust signals necessary to evaluate the outcome of an experienced event, value-related signals were significantly weaker in the subiculum.
Value signals in the hippocampus
So far, few studies have investigated hippocampal neural activity related to quantitative aspects of reward. Using probabilistic reward delivery and RL model-based analysis, we were able to demonstrate neural signals related to action value before the animal's goal choice (on the central stem) and chosen value after the choice outcome was revealed (at the goal) in CA1. Importantly, significant chosen value signals were detected with the choice outcome (i.e., reward) included in the regression model (Eq. 12), indicating that they are different from signals merely related to reward. Moreover, value signals were regionally specific (largely absent in the subiculum) and robust, as confirmed by the analyses in both spatial and temporal domains, by using different methods to define place fields and also by controlling for the effects of potential confounding behavioral variables, making it unlikely that they merely reflected spurious correlation of neural activity with some other variables. Finally, strengths of action value and chosen value signals found in CA1 were comparable to those found in other brain structures well known to be involved in value processing (striatum and frontal cortex) (Kim et al., 2009; Sul et al., 2010, 2011). These results provide converging evidence for significant value signals in CA1.
CA1 neurons carried significant signals related to action values before the animal revealed its choice behaviorally, indicating that the information on the expected outcomes from potential choices was available in CA1. Moreover, chosen value signals arose in CA1 as the animal was approaching to the chosen goal, and they temporally overlapped with the signals related to the animal's goal choice and its outcome after the choice outcome was revealed. Therefore, all the signals necessary to evaluate the outcome of an experienced event converged in CA1, and they were combined differently to compute RPE as well as to update the value of chosen action. These findings suggest that CA1 might be actively involved in evaluating event outcomes and keeping track of their expected values rather than passively propagating value signals computed elsewhere. Our results are consistent with the findings of brain imaging studies in humans. Reinforcement signals were found in widespread areas of the human brain including the hippocampus during competitive decision-making tasks (Vickery et al., 2011). Also, successful recollection of previously experienced visual stimuli was correlated with blood oxygen level-dependent (BOLD) signals in the hippocampus and the brain areas known to encode values (ventromedial prefrontal cortex and ventral striatum), suggesting that stimulus-specific reward values are remembered together with the associated stimuli (Kuhl et al., 2010). Moreover, BOLD signals in the hippocampus were correlated with state value (reward prediction in a Markov decision task) (Tanaka et al., 2004) as well as prediction error that was computed with an RL model in probabilistic learning tasks (Dickerson et al., 2011; Foerde and Shohamy, 2011). These and our results raise the possibility that valuation might be an integral part of hippocampal neural processing.
Role of hippocampus in value-based decision making
Value signals found in the hippocampus were qualitatively similar to those identified previously in other brain areas such as the prefrontal cortex and striatum (Kim et al., 2009; Sul et al., 2010), which suggests largely distributed and potentially cooperative computation of values across these brain structures. However, we cannot rule out the possibility that value-related hippocampal neural activity might merely reflect the outputs of interconnected brain regions. Therefore, our results should be interpreted cautiously in formulating the role of the hippocampus in value processing. Nevertheless, our finding of robust value signals in CA1 is also consistent with the possibility that the hippocampus is actively involved in representing action values in a dynamic environment. There also exists evidence that patients with bilateral hippocampal damages are impaired in making decisions adaptively (Gutbrod et al., 2006; Gupta et al., 2009). Thus, although relatively little attention has been paid to the hippocampus in formulating neural mechanisms underlying value-based decision making so far, the hippocampus might be part of core neural systems in charge of value-based decision making. For example, the hippocampus might play an important role in associating value information with event information so that the retrieval of a memory for a previously experienced event will automatically entail the retrieval of its associated value (cf. Kuhl et al., 2010). Also, the hippocampus might be involved in correctly updating values when the delay between an action and its outcome is too long to be bridged by short-term memory [cf. temporal credit assignment problem (Sutton and Barto, 1998)]. Finally, the hippocampus might play an important role in model-based RL, in which values can be updated according to the decision-maker's knowledge or model of the environment (Sutton and Barto, 1998; Daw et al., 2005; Lee et al., 2012). The hippocampus might contribute to model-based RL through its role in encoding episodic and semantic memories (i.e., knowledge on the surrounding world) and also through its role in simulating the possible outcomes of future actions (Hassabis and Maguire, 2007; Johnson and Redish, 2007; Schacter et al., 2007; Luhmann et al., 2008; Buckner, 2010; Peters and Büchel, 2010; Benoit et al., 2011).
Role of CA1 in integrating multiple elements of episodic memory
CA1 neurons conveyed the information about the consequence of a specific goal choice (“what happened where”) in our task, which is consistent with previous studies demonstrating CA1 neuronal activity related to the conjunction of what and where information (for review, see Shapiro et al., 2006; O'Keefe, 2007). Recent studies also found CA1 neuronal activity related to the “when” component of experienced events (Itskov et al., 2011; MacDonald et al., 2011; Naya and Suzuki, 2011), suggesting that CA1 neurons might encode all the elements of episodic (Tulving, 2002) or episodic-like (Clayton and Dickinson, 1998) memory (what, where, and when). Moreover, rewards (see Introduction, above) and aversive stimuli (Segal et al., 1972; Berger et al., 1976, 1983; McEchron and Disterhoft, 1997; Múnera et al., 2001; Moita et al., 2003, 2004) are among the nonspatial factors that have been shown to modulate CA1 neuronal activity, suggesting that affective significance might also influence CA1 activity. Our results further show that CA1 neurons carry quantitative signals for values (how good or bad) estimated from the animal's choice and reward history along with factual information about the current event. Together, these results suggest that CA1 might be a place where all the elements of episodic memory (what, where, and when, as well as affective significance) are integrated.
Role of subiculum in encoding episodic memory
CA1 and subiculum are two major output structures of the hippocampal formation (Witter, 2006), but precise functional roles of the two structures are not well understood. Previous physiological studies have found differences between CA1 and subicular neuronal activity related to spatial information coding (Barnes et al., 1990; Sharp and Green, 1994; Sharp, 1997; Lever et al., 2009) and short-term memory (Hampson and Deadwyler, 2003; Deadwyler and Hampson, 2004). Our results revealed an additional difference between the dorsal CA1 and dorsal subiculum. Despite strong monosynaptic projections from CA1, value signals were only weakly encoded in the dorsal subiculum, suggesting that it plays only a minor role in interpreting choice outcomes in the context of the animal's previous experience. Previous studies have shown that activity of subicular neurons is strongly influenced by physical boundaries of the surrounding environment. When surrounding enclosure of a recording arena is changed (from a cylinder to a square box, for example), subicular spatial firing tends to be maintained relative to physical boundaries (Sharp, 1997; Lever et al., 2009), whereas CA1 spatial firing typically remaps (Muller and Kubie, 1987). Anatomically, the subiculum receives raw associative sensory inputs from perirhinal and postrhinal cortices (Naber et al., 2000). These and our results raise the possibility that the dorsal subiculum plays an important role in transmitting factual information that is bound to the external world (what is out there and what happened), whereas CA1 serves a role of transforming factual information into subjective significance. It remains to be determined, however, whether or not the subiculum is involved in the processing of affective information other than subjective values of experienced events. Currently, empirical studies on the functional role of the subiculum are rare compared to those related to CA1. Clearly, additional studies are needed to reveal specific roles played by the subiculum.
Footnotes
This work was supported by Original Technology Research Program for Brain Science Grant 2011-0019209, National Research Foundation Grant 2011-0015618, and a grant from the Brain Research Center of the 21st Century Frontier Research Program funded by the Ministry of Education, Science and Technology, Korea (M.W.J.), and a 2007 grant from the Department of Medical Sciences, Ajou University Graduate School (H.L.). We thank Inah Lee for helpful comments on the initial manuscript.
References
- Adcock RA, Thangavel A, Whitfield-Gabrieli S, Knutson B, Gabrieli JD. Reward-motivated learning: mesolimbic activation precedes memory formation. Neuron. 2006;50:507–517. doi: 10.1016/j.neuron.2006.03.036. [DOI] [PubMed] [Google Scholar]
- Barnes CA, McNaughton BL, Mizumori SJ, Leonard BW, Lin LH. Comparison of spatial and temporal characteristics of neuronal activity in sequential stages of hippocampal processing. Prog Brain Res. 1990;83:287–300. doi: 10.1016/s0079-6123(08)61257-1. [DOI] [PubMed] [Google Scholar]
- Baum WM. On two types of deviation from the matching law: bias and undermatching. J Exp Anal Behav. 1974;22:231–242. doi: 10.1901/jeab.1974.22-231. [DOI] [PMC free article] [PubMed] [Google Scholar]
- Benoit RG, Gilbert SJ, Burgess PW. A neural mechanism mediating the impact of episodic prospection on farsighted decisions. J Neurosci. 2011;31:6771–6779. doi: 10.1523/JNEUROSCI.6559-10.2011. [DOI] [PMC free article] [PubMed] [Google Scholar]
- Berger TW, Alger B, Thompson RF. Neuronal substrate of classical conditioning in the hippocampus. Science. 1976;192:483–485. doi: 10.1126/science.1257783. [DOI] [PubMed] [Google Scholar]
- Berger TW, Rinaldi PC, Weisz DJ, Thompson RF. Single-unit analysis of different hippocampal cell types during classical conditioning of rabbit nictitating membrane response. J Neurophysiol. 1983;50:1197–1219. doi: 10.1152/jn.1983.50.5.1197. [DOI] [PubMed] [Google Scholar]
- Breese CR, Hampson RE, Deadwyler SA. Hippocampal place cells: stereotypy and plasticity. J Neurosci. 1989;9:1097–1111. doi: 10.1523/JNEUROSCI.09-04-01097.1989. [DOI] [PMC free article] [PubMed] [Google Scholar]
- Buckner RL. The role of the hippocampus in prediction and imagination. Annu Rev Psychol. 2010;61:27–48. doi: 10.1146/annurev.psych.60.110707.163508. [DOI] [PubMed] [Google Scholar]
- Carr MF, Jadhav SP, Frank LM. Hippocampal replay in the awake state: a potential substrate for memory consolidation and retrieval. Nat Neurosci. 2011;14:147–153. doi: 10.1038/nn.2732. [DOI] [PMC free article] [PubMed] [Google Scholar]
- Clayton NS, Dickinson A. Episodic-like memory during cache recovery by scrub jays. Nature. 1998;395:272–274. doi: 10.1038/26216. [DOI] [PubMed] [Google Scholar]
- Daw ND, Niv Y, Dayan P. Uncertainty-based competition between prefrontal and dorsolateral striatal systems for behavioral control. Nat Neurosci. 2005;8:1704–1711. doi: 10.1038/nn1560. [DOI] [PubMed] [Google Scholar]
- Deadwyler SA, Hampson RE. Differential but complementary mnemonic functions of the hippocampus and subiculum. Neuron. 2004;42:465–476. doi: 10.1016/s0896-6273(04)00195-3. [DOI] [PubMed] [Google Scholar]
- Dickerson KC, Li J, Delgado MR. Parallel contributions of distinct human memory systems during probabilistic learning. Neuroimage. 2011;55:266–276. doi: 10.1016/j.neuroimage.2010.10.080. [DOI] [PMC free article] [PubMed] [Google Scholar]
- Eichenbaum H, Kuperstein M, Fagan A, Nagode J. Cue-sampling and goal-approach correlates of hippocampal unit activity in rats performing an odor-discrimination task. J Neurosci. 1987;7:716–732. doi: 10.1523/JNEUROSCI.07-03-00716.1987. [DOI] [PMC free article] [PubMed] [Google Scholar]
- Foerde K, Shohamy D. Feedback timing modulates brain systems for learning in humans. J Neurosci. 2011;31:13157–13167. doi: 10.1523/JNEUROSCI.2701-11.2011. [DOI] [PMC free article] [PubMed] [Google Scholar]
- Frank LM, Brown EN, Wilson M. Trajectory encoding in the hippocampus and entorhinal cortex. Neuron. 2000;27:169–178. doi: 10.1016/s0896-6273(00)00018-0. [DOI] [PubMed] [Google Scholar]
- Gasbarri A, Sulli A, Packard MG. The dopaminergic mesencephalic projections to the hippocampal formation in the rat. Prog Neuropsychopharmacol Biol Psychiatry. 1997;21:1–22. doi: 10.1016/s0278-5846(96)00157-1. [DOI] [PubMed] [Google Scholar]
- Gray JA, McNaughton N. Oxford Psychology Series, No. 33. Oxford, UK: Oxford UP; 2000. The neuropsychology of anxiety: an enquiry into the functions of the septo-hippocampal system, Ed 2. [Google Scholar]
- Gupta R, Duff MC, Denburg NL, Cohen NJ, Bechara A, Tranel D. Declarative memory is critical for sustained advantageous complex decision-making. Neuropsychologia. 2009;47:1686–1693. doi: 10.1016/j.neuropsychologia.2009.02.007. [DOI] [PMC free article] [PubMed] [Google Scholar]
- Gutbrod K, Krouzel C, Hofer H, Müri R, Perrig W, Ptak R. Decision-making in amnesia: do advantageous decisions require conscious knowledge of previous behavioural choices? Neuropsychologia. 2006;44:1315–1324. doi: 10.1016/j.neuropsychologia.2006.01.014. [DOI] [PubMed] [Google Scholar]
- Hampson RE, Deadwyler SA. Temporal firing characteristics and the strategic role of subicular neurons in short-term memory. Hippocampus. 2003;13:529–541. doi: 10.1002/hipo.10119. [DOI] [PubMed] [Google Scholar]
- Hassabis D, Maguire EA. Deconstructing episodic memory with construction. Trends Cogn Sci. 2007;11:299–306. doi: 10.1016/j.tics.2007.05.001. [DOI] [PubMed] [Google Scholar]
- Hollup SA, Molden S, Donnett JG, Moser MB, Moser EI. Accumulation of hippocampal place fields at the goal location in an annular watermaze task. J Neurosci. 2001;21:1635–1644. doi: 10.1523/JNEUROSCI.21-05-01635.2001. [DOI] [PMC free article] [PubMed] [Google Scholar]
- Hölscher C, Jacob W, Mallot HA. Reward modulates neuronal activity in the hippocampus of the rat. Behav Brain Res. 2003;142:181–191. doi: 10.1016/s0166-4328(02)00422-9. [DOI] [PubMed] [Google Scholar]
- Huh N, Jo S, Kim H, Sul JH, Jung MW. Model-based reinforcement learning under concurrent schedules of reinforcement in rodents. Learn Mem. 2009;16:315–323. doi: 10.1101/lm.1295509. [DOI] [PubMed] [Google Scholar]
- Ito M, Doya K. Validation of decision-making models and analysis of decision variables in the rat basal ganglia. J Neurosci. 2009;29:9861–9874. doi: 10.1523/JNEUROSCI.6157-08.2009. [DOI] [PMC free article] [PubMed] [Google Scholar]
- Itskov V, Curto C, Pastalkova E, Buzsáki G. Cell assembly sequences arising from spike threshold adaptation keep track of time in the hippocampus. J Neurosci. 2011;31:2828–2834. doi: 10.1523/JNEUROSCI.3773-10.2011. [DOI] [PMC free article] [PubMed] [Google Scholar]
- Johnson A, Redish AD. Neural ensembles in CA3 transiently encode paths forward of the animal at a decision point. J Neurosci. 2007;27:12176–12189. doi: 10.1523/JNEUROSCI.3761-07.2007. [DOI] [PMC free article] [PubMed] [Google Scholar]
- Kim H, Sul JH, Huh N, Lee D, Jung MW. Role of striatum in updating values of chosen actions. J Neurosci. 2009;29:14701–14712. doi: 10.1523/JNEUROSCI.2728-09.2009. [DOI] [PMC free article] [PubMed] [Google Scholar]
- Kjelstrup KB, Solstad T, Brun VH, Hafting T, Leutgeb S, Witter MP, Moser EI, Moser MB. Finite scale of spatial representation in the hippocampus. Science. 2008;321:140–143. doi: 10.1126/science.1157086. [DOI] [PubMed] [Google Scholar]
- Kobayashi T, Nishijo H, Fukuda M, Bures J, Ono T. Task-dependent representations in rat hippocampal place neurons. J Neurophysiol. 1997;78:597–613. doi: 10.1152/jn.1997.78.2.597. [DOI] [PubMed] [Google Scholar]
- Kuhl BA, Shah AT, DuBrow S, Wagner AD. Resistance to forgetting associated with hippocampus-mediated reactivation during new learning. Nat Neurosci. 2010;13:501–506. doi: 10.1038/nn.2498. [DOI] [PMC free article] [PubMed] [Google Scholar]
- Lee D, Seo H, Jung MW. Neural basis of reinforcement learning and decision making. Annu Rev Neurosci. 2012;35:287–308. doi: 10.1146/annurev-neuro-062111-150512. [DOI] [PMC free article] [PubMed] [Google Scholar]
- Lee JW, Kim WR, Sun W, Jung MW. Role of dentate gyrus in aligning internal spatial map to external landmark. Learn Mem. 2009;16:530–536. doi: 10.1101/lm.1483709. [DOI] [PubMed] [Google Scholar]
- Lever C, Burton S, Jeewajee A, O'Keefe J, Burgess N. Boundary vector cells in the subiculum of the hippocampal formation. J Neurosci. 2009;29:9771–9777. doi: 10.1523/JNEUROSCI.1319-09.2009. [DOI] [PMC free article] [PubMed] [Google Scholar]
- Luhmann CC, Chun MM, Yi DJ, Lee D, Wang XJ. Neural dissociation of delay and uncertainty in intertemporal choice. J Neurosci. 2008;28:14459–14466. doi: 10.1523/JNEUROSCI.5058-08.2008. [DOI] [PMC free article] [PubMed] [Google Scholar]
- MacDonald CJ, Lepage KQ, Eden UT, Eichenbaum H. Hippocampal “time cells” bridge the gap in memory for discontiguous events. Neuron. 2011;71:737–749. doi: 10.1016/j.neuron.2011.07.012. [DOI] [PMC free article] [PubMed] [Google Scholar]
- Martin PD, Ono T. Effects of reward anticipation, reward presentation, and spatial parameters on the firing of single neurons recorded in the subiculum and nucleus accumbens of freely moving rats. Behav Brain Res. 2000;116:23–38. doi: 10.1016/s0166-4328(00)00249-7. [DOI] [PubMed] [Google Scholar]
- McEchron MD, Disterhoft JF. Sequence of single neuron changes in CA1 hippocampus of rabbits during acquisition of trace eyeblink conditioned responses. J Neurophysiol. 1997;78:1030–1044. doi: 10.1152/jn.1997.78.2.1030. [DOI] [PubMed] [Google Scholar]
- Moita MA, Rosis S, Zhou Y, LeDoux JE, Blair HT. Hippocampal place cells acquire location-specific responses to the conditioned stimulus during auditory fear conditioning. Neuron. 2003;37:485–497. doi: 10.1016/s0896-6273(03)00033-3. [DOI] [PubMed] [Google Scholar]
- Moita MA, Rosis S, Zhou Y, LeDoux JE, Blair HT. Putting fear in its place: remapping of hippocampal place cells during fear conditioning. J Neurosci. 2004;24:7015–7023. doi: 10.1523/JNEUROSCI.5492-03.2004. [DOI] [PMC free article] [PubMed] [Google Scholar]
- Muller RU, Kubie JL. The effects of changes in the environment on the spatial firing of hippocampal complex-spike cells. J Neurosci. 1987;7:1951–1968. doi: 10.1523/JNEUROSCI.07-07-01951.1987. [DOI] [PMC free article] [PubMed] [Google Scholar]
- Múnera A, Gruart A, Muñoz MD, Fernández-Mas R, Delgado-García JM. Hippocampal pyramidal cell activity encodes conditioned stimulus predictive value during classical conditioning in alert cats. J Neurophysiol. 2001;86:2571–2582. doi: 10.1152/jn.2001.86.5.2571. [DOI] [PubMed] [Google Scholar]
- Naber PA, Witter MP, Lopes Silva FH. Networks of the hippocampal memory system of the rat. The pivotal role of the subiculum. Ann N Y Acad Sci. 2000;911:392–403. doi: 10.1111/j.1749-6632.2000.tb06739.x. [DOI] [PubMed] [Google Scholar]
- Naya Y, Suzuki WA. Integrating what and when across the primate medial temporal lobe. Science. 2011;333:773–776. doi: 10.1126/science.1206773. [DOI] [PubMed] [Google Scholar]
- O'Keefe J. Hippocampal neurophysiology in the behaving animal. In: Andersen p, Morris R, Amaral D, Bliss T, O'Keefe J., editors. The hippocampus book. Oxford, UK: Oxford UP; 2007. pp. 475–548. [Google Scholar]
- O'Keefe J, Dostrovsky J. The hippocampus as a spatial map. Preliminary evidence from unit activity in the freely-moving rat. Brain Res. 1971;34:171–175. doi: 10.1016/0006-8993(71)90358-1. [DOI] [PubMed] [Google Scholar]
- O'Keefe J, Nadel L. The hippocampus as a cognitive map. Oxford, UK: Clarendon; 1978. [Google Scholar]
- Peters J, Büchel C. Episodic future thinking reduces reward delay discounting through an enhancement of prefrontal-mediotemporal interactions. Neuron. 2010;66:138–148. doi: 10.1016/j.neuron.2010.03.026. [DOI] [PubMed] [Google Scholar]
- Ranck JB., Jr Studies on single neurons in dorsal hippocampal formation and septum in unrestrained rats. I. Behavioral correlates and firing repertoires. Exp Neurol. 1973;41:461–531. doi: 10.1016/0014-4886(73)90290-2. [DOI] [PubMed] [Google Scholar]
- Rescorla R, Wagner A. A theory of Pavlovian conditioning: variations in the effectiveness of reinforcement and nonreinforcement. In: Black A, Prokasy W, editors. Classical conditioning II: current research and theory. New York: Appleton; 1972. pp. 64–99. [Google Scholar]
- Roitman MF, Wheeler RA, Carelli RM. Nucleus accumbens neurons are innately tuned for rewarding and aversive taste stimuli, encode their predictors, and are linked to motor output. Neuron. 2005;45:587–597. doi: 10.1016/j.neuron.2004.12.055. [DOI] [PubMed] [Google Scholar]
- Schacter DL, Addis DR, Buckner RL. Remembering the past to imagine the future: the prospective brain. Nat Rev Neurosci. 2007;8:657–661. doi: 10.1038/nrn2213. [DOI] [PubMed] [Google Scholar]
- Segal M, Disterhoft JF, Olds J. Hippocampal unit activity during classical aversive and appetitive conditioning. Science. 1972;175:792–794. doi: 10.1126/science.175.4023.792. [DOI] [PubMed] [Google Scholar]
- Shapiro ML, Kennedy PJ, Ferbinteanu J. Representing episodes in the mammalian brain. Curr Opin Neurobiol. 2006;16:701–709. doi: 10.1016/j.conb.2006.08.017. [DOI] [PubMed] [Google Scholar]
- Sharp PE. Subicular cells generate similar spatial firing patterns in two geometrically and visually distinctive environments: comparison with hippocampal place cells. Behav Brain Res. 1997;85:71–92. doi: 10.1016/s0166-4328(96)00165-9. [DOI] [PubMed] [Google Scholar]
- Sharp PE, Green C. Spatial correlates of firing patterns of single cells in the subiculum of the freely moving rat. J Neurosci. 1994;14:2339–2356. doi: 10.1523/JNEUROSCI.14-04-02339.1994. [DOI] [PMC free article] [PubMed] [Google Scholar]
- Skaggs WE, McNaughton BL, Gothard KM, Markus EJ. An information-theoretic approach to deciphering the hippocampal code. In: Hanson SJ, Cowan JD, Giles CL, editors. Advances in neural information processing systems. San Mateo, CA: Morgan Kaufmann; 1993. pp. 1030–1037. [Google Scholar]
- Smith DM, Mizumori SJ. Learning-related development of context-specific neuronal responses to places and events: the hippocampal role in context processing. J Neurosci. 2006;26:3154–3163. doi: 10.1523/JNEUROSCI.3234-05.2006. [DOI] [PMC free article] [PubMed] [Google Scholar]
- Song EY, Kim YB, Kim YH, Jung MW. Role of active movement in place-specific firing of hippocampal neurons. Hippocampus. 2005;15:8–17. doi: 10.1002/hipo.20023. [DOI] [PubMed] [Google Scholar]
- Squire LR. Memory and brain. Oxford: Oxford University Press; 1987. [Google Scholar]
- Staff NP, Jung HY, Thiagarajan T, Yao M, Spruston N. Resting and active properties of pyramidal neurons in subiculum and CA1 of rat hippocampus. J Neurophysiol. 2000;84:2398–2408. doi: 10.1152/jn.2000.84.5.2398. [DOI] [PubMed] [Google Scholar]
- Sul JH, Kim H, Huh N, Lee D, Jung MW. Distinct roles of rodent orbitofrontal and medial prefrontal cortex in decision making. Neuron. 2010;66:449–460. doi: 10.1016/j.neuron.2010.03.033. [DOI] [PMC free article] [PubMed] [Google Scholar]
- Sul JH, Jo S, Lee D, Jung MW. Role of rodent secondary motor cortex in value-based action selection. Nat Neurosci. 2011;14:1202–1208. doi: 10.1038/nn.2881. [DOI] [PMC free article] [PubMed] [Google Scholar]
- Sutton RS, Barto AG. Reinforcement learning: an introduction. Cambridge MA: MIT; 1998. [Google Scholar]
- Swanson L, Köhler C, Björklund A. The limbic region. I: The septohippocampal system. In: Björklund A, Hökfelt T, Swanson L, editors. Integrated systems of the CNS. New York: Elsevier; 1987. pp. 125–269. [Google Scholar]
- Tabuchi E, Mulder AB, Wiener SI. Reward value invariant place responses and reward site associated activity in hippocampal neurons of behaving rats. Hippocampus. 2003;13:117–132. doi: 10.1002/hipo.10056. [DOI] [PubMed] [Google Scholar]
- Tanaka SC, Doya K, Okada G, Ueda K, Okamoto Y, Yamawaki S. Prediction of immediate and future rewards differentially recruits cortico-basal ganglia loops. Nat Neurosci. 2004;7:887–893. doi: 10.1038/nn1279. [DOI] [PubMed] [Google Scholar]
- Tulving E. Episodic memory: from mind to brain. Annu Rev Psychol. 2002;53:1–25. doi: 10.1146/annurev.psych.53.100901.135114. [DOI] [PubMed] [Google Scholar]
- Vickery TJ, Chun MM, Lee D. Ubiquity and specificity of reinforcement signals throughout the human brain. Neuron. 2011;72:166–177. doi: 10.1016/j.neuron.2011.08.011. [DOI] [PubMed] [Google Scholar]
- Watanabe T, Niki H. Hippocampal unit activity and delayed response in the monkey. Brain Res. 1985;325:241–254. doi: 10.1016/0006-8993(85)90320-8. [DOI] [PubMed] [Google Scholar]
- Wirth S, Avsar E, Chiu CC, Sharma V, Smith AC, Brown E, Suzuki WA. Trial outcome and associative learning signals in the monkey hippocampus. Neuron. 2009;61:930–940. doi: 10.1016/j.neuron.2009.01.012. [DOI] [PMC free article] [PubMed] [Google Scholar]
- Witter MP. Connections of the subiculum of the rat: topography in relation to columnar and laminar organization. Behav Brain Res. 2006;174:251–264. doi: 10.1016/j.bbr.2006.06.022. [DOI] [PubMed] [Google Scholar]