

Abstract
In the fly Drosophila melanogaster, photoreceptor input to motion vision is split into two parallel pathways as represented by first-order interneurons L1 and L2 (Rister et al., 2007; Joesch et al., 2010). However, how these pathways are functionally specialized remains controversial. One study (Eichner et al., 2011) proposed that the L1-pathway evaluates only sequences of brightness increments (ON-ON), while the L2-pathway processes exclusively brightness decrements (OFF-OFF). Another study (Clark et al., 2011) proposed that each of the two pathways evaluates both ON-ON and OFF-OFF sequences. To decide between these alternatives, we recorded from motion-sensitive neurons in flies in which the output from either L1 or L2 was genetically blocked. We found that blocking L1 abolishes ON-ON responses but leaves OFF-OFF responses intact. The opposite was true, when the output from L2 was blocked. We conclude that the L1 and L2 pathways are functionally specialized to detect ON-ON and OFF-OFF sequences, respectively.
Introduction
The cellular implementation of the insect elementary motion detector has been a long-standing problem in neuroscience. For >50 years after an algorithmic model had been proposed that accurately describes the computations in the insect brain underlying motion vision (Hassenstein and Reichardt, 1956), the neurons performing these computations still have escaped identification due to their small size (for review, see Borst et al., 2010). Anatomical and activity labeling studies suggested that in the fruit fly Drosophila, photoreceptors feed into the motion detection circuit via two first-order interneurons L1 and L2 (Bausenwein and Fischbach, 1992; Bausenwein et al., 1992; Fig. 1a), as could be verified recently by genetic silencing techniques (Rister et al., 2007; Joesch et al., 2010). The two processing streams turned out to be functionally specialized: when blocking L1, responses to moving bright edges were selectively abolished, while blocking L2 strongly impaired responses to moving dark edges (Joesch et al., 2010; Clark et al., 2011). This finding was explained by a simple model in which the visual input is split into a positive (ON)- and negative (OFF)-going component and fed into two parallel pathways, one exclusively dealing with ON, the other with OFF signals (2-detector model; Fig. 1b; Eichner et al., 2011). The ON-pathway starts with L1, while L2 feeds into the OFF-pathway. An alternative model proposed that both pathways process both ON and OFF signals, each one housing an ON-ON and an OFF-OFF detector (Clark et al., 2011). In addition, according to this model, the L1 pathway contains a detector for OFF-ON sequences, and the L2-pathway a detector for ON-OFF sequences (6-detector model, Fig. 1c; Clark et al., 2011).
Figure 1.

Two models proposed for functional specialization of the two motion pathways in Drosophila. a, Schematic of the fly optic lobe. The photoreceptors R1-6 in the retina project to the lamina. Lamina cells L1 and L2 both project to the medulla where they feed into two different pathways. We electrophysiologically recorded the responses of the lobula plate tangential cells (LPTCs) receiving synaptic input from T4 and T5 cells. b, The 2-detector model (Eichner et al., 2011). The visual input (semicircles) is preprocessed by high-pass (HP) filters, adding a residual (DC) component of 10% of the original input. The signals then become half-way rectified and split into an ON (red) and an OFF (blue) signal. In the L1 pathway, only ON and ON signals interact, in the L2 pathway, only OFF and OFF signals interact. In each pathway, a single motion detector multiplies (M) the signals from neighboring photoreceptors after one of them has been delayed by a LP filter. This is done twice in a mirror-symmetrical way. The output signals of both subunits are subtracted (Reichardt, 1987). c, The 6-detector model (Clark et al., 2011). The input is preprocessed by a bandpass (BP) filter and branches into two lines. In one line, the signal is low-pass filtered (LP). The signal in each line is split into an ON (red) and an OFF (blue) component. Each motion detector processes the signals in an identical way as in the 2-detector model. In the L1 pathway as well as in the L2 pathway, there is one ON-ON and one OFF-OFF detector. In addition, the L1 pathway houses an OFF-ON detector, while in the L2 pathway, there is an ON-OFF detector. The outputs of these “mixed” detectors are given twice the amplitude as the ones of the other detectors and are sign-inverted.
To decide between these alternative models and as proposed by Gabbiani and Jones (2011), we applied apparent motion stimuli where the brightness at two neighboring locations was sequentially increased or decreased in discrete steps, separated by a time interval of 1 s (Figs. 2a, 3a). We blocked the synaptic output from either L1 or L2 cells using two different Gal4-lines driving expression of shibire, a dominate-negative, temperature-sensitive allele of the gene encoding the GTPase dynamin involved in vesicle recycling (Kitamoto, 2001). Control experiments were performed on flies that had the same genotype as experimental flies, but were not subject to a temperature shift. To monitor the effect of our manipulation, we recorded the electrical response in large-field tangential cells of the fly lobula plate via whole-cell patch recording (Joesch et al., 2008; Schnell et al., 2010). To obtain quantitative predictions, both models were simulated as an array of modules shown in Figure 1, b and c, covering the stimulated part of the visual field as well as the surround, using the parameters defined in previous reports (Clark et al., 2011; Eichner et al., 2011).
Figure 2.
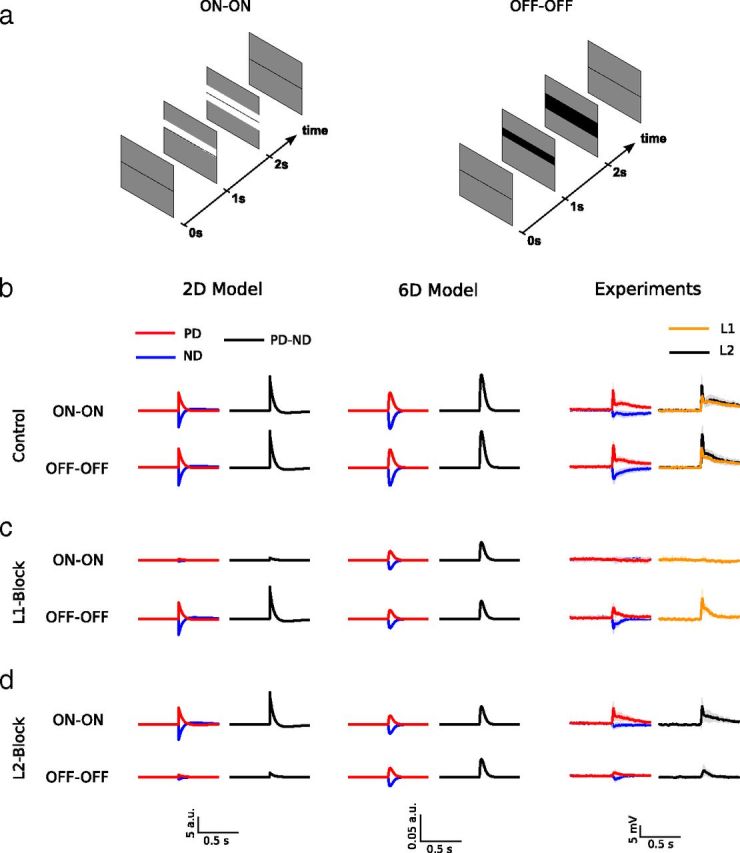
Model responses and experimental results for ON-ON and OFF-OFF sequences. a, ON-ON (left) and OFF-OFF (right) apparent motion stimuli mimicking downward motion. A bright or dark bar appears on a gray screen, followed by a second bright or dark bar in a neighboring location after 1 s. Each stimulus sequence is played in preferred (PD) and null direction (ND). In case of VS cells, the downward direction corresponds to the preferred direction. b, Control conditions. For both models and the experimental data, the temporal response to a PD or ND stimulus is represented as red or blue line, respectively. The difference of the PD and ND response is shown in black. The depicted traces range from 0.5 s before to 0.5 s after the appearance of the second bar. Both models predict positive PD-ND responses. This is also what is seen in the experiments (averaged responses of n = 7 L1 control flies (orange trace, 160 trials total) and n = 6 L2 control flies (black trace, 135 trials total)). For better visibility, we only show the PD and ND responses for L2 control flies (the corresponding responses for the L1 control flies look almost identical). The black line represents the PD-ND response for L2 control flies. The gray shading shows the SD. The PD-ND response for L1 control flies is shown in orange, for clarity, without SD. c, L1 block. The 2-detector model predicts no ON-ON responses, but normal OFF-OFF responses. The 6-detector model predicts equally strong responses to both ON-ON and OFF-OFF sequences of half the amplitude of the ones under control conditions. In L1 block flies, tangential cells do not respond to ON-ON sequences, while their OFF-OFF responses are intact (averaged responses of n = 10 flies, 295 trials total). d, L2 block. The 2-detector model predicts normal ON-ON responses and no OFF-OFF responses. The 6-detector model again predicts equally strong responses to both ON-ON and OFF-OFF sequences with half the amplitude of the ones under control conditions. In L2 block flies, tangential cells show pronounced ON-ON responses but do not respond to OFF-OFF sequences (averaged responses of n = 7 flies, 195 trials total). Shaded areas around experimental data traces in b–d represent the SD.
Figure 3.

Model responses and experimental results for ON-OFF and OFF-ON sequences. a, ON-OFF (left) and OFF-ON (right) apparent motion stimuli played in downward direction. A bright (dark) bar appears on a gray screen, followed by a second dark (bright) bar in a neighboring location after 1 s. b, Control conditions. Both models predict negative PD-ND responses. This is also seen in the experiments (L1 PD-ND control: orange trace. L2 PD-ND control: black trace). c, L1 block. Both models predict intact ON-OFF and strongly reduced OFF-ON responses. This is also observed in L1 block flies. d, L2 block. Both models predict strongly reduced ON-OFF and normal OFF-ON responses. The data obtained in L2 block flies agree with that. All data were obtained from the same flies as used in Fig. 2 with the same number of trials. Shaded areas around experimental data traces in b–d represent the SD.
Materials and Methods
Fly strains and induction of synaptic blockade.
Flies were raised on standard cornmeal-agar medium at a 12 h light/dark cycle, 25°C and 60% humidity. We used female experimental flies, 1 d post-eclosion. The effector strain carried the white-gene with multiple insertions of UAS-shits on the third chromosome. Heterozygous flies were obtained by crossing the respective Gal4-driver and UAS-effector strains. Control and experimental flies had identical genotype and were raised at 18°C (permissive temperature). Experimental flies were shifted for 1 h to 37°C (restrictive temperature) directly before the experiment and recorded at room temperature. No recovery of the block was detected within the time of recording (Joesch et al., 2010). The driver lines had the following genotypes: L1, vGlut-dVP16AD/CyO; ortC2-Gal4DBD/TM3 (Gao et al., 2008); L2, 21D-Gal4 (Rister et al., 2007). There exist further driver lines for both L1 and L2. The lines used for this study were chosen since they show the highest specificity in their expression pattern (see Joesch et al., 2010, their Fig. 1b).
Electrophysiology.
Dissection and patch-clamp recordings were performed from VS- and HS-cells as described previously (Joesch et al., 2008; Schnell et al., 2010). Briefly, flies were anesthetized on ice and waxed on a Plexiglas holder using bee wax. The fly cuticle was opened and the lobula plate exposed by removal of the neurolemma. Somata covered by Ringer solution were approached with a patch electrode filled with a red fluorescent dye (intracellular solution as described by Joesch et al., 2008). Recordings were established under visual control using a 40× water-immersion objective (LumplanF, Olympus), a Zeiss Microscope (Axiotech vario 100, Zeiss), and adapted illumination (100 W fluorescence lamp, hot mirror, neutral density filter OD 0.3, all from Zeiss). To enhance tissue contrast, we used two polarization filters, one located as an excitation filter and the other as an emission filter, with slight deviation of their polarization planes. For eye protection, we additionally used a 420 nm low-pass filter on the light path.
Visual stimulation and data evaluation.
Visual stimuli were delivered using a custom-built light-emitting diode arena (Joesch et al., 2008; Reiser and Dickinson, 2008). Apparent motion stimuli consisted of two bars that sequentially appeared in two adjacent locations on the arena. Bars were presented in the front of the fly's visual field, either oriented horizontally for stimulating VS-cells, or vertically for stimulating HS-cells. They covered the complete arena along one axis and had an extent of 10° along the other axis. The brightness values used for OFF and ON stimuli were 0 cd/m2 and 64 cd/m2, respectively. They started off from an intermediate level of 16 cd/m2 which also applied to the surround luminance. The second bar appeared 1 s after presentation of the first bar. Stimulus sequences were separated by 10 s and delivered along the preferred and the null direction of the cell. To extract the motion-sensitive response component, null direction responses were subtracted from preferred direction responses. All traces in Figures 2 and 3 are shown centered at the second event of the sequence.
Modeling.
An array of 3 motion detection units was modeled (one unit shown in Fig. 1a,b, respectively), receiving input from 4 photoreceptors. The first and the last receptors received brightness input from the surround, while the two center receptors were stimulated by the two bars. Numerical values for the brightness levels were 0.1 (OFF), 0.3 (mean) and 0.5 (ON). The summed output of all 3 units was multiplied by a factor of 1000. Model parameters were identical to the ones previously published: (a) 2-detector model (Eichner et al., 2011), first-order high-pass filter time-constant = 250 ms, motion detector first-order low-pass (LP) filter time-constant = 50 ms; (b) 6-detector model (Clark et al., 2011), first bandpass filter, low-pass time-constant = 25 ms, high-pass time-constant = 25 ms), motion detector first-order LP filter time-constant = 10,000 ms.
Results
With the L1 and L2 pathways intact, both models predict positive responses to ON-ON and OFF-OFF sequences (Fig. 2b, left two columns). In agreement with previous results (Riehle and Franceschini, 1984; Egelhaaf and Borst, 1992; Eichner et al., 2011), this is observed in control flies (Fig. 2b, right column, black trace: L2-driver line, orange trace: L1-driver line). With the output from L1 blocked, the predictions of both models differ significantly. In the 2-detector model, the response to ON-ON sequences is reduced to almost zero while the response to OFF-OFF sequences is unaffected (Fig. 2c, left column). In the 6-detector model, the responses to ON-ON as well as to OFF-OFF sequences are both reduced to 50% of their control value (Fig. 2c, center column). The experimental data reveal a strong and selective reduction of the ON-ON response, while the OFF-OFF response is unaffected (Fig. 2c, right column). Both models also differ when the output from L2 is blocked. The 2-detector model predicts the ON-ON response to be unaffected and the OFF-OFF response to be strongly reduced (Fig. 2d, left column). As was the case for blocking L1, the 6-detector model predicts both the ON-ON as well as the OFF-OFF response to be evenly reduced to 50% of their control value (Fig. 2d, center column). In the experiments, we still observe a pronounced ON-ON response, while the OFF-OFF response is severely reduced (Fig. 2d, right column).
With respect to ON-OFF and OFF-ON sequences, both models agree with each other as well as with the experimental data, both under control conditions and when the L1 or the L2 pathway is blocked (Fig. 3). With both pathways intact, negative responses to ON-OFF and OFF-ON sequences are predicted by both models (Fig. 3b, left two columns). This is also observed in the experiments (Fig. 3b, right column; see also Clark et al., 2011; Eichner et al., 2011). When the output from L1 is blocked, the response of both models to ON-OFF sequences is unaffected, while the OFF-ON response is reduced to zero (Fig. 3c, left two columns). Conversely, when the output from L2 is blocked, the response of both models to ON-OFF sequences is abolished, while the OFF-ON response is unaffected (Fig. 3d, left two columns). Our data (Fig. 3c,d, right column) as well as the ones by Clark et al. (2011) agree with both these predictions.
Discussion
Here we have put forward a decisive dataset that any physiologically plausible model for the insect elementary motion detector has to fulfill. Comparing two previously proposed motion detector models, we found that only the 2-detector model can sufficiently explain the recorded data. This finding strongly suggests that the L1 and L2 pathways in the Drosophila visual system feed into separate ON and OFF channels that have previously been described anatomically (Bausenwein and Fischbach, 1992; Bausenwein et al., 1992).
The results of the present study are based on electrophysiological recordings of lobula plate tangential cells which integrate the outputs of presynaptic local motion detectors. In contrast, the 6-detector model is derived from behavioral experiments (Clark et al., 2011). Compared with behavioral tests (Rister et al., 2007; Clark et al., 2011), an electrophysiological read-out is closer to the circuit under investigation and, therefore, expected to be less contaminated by other processes. For instance, while the responses of lobula plate tangential cells to moving dark edges in L2-blocked flies are severely impaired (Joesch et al., 2010), behaving flies still exhibited a pronounced, although reduced turning response to the same stimuli (Clark et al., 2011), suggesting the presence of either a sensitive nonlinearity at the level of the sensory-motor transformation, or of information from other sensory organs such as the ocelli.
As was recently shown, the L1 and L2 pathways converge on the dendrites of the tangential cells in the lobula plate via T4 and T5 cells (Fig. 1a; Schnell et al., 2012). Interestingly, the single multiplicative interaction of the original model for insect motion vision (Hassenstein and Reichardt, 1956; Reichardt, 1987) is implemented at the cellular level by two separate circuits. In contrast to the usual multiplication, however, only two of the four possible sign combinations of the input signals are taken care of. For the proper function in motion detection, this deficiency has no obvious consequences (Eichner et al., 2011). Our finding about the functional specialization of the L1 and the L2 pathways is important for identifying the further cellular constituents of these pathways: using moving ON or OFF edges and apparent motion stimuli instead of drifting gratings, the specific contribution of a given cell type to the motion detection circuitry in either one of these pathways can now be readily assessed in genetic silencing experiments. Together with the data about the synaptic connectivity from EM studies (Takemura et al., 2011) and the improved selectivity of driver lines (Pfeiffer et al., 2008), this approach promises to reveal the cellular implementation of the elementary motion detector in the fly in upcoming years.
Footnotes
This work was supported by the Max-Planck-Society and the SFB 870 of the Deutsche Forschungsgemeinschaft. We thank F. Gabbiani for carefully reading the manuscript.
The authors declare no competing financial interests.
References
- Bausenwein B, Fischbach KF. Activity labeling patterns in the medulla of Drosophila melanogaster caused by motion stimuli. Cell Tissue Res. 1992;270:25–35. doi: 10.1007/BF00381876. [DOI] [PubMed] [Google Scholar]
- Bausenwein B, Dittrich AP, Fischbach KF. The optic lobe of Drosophila melanogaster. II. Sorting of retinotopic pathways in the medulla. Cell Tissue Res. 1992;267:17–28. doi: 10.1007/BF00318687. [DOI] [PubMed] [Google Scholar]
- Borst A, Haag J, Reiff DF. Fly motion vision. Annu Rev Neurosci. 2010;33:49–70. doi: 10.1146/annurev-neuro-060909-153155. [DOI] [PubMed] [Google Scholar]
- Clark DA, Bursztyn L, Horowitz MA, Schnitzer MJ, Clandinin TR. Defining the computational structure of the motion detector in Drosophila. Neuron. 2011;70:1165–1177. doi: 10.1016/j.neuron.2011.05.023. [DOI] [PMC free article] [PubMed] [Google Scholar]
- Egelhaaf M, Borst A. Are there separate ON and OFF channels in fly motion vision? Vis Neurosci. 1992;8:151–164. doi: 10.1017/s0952523800009317. [DOI] [PubMed] [Google Scholar]
- Eichner H, Joesch M, Schnell B, Reiff DF, Borst A. Internal structure of the fly elementary motion detector. Neuron. 2011;70:1155–1164. doi: 10.1016/j.neuron.2011.03.028. [DOI] [PubMed] [Google Scholar]
- Gabbiani F, Jones PW. A genetic push to understand motion detection. Neuron. 2011;70:1023–1025. doi: 10.1016/j.neuron.2011.06.005. [DOI] [PubMed] [Google Scholar]
- Gao S, Takemura SY, Ting CY, Huang S, Lu Z, Luan H, Rister J, Thum AS, Yang M, Hong ST, Wang JW, Odenwald WF, White BH, Meinertzhagen IA, Lee CH. The neural substrate of spectral preference in Drosophila. Neuron. 2008;60:328–342. doi: 10.1016/j.neuron.2008.08.010. [DOI] [PMC free article] [PubMed] [Google Scholar]
- Hassenstein B, Reichardt W. Systemtheoretische Analyse der Zeit, Reihenfolgen und Vorzeichenauswertung bei der Bewegungsperzeption des Ruesselkaefers Chlorophanus. Z Naturforsch. 1956;11b:513–524. [Google Scholar]
- Joesch M, Plett J, Borst A, Reiff DF. Response properties of motion-sensitive visual interneurons in the lobula plate of Drosophila melanogaster. Curr Biol. 2008;18:368–374. doi: 10.1016/j.cub.2008.02.022. [DOI] [PubMed] [Google Scholar]
- Joesch M, Schnell B, Raghu SV, Reiff DF, Borst A. ON and OFF pathways in Drosophila motion vision. Nature. 2010;468:300–304. doi: 10.1038/nature09545. [DOI] [PubMed] [Google Scholar]
- Kitamoto T. Conditional modification of behavior in Drosophila by targeted expression of a temperature-sensitive shibire allele in defined neurons. J Neurobiol. 2001;47:81–92. doi: 10.1002/neu.1018. [DOI] [PubMed] [Google Scholar]
- Pfeiffer BD, Jenett A, Hammonds AS, Ngo TT, Misra S, Murphy C, Scully A, Carlson JW, Wan KH, Laverty TR, Mungall C, Svirskas R, Kadonaga JT, Doe CQ, Eisen MB, Celniker SE, Rubin GM. Tools for neuroanatomy and neurogenetics in Drosophila. Proc Natl Acad Sci U S A. 2008;105:9715–9720. doi: 10.1073/pnas.0803697105. [DOI] [PMC free article] [PubMed] [Google Scholar]
- Reichardt W. Evaluation of optical motion information by movement detectors. J Comp Physiol A Neuroethol Sens Neural Behav Physiol. 1987;161:533–547. doi: 10.1007/BF00603660. [DOI] [PubMed] [Google Scholar]
- Reiser MB, Dickinson MH. A modular display system for insect behavioral neuroscience. J Neurosci Methods. 2008;167:127–139. doi: 10.1016/j.jneumeth.2007.07.019. [DOI] [PubMed] [Google Scholar]
- Riehle A, Franceschini N. Motion detection in flies: parametric control over ON-OFF pathways. Exp Brain Res. 1984;54:390–394. doi: 10.1007/BF00236243. [DOI] [PubMed] [Google Scholar]
- Rister J, Pauls D, Schnell B, Ting CY, Lee CH, Sinakevitch I, Morante J, Strausfeld NJ, Ito K, Heisenberg M. Dissection of the peripheral motion channel in the visual system of Drosophila melanogaster. Neuron. 2007;56:155–170. doi: 10.1016/j.neuron.2007.09.014. [DOI] [PubMed] [Google Scholar]
- Schnell B, Joesch M, Forstner F, Raghu SV, Otsuna H, Ito K, Borst A, Reiff DF. Processing of horizontal optic flow in three visual interneurons of the Drosophila brain. J Neurophysiol. 2010;103:1646–1657. doi: 10.1152/jn.00950.2009. [DOI] [PubMed] [Google Scholar]
- Schnell B, Raghu SV, Nern A, Borst A. Columnar cells necessary for motion responses of wide-field visual interneurons in Drosophila. J Comp Physiol A Neuroethol Sens Neural Behav Physiol. 2012;198:389–395. doi: 10.1007/s00359-012-0716-3. [DOI] [PMC free article] [PubMed] [Google Scholar]
- Takemura SY, Karuppudurai T, Ting CY, Lu Z, Lee CH, Meinertzhagen IA. Cholinergic circuits integrate neighboring visual signals in a Drosophila motion detection pathway. Curr Biol. 2011;21:2077–2084. doi: 10.1016/j.cub.2011.10.053. [DOI] [PMC free article] [PubMed] [Google Scholar]