

Abstract
Grouping local elements into a holistic percept, also known as spatial binding, is crucial for meaningful perception. Previous studies have shown that neurons in early visual areas V1 and V2 can signal complex grouping-related information, such as illusory contours or object-border ownerships. However, relatively little is known about higher-level processes contributing to these signals and mediating global Gestalt perception. We used a novel bistable motion illusion that induced alternating and mutually exclusive vivid conscious experiences of either dynamic illusory contours forming a global Gestalt or moving ungrouped local elements while the visual stimulation remained the same. fMRI in healthy human volunteers revealed that activity fluctuations in two sites of the parietal cortex, the superior parietal lobe and the anterior intraparietal sulcus (aIPS), correlated specifically with the perception of the grouped illusory Gestalt as opposed to perception of ungrouped local elements. We then disturbed activity at these two sites in the same participants using transcranial magnetic stimulation (TMS). TMS over aIPS led to a selective shortening of the duration of the global Gestalt percept, with no effect on that of local elements. The results suggest that aIPS activity is directly involved in the process of spatial binding during effortless viewing in the healthy brain. Conscious perception of global Gestalt is therefore associated with aIPS function, similar to attention and perceptual selection.
Introduction
Visual binding of local elements into a global Gestalt is crucial for normal vision. It allows us to perceive scenes and objects as a whole rather than as a meaningless collection of individual features. A failure of this ability can lead to the rare symptom of simultanagnosia. Patients with this symptom can recognize distinct objects of the visual scene or name distinct building blocks of hierarchical shapes but cannot perceive the global picture of a scene, hampering their daily lives (Balint, 1909; Wolpert, 1924).
Because visual grouping happens automatically and effortlessly, it has been suggested to occur before attentional selection (Davis and Driver, 1994; Mattingley et al., 1997). In accord with this, most primate electrophysiology and human imaging studies have addressed Gestalt perception in early and mid-level visual regions. For example, neurons in early visual areas can be modulated by grouping-related cues, such as interrupted line segments forming illusory contours (von der Heydt et al., 1984; Grosof et al., 1993), with corresponding signals found using human imaging (Hirsch et al., 1995; Mendola et al., 1999; Seghier et al., 2000; Fang et al., 2008). Similarly, when objects occlude each other, some neurons in early visual cortex correctly assign border ownerships, segregating background from foreground (Zhou et al., 2000; Qiu and von der Heydt, 2005), with consistent results in the human (Fang et al., 2009).
It has not been established which regions provide the top-down feedback thought to underlie these responses (Zhang and von der Heydt, 2010). Physiological evidence suggests that grouping responses are linked to mechanisms of attentional selection (Qiu et al., 2007; Fang et al., 2009; Zhang and von der Heydt, 2010), a function associated with the anterior intraparietal sulcus (aIPS) (Corbetta and Shulman, 2002). This is consistent with bilateral lesions in posterior parietal cortex leading to simultanagnosia and with substrates involved in guiding attention to global or local aspects of hierarchical stimuli (Fink et al., 1996; Mevorach et al., 2006; Romei et al., 2011). However, higher-level neural substrates involved in automatic and spontaneous perceptual grouping have not been studied in the healthy brain before.
Here we used a novel paradigm that allowed us to investigate neural mechanisms involved in automatic and spontaneous perceptual grouping across space in healthy individuals. We used a bistable stimulus that led to alternations between the perception of local, isolated objects and of a grouped illusory Gestalt impression (Anstis and Kim, 2011) (see Fig. 1A). Importantly, it was the conscious percept that alternated spontaneously between two states rather than instructed attention that focused on one of two always perceived aspects of a hierarchically grouped stimulus (Mevorach et al., 2006). Therefore, this stimulus was ideally suited to identify neural mechanisms involved in genuine, automatic and perceptually explicit Gestalt formation. We first presented the stimulus to human volunteers undergoing fMRI and correlated subjective perceptual reports of global Gestalt and of local elements with neural activity. We then applied transcranial magnetic stimulation (TMS) over the activated sites to examine how disruption of their activity affected global and local perceptual periods.
Figure 1.
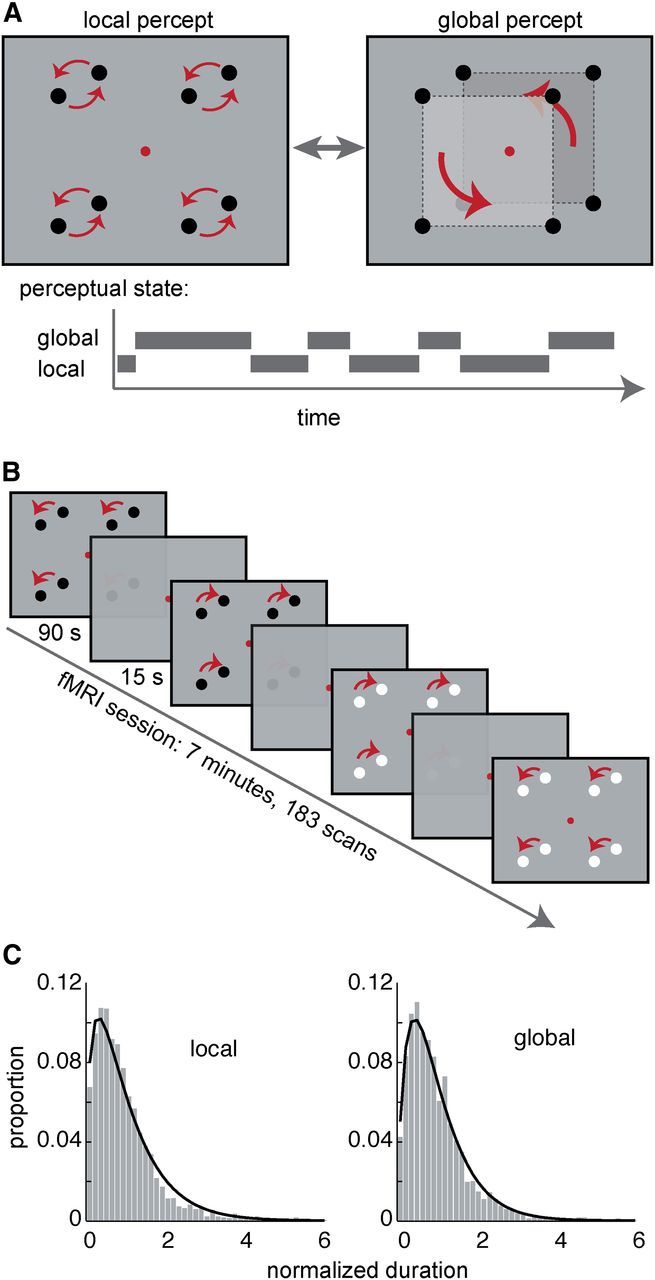
Illustration of stimuli and fMRI paradigm. A, Illustration of the bistable motion stimulus and the two perceptual states. The stimulus consisted of four pairs of dots that moved in-phase on circular paths. Perception alternated spontaneously between two different interpretations: local motion of dot pairs or global motion of two illusory squares (Anstis and Kim, 2011). Subjects fixated a central fixation dot throughout all experiments (for fixation accuracies, see Fig. 5). B, fMRI paradigm: 20 stimulus blocks of 1.5 min were separated by blanks (fixation only) of 15 s. During each stimulus block, dots were shown in either black or white. Subjects indicated periods of global or local percepts by button presses. C, Histograms showing the distributions of normalized dominance durations (normalized by the mean percept duration of each session) for global and local percepts as reported during the fMRI recordings across all subjects, superimposed with fitted gamma functions.
Materials and Methods
Participants
A total of 18 healthy subjects (21–33 years old, nine females, two left-handed, one author) participated in this study. All had normal or corrected-to-normal vision and no history of epilepsy and other neurological disorders. All subjects gave written informed consent before participation. The study was conducted according to the Declaration of Helsinki and was approved by the ethics committee of the University Clinic Tübingen.
fMRI Experiment
fMRI stimuli and procedure.
The stimuli are illustrated in Figure 1A. They were generated using Cogent 1.27 (John Romaya, Wellcome Department of Imaging Neuroscience, University College London, London, UK) on a Windows personal computer running MATLAB 2006b (MathWorks) and presented via a linearized projector with a resolution of 1280 × 1024 and a refresh rate of 60 Hz. Four pairs of dots were presented on a gray background (90 cd/m2) at 100% contrast (i.e., maximal luminance for white dots and minimal luminance for black dots). All dots had the same contrast polarity (either black or white). Individual dots had a size of 0.5°, the distance between dot centers of each dot pair was 2°, and the distance between the screen center and each dot pair center was 5°.
Subjects were asked to fixate a red dot at the center of the screen and to report their current spontaneously occurring percept by pressing and holding down one of the two buttons (one for global, one for local percepts) with fingers of their right hand. They were instructed not to press any button if unsure of their percept. Brain activity was measured on a 3 tesla Siemens Magnetom TIM system using blood oxygenation level-dependent (BOLD) contrast with a gradient-echo planar imaging sequence (repetition time, 2300 ms; echo time, 40 ms; 33 interleaved acquired horizontal slices with in-plane resolution of 3 × 3 mm2; slice thickness, 2.5 mm; gap, 0.5 mm; flip angle, 79°). Each fMRI run consisted of four periods of 1.5 min stimulus viewing intermitted by 15 s of fixation without any stimulus (Fig. 1B). Between distinct 1.5 min periods, the dot-rotation direction and dot-contrast polarity was randomly varied. The first four volumes were discarded to allow for T1 equilibration effects. This resulted in a total of 187 volumes per run and a total run duration of 7 min (Fig. 1B). Additionally, a high-resolution structural T1-weighted image was acquired. Each subject underwent five to six experimental runs. The speed of dot rotation was adjusted after each run in an attempt to balance the duration of local and global motion percepts (with faster rotation tending to increase local percepts), resulting in an average ± SD speed of 2.49 ± 0.20 rotations per second across subjects. Note that this manipulation did not affect the results, because run-specific effects were modeled away in the general linear model (GLM) analysis.
fMRI data analyses.
Data were analyzed using SPM5 (Wellcome Department of Imaging Neuroscience). Echo planar imaging volumes were slice-time corrected, motion corrected, normalized to Montreal Neurological Institute (MNI) space, and spatially smoothed (Gaussian filter with 6 mm full-width at half-maximum for individual and 12 mm for group analysis). Each subject was analyzed separately using a standard GLM approach, followed by a random-effects group analysis. Subject's reports of global and local percepts were used to build two regressors modeling onsets of local and global percepts. Additionally, onsets of the baseline periods and of the stimulus presentation (at the beginning of each run and at the end of each baseline period) were included as third and fourth regressors. The latter were used to account for effects related to the appearance of the stimulus on the screen. General effects of each run (speed or other unspecific effects) were modeled with a regressor consisting of a column of ones.
The analysis of fMRI data involved two steps. First, we identified voxels that were generally activated by the stimulus compared with baseline, using the contrast [global:1, local:1, baseline:−2], i.e., voxels in which any linear combination of activity during global and local percepts was greater than baseline. This contrast would later serve as a mask for statistical correction of the more specific contrasts. This contrast was applied in every subject and then on the group level using a random-effects analysis with a liberal threshold of p < 0.05 (uncorrected). After this, to identify voxels involved in perceptual grouping, we performed a voxelwise comparison between global and local percept onsets in every individual subject and on the group level. The random-effects group analysis for the global versus local comparison was thresholded at p < 0.05, familywise error (FWE) corrected for the volume of stimulus-activated voxels identified in the first step.
In addition to the analysis described above, we also tested whether the modeled onsets fully accounted for the differential activity in global versus local conditions or whether additional regressors modeling the steady-state perceptual periods explained additional variance in the data. We repeated the fMRI analysis using a new GLM that included regressors for both onsets and steady-state durations of each condition, thus accounting for onset-specific variance in addition to steady-state-related variance.
Finally, we examined the behavioral data to ascertain that differences in brain activity between global and local perceptual states cannot be explained by potential differences in durations of transitions from global to local perceptual state and vice versa, as it has been reported recently for bistable perception (Knapen et al., 2011). Transitions were defined as periods during which no button was pressed. Periods during which both buttons were pressed simultaneously were also counted as transitions. Median durations of each transition type (i.e., global to local or vice versa) were compared in a paired t test across subjects.
TMS experiment
In the subsequent TMS experiment, we tested whether disturbing activity of areas that were significantly more active during global compared with local percepts would affect perceptual grouping processes.
Planning of the stimulation sites.
Based on the consistent fMRI results across the individual subjects, which were reflected in the group statistics (see Results and Fig. 2), the two right parietal sites that were more activated with global compared with local percepts were chosen for stimulation: the aIPS and the superior parietal lobe (SPL). These sites were localized in each subject's right hemisphere using individual fMRI results (Figs. 2C, 3A). The average MNI coordinates of the two stimulated sites were as follows: mean ± SD of the SPL: x = 20.70 ± 5.28, y = −66.67 ± 7.06, z = 50.03 ± 4.30; mean ± SD of the aIPS: x = 32.46 ± 4.39, y = −46.66 ± 7.01, z = 48.79 ± 7.18 (note that small discrepancies of these coordinates with those reported for the random-effects analysis are attributable to differences in the averaging approach and smoothing involved in each method). In addition to the functional sites, we also defined vertex (the highest point on a subject's head; see Fig. 3A) as a control stimulation site to account for the unspecific effects of stimulation.
Figure 2.
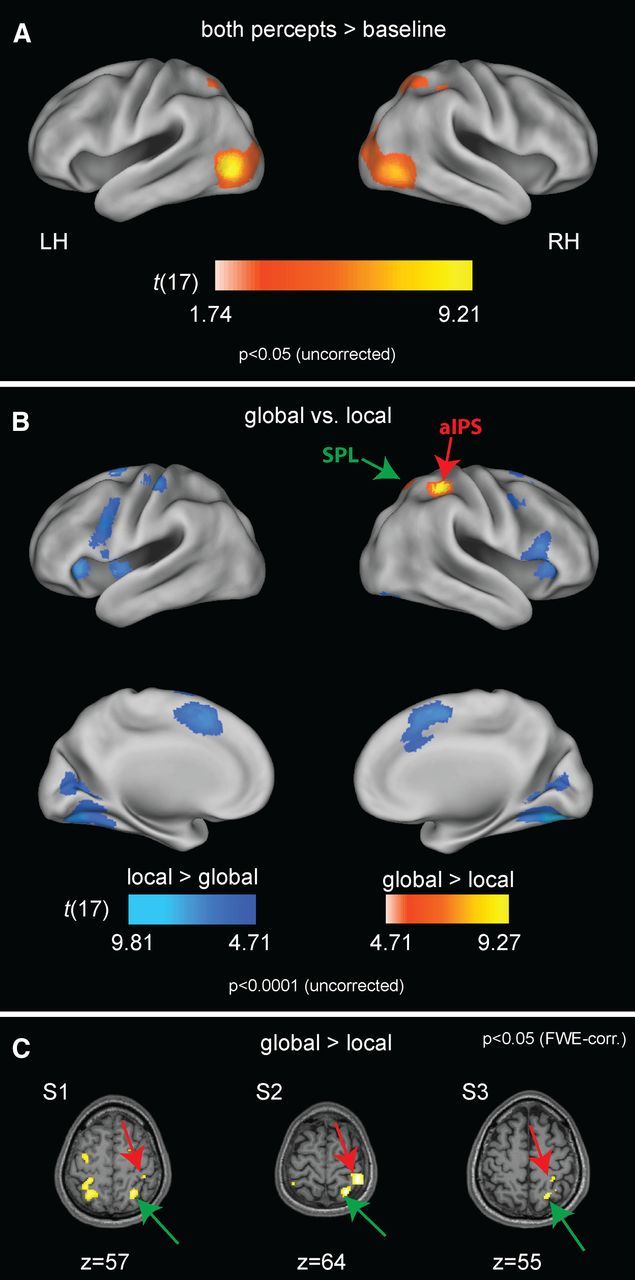
fMRI activity related to visual stimulation and to global and local perceptual states. A, Brain activity related to both perceptual states compared with fixation only at p < 0.05 uncorrected, shown on an inflated template brain. The volume of the activated voxels was used for statistical correction of the comparisons between global and local perceptual states. Peak coordinates and their significance levels are given in Table 1. B, Activity related to the global perceptual state across the whole brain is shown in red-to-yellow, and that related to the local percept is in blue. Voxels in the aIPS survived whole-brain FWE correction (p < 0.05); both parietal clusters (aIPS and SPL) survived FWE correction for the mask shown in A. For details, see Table 2. For illustration, maps are shown at p < 0.0001 (uncorrected). C, Parietal activation for the contrast “global versus local,” shown for three representative participants. LH, Left hemisphere; RH, right hemisphere.
Figure 3.

TMS stimulation sites and experimental paradigm. A, The three sites targeted by TMS shown on a three-dimensional reconstruction of the brain and on the head surface of one representative participant. B, Experimental design of the TMS experiment. Each of the three TMS sites depicted in A was targeted on a separate day, counterbalanced across subjects. On each day, two runs of behavioral experiments were recorded before and four runs after TMS of the target site.
TMS experiment procedure.
Subjects were seated in a chair resting their head on a chin rest. The stimulus was presented on a Dell 2007FP monitor with a resolution of 1600 × 1200 pixels and a refresh rate of 60 Hz at a distance of 40 cm away from the observer. The stimulus had the same configuration as during the fMRI experiment with a larger size (dot size, 1°; screen center to dot pair distance, 10°; distance between paired dots, 2°). The dots were black throughout all TMS experiments, presented on a gray screen (91 cd/m2). Each experimental run consisted of four 50 s trials separated by 10 s of rest (Fig. 3B). During rest, subjects were allowed to close their eyes and look freely around on the screen.
Each of the three TMS sites was tested on a separate day, with the order of the sites randomized across subjects (Fig. 3B). On the first day, subjects' active motor threshold was determined (defined as the TMS intensity at which 5 of 10 pulses over the left motor cortex elicit a visible muscle twitch while subjects hold their right-hand fingertips contracted), and several sessions were undertaken to adjust the stimulus velocity to optimize the balance between local and global percepts. The individual subject's speed (mean ± SD, 2.58 ± 0.11 rotations per second) was then kept constant for all of the following days. For TMS coil positioning, the subject's head was then coregistered with their individual structural MR image using surface markers and a camera-based stereotactic neuronavigation system (LOCALITE). After registration, subjects completed four runs with the same instructions as described above for the fMRI experiment. The first two runs of each experimental day served to accustom subjects to the setting and to achieve a stable baseline and were later discarded, because perceptual durations in binocular rivalry, as well as in our bistable global–local stimulus are known to change significantly within the first few minutes of viewing before they reach a more steady level (Suzuki and Grabowecky, 2007; Anstis and Kim, 2011). All remaining runs entered the analysis described below. After the fourth run, 48 s of continuous theta burst stimulation (cTBS) (three pulses at 50 Hz repeated every 0.2 s, resulting in 600 pulses in total) was applied over one of the three locations: right SPL, right aIPS, or vertex. cTBS has been shown to have an inhibitory effect on neural function for several minutes after its application (Huang et al., 2005). Pulses were delivered by a figure-of-eight coil (MC-B70) connected to a MagPro X100 stimulator (MagVenture). Intensity of the stimulation was set to 80% of individual active motor threshold, resulting in a mean ± SD intensity of 25.89 ± 4.64% of stimulator output. Immediately after stimulation, subjects completed another four runs.
TMS data analyses.
First, the onset times and durations of all global and local percepts were determined. After this, the durations of the first global and the first local percepts within every 50 s trial were identified and averaged separately for trials before and after TMS. We used the first global and local percepts of every trial to ensure that the number of data points was the same for each subject in every condition despite the variable percept durations (the number of perceptual phases that could be accommodated into a 50 s trial varied from 2 to 22). This also helped us to minimize time-dependent effects within each trial (Anstis and Kim, 2011). Trials before TMS were regarded as “baseline.” Therefore, for every percept type (global, local), the average percept duration after the TMS was normalized by its baseline. This resulted in two values per subject: normalized duration of the local percept and normalized duration of the global percept. Each value represents the perceptual duration after TMS relative to that preceding TMS. These values were used to conduct a repeated-measures one-way ANOVA over different TMS sites separately for each percept type.
Eye tracking
To examine whether patterns of eye movements during fixation were related to perceiving local and global interpretations of the stimulus, we monitored eye position throughout all fMRI and TMS experiments in every subject. During fMRI experiments, pupil position was acquired using the infrared camera-based ASL EyeTrac 6 Eye Tracking System (Applied Science Laboratories) at a sampling rate of 60 Hz. During TMS experiments, eye position was monitored using a pupil-glint vector with an Arrington Viewpoint infrared eye-tracking system at a sampling rate of 220 Hz (Arrington Research).
The preprocessing of eye-position data acquired during fMRI and TMS experiments included blink interpolation using the nearest-neighbor method and smoothing of x and y gaze positions with a 200 ms running average window. After this, the absolute distance of gaze from the fixation dot was calculated for each sampled time point. For the fMRI experiment, these distances were sorted according to whether they stemmed from local or global perceptual states and used to compute two values: (1) the average distance between the gaze position and the fixation dot, and (2) the variance, which quantifies the variability in the eye position relative to the fixation dot. These two values were computed for each subject and each percept type. Two-tailed paired-sample t tests between global and local conditions were performed for the average and the variance. For the TMS experiment, distances were sorted according to percept type and stimulation site. After this, the average and the variance values of each subject, normalized by their pre-TMS baseline values, were submitted to two one-way ANOVAs, one for global and one for local percept, with “stimulation site” as factor.
Results
fMRI: behavior and eye movements
Analysis of behavioral responses during fMRI scanning showed that, across all sessions of all 18 subjects, the durations of the global percept lasted on average 7.02 ± 3.69 s (mean ± SD) and those of the local percept 5.68 ± 2.25 s. The distributions of durations of both percepts were well fitted by a gamma function [maximum likelihood fit coefficient of determination (r2) global = 0.987, local = 0.983; Fig. 1C]. Observers reported the transitions in this bistable display to be perceptually immediate. The average median ± SD of transition periods across subjects was 50.7 ± 34.0 ms for global percepts and 52.0 ± 37.3 ms for local percepts, respectively, with no significant difference between them (t(17) = −0.202, p = 0.843). Therefore, differential durations of transition periods from local to global and vice versa cannot account for neural activity differences. This stands in contrast to binocular rivalry, in which transition periods are much longer and highly variable (Knapen et al., 2011).
Analysis of eye-tracking data recorded throughout all fMRI sessions revealed no differences in fixation accuracy during perception of global Gestalt compared with ungrouped items (average distance from fixation, t(17) = −1.26, p = 0.226; variance of the eye position, t(17) = −1.570, p = 0.135; see also Fig. 5).
Figure 5.

Eye movement data. Two-dimensional histograms of the eye position of one representative participant during global (left column) and local (right column) stimulus perception. Fixation data is shown separately for the fMRI (top row) and TMS (bottom row) experiments. Group analysis of eye-position data using average distance of gaze from fixation as well as the variance of this distance during both fMRI and TMS experiments revealed no difference in fixation accuracy across the different conditions. For details, see Materials and Methods.
fMRI: activity fluctuations correlating with global Gestalt perception
fMRI activity related to both perceptual states compared with gray baseline periods involved a bilateral site corresponding to putative extrastriate area V5+/MT+ and two superior parietal regions, shown in Figure 2A (Table 1 lists peak coordinates and statistical information of each cluster). The comparison of brain activity related to global percepts compared with local ones revealed greater activity of areas of the right posterior parietal cortex, as well as right and left putamen (not visible in the figure), shown in Figure 2B and Table 2. The maximum was located in the aIPS, with a second peak in the SPL. Both peaks were significant at p < 0.05, FWE corrected for the volume of voxels active during both percepts compared with baseline as shown in Figure 2A. Both parietal sites were also reliably activated in each individual subject, reaching p < 0.05 (FWE whole-brain corrected) in 12 of 18 subjects, as illustrated in Figure 2C. In the inverse comparison of local perceptual states with global ones, the right fusiform gyrus was most active, with its activation cluster extending into early visual cortex (Fig. 2B; Table 2 lists coordinates of all regions differentially involved in either direction).
Table 1.
Brain regions, coordinates, cluster sizes, peak z values, and p values of voxel clusters preferring either global or local perceptual states compared with gray baseline in the whole-brain random-effects fMRI group analysis
| Brain region | x, y, z (mm) | Cluster size (voxels) | z (peak) | p (uncorrected) | p (FWE-corrected) |
|---|---|---|---|---|---|
| L. extrastriate cortex | −50, −74, 00 | 1799 | 5.45 | <0.001 | 0.001 |
| R. extrastriate cortex | 46, −68, −02 | 1835 | 4.65 | 0.001 | 0.033 |
| R. SPL/aIPS | 28, −56, 54 | 445 | 2.89 | 0.002 | 0.995 |
| L. aIPS | −26, −56, 52 | 60 | 2.22 | 0.013 | 1.000 |
| Corpus collosum | 04, 00, 22 | 2 | 1.75 | 0.04 | 1.000 |
The activated volume, thresholded at p < 0.05 (uncorrected), was used for statistical correction in the subsequent analysis. Anatomical locations were identified with the help of the SPM Anatomy toolbox (Simon Eickhoff, Research Center Jülich, Jülich, Germany). L., Left; R., right.
Table 2.
Brain regions, coordinates, cluster sizes, peak z values, and p values of voxel clusters preferring either global-to-local perceptual states or local-to-global perceptual states in the whole-brain random-effects fMRI group analysis
| Brain region | x, y, z (mm) | Cluster size (voxels) | z (peak) | p (FWE-corrected mask) | p (FWE-corrected whole brain) |
|---|---|---|---|---|---|
| Global > local | |||||
| R. aIPS/area 2 | 34, −40, 52 | 169 | 5.46 | 0.0001 | 0.002 |
| R. SPL | 22, −60, 58 | 55 | 3.69 | 0.0349 | 0.303 |
| L. putamen | −28, −04, −04 | 275 | 5.26 | n/a | 0.004 |
| R. putamen | 26, −04, 10 | 309 | 4.80 | n/a | 0.028 |
| Local > global | |||||
| R./L. fusiform gyrus | ±30, −71, −09 | 3004 | 4.71 | 0.003 | 0.0400 |
| L. rolandic operculum | −46, −04, 04 | 288 | 5.21 | n/a | 0.0053 |
| L. area 6 | −14, 02, 66 | 2100 | 4.85 | n/a | 0.0235 |
| L. insula lobe | −32, 26, 00 | 265 | 4.85 | n/a | 0.0238 |
| L. postcentral gyrus | −46, −20, 62 | 238 | 4.76 | n/a | 0.0328 |
| R. inferior frontal gyrus (pars triangularis) | 40, 26, 04 | 799 | 4.65 | n/a | 0.0490 |
| L. inferior frontal gyrus (pars opercularis) | −44, 06, 28 | 292 | 4.51 | 0.008 | 0.0825 |
| R. precentral gyrus | 48, 04, 44 | 90 | 4.09 | 0.05 | 0.2987 |
To match Figure 2, clusters reaching a threshold of p < 0.0001 (uncorrected) and surviving p < 0.05 at the cluster level are included. p values at FWE correction for the whole brain as well as for the volume of visually activated voxels are provided. Anatomical locations were identified with the help of the SPM Anatomy toolbox (Simon Eickhoff, Research Center Jülich). *n/a indicates voxels outside of the mask volume. L., Left; R., right.
The comparison of the steady-state global versus local conditions in a GLM that included separate regressors for onsets and steady state of each percept revealed the same right aIPS cluster that was found in the original GLM that modeled onsets only, yet with somewhat reduced significance (cluster size of 167 voxels at p < 0.001 uncorrected, with peak coordinates of x = 32, y = −48, z = 70). This finding suggests that not only onsets of global percepts but also their continuous presence were correlated with elevated activity of the right posterior parietal cluster.
TMS: interfering with perception of global Gestalt
Because perception of the local elements and of the global Gestalt excluded each other and because the physical stimulus remained the same during both perceptual states, the activity we observed in fMRI must be related to the perception of grouped Gestalt. However, the fMRI data leave it open whether the parietal regions were activated as a consequence of the global Gestalt perception (e.g., attributable to involuntary attention drawn to it) or whether they were involved in its generation. We therefore tested whether interfering with neural processing in the activated parietal areas would selectively impair Gestalt perception. We measured global and local percept durations before and after application of an inhibitory TMS protocol (cTBS) over three sites (aIPS, SPL, and, as control site, vertex), with experiments performed on separate and counterbalanced days for each site (see Materials and Methods). Figure 4 shows normalized percept durations (i.e., duration post-TMS/pre-TMS) obtained for each stimulation site, separately for global and local percepts. There was a significant effect of stimulation site for the durations of the global Gestalt percept (F(2,34) = 5.02, p = 0.012) but not for the local one (F(2,34) = 0.13, p = 0.877). Post hoc tests showed that the effect on global durations was driven by TMS over the aIPS (Fig. 4), which significantly and substantially (24%) reduced the global percept duration after stimulus onset compared with TMS over the vertex control condition (t(17) = −3.655, p = 0.006 Bonferroni corrected for three comparisons), with no effect for SPL (t(17) = −1.374, p = 0.287 uncorrected). The effects of aIPS–TMS on global durations were significantly larger than those on local durations (one-sided paired t test for aIPS minus vertex between global and local percepts, t(17) = 2.185, p = 0.0215).
Figure 4.

Perceptual effects of TMS on global and local states. Effects of TMS at each of the three stimulation sites on global (A) and local (B) percept durations. Bars show normalized dominance durations after TMS (mean ± SE across subjects). Normalization consisted of dividing the post-TMS dominance duration by the pre-TMS dominance duration. Note that, consistent with previous behavioral observations (Anstis and Kim, 2011), the duration of the global percept increased with time, and this effect was overridden and reversed after right aIPS stimulation. There were no effects for the local percept. Error bars indicate SEM. *p < 0.006 (Bonferroni corrected).
As in the fMRI experiment, there were no differences in fixation accuracy across different conditions of the TMS experiment (average distance from fixation during global percept, F(2,34) = 0.176, p = 0.839; average distance from fixation during local percept, F(2,34) = 0.861, p = 0.432; variance of the eye position during global percept, F(2,34) = 0.719, p = 0.500; variance during local percept, F(2,34) = 2.950, p = 0.066; for details, see Fig. 5 and Materials and Methods), and perceptual transitions remained immediate (average median ± SD across subjects was 52.33 ± 33.98 ms).
Finally, we performed an analysis to see whether the behavioral effect size of TMS application correlated with the strength of the BOLD signal of the stimulated site, as we observed in a previous study (Zaretskaya et al., 2010). As a measure of fMRI effects, we used the difference between mean β estimates in global and local conditions of the fMRI experiment in a 6 × 6 × 6 mm region of interest around the individual aIPS coordinates of each subject. TMS effects were defined as difference between effects of stimulation on global and local perceptual states (percentage change in global minus percentage change in local). However, no significant correlation was found (r = −0.040, p = 0.874).
Discussion
Our bistable stimulus allowed us to study neural correlates of two entirely distinct visual percepts that alternated spontaneously: one consisted of spatially separate local elements, and the other grouped the elements into a global Gestalt. Importantly, the percepts were vivid, mutually exclusive, and occurred without explicit voluntary attention or physical manipulations of the stimuli. fMRI experiments showed that activity in aIPS was correlated with conscious perception of the whole compared with perception of its parts. Disturbing this activity using an inhibitory TMS protocol substantially shortened the perceptual periods of the global Gestalt without affecting that of the local elements. These results indicate an important role of aIPS in perceptual grouping.
A number of previous studies asked subjects to actively guide voluntary attention to either global or local aspects of already grouped hierarchical structures (Fink et al., 1996; Mevorach et al., 2006) and to actively ignore the task-irrelevant part of the stimulus (Mevorach et al., 2010). However, this approach does not compare processes related to Gestalt formation and perception with their absence, because Gestalt is always present and perceived. These studies indicate that the right posterior parietal cortex, including aIPS, plays a direct and important role in directing attention between the local and the global stimulus aspect (Mevorach et al., 2006; Romei et al., 2011), a region previously associated with spatial attention (Corbetta and Shulman, 2002; Yantis and Serences, 2003) and perceptual selection. In contrast to this approach, which investigated primarily directed attention, our study relied on spontaneous and vivid perceptual alternations, without changes in voluntary attention. The anatomically coincident location in the right IPS in those studies with that identified here therefore points to a convergent mechanism involved in directed attentional selection and in perception of Gestalt. A similar location has also been reported in a case of a rare simultanagnosia patient. Unlike healthy humans who usually can perceive the global aspect of hierarchical letter stimuli and unlike typical simultanagnosic patients who usually fail, she could perceive the global aspect of hierarchical letter stimuli on half of the trials but failed to do so on the other half, with successful trials correlating with parietal activity close to our aIPS region (Himmelbach et al., 2009). Together with our findings, this evidence suggests that the same machinery is involved in voluntary attentional selection of global stimulus aspects and in the spontaneous formation of a global conscious percept during effortless viewing.
However, a difference exists in that voluntary attention to both global and local aspects of hierarchical stimuli could be biased by parietal TMS in previous studies (Mevorach et al., 2006, 2010), whereas during spontaneous perception, we could only bias global but not local perception. This divergence in results is likely to reflect a difference in mechanisms of perceiving local elements that constitute a whole as opposed to directing attention to local features, which also requires the active suppression of global aspects, the latter being an established parietal function (Mevorach et al., 2010). Consistent with our findings, perception of local elements rather than attention to them has been associated with activity in the posterior part of the fusiform cortex in the vicinity of hV4 and of encroaching medial parts of the lateral occipital complex, which are involved in processing simple local shapes (Lerner et al., 2001; Hayworth and Biederman, 2006; Vinberg and Grill-Spector, 2008).
Another group of previous studies manipulated physical configurations, such as inducers of a Kanizsa shape, to induce global or local percepts (Hirsch et al., 1995; Mendola et al., 1999; Seghier et al., 2000; Kourtzi et al., 2003; Fang et al., 2008). Most of these studies explicitly limited their data acquisition or analyses of grouping-related activity to visual cortex and were therefore unable to examine parietal involvement. However, similar to two of the reports with good control over low-level stimulus features (Fang et al., 2008; McMains and Kastner, 2011), we observed a deactivation of early visual areas during Gestalt perception relative to baseline and also relative to the “local” perceptual state (Fig. 2A,B). Because our conditions were physically identical, this deactivation is likely to be attributable to top-down modulation.
Several hypothetical explanations may account for this. For one, it could be viewed in context of predictive coding (Rao and Ballard, 1999; Hohwy et al., 2008). According to this model, the sensory information provided by early visual cortex is compared with higher-level predictions provided by extrastriate, parietal, or prefrontal regions about a global or higher-level interpretation that may lead to the sensory input. Lower-level activity is cancelled if it matches predictions of higher-level regions, such that mainly prediction errors are propagated toward higher levels that can then adjust their predictions accordingly. In the present study, aIPS would be the candidate site encoding the high-level prediction. Consistency between prediction and sensory input would then reduce early visual activity, as observed here during global perception (Fig. 6). This is plausible mechanistically, because previous studies have shown that aIPS can modulate early visual areas (Ruff et al., 2009). Consistent with the present study and with previous grouping studies, deactivation of striate cortex has also been reported during form perception with various shape stimuli (Murray et al., 2002), as well as during viewing of coherent or predictable motion as opposed to random motion during viewing of abstract as well as natural scenes (Bartels et al., 2008; Alink et al., 2010).
Figure 6.

Interpretation of aIPS and visual cortex activity in context of predictive coding. The following reasoning could provide one possible interpretation of our data. During global perception, aIPS facilitates spatial binding of the sensory input and the encoding of the global interpretation in terms of two large moving squares. This function is associated with higher activity in aIPS. According to predictive coding theory, aIPS feeds its high-level interpretation/prediction of the sensory input back to early visual cortex. Because the prediction matches the sensory input, the two cancel each other out, leaving minimal prediction error and low activity in early visual cortex. Local perception arises when aIPS has low activity (or is disturbed by TMS) and does not spatially bind or encode a global interpretation, leading to higher activity in early cortex because no prediction cancels the sensory input.
An alternative explanation for deactivation of early visual areas that is potentially related to predictive coding concerns the so-called border-ownership responses. Border-ownership responses have been observed in a subset of edge-responsive neurons in V1 and V2 (Zhou et al., 2000; Dong et al., 2008). These neurons are modulated by the side on which the object in the foreground is located that “owns” the edge. Because information regarding object identity lies far beyond the field of view (and beyond the functional properties) of these neurons, it must be conveyed to these neurons from higher levels. It is currently unknown which high-level area endows this special subset of edge-responsive neurons in V1 and V2 with the required “knowledge” about object segmentation (Zhang and von der Heydt, 2010), but our results point to aIPS as a potential source of this high-level grouping signal because it was most strongly activated during the “global” compared with “local” perceptual state and because it was causally involved in forming the global percept.
Intriguingly, this hypothesis is indirectly supported by electrophysiology and fMRI experiments that revealed an interaction between the border-ownership response in early visual areas with top-down attention (Qiu et al., 2007; Fang et al., 2009). These experiments showed that border-ownership responses were strongly modulated by attention (Qiu et al., 2007). This has led to the suggestion that mechanisms related to figure–ground segmentation are tied to those of attentional selection (Qiu et al., 2007; Fang et al., 2009), which in turn is mediated by aIPS (Corbetta and Shulman, 2002). Our results therefore provide direct support for the above suggestion. Notably, also monkey IPS has been found to convey grouping responses that are attentionally modulated (Yokoi and Komatsu, 2009).
The idea of a functional relationship between grouping and attention also fits well with a recent study examining perceptual competition between multiple items and the available attentional resources that can modulate responses in early visual cortex. The study examined responses in early visual areas V1–V4 to parametrically varied grouping strength of Kanizsa inducers and found that grouping strength parametrically limited the amount of attentional modulation of early visual responses, suggesting that the resources for grouping and attentional selection may be shared (McMains and Kastner, 2011). Our evidence supports the notion of a shared anatomical substrate in aIPS.
Finally, aIPS has been implicated previously not only in attention but also in perceptual selection during bistable perception (Kleinschmidt et al., 1998; Lumer et al., 1998; Sterzer and Kleinschmidt, 2007; Carmel et al., 2010; Zaretskaya et al., 2010; Kanai et al., 2011). Importantly, however, TMS over this site changed the frequency of perceptual alternations for both stimuli equally, thus indicating that generic mechanisms of perceptual stability or selection had been disturbed (Carmel et al., 2010; Zaretskaya et al., 2010; Kanai et al., 2011). One study interpreted this finding in context of above-mentioned predictive coding theory, in that aIPS may encode the higher-level prediction about the sensory input, whereas a posterior site, in which TMS had opposite effects, may encode the error signal (Kanai et al., 2010, 2011). At least our above interpretation of aIPS encoding the higher-level prediction (two large moving squares) on what may have caused the sensory input (rotating dots) is consistent with this: disturbing aIPS using TMS in the current study biased the alternation process, selectively reducing the percept corresponding to the high-level prediction/interpretation of the input (Fig. 6). However, as explained above, our data point to visual cortex as the site of prediction-error calculation, because it reduced activity during global perception, i.e., when the high-level prediction matched the sensory input and therefore cancelled the prediction error.
The above interpretations provide a theoretical framework for the notion that the mechanisms of attention, binding, and perceptual selection might be closely related (Bartels, 2009), and the present findings suggest convergence of these functions in the aIPS.
Footnotes
This work was funded by the Centre for Integrative Neuroscience Tübingen. We thank Frank Mühlbauer and Simon Klein for their help in eye tracking and TMS experiments and Stephan de la Rosa for advice on statistical analysis.
The authors declare no competing financial interests.
References
- Alink A, Schwiedrzik CM, Kohler A, Singer W, Muckli L. Stimulus predictability reduces responses in primary visual cortex. J Neurosci. 2010;30:2960–2966. doi: 10.1523/JNEUROSCI.3730-10.2010. [DOI] [PMC free article] [PubMed] [Google Scholar]
- Anstis S, Kim J. Local versus global perception of ambiguous motion displays. J Vis. 2011;11(3):13, 1–12. doi: 10.1167/11.3.13. [DOI] [PubMed] [Google Scholar]
- Balint R. Seelenlähmung des Schauens, optische Ataxie, raümliche Störung der Aufmerksamkeit. Monatsschr Psychiat Neurol. 1909;25:51–81. [Google Scholar]
- Bartels A. Visual perception: converging mechanisms of attention, binding, and segmentation? Curr Biol. 2009;19:R300–R302. doi: 10.1016/j.cub.2009.02.014. [DOI] [PubMed] [Google Scholar]
- Bartels A, Zeki S, Logothetis NK. Natural vision reveals regional specialization to local motion and to contrast-invariant, global flow in the human brain. Cereb Cortex. 2008;18:705–717. doi: 10.1093/cercor/bhm107. [DOI] [PubMed] [Google Scholar]
- Carmel D, Walsh V, Lavie N, Rees G. Right parietal TMS shortens dominance durations in binocular rivalry. Curr Biol. 2010;20:R799–R800. doi: 10.1016/j.cub.2010.07.036. [DOI] [PubMed] [Google Scholar]
- Corbetta M, Shulman GL. Control of goal-directed and stimulus-driven attention in the brain. Nat Rev Neurosci. 2002;3:201–215. doi: 10.1038/nrn755. [DOI] [PubMed] [Google Scholar]
- Davis G, Driver J. Parallel detection of Kanizsa subjective figures in the human visual system. Nature. 1994;371:791–793. doi: 10.1038/371791a0. [DOI] [PubMed] [Google Scholar]
- Dong Y, Mihalas S, Qiu F, von der Heydt R, Niebur E. Synchrony and the binding problem in macaque visual cortex. J Vis. 2008;8(7):30, 1–16. doi: 10.1167/8.7.30. [DOI] [PMC free article] [PubMed] [Google Scholar]
- Fang F, Kersten D, Murray SO. Perceptual grouping and inverse fMRI activity patterns in human visual cortex. J Vis. 2008;8(7):2, 1–9. doi: 10.1167/8.7.2. [DOI] [PubMed] [Google Scholar]
- Fang F, Boyaci H, Kersten D. Border ownership selectivity in human early visual cortex and its modulation by attention. J Neurosci. 2009;29:460–465. doi: 10.1523/JNEUROSCI.4628-08.2009. [DOI] [PMC free article] [PubMed] [Google Scholar]
- Fink GR, Halligan PW, Marshall JC, Frith CD, Frackowiak RS, Dolan RJ. Where in the brain does visual attention select the forest and the trees? Nature. 1996;382:626–628. doi: 10.1038/382626a0. [DOI] [PubMed] [Google Scholar]
- Grosof DH, Shapley RM, Hawken MJ. Macaque V1 neurons can signal “illusory” contours. Nature. 1993;365:550–552. doi: 10.1038/365550a0. [DOI] [PubMed] [Google Scholar]
- Hayworth KJ, Biederman I. Neural evidence for intermediate representations in object recognition. Vision Res. 2006;46:4024–4031. doi: 10.1016/j.visres.2006.07.015. [DOI] [PubMed] [Google Scholar]
- Himmelbach M, Erb M, Klockgether T, Moskau S, Karnath HO. fMRI of global visual perception in simultanagnosia. Neuropsychologia. 2009;47:1173–1177. doi: 10.1016/j.neuropsychologia.2008.10.025. [DOI] [PubMed] [Google Scholar]
- Hirsch J, DeLaPaz RL, Relkin NR, Victor J, Kim K, Li T, Borden P, Rubin N, Shapley R. Illusory contours activate specific regions in human visual cortex: evidence from functional magnetic resonance imaging. Proc Natl Acad Sci U S A. 1995;92:6469–6473. doi: 10.1073/pnas.92.14.6469. [DOI] [PMC free article] [PubMed] [Google Scholar]
- Hohwy J, Roepstorff A, Friston K. Predictive coding explains binocular rivalry: an epistemological review. Cognition. 2008;108:687–701. doi: 10.1016/j.cognition.2008.05.010. [DOI] [PubMed] [Google Scholar]
- Huang YZ, Edwards MJ, Rounis E, Bhatia KP, Rothwell JC. Theta burst stimulation of the human motor cortex. Neuron. 2005;45:201–206. doi: 10.1016/j.neuron.2004.12.033. [DOI] [PubMed] [Google Scholar]
- Kanai R, Bahrami B, Rees G. Human parietal cortex structure predicts individual differences in perceptual rivalry. Curr Biol. 2010;20:1626–1630. doi: 10.1016/j.cub.2010.07.027. [DOI] [PMC free article] [PubMed] [Google Scholar]
- Kanai R, Carmel D, Bahrami B, Rees G. Structural and functional fractionation of right superior parietal cortex in bistable perception. Curr Biol. 2011;21:R106–R107. doi: 10.1016/j.cub.2010.12.009. [DOI] [PMC free article] [PubMed] [Google Scholar]
- Kleinschmidt A, Büchel C, Zeki S, Frackowiak RS. Human brain activity during spontaneously reversing perception of ambiguous figures. Proc Biol Sci. 1998;265:2427–2433. doi: 10.1098/rspb.1998.0594. [DOI] [PMC free article] [PubMed] [Google Scholar]
- Knapen T, Brascamp J, Pearson J, van Ee R, Blake R. The role of frontal and parietal brain areas in bistable perception. J Neurosci. 2011;31:10293–10301. doi: 10.1523/JNEUROSCI.1727-11.2011. [DOI] [PMC free article] [PubMed] [Google Scholar]
- Kourtzi Z, Tolias AS, Altmann CF, Augath M, Logothetis NK. Integration of local features into global shapes: monkey and human FMRI studies. Neuron. 2003;37:333–346. doi: 10.1016/s0896-6273(02)01174-1. [DOI] [PubMed] [Google Scholar]
- Lerner Y, Hendler T, Ben-Bashat D, Harel M, Malach R. A hierarchical axis of object processing stages in the human visual cortex. Cereb Cortex. 2001;11:287–297. doi: 10.1093/cercor/11.4.287. [DOI] [PubMed] [Google Scholar]
- Lumer ED, Friston KJ, Rees G. Neural correlates of perceptual rivalry in the human brain. Science. 1998;280:1930–1934. doi: 10.1126/science.280.5371.1930. [DOI] [PubMed] [Google Scholar]
- Mattingley JB, Davis G, Driver J. Preattentive filling-in of visual surfaces in parietal extinction. Science. 1997;275:671–674. doi: 10.1126/science.275.5300.671. [DOI] [PubMed] [Google Scholar]
- McMains S, Kastner S. Interactions of top-down and bottom-up mechanisms in human visual cortex. J Neurosci. 2011;31:587–597. doi: 10.1523/JNEUROSCI.3766-10.2011. [DOI] [PMC free article] [PubMed] [Google Scholar]
- Mendola JD, Dale AM, Fischl B, Liu AK, Tootell RB. The representation of illusory and real contours in human cortical visual areas revealed by functional magnetic resonance imaging. J Neurosci. 1999;19:8560–8572. doi: 10.1523/JNEUROSCI.19-19-08560.1999. [DOI] [PMC free article] [PubMed] [Google Scholar]
- Mevorach C, Humphreys GW, Shalev L. Opposite biases in salience-based selection for the left and right posterior parietal cortex. Nat Neurosci. 2006;9:740–742. doi: 10.1038/nn1709. [DOI] [PubMed] [Google Scholar]
- Mevorach C, Hodsoll J, Allen H, Shalev L, Humphreys G. Ignoring the elephant in the room: a neural circuit to downregulate salience. J Neurosci. 2010;30:6072–6079. doi: 10.1523/JNEUROSCI.0241-10.2010. [DOI] [PMC free article] [PubMed] [Google Scholar]
- Murray SO, Kersten D, Olshausen BA, Schrater P, Woods DL. Shape perception reduces activity in human primary visual cortex. Proc Natl Acad Sci U S A. 2002;99:15164–15169. doi: 10.1073/pnas.192579399. [DOI] [PMC free article] [PubMed] [Google Scholar]
- Qiu FT, von der Heydt R. Figure and ground in the visual cortex: v2 combines stereoscopic cues with gestalt rules. Neuron. 2005;47:155–166. doi: 10.1016/j.neuron.2005.05.028. [DOI] [PMC free article] [PubMed] [Google Scholar]
- Qiu FT, Sugihara T, von der Heydt R. Figure-ground mechanisms provide structure for selective attention. Nat Neurosci. 2007;10:1492–1499. doi: 10.1038/nn1989. [DOI] [PMC free article] [PubMed] [Google Scholar]
- Rao RP, Ballard DH. Predictive coding in the visual cortex: a functional interpretation of some extra-classical receptive-field effects. Nat Neurosci. 1999;2:79–87. doi: 10.1038/4580. [DOI] [PubMed] [Google Scholar]
- Romei V, Driver J, Schyns PG, Thut G. Rhythmic TMS over parietal cortex links distinct brain frequencies to global versus local visual processing. Curr Biol. 2011;21:334–337. doi: 10.1016/j.cub.2011.01.035. [DOI] [PMC free article] [PubMed] [Google Scholar]
- Ruff CC, Blankenburg F, Bjoertomt O, Bestmann S, Weiskopf N, Driver J. Hemispheric differences in frontal and parietal influences on human occipital cortex: direct confirmation with concurrent TMS-fMRI. J Cogn Neurosci. 2009;21:1146–1161. doi: 10.1162/jocn.2009.21097. [DOI] [PMC free article] [PubMed] [Google Scholar]
- Seghier M, Dojat M, Delon-Martin C, Rubin C, Warnking J, Segebarth C, Bullier J. Moving illusory contours activate primary visual cortex: an fMRI study. Cereb Cortex. 2000;10:663–670. doi: 10.1093/cercor/10.7.663. [DOI] [PMC free article] [PubMed] [Google Scholar]
- Sterzer P, Kleinschmidt A. A neural basis for inference in perceptual ambiguity. Proc Natl Acad Sci U S A. 2007;104:323–328. doi: 10.1073/pnas.0609006104. [DOI] [PMC free article] [PubMed] [Google Scholar]
- Suzuki S, Grabowecky M. Long-term speeding in perceptual switches mediated by attention-dependent plasticity in cortical visual processing. Neuron. 2007;56:741–753. doi: 10.1016/j.neuron.2007.09.028. [DOI] [PubMed] [Google Scholar]
- Vinberg J, Grill-Spector K. Representation of shapes, edges, and surfaces across multiple cues in the human visual cortex. J Neurophysiol. 2008;99:1380–1393. doi: 10.1152/jn.01223.2007. [DOI] [PubMed] [Google Scholar]
- von der Heydt R, Peterhans E, Baumgartner G. Illusory contours and cortical neuron responses. Science. 1984;224:1260–1262. doi: 10.1126/science.6539501. [DOI] [PubMed] [Google Scholar]
- Wolpert I. Die Simultagnosie: Störung der Gesamtauffassung. Zeitschrift für Gesamte Neurologie und Psychiatrie. 1924;93:397–415. [Google Scholar]
- Yantis S, Serences JT. Cortical mechanisms of space-based and object-based attentional control. Curr Opin Neurobiol. 2003;13:187–193. doi: 10.1016/s0959-4388(03)00033-3. [DOI] [PubMed] [Google Scholar]
- Yokoi I, Komatsu H. Relationship between neural responses and visual grouping in the monkey parietal cortex. J Neurosci. 2009;29:13210–13221. doi: 10.1523/JNEUROSCI.1995-09.2009. [DOI] [PMC free article] [PubMed] [Google Scholar]
- Zaretskaya N, Thielscher A, Logothetis NK, Bartels A. Disrupting parietal function prolongs dominance durations in binocular rivalry. Curr Biol. 2010;20:2106–2111. doi: 10.1016/j.cub.2010.10.046. [DOI] [PubMed] [Google Scholar]
- Zhang NR, von der Heydt R. Analysis of the context integration mechanisms underlying figure-ground organization in the visual cortex. J Neurosci. 2010;30:6482–6496. doi: 10.1523/JNEUROSCI.5168-09.2010. [DOI] [PMC free article] [PubMed] [Google Scholar]
- Zhou H, Friedman HS, von der Heydt R. Coding of border ownership in monkey visual cortex. J Neurosci. 2000;20:6594–6611. doi: 10.1523/JNEUROSCI.20-17-06594.2000. [DOI] [PMC free article] [PubMed] [Google Scholar]