

Abstract
Information processing in behaving animals has been the target of many studies in the striatum; however, its dynamics and complexity remain to a large extent unknown. Here, we chronically recorded neuronal populations in dorsal striatum as mice were exposed to a novel environment, a paradigm which enables the dissociation of locomotion and environmental recognition. The findings indicate that non-overlapping populations of striatal projection neurons—the medium spiny neurons—reliably encode locomotion and environmental identity, whereas two subpopulations of short-spike interneurons encode distinct information: the fast spiking interneurons preferentially encode locomotion whereas the second type of interneurons preferentially encodes environmental identity. The three neuronal subgroups used cell-type specific coding schemes. This study provides evidence for the existence of parallel processing circuits within the sensorimotor region of the striatum.
Introduction
Exposing animals to a novel environment generates exploratory behavior enabling a fast and efficient familiarization process. Two processes are essential for successful familiarization: (1) context identification to signal an unfamiliar environment to the animal and (2) exploratory locomotor activity during the familiarization process. These components are behaviorally dissociable because internally generated locomotion undergoes habituation as the animal familiarizes itself with the environment, whereas environment identity signaling remains unchanged as long as the animal stays in a given environment. Previous studies have shown that higher dopamine levels in dopamine transporter knock-out mice lengthen the half-time of the habituation process compared with wild-type mice (Giros et al., 1996), suggesting involvement of the basal ganglia in the process. Another study in the same mouse model revealed alterations of activity of dorsolateral striatal neurons in relation to the animal's dopamine-induced states of hyperkinesia and akinesia (Costa et al., 2006). However, to the best of our knowledge neuronal activity directly linked to locomotion and the encoding of environment identity has never been addressed.
Many studies have implicated the involvement of the striatum in motor-related and cognitive functions including motor skill learning, action selection, and the formation of cue-action associations (Mink, 1996; Miyachi et al., 1997; Jog et al., 1999; Yin et al., 2004; Kimchi and Laubach, 2009; Humphries and Prescott, 2010). In particular, a few studies have directly linked striatum to locomotion (Mary Christopher and Butter, 1968; Giros et al., 1996; Chang et al., 2006). Striatal neurons provide a suitable substrate for these functions by responding during multiple events including voluntary movement and task-relevant sensory contextual cues (Aldridge et al., 1980; Rolls et al., 1983; Hikosaka et al., 1989; Kimura et al., 1990; Apicella et al., 1992; Romo and Schultz, 1992; Schultz et al., 1992; Hollerman et al., 1998; Gdowski et al., 2001; O'Doherty et al., 2004; Baufreton et al., 2009; Hori et al., 2009).
The rodent striatum consists of 95% projection neurons, the medium spiny neurons (MSNs), and a few types of interneurons (Kawaguchi, 1993; Kawaguchi et al., 1995). The MSNs, which form a weakly connected GABAergic network (Jaeger et al., 1994; Tunstall et al., 2002; Koos et al., 2004), are thought to be modulated by these relatively rare (∼5%) interneurons (Koós and Tepper, 1999; Tepper and Bolam, 2004).
The parvalbumin-containing fast spiking interneurons (FSIs) were studied extensively (Berke, 2011), whereas other GABAergic interneurons have been described in the literature but have never been studied in behaving animals.
Here, we used chronic electrophysiological recordings in the mouse striatum to investigate striatal information processing during exposure to a novel environment. We show that multiple neuronal types could be differentiated, which enabled us to probe the contributions of the MSNs, the FSIs, and another type of short spike interneurons (referred to as UINs) to locomotion and environmental identification. The results show that the MSNs reliably encode both paradigm attributes as expected from projection neurons; however, the MSNs encoding locomotion and the MSNs encoding environmental identification are distinct and do not overlap. In contrast, the FSIs preferentially encode locomotion whereas the UINs preferentially encode environmental identification.
Materials and Methods
Animals
All procedures were approved by the Bar-Ilan University Animal Care and Use Committee and performed in accordance with the National Institutes of Health (NIH) guidelines. We used 10 B6C3F1 (3–7 months old) resulting from the cross between c57B6/J female and C3H male (Jackson Laboratories). All animals were maintained on a 12/12 h light/dark cycle and had ad libitum access to food and water. Experiments were performed during the light phase.
Behavior and locomotion
Each mouse was individually housed in a clean cage with a small amount of bedding for 24 h to familiarize the animal with its cage and induce the sensation of a home cage (HC). The cage cover was opened, and the mouse was connected to the head stage, and was kept this way for at least 30 min before the start of the experiment to enable habituation to the recording wires and the experimenter's presence. Each experimental session included 5 min in the HC, and 10 min in the novel environment that was a clean cage identical to the home cage in size and amount of bedding but lacking familiar odors, after which the animal was transferred back to its HC for an additional 5 min. The home cage and novel environment cage were switched in place such that all identity cues in the room remained unchanged. The short transition periods between the environments were removed from the analysis. Sessions were repeated once a week for 5 consecutive weeks. A gridline measuring 8.5 × 7 cm2 placed underneath the cage (17 × 29 × 14 cm3, for width, length, and height, respectively) divided the cage into eight squares a little larger than the animal's body size. Locomotion was estimated by counting the number of gridline crossings made by the animal. In seven of the animals, gridline crossings were counted in time windows of 2.5 min, and in three of the animals the experimenter pressed a counter that was automatically time stamped by the recording system enabling a more accurate evaluation of locomotion.
Surgery
The surgical procedure has been described in detail previously (Costa et al., 2004). In brief, an ∼2 × 1 mm2 craniotomy was made 2–3 mm laterally for dorsolateral striatum (DLS); custom made microwire arrays (4 × 4 or 4 × 8 arrays of S-isonel-coated tungsten microwires of 35 or 50 μm in diameter) were lowered from the surface of the brain 2–2.2 mm (Hof et al., 2000) while recording neural activity. The electrodes were aimed at the dorsolateral striatum which is the sensorimotor region of the striatum. Final placement of the electrodes was decided based on the coordinates and quality of neural activity and confirmed histologically after electrolytic marking lesions, perfusion with 10% formalin, and brain fixation with 20% sucrose and formalin, followed by cryostat sectioning of 60 μm thick slices.
Data collection
We chronically recorded neural activity from the DLS using microwire arrays. Neural activity was amplified, bandpass filtered at 150–8000 Hz, and sampled at 40 kHz using a multichannel acquisition processor system (MAP system; Plexon). The activity was initially sorted online; however, all waveforms exceeding a selected threshold were saved for offline sorting (OfflineSorter V2.8.8; Plexon). Only confirmed single units with a signal-to-noise ratio above 3:1 were further analyzed using custom-written MATLAB software (R2010b, MathWorks). During the sorting procedure we made sure that a single neuron is not included in the analysis twice. Overall, we recorded 233 single neurons in 10 mice with an average of ∼6 neurons per session.
Data analysis
Paradigm-related neurons.
The experimental session was divided into time bins of 2.5 min, thus creating two baseline (BL) epochs: BL1 and BL2, four novel environment (NE) epochs: NE1 to NE4, and two home cage epochs: HC1 and HC2. For each neuron, firing rate distributions were calculated per time epoch by measuring the number of spikes occurring in 5 s bins, resulting in 30 samples of firing rate in each time epoch. To test whether a neuron significantly changed firing rate in relation to the paradigm, the six firing rate distributions (NE1 to HC2) were compared with the BL-firing distribution (BL1 and BL2 taken together) using a multiple-comparison ANOVA with p < 0.01.
Neuronal classification.
To search for parameters that best differentiated the different cell types, we ran principal component analysis (Pearson, 1901) over a wide range of parameters and selected the three parameters explaining the largest variance. The tested parameters were as follows: (1) the mean firing rate at baseline calculated as the number of spikes that occurred during BL divided by baseline duration; (2) the coefficient of variation (cv) defined as the SD of the ISI distribution divided by its mean; (3) the CV2 defined as the difference between two consecutive ISIs divided by their mean; (4) the skewness of the ISI distribution; (5) the Fano Factor defined as the variance of the spike count distribution calculated in non-overlapping time windows, divided by its mean (window duration equals the median ISI of each neuron); (6) the ratio between the spike peak amplitude and the valley to peak amplitude; (7) spike width at half minimum (μs); (8) spike width at half maximum (μs); (9) spike duration, i.e., the duration in μs between the spike valley to the following peak; (10) number of bursts per second (Jin and Costa, 2010); (11) percentage of spikes within a burst (Jin and Costa, 2010); (12) postspike suppression, which was defined as the earliest latency at which the rate equaled the average firing rate in the autocorrelation described below (Schmitzer-Torbert and Redish, 2008); (13) the absolute difference between the mean and median of the ISI distribution; and (14) PROPISI > 2 s defined below (Schmitzer-Torbert and Redish, 2008). The parameters explaining the largest variance turned out to be firing rate and waveform duration [as in the study by Berke et al. (2004)], and PROPISI > 2 s [as in the study by Schmitzer-Torbert and Redish (2008)].
Autocorrelation function.
Postspike suppression was measured for each cell by calculating the cell's autocorrelation function in a 1 s window using 1 ms time bins, smoothing it using a 25 ms Hamming window, and counting the number of bins from spike occurrence until regaining average firing rate. This measure reflects the refractory period of a neuron.
PROPISI > 2 s.
To differentiate phasic and tonically firing neurons, the proportion of time associated with long interspike-intervals (ISIs > 2 s) was calculated as in the studies by Schmitzer-Torbert and Redish (2008) and Gage et al. (2010) by summing ISIs longer than 2 s and dividing the sum by the total recording time.
Poisson-like surrogate data.
Pseudo-neurons with spike trains drawn from a Poisson distribution were calculated using the following equation: t(i+1) = t(i) − (1/r)log(u) u ∈ U(0,1), where t(i+1) is the time of the ith+1 spike, t(i = 0) = 0, r is the average firing rate of the neuron, and u is a randomly selected parameter from the uniform distribution U(0,1). The number of generated pseudo-neurons equaled the number of neurons in each of the subgroups and matched their individual firing rates.
Root means square error.
The root means square error (RMSE) was used to measure the distance between all the neurons in a group and their average neuron. The RMSE was calculated by taking the square root of the sum of squares of the difference between the firing rates of each neuron and the average neuron using 100 ms bins. The RMSE of each neuronal class was normalized by the average firing rate of its average neuron to enable the comparison of neuronal types having different firing rates. To statistically compare the normalized RMSE between the sampled cells and the pseudo-neurons, a two-way ANOVA was used (three neuronal classes and two conditions of sampled vs pseudo neurons), with post hoc comparison using a Bonferroni adjustment.
Approximation of locomotion.
The linear regression model equation was as follows: behavior = a0 + a1FRMSN + a2FRFSI + a3FRUIN, where FRMSN, FRFSI, and FRUIN are 8-point vectors comprising the normalized firing rates in 2.5 min time bins of the MSNs, FSIs, and UINs, respectively. The behavior was the average number of gridline crossings in these time bins, and a0–3 are the estimated regression coefficients. The coefficients were chosen by the constraint of minimizing the least square error of the model, thus providing the best approximation. To avoid imbalance in the contribution of each cell type, the vectors of the average neurons and the behavior were normalized.
We found that the locomotor activity was best approximated by the following equation: behavior = −1.24 + 5.26FRMSN − 0.68FRFSI − 0.25FRUIN.
The linear regression of locomotor activity by the firing rate of the average neuron was calculated using the regress function in MATLAB software (R2010b, MathWorks).
Locomotion-correlated MSNs.
A Pearson correlation coefficient was calculated between the firing rate of each neuron and the animal's gridline crossings in 2.5 min bins, and tested for significance using a t test with the null hypothesis of lack of correlation [corrcoef function in MATLAB software (R2010b, MathWorks)].
Support vector machine algorithm.
The support vector machine (SVM) algorithm (Boser et al., 1992) was used to evaluate whether contextual information enabling the animal to distinguish between its home cage and the novel environment could be extracted based on the firing profile of individual neurons. For each neuronal subpopulation, a matrix of firing rates in 5 s bins of all neurons was generated. The matrix size was 240 (20 min/5 s) values of firing rates versus the number of selected neurons. Based on the firing properties, the SVM algorithm classified the animals' surroundings as the home cage (= 0) or as the novel environment (= 1). In each calculation, 75% of the bins (i.e., 180 vectors each containing the firing rates of all selected neurons in the same time bin) were used as a training set whereas the remaining bins were used as a test set. The algorithm libsvm was taken from the study by Chang et al. (2011) (software available at http://www.csie.ntu.edu.tw/∼cjlin/libsvm). We used a linear kernel and a penalty term in case of error of C = 10 (C = 1 and C = 100 were also tested and showed no influence on classifier performance). We quantified the output of the algorithm by using the accuracy value defined as the number of bins out of the test set (60 bins) that identified the context correctly. SVM algorithms are highly sensitive to the number of variables (neurons) used; therefore, we balanced the number of degrees of freedom as determined by the number of recorded UINs (21) by selecting 21 neurons from the MSNs and FSIs. Overall, for each random sample of 21 neurons, we repeated the algorithm 50 times with different training sets and test sets, and the resulting accuracy values were averaged. An accuracy distribution histogram was built for the MSNs and FSIs using 3000 repetitions of this procedure each time with a different set of randomly selected 21 neurons. The algorithm was calculated for the UINs using 1000 repetitions of the same group of 21 neurons using different training and test sets.
The average likelihood of a neuron to appear in any permutation was calculated by summing the number of permutations in which the neuron appeared and dividing it by the total number of permutations. Averaging the likelihood over all the neurons yielded the expected value assuming randomness in sampling the different neurons.
Context-dependent MSNs.
Chance level for MSN accuracy values was calculated by repeating the SVM algorithm 100 times using the Poisson-distributed pseudo-neurons with firing rates matching the MSNs. Chance level was taken to be the average of the calculated accuracy distribution (50.2%), and the significance value was 2 SDs above chance level (61.5%). MSN accuracy values exceeding significance value were considered context-dependent neurons.
Calculating the distribution to have an overlap of i = 1,2,…,19 when randomly selecting two groups of 22 and 19 neurons from a total of 110 neurons was done by a Matlab simulation randomly selecting 10,000 permutations of 22 and 19 out of 110 neurons and comparing the overlap between each random selection and all other selections.
MSN firing rates during locomotion in the NE and HC.
In three of the animals, the gridline crossings were recorded with higher accuracy, enabling the calculation of neuronal firing rates during graded values of locomotion. In each session, the gridline crossing values were divided into two halves with the maximum determined per session by the highest value of gridline crossings occurring in both environments. The average firing rate during the upper half of the gridline crossing values was calculated for each neuron in each environment independently. Data presented in Figure 6C include all recorded neurons with at least three samples of high gridline crossings in each environment. Similarly, firing rates during bins in which gridline crossings were not recorded were calculated separately for the HC and the NE.
Figure 6.
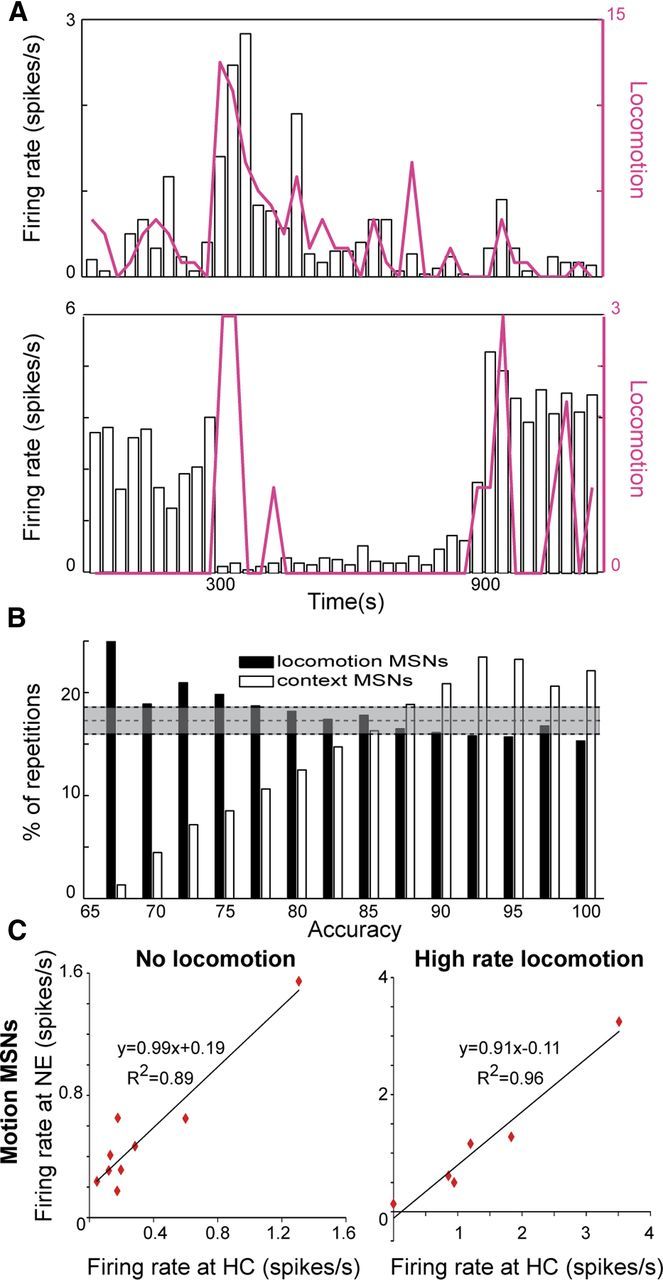
Distinct groups of MSNs convey locomotion and contextual information. A, MSNs were found to modulate their firing with the animal's locomotion (top) and the environmental identity (bottom). B, Comparison of the sampling distribution of the locomotion-correlated MSNs and the context-dependent MSNs averaged over all permutations per accuracy value. The context-dependent MSNs contributed the most to the high accuracy values generated by the SVM algorithm whereas the locomotion-correlated MSNs were evenly distributed at chance level over different accuracy values indicating their limited contribution to the algorithm's performance. Gray area marks chance level ± 2*SD. C, The firing rate of locomotion correlated MSNs was independent of environmental identity. Left, Comparison of firing rates calculated in bins lacking locomotion in the NE and the HC. Linear fit (p < 0.01) suggests that MSN firing rates remained unchanged when the animals were positioned in the NE or the HC. Right, Firing rates calculated during high levels of locomotion (see Materials and Methods) of locomotion-correlated MSNs were similar in the NE and the HC.
Results
Behavior
In the present study, 10 mice (B6C3F1, 3–7 months old) were exposed to a novel environment, a behavioral paradigm inducing exploratory behavior that degrades with time as the animal familiarizes itself with the environment (Costa et al., 2006; Kalueff et al., 2006; Berke et al., 2008). Each session comprised 5 min in the home cage (BL) after which the animal was transferred to the NE, a cage identical to the home cage but lacking familiar odors or objects (Fig. 1A). After spending 10 min in the NE the animal was transferred back to its HC for an additional 5 min to assess whether after exposure the animal perceived its home cage differently. Sessions were repeated once a week for five consecutive weeks per animal. Each time epoch within a session was characterized by typical behaviors exhibited by all animals: during BL animals mostly stayed in a preferred corner and sporadically explored the cage; when transferred into the NE, mice excessively explored the unfamiliar cage reaching all ends of the cage and then gradually ceased exploration (Fig. 1B,C); when transferred back into the HC, mice initially explored the environment reaching short distances from their preferred corner for a relatively short time and then repeated BL performance. Because the time scale of the paradigm was determined by the experimenter, the behavioral events in all animals could be aligned and averaged over all experiments. Throughout the sessions animals occasionally sniffed and groomed; however, the irregularity in these incidents resulted in their elimination from the analysis while leaving the repetitive active exploration component intact. The animal's active exploration was assessed by counting the number of gridline crossings in 2.5 min bins, a measure reflecting the animal's average horizontal propagation (locomotion) per time epoch (see Materials and Methods). The time course of the animals' locomotion rate showed that on average during BL epoch the animals hardly moved in the cage; during NE epoch mice initially moved fast in the unfamiliar cage and then gradually ceased; and during HC epoch, the mice initially moved in the cage but slower than in the NE epoch and then stopped (Fig. 1B,C). Statistics show a main effect for time and animal but not for experiment [a three-way ANOVA (time, animal and experiment); p < 0.01], suggesting that in this paradigm animals do not exhibit experience-dependent adaptation (Fig. 1B) and the results were averaged over weeks (Fig. 1C). Post hoc examination revealed that the number of gridline crossings in the first quarter of the NE (NE1) was significantly higher compared with all other time epochs and the number of crossings during BL was significantly lower than other time epochs excluding NE4 (multiple comparisons with Tukey–Kramer adjustment; p < 0.01).
Figure 1.
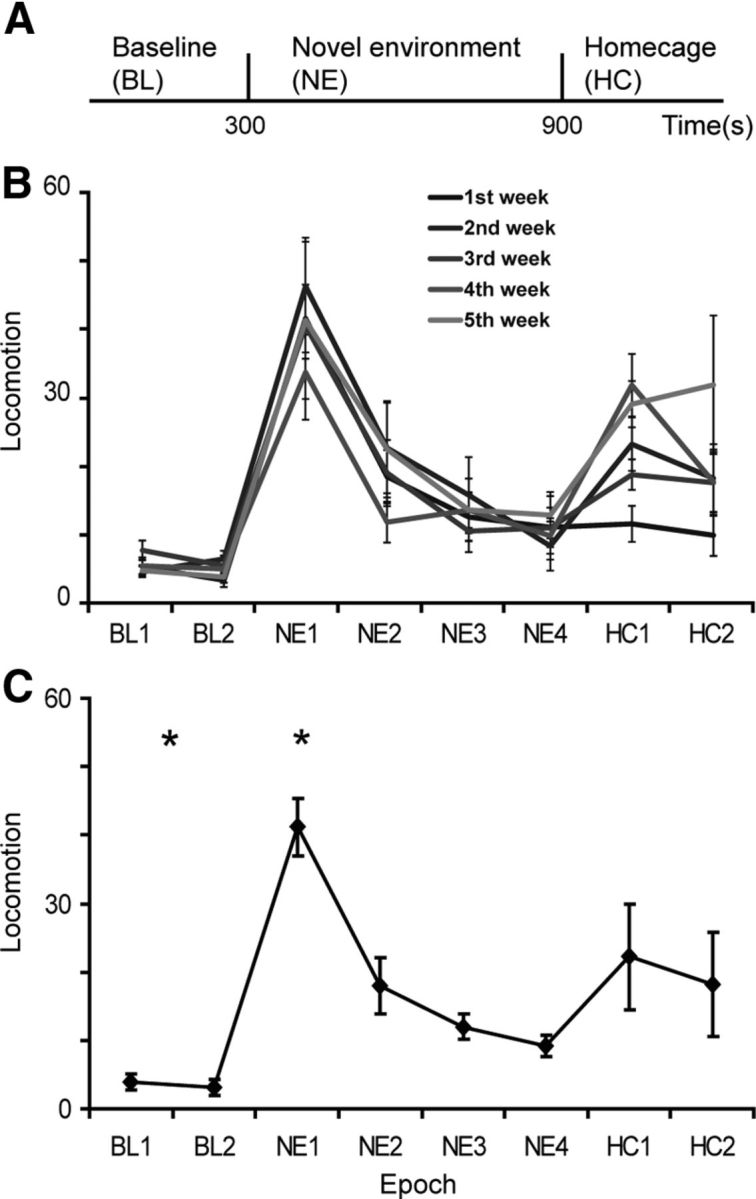
Behavioral characteristics during novel environment exposure. A, Experimental timeline of each session. B, Weekly average of the number of gridline crossings per 2.5 min bins. C, Average over all sessions and animals of the number of gridline crossings in 2.5 min bins. Error bars are confidence intervals of the mean (2*SEM).
Cell classification
Throughout the sessions we chronically recorded using microwire arrays the activity of 233 single units in 10 mice (47.2 ± 13.3 per weekly sessions). The electrodes were implanted in the dorsolateral region of the striatum extending 2 mm rostrocaudally and 1 mm mediolaterally (AP = −0.7–1.3; ML = 2–3). The location of the electrode tips was verified histologically (see example in Fig. 2A; see Materials and Methods). The waveform duration, firing rate, and percentage of time spent in long ISIs (see Materials and Methods) of each recorded neuron were measured and presented in a three-dimensional plot that revealed four distinct clusters each representing a different cell type (Fig. 2B).
Figure 2.

Striatal neurons exhibit unique characteristics enabling their classification into distinct cell types. A, Electrode arrays were positioned in the mouse dorsolateral striatum. An example of electrode placement marked with an electrolytic lesion in a 60 μm coronal slice. B, 3D scatter plot of waveform parameters and firing characteristics of sorted single neurons (n = 233) showing 4 distinct clusters, each corresponding to a different striatal cell type. MSNs (n = 110) were marked in red, FSIs (n = 94) were marked in blue, TANs (n = 8) were marked in green, and UINs (n = 21) were marked in cyan. The parameters used for the classification of each cell type appear in Table 1. C, The average waveform of the MSNs (top), FSIs (middle), and UINs (bottom) showing the similarity in waveform parameters between the FSIs and UINs. D–F, Examples of typical autocorrelation functions calculated in 1 ms bins for a FSI (D), an MSN (E), and a UIN (F). The MSN autocorrelation has a clear peak in the short ISIs indicating its tendency to exhibit burst activity. This peak is lacking in the UIN autocorrelation function despite having similar firing rates of ∼2.5 spike/s.
Three of the clusters (marked in red, blue, and green; Fig. 2B) were readily identified as MSNs, FSIs, and TANs, respectively, based on their properties reported previously (Wilson et al., 1990; Aosaki et al., 1995; Bennett and Wilson, 1999; Berke et al., 2004; Lin et al., 2006; Miller et al., 2008; Schmitzer-Torbert and Redish, 2008; Sharott et al., 2009; Yarom and Cohen, 2011). The MSN cluster comprised 110 neurons (47% of the recorded cells) and exhibited phasic firing (PROPISI > 2 s > 37%), long waveforms (504.54 ± 23.26 μs), and low firing rates. The FSI cluster comprised 94 neurons (40% of recorded cells) and exhibited continuous firing with a few short intermissions (propISI > 2 s < 20%), short symmetric waveform (191.03 ± 71.34 μs), and high firing rate (10.83 ± 7.06 spikes/s). The TAN cluster exhibited tonic firing with an average firing rate of 8.0 ± 2.9 spikes/s, long duration spikes (518.7 ± 43.8 μs), and PROPISI > 2 s < 12%. However, this group contained only eight neurons and therefore was excluded from further analysis. The fourth cluster (marked in cyan; Fig. 2B) comprised 21 neurons (9% of recorded cells) and had firing attributes similar to MSNs; i.e., phasic firing (PROPISI > 2 s > 37%) with low firing rate (1.98 ± 0.97 spikes/s), yet their spike waveform was similar to that of the FSIs (197.61 ± 92.5 μs; Fig. 2C). Although the fourth cluster was clearly distinct from the other clusters it could be that this group is the tail of the FSIs. To avoid introducing such a bias into the analysis, we referred to this group of neurons as the unidentified interneurons (UIN) and analyzed the data independently of the MSNs and FSIs. The underlying assumption was that if the UINs were the tail of the FSIs or the MSNs, then their behavioral attributes would be similar to that of the FSIs or the MSNs, respectively, whereas if the UINs would exhibit behavioral attributes distinct from those of the FSIs and MSNs then they constitute a separate group of interneurons. Overall, many firing pattern parameters including the autocorrelogram shapes (Fig. 2D–F), CV2, and the percentage of spikes in a burst (see Table 1) differentiated the three subgroups providing evidence that the UINs constitute a separate neuronal group.
Table 1.
The neuronal subgroups exhibited different characteristics
| Cell type | MSNs (47%) | FSI (40%) | UIN (9%) | TANs |
|---|---|---|---|---|
| Firing rate at BL (spikes/s) | 1.02 ± 0.92 | 10.83 ± 7.06* | 1.98 ± 0.97 | 8.0 ± 2.9 |
| Valley to peak duration (μs) | 504.54 ± 23.26* | 191.03 ± 71.34 | 197.61 ± 92.5 | 518.7 ± 43.8 |
| PROP ISI > 2 s | >37% | <29% | >37% | <12% |
| CV2 | 1.28 ± 0.13 | 0.82 ± 0.17* | 1.08 ± 0.16 | 0.65 ± 0.13 |
| % spikes in a burst | 34 ± 13.4% * | 19 ± 9.2% | 23 ± 8.6% | 15 ± 5.4% |
Neuronal characteristics of the MSNs, FSIs, and UINs were statistically compared using ANOVA followed by Tukey–Kramer correction for multiple comparisons.
*p < 0.01; data presented as mean ± SD.
Different cell types exhibit distinct response patterns
To directly test whether the behavioral attributes of the UINs are similar to or distinct from the FSIs and MSNs, we analyzed and compared the response patterns of all recorded neurons. Within a session the recorded neurons exhibited a variety of firing patterns including increasing and decreasing firing rate during different behavioral epochs (Fig. 3A). To sort the neurons based on their firing patterns, a firing rate distribution was calculated in 5 s bins for each behavioral epoch within a session (i.e., BL1-2, NE1-4, and HC1-2). The firing rate distributions of each neuron were statistically compared to determine whether the neuron significantly changed firing rate during the session (see Materials and Methods). This yielded a six component response-vector for each neuron with values of 1, −1, or 0, indicating whether we observed a significant increase in firing rate, a significant decrease in firing rate or no significant change in firing rate compared with base line firing, respectively. Overall, 56% (127/225) of the neurons changed their firing rate during at least one behavioral epoch compared with BL. To enable the comparison between the various response patterns we classified the neurons based on their firing patterns into five dominant categories: “total responsive,” “transition,” “NE,” “HC,” and “nonspecific.” The total responsive category included neurons that significantly changed firing rate relative to BL throughout the entire paradigm (n = 20; 16%; Fig. 3B, light yellow). The transition category included neurons that significantly changed firing rate relative to BL when the animal was transferred into the NE or transferred back into the HC or both (n = 48; 38%; Fig. 3B, light blue). The NE category included neurons that significantly changed firing rate relative to BL while the animal was in the NE but returned to BL firing when placed back in the HC (n = 9; 7%; Fig. 3B, yellow), and the HC category included neurons that significantly changed firing rate relative to BL when placed back in the HC (n = 6; 5%; Fig. 3B, red). The nonspecific category included neurons that significantly changed firing rate relative to BL in at least one behavioral epoch that was not included in the other categories (n = 44; 35%; Fig. 3B, green).
Figure 3.

The recorded neurons were classified into 5 distinct categories of firing patterns. A, Firing rate histograms calculated in 5 s bins for the entire period of a session. Left, An example of a FSI that significantly increased firing rate relative to BL when transferred into the NE. This neuron maintained the same firing rate even when placed back at the home cage. Middle, An example of a MSN that significantly decreased its firing rate relative to BL only when the animal remained in the NE. Right, An example of an UIN that significantly increased its firing rate when the animal was placed back at its home cage. The red lines mark the transition times from the HC to the NE and then from the NE back to the HC. B, Firing rate distributions calculated in 5 s bins for each behavioral epoch lasting 2.5 min. Five neurons representative of the different categories of distinct firing patterns and 1 nonresponsive neuron are shown. The color code for the different categories appears in the lower right panel of the figure. The top 3 neurons are the same neurons as in A. Error bars are SDs. C, Firing pattern distributions of the different neuronal groups including all the recorded neurons. Significant differences were found between the three groups (χ2 test with p < 0.01). D, Firing pattern distributions of the different neuronal groups including all the responsive neurons. Significant differences were found between the three groups (χ2 test with p < 0.01).
Examination of the firing pattern category distribution showed that the different types of neurons, MSNs, FSIs, and the UINs, exhibited significantly different distributions (χ2 test, p < 0.01; Fig. 3C). The majority (58%) of the MSNs were nonresponsive whereas smaller fractions of the FSIs and UINs were nonresponsive (30% and 24%, respectively). Furthermore, a relatively large percentage (24%) of the UINs was classified into the HC and NE categories compared with a negligible fraction of the FSIs (2%). To test whether this may have been the result of sampling bias we selected a subset of FSIs and MSNs as similar as possible in number and properties to the UINs (i.e., we chose FSIs with low firing rate and MSNs with equal PROPISI > 2 s distributions as the UINs) and tested their firing pattern distributions. Repeated comparisons of the selected subset of neurons showed that their category distributions remained significantly different, as was the case for the complete sample (χ2 test, p < 0.01). These results provide further evidence that the UINs are not the tail of the FSI or MSN populations and instead they were sampled from an independent neuronal population.
The fact that different cell types exhibited a preference for specific firing pattern categories suggests that each cell type encodes different variables during the performance of the novel environment exposure paradigm. To test this hypothesis, we examined whether we could extract information related to two attributes—locomotion and context identity—from the recorded neurons. First, we determined the capacity of the three neuronal populations to encode locomotion and context identity and then we assessed whether single MSNs encode both attributes or are dedicated to the encoding of only one.
Populations of MSNs and FSIs approximate locomotion significantly better than UINs
To determine how well the different neuronal subgroups encoded locomotion we calculated and compared the precision with which they enabled estimation of the animals' locomotion. The contribution of each neuronal population was represented by the average activity of all its neurons: (1) to eliminate neuronal activity related to various sporadic behaviors while preserving locomotion related activity which was common to all animals; and (2) to minimize the bias expected from the groups' sample sizes. The average response of each cell type exhibited a clear peak in activity during the transitions into the NE and back to the HC (Fig. 4A). Nonetheless, the patterns of activity clearly differed between cell types in terms of response strength and the shape of the degradation observed in the novel environment. We therefore used a simple linear regression model to estimate how well the average neuron of each cell type corresponded to the average locomotion (see Materials and Methods). When the model comprised all cell types, the animal's locomotion could be approximated very well (Fig. 4B, gray line; R2 = 0.95; mean squares error = 0.005). The regression coefficient of the MSNs was an order of magnitude larger than that of both interneurons, suggesting that the greatest contribution was from the MSNs. Interestingly, the coefficients of the interneurons were negative, which could reflect their inhibitory role in controlling the MSN response.
Figure 4.
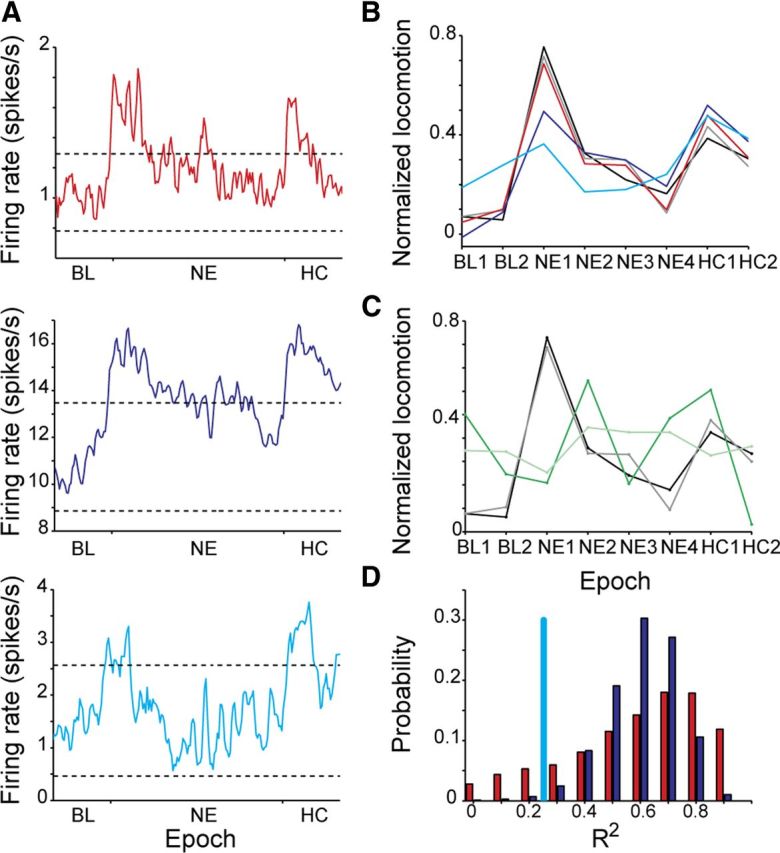
The MSNs and FSIs approximate locomotion significantly better than the UINs. A, The time courses of the average neuron of the MSNs (red), FSI (blue), and UIN (cyan) calculated using all recorded neurons within each cell-type. Dashed lines represent mean firing rate at baseline ±2*SD. B, Linear regression analysis using the firing pattern of the average neuron shows that both MSNs and FSIs estimate locomotion significantly better than the UINs. The black line is the normalized average locomotion over all animals and experiments. The colored lines are the results of the linear regression using the average neuron of all cell types (gray), MSNs (red), FSIs (blue), and UINs (cyan). The regression using the UINs was not significant. C, The linear regression model did not perform well when locomotion vectors were randomly drawn from a distribution having the same average and SD as the measured locomotion. Shown is an example of a randomly selected locomotion vector (green) and the linear regression result using the average neuron of all cell groups (light green). The black and gray lines are the same as in B. D, Distribution of R2 values calculated using 10,000 repetitions of the linear regression model in which each time n = 21 MSNs (red) or n = 21 FSIs (blue) were randomly drawn. The R2 value of the regression analysis using the sampled UINs (n = 21) is shown in cyan.
To control whether the approximated locomotion was not a chance result we generated 10,000 locomotion vectors randomly selected from a normal distribution with the same mean and variance as the original locomotion vector. For each vector we calculated the best regression coefficients and R2 as described above (see example in Fig. 4C). The average R2 for the random vectors was 0.44 ± 0.23 and the probability of obtaining values higher than 0.95 was <0.01 indicating that the quality of approximation obtained by the model could not have been achieved by chance.
To compare the contributions of each cell type, we calculated a linear regression model using one cell type at a time (Fig. 4B). As expected, the average activity of the MSNs provided the best approximation of the animals' locomotion (R2 = 0.93; p < 0.01; red line). The average activity of the FSIs also approximated locomotion significantly better than chance level (R2 = 0.7; p < 0.01; blue line), although not as well as the MSNs. In contrast, the UINs approximated the animals' locomotion quite poorly (R2 = 0.25; p > 0.2). To calculate the probability of drawing a sample of 21 neurons that would poorly approximate locomotion as did the UINs, we independently sampled 10,000 permutations of 21 MSNs and 21 FSIs and calculated the R2 values of their regression (Fig. 4D). Examination of the R2 distributions showed that the probability of sampling 21 FSIs with R2 equal to or lower than that of the 21 UINs was <0.01, suggesting that the UIN subgroup was significantly worse than the FSIs in conveying locomotion related information and that the UINs poor performance could not have been due to sampling bias. The probability of sampling 21 MSNs giving R2 equal to or lower than that of the 21 UINs was 0.13, suggesting that some of the MSNs encoded locomotion reliably whereas others did not. Our results show that both FSI and MSN subgroups encoded the mouse average locomotion with high precision, whereas the firing of UINs appeared to be insensitive to locomotion.
The MSNs are thought to use a sparse coding scheme because each MSN responds to a limited range of stimuli with a short burst of activity; however, the MSNs were best at approximating locomotion. To test whether the MSNs use a different coding scheme than sparseness during exposure to a novel environment we assessed the similarity between the firing rate of each average neuron and its constituents by calculating their RMSE (see Materials and Methods). The RMSE values of the MSNs (4.02 ± 1.97; mean ± SD), the FSIs (1.24 ± 0.40; mean ± SD), and the UINs (3.12 ± 1.61; mean ± SD) were significantly different from one another (Kruskal–Wallis; p < 0.05), suggesting that the firing patterns of individual MSNs were unique whereas the firing patterns of individual FSIs were relatively similar. To better assess the extent of variability of the firing patterns of each neuronal type and to ensure that this result was not due to an order of magnitude difference in the average firing rates of the three subgroups (FSIs, ∼15 spikes/s; the MSNs and UINs, ∼1 spikes/s) we generated Poisson-distributed pseudo-neurons with similar average firing rates as the neurons in each subgroup (see Materials and Methods). Comparison of the RMSE results for the sampled and the artificially generated data (RMSE values of 2.75 ± 1.18, 2.78 ± 1.19, and 2.86 ± 0.89 for pseudo-MSNs, pseudo-FSIs, and pseudo-UINs, respectively) showed that the MSN firing patterns were significantly more variable than expected for Poisson neurons with matching firing rates, the UIN firing patterns had a similar variability as their matching Poisson neurons, whereas the FSI firing patterns were significantly less variable than their matching Poisson neuronal group (one-way ANOVA with post hoc Bonferroni adjustment; p < 0.05).
Thus, although the MSNs and FSIs reliably convey information regarding locomotion, they may use different coding schemes; the MSNs use sparse population coding in which the response of individual neurons is unique whereas the firing of individual FSIs is relatively similar to one another, suggesting temporal and spatial redundancy in their activation pattern.
The MSNs and UINs identify contextual information significantly better than the FSIs
The initiation of exploratory behavior in a novel environment relies on the animal's ability to recognize that it had been transferred from a familiar to an unfamiliar environment. Hence, we tested whether striatal neurons process contextual information enabling the animal to differentiate a familiar from a novel environment. Neurons belonging to the NE category are best suited for providing such information because their firing rate is correlated with the animal's location but not correlated with the animal's locomotion (Fig. 5A). However, neurons belonging to other categories may also carry valuable contextual information about the environment. To quantify how well striatal neurons distinguish between the different environments we used SVM to measure the accuracy with which the neuronal subpopulations identify the animal's location based on their firing rates (see Materials and Methods). SVM algorithms are known to be sensitive to the number of degrees of freedom in the problem (i.e., the number of neurons within each subgroup). In our case the number of MSNs (n = 110) and FSIs (n = 94) was ∼5 times larger than that of the UINs (n = 21), which biases the computation and invalidates the population comparison. Therefore, to correctly compare contextual information carried by each subpopulation we repeatedly sampled 21 MSNs and 21 FSIs and ran the previously described computation of the SVM algorithm for each random sample. We repeated this procedure 3000 times to generate an accuracy distribution for each subgroup (Fig. 5B). The average accuracies of the MSNs, FSIs, and UINs were 87.0 ± 7.1%, 88.8 ± 5.0%, and 98%, respectively. Examination of the accuracy distributions showed that the probability of sampling 21 FSIs that would yield accuracies equal to or higher than that of the 21 UINs was p < 0.05 (Fig. 5B), suggesting that although some information regarding context could be extracted from the FSIs it is not representative of this population, whereas the ability of the UINs to convey contextual information seems to represent that population reliably. The probability of sampling 21 MSNs with accuracies equal to or higher than that of the 21 UINs was p = 0.11 (Fig. 5B), suggesting that some of the MSNs may contain contextual information. Our results show that the UINs reliably differentiated the home cage from the novel environment and that they did it significantly better than the FSIs. Importantly, some of the MSNs also differentiated the home cage from the novel environment that may enable them to convey downstream information regarding the environment identity.
Figure 5.

The MSNs and UINs identify contextual information significantly better than the FSIs. A, Neurons were able to modulate their firing in relation to the environmental identity and not the animal's locomotion. The number of gridline crossings in 5 s bins (pink line) overlaid over firing rate histograms calculated in 5 s bins of an exemplary UIN. B, The UINs and the MSNs identify contextual information significantly better than the FSIs. Distribution of SVM accuracy values for 3000 repetitions of random selection of n = 21 MSNs (red) or FSIs (blue). The accuracy value obtained using all the sampled UINs (n = 21) is shown in cyan.
Distinct groups of MSNs convey locomotion and contextual information
A thorough examination of the MSN accuracy distribution (Fig. 5B, red bars) revealed two peaks in the distribution separated at the 95th accuracy percentile suggesting that some MSN combinations are much better at identifying context than other combinations. The bimodal shape of the accuracy distribution may be the outcome of two alternatives that are not mutually exclusive: (1) one subgroup of MSNs contributes both to locomotion approximation and context differentiation, whereas the remaining neurons are indifferent to these behavioral attributes; and (2) one MSN subgroup contributes to locomotion approximation, whereas another subgroup contributes to context differentiation. To directly test which of the alternatives was more plausible we identified MSNs with locomotion correlated activity and those carrying information about the environment identity and examined their degree of overlap. To identify the locomotion-correlated MSNs, we quantified the correlations between neuronal firing rate and locomotion in 2.5 min bins by calculating the correlation coefficient ρ (see Materials and Methods) for each neuron. We found that the firing rates of 22 MSNs (20%) were significantly correlated with the average horizontal movement (i.e., locomotion) (Fig. 6A; p < 0.05). To identify the context encoding MSNs, we repeated the SVM algorithm on each of the MSNs and selected the neurons (n = 19, 17%) that identified the environment significantly beyond chance level (Fig. 6A; see Materials and Methods). These two MSN populations were mutually exclusive. The probability of randomly drawing 22 and 19 neurons out of 110 with 0 overlap is <0.01 and thus lends weight to the second explanation. Because this result was unexpected, we used several methods to further test the hypothesis that distinct MSN populations encode locomotion and context identity.
At the population level, the first explanation entails that the locomotion correlated MSNs carry contextual information and therefore will be prevalent in sampled combinations yielding high accuracy of context identification comparable to context neurons. The second explanation entails that the locomotion correlated neurons should be randomly spread throughout the distribution at chance level whereas the context neurons will be unevenly distributed in terms of high accuracy ranking. A comparison of the prevalence of locomotion-correlated neurons and context-dependent neurons in all permutations within a given accuracy showed that the second explanation is more likely (Fig. 6B; see Materials and Methods).
We tested the validity of the second explanation also by repeating the previously described algorithms using the locomotion-correlated and contextual MSN subgroups. We found that the locomotion correlated MSNs approximated locomotion extremely well (R2 = 0.8; p < 0.01) whereas the context-dependent MSNs did not (R2 = 0.48). In contrast, the locomotion-correlated MSNs distinguished the NE from the HC poorly (accuracy of 63.1 ± 5.5%), whereas the context-dependent MSNs distinguished the NE from the HC extremely well (accuracy of 93.0 ± 3.1%). The differences in performance of the two populations provide further evidence that locomotion and context are processed primarily by parallel MSN populations that do not interact.
The final method used to test the validity of the hypothesis was to directly examine whether the encoding of locomotion by individual MSNs was modulated by the animal's presence in a specific environment. If the encoding of locomotion would be different in the two environments it would indicate that it is within the capacity of this neuron to simultaneously encode locomotion and, even though to a lesser extent, environment identity. To that end we monitored in three mice the instantaneous locomotion by time stamping the animals' gridline crossings directly by the recording system. We then compared firing rates during rest and during locomotion between the NE and HC, predicting that the locomotion neurons would yield similar firing rates in each condition independently of the environment, whereas the context-dependent neurons would yield different firing rates in each environment independently of the conditions. A comparison of firing rates during rest (Fig. 6C, left) and during high rates of locomotion (Fig. 6C, right) showed that firing rates of the locomotion neurons in the NE and the HC were similar in both conditions (high rate locomotion: y = 0.91x − 0.11; R2 = 0.96; no locomotion: y = 0.99x + 0.19; R2 = 0.89). At the same time, the firing rates of the context-dependent neurons in the NE were independent of the firing rates in the HC regardless of whether the animal moved or not (high rate locomotion: y = 0.24x + 1.12; R2 = 0.01; no locomotion: y = 0.06x + 0.63; R2 = 0.01; the null hypothesis that these fits are different than 0 is rejected; p > 0.7). These results provide evidence that the locomotion-correlated and the context-dependent MSNs do not interact, thus suggesting the existence of two functionally distinct MSN populations.
Overall, our data clearly show that distinct, non-overlapping MSN populations encode locomotion and environment identity and that each population specializes in the processing of its unique information with negligible influence from the other type of information.
Discussion
We have shown that during exposure to a novel environment, distinct MSN populations recorded in the mouse DLS correlate with the animal's average locomotion and differentiate between familiar and novel environments. This dissociation in information processing was also present in striatal interneurons: the FSIs conveyed information about locomotion whereas the UINs conveyed information enabling context identification. Our results suggest that the dorsolateral striatum simultaneously processes different types of information that are locally modulated by specific types of interneurons thus, hinting at the existence of parallel processing circuits within the sensorimotor striatum.
Neuronal identification and recording bias
In recent years striatal neurons were successfully classified into distinct cell types based on waveform properties and firing pattern characteristics (Ravel et al., 2001; Berke et al., 2004; Liang et al., 2008; Schmitzer-Torbert and Redish, 2008; Sharott et al., 2009). In this study, three parameters—waveform duration and firing rate as in the study by Berke (2008) and PROPISI > 2 s as in the study by Schmitzer-Torbert and Redish (2008)—created four well separated clusters. The properties of three of the clusters fit those of the MSNs, FSI, and TANs; nonetheless, their sampling probabilities were not representative of the anatomy, thus raising a concern regarding their identification. However, studies that previously identified these neurons in primates (Kimura, 1990; Adler et al., 2012) and in rodents (Berke et al., 2004; Gage et al., 2010; Yarom and Cohen, 2011) report different sampling biases, suggesting that despite the bias the neurons' identification remains valid.
The fourth cluster comprising the UINs did not fit with cell types previously studied in behaving animals. Close examination of their characteristics suggests that this group of striatal interneurons matches a group of neurons referred to as “others” in the study by Berke et al. (2004) that was not analyzed because of their small numbers. Complete separation of the UINs from the FSIs was achieved by adding the PROPISI > 2 s parameter. Moreover, we have shown that the UINs exhibited significantly different response patterns, coding scheme, and responses to context, thus providing further support for their identification as an independent group. In attempt to speculate on the UINs identity two studies seem relevant: (1) an in vivo study in anesthetized rats revealing aspiny neurons that exhibited short duration spike and phasic activation (Inokawa et al., 2010); and (2) whole-cell recordings from Tyrosine Hydroxylase positive (TH+) neurons in mice striatal slices showing that these interneurons exhibit short duration spikes and low firing rate (Ibáñez-Sandoval et al., 2010). Based on the similarity in properties, it is possible that the UINs are the rarely studied GABAergic TH+ interneurons (Dubach et al., 1987; Betarbet et al., 1997).
Neuronal encoding of locomotion
MSN encoding of motion was described many years ago in primates (DeLong, 1972; Alexander and DeLong, 1985; Crutcher and Alexander, 1990). Recent rodent studies have reported that activity in dorsal striatum is correlated with movement velocity and acceleration (Costa et al., 2004; Yeshenko et al., 2004), however, none of these studies have attempted to classify the recorded neurons into distinct cell-types. Circumstantial evidence links FSIs to movement abnormalities: a reduced number of FSIs has been observed in human Tourette syndrome (Kalanithi et al., 2005) and in animal models of dystonia (Gernert et al., 2000); moreover, selective inhibition of FSIs was reported to elicit robust dystonia-like impairments (Gittis et al., 2011). Interestingly, locomotor-correlated activity of FSIs was shown under the influence of psychomotor stimulants and antipsychotic drugs modulating FSI activation (Wiltschko et al., 2010). Here, we demonstrated that both FSIs and MSNs approximated locomotion extremely well and significantly better than the UINs subgroup that failed to approximate the animals' locomotion.
Neuronal encoding of context
Theoretical models have assumed that striatal spiny neurons play a major role in contextual pattern recognition under the training influence of reinforcement signals (Houk and Wise, 1995). In these studies, the interpretation of contextual pattern recognition was broader than simply referencing specific, time limited, short sensory cues such as instruction tones. Environmental context identification has traditionally been attributed to the hippocampus (Sharp et al., 1985; Will et al., 1986; Phillips and LeDoux, 1994; Good and Honey, 1997; Berke et al., 2008; Chang and Liang, 2012). Importantly, hippocampal contextual representations have been shown to impact ventral striatum (Mulder et al., 2004). An interface between different striatal regions via the midbrain dopamine cells enabling information flow from ventral, through central, and up to dorsal striatum has been demonstrated (Haber et al., 2000). Taken together, it is plausible that hippocampal-dependent information regarding the environment identity propagates along this pathway and potentially influences the animal's decision to explore the environment via the dorsal striatum. Alternatively, the source of contextual information could arise from other striatal afferents such as the prefrontal cortex and/or the thalamus.
Sparse coding scheme versus redundant population coding scheme
Although both MSNs and FSIs encoded locomotion, they did so by using completely different coding schemes; the firing patterns of different MSNs were unique whereas the firing patterns of different FSIs were similar to one another. The similarity in FSI activity was previously described in relation to locomotion (Berke, 2011). While it remains plausible that FSIs provide a coordinated broad inhibition of MSNs, the dissimilarity between individual MSN activation necessitates the integration of additional factors such as MSN biophysical properties and/or highly variable converging inputs from the cortex, the thalamus, and other basal ganglia structures.
The MSNs sparse coding was not the outcome of their low firing rates because the UINs that exhibited similar firing rates used a coding scheme similar to Poisson-distributed neurons. Hence it seems that sparse coding is a fundamental trait of the MSNs. Despite this seemingly inefficient coding scheme, the MSN average neuron had the best fit to the locomotor profile of the animals. Consequently, to reliably transfer the processed information downstream, enough MSNs must converge onto a single neuron or a group of neurons in the GP. Given the known convergence ratio between the MSNs and GPe of 60:1 in rats (Oorschot, 1996) and 200:1 in humans (Graveland et al., 1985), and higher ratios to the GPi and SNr, the underlying neural network has the potential capacity to reliably transfer MSN information downstream. Interestingly, GPe neurons are viewed as linear integrators modulated by a large number of different parameters, which makes them uniquely suited for independent processing of a multitude of parameters (Arkadir et al., 2004).
Parallel computational circuits in the striatum
The dynamic formation of MSN cell assemblies comprising functional reorganization into different response groups at different trial epochs has been described previously (Adler et al., 2012). In that study, MSNs belonging to different response clusters were differentiated primarily by their temporal profile and not their anatomical or neurochemical properties. Analysis of our data collected during NE exposure, a paradigm emphasizing other behavioral attributes than the previously described task, yielded two distinct MSN groups for encoding context identification and locomotion. This striking result rules out the striatum as a primary integration site for locomotion and context.
Which neuronal mechanisms endow a single striatal region with the ability to perform parallel processing of at least two independent types of information? One possibility would be a fine scale anatomical afferent organization within the sensorimotor striatum generating segregated parallel neuronal populations each dedicated to the processing of a different type of information. In this scenario, a functional neuronal population comprises a group of MSNs encoding a common theme and related interneurons encoding the same theme; i.e., locomotion-encoding MSNs are primarily innervated by FSIs whereas context-encoding MSNs are primarily innervated by UINs. A constraint on this configuration is that the expected number of FSIs and UINs converging on the same MSNs should be negligible, and therefore, this alternative can be tested directly. The other possibility requires a dynamic organization of basal ganglia networks that enables the canceling out of the contextual component in locomotion encoding MSNs and the locomotion component in the context encoding MSNs. A dynamic computational mechanism enabling the cancelation of self-movement evoked electrosensory activity from that generated by a potential prey has previously been described in cerebellar-like structures (Montgomery and Bodznick, 1994; Bell et al., 1997). An additional third system responsible for processing motivational information could not be addressed in the simple form of the novel environment exposure paradigm used here, but the most likely candidate is the striatal cholinergic interneurons (TANs) that are known to respond to events of motivational value (Apicella, 2002; Kimura et al., 2003; Ravel et al., 2003; Yamada et al., 2004).
In this study, we provided evidence for parallel circuits within the sensorimotor region of the striatum. One circuit is dedicated to information processing related to locomotion and a second circuit is dedicated to environmental identification. This parallelization, which comprises the MSNs and two populations of interneurons, calls for a reexamination of convergence patterns of striatal afferents from different brain structures and the way in which the relatively scarce interneurons interact with the MSNs. Although it remains unclear whether the decision to move or not in a novel environment is generated within the striatum or elsewhere, these data provide important insights into striatal information processing.
Footnotes
Acknowledgements: This study was funded in part by the Israel Science Foundation (ISF) Grant861/ 06 (D.C.). We thank Osnat Bar-Shira and Dr. Gal Chechik for assistance with the SVM algorithm and Dr. Izhar Bar-Gad for useful comments on the manuscript.
The authors declare no competing financial interests.
References
- Adler A, Katabi S, Finkes I, Israel Z, Prut Y, Bergman H. Temporal convergence of dynamic cell assemblies in the striato-pallidal network. J Neurosci. 2012;32:2473–2484. doi: 10.1523/JNEUROSCI.4830-11.2012. [DOI] [PMC free article] [PubMed] [Google Scholar]
- Aldridge JW, Anderson RJ, Murphy JT. The role of the basal ganglia in controlling a movement initiated by a visually presented cue. Brain Res. 1980;192:3–16. doi: 10.1016/0006-8993(80)91003-3. [DOI] [PubMed] [Google Scholar]
- Alexander GE, DeLong MR. Microstimulation of the primate neostriatum. I. Physiological properties of striatal microexcitable zones. J Neurophysiol. 1985;53:1401–1416. doi: 10.1152/jn.1985.53.6.1401. [DOI] [PubMed] [Google Scholar]
- Aosaki T, Kimura M, Graybiel AM. Temporal and spatial characteristics of tonically active neurons of the primate's striatum. J Neurophysiol. 1995;73:1234–1252. doi: 10.1152/jn.1995.73.3.1234. [DOI] [PubMed] [Google Scholar]
- Apicella P. Tonically active neurons in the primate striatum and their role in the processing of information about motivationally relevant events. Eur J Neurosci. 2002;16:2017–2026. doi: 10.1046/j.1460-9568.2002.02262.x. [DOI] [PubMed] [Google Scholar]
- Apicella P, Scarnati E, Ljungberg T, Schultz W. Neuronal activity in monkey striatum related to the expectation of predictable environmental events. J Neurophysiol. 1992;68:945–960. doi: 10.1152/jn.1992.68.3.945. [DOI] [PubMed] [Google Scholar]
- Arkadir D, Morris G, Vaadia E, Bergman H. Independent coding of movement direction and reward prediction by single pallidal neurons. J Neurosci. 2004;24:10047–10056. doi: 10.1523/JNEUROSCI.2583-04.2004. [DOI] [PMC free article] [PubMed] [Google Scholar]
- Baufreton J, Kirkham E, Atherton JF, Menard A, Magill PJ, Bolam JP, Bevan MD. Sparse but selective and potent synaptic transmission from the globus pallidus to the subthalamic nucleus. J Neurophysiol. 2009;102:532–545. doi: 10.1152/jn.00305.2009. [DOI] [PMC free article] [PubMed] [Google Scholar]
- Bell C, Bodznick D, Montgomery J, Bastian J. The generation and subtraction of sensory expectations within cerebellum-like structures. Brain Behav Evol. 1997;50(Suppl 1):17–31. doi: 10.1159/000113352. [DOI] [PubMed] [Google Scholar]
- Bennett BD, Wilson CJ. Spontaneous activity of neostriatal cholinergic interneurons in vitro. J Neurosci. 1999;19:5586–5596. doi: 10.1523/JNEUROSCI.19-13-05586.1999. [DOI] [PMC free article] [PubMed] [Google Scholar]
- Berke JD. Uncoordinated firing rate changes of striatal fast-spiking interneurons during behavioral task performance. J Neurosci. 2008;28:10075–10080. doi: 10.1523/JNEUROSCI.2192-08.2008. [DOI] [PMC free article] [PubMed] [Google Scholar]
- Berke JD. Functional properties of striatal fast-spiking interneurons. Front Syst Neurosci. 2011;5:45. doi: 10.3389/fnsys.2011.00045. [DOI] [PMC free article] [PubMed] [Google Scholar]
- Berke JD, Okatan M, Skurski J, Eichenbaum HB. Oscillatory entrainment of striatal neurons in freely moving rats. Neuron. 2004;43:883–896. doi: 10.1016/j.neuron.2004.08.035. [DOI] [PubMed] [Google Scholar]
- Berke JD, Hetrick V, Breck J, Greene RW. Transient 23–30 Hz oscillations in mouse hippocampus during exploration of novel environments. Hippocampus. 2008;18:519–529. doi: 10.1002/hipo.20435. [DOI] [PubMed] [Google Scholar]
- Betarbet R, Turner R, Chockkan V, DeLong MR, Allers KA, Walters J, Levey AI, Greenamyre JT. Dopaminergic neurons intrinsic to the primate striatum. J Neurosci. 1997;17:6761–6768. doi: 10.1523/JNEUROSCI.17-17-06761.1997. [DOI] [PMC free article] [PubMed] [Google Scholar]
- Boser BE, Guyon IM, Vapnik VN. A training algorithm for optimal margin classifiers. Paper presented at the Fifth Annual Workshop on Computational Learning Theory; July; Pittsburgh, PA. 1992. [Google Scholar]
- Chang JY, Shi LH, Luo F, Woodward DJ. Neural responses in multiple basal ganglia regions following unilateral dopamine depletion in behaving rats performing a treadmill locomotion task. Exp Brain Res. 2006;172:193–207. doi: 10.1007/s00221-005-0312-7. [DOI] [PubMed] [Google Scholar]
- Chang CC, Chih-Jen L. LIBSVM: A library for support vector machines. ACM Transact Intell Syst Technol. 2011;2:27.21–27.27. [Google Scholar]
- Chang SD, Liang KC. Roles of hippocampal GABA(A) and muscarinic receptors in consolidation of context memory and context-shock association in contextual fear conditioning: a double dissociation study. Neurobiol Learn Mem. 2012;98:17–24. doi: 10.1016/j.nlm.2012.04.004. [DOI] [PubMed] [Google Scholar]
- Costa RM, Cohen D, Nicolelis MA. Differential corticostriatal plasticity during fast and slow motor skill learning in mice. Curr Biol. 2004;14:1124–1134. doi: 10.1016/j.cub.2004.06.053. [DOI] [PubMed] [Google Scholar]
- Costa RM, Lin SC, Sotnikova TD, Cyr M, Gainetdinov RR, Caron MG, Nicolelis MA. Rapid alterations in corticostriatal ensemble coordination during acute dopamine-dependent motor dysfunction. Neuron. 2006;52:359–369. doi: 10.1016/j.neuron.2006.07.030. [DOI] [PubMed] [Google Scholar]
- Crutcher MD, Alexander GE. Movement-related neuronal activity selectively coding either direction or muscle pattern in three motor areas of the monkey. J Neurophysiol. 1990;64:151–163. doi: 10.1152/jn.1990.64.1.151. [DOI] [PubMed] [Google Scholar]
- DeLong MR. Activity of basal ganglia neurons during movement. Brain Res. 1972;40:127–135. doi: 10.1016/0006-8993(72)90118-7. [DOI] [PubMed] [Google Scholar]
- Dubach M, Schmidt R, Kunkel D, Bowden DM, Martin R, German DC. Primate neostriatal neurons containing tyrosine hydroxylase: immunohistochemical evidence. Neurosci Lett. 1987;75:205–210. doi: 10.1016/0304-3940(87)90298-9. [DOI] [PubMed] [Google Scholar]
- Gage GJ, Stoetzner CR, Wiltschko AB, Berke JD. Selective activation of striatal fast-spiking interneurons during choice execution. Neuron. 2010;67:466–479. doi: 10.1016/j.neuron.2010.06.034. [DOI] [PMC free article] [PubMed] [Google Scholar]
- Gdowski MJ, Miller LE, Parrish T, Nenonene EK, Houk JC. Context dependency in the globus pallidus internal segment during targeted arm movements. J Neurophysiol. 2001;85:998–1004. doi: 10.1152/jn.2001.85.2.998. [DOI] [PubMed] [Google Scholar]
- Gernert M, Hamann M, Bennay M, Löscher W, Richter A. Deficit of striatal parvalbumin-reactive GABAergic interneurons and decreased basal ganglia output in a genetic rodent model of idiopathic paroxysmal dystonia. J Neurosci. 2000;20:7052–7058. doi: 10.1523/JNEUROSCI.20-18-07052.2000. [DOI] [PMC free article] [PubMed] [Google Scholar]
- Giros B, Jaber M, Jones SR, Wightman RM, Caron MG. Hyperlocomotion and indifference to cocaine and amphetamine in mice lacking the dopamine transporter. Nature. 1996;379:606–612. doi: 10.1038/379606a0. [DOI] [PubMed] [Google Scholar]
- Gittis AH, Leventhal DK, Fensterheim BA, Pettibone JR, Berke JD, Kreitzer AC. Selective inhibition of striatal fast-spiking interneurons causes dyskinesias. J Neurosci. 2011;31:15727–15731. doi: 10.1523/JNEUROSCI.3875-11.2011. [DOI] [PMC free article] [PubMed] [Google Scholar]
- Good M, Honey RC. Dissociable effects of selective lesions to hippocampal subsystems on exploratory behavior, contextual learning, and spatial learning. Behav Neurosci. 1997;111:487–493. doi: 10.1037//0735-7044.111.3.487. [DOI] [PubMed] [Google Scholar]
- Graveland GA, Williams RS, DiFiglia M. A Golgi study of the human neostriatum: neurons and afferent fibers. J Comp Neurol. 1985;234:317–333. doi: 10.1002/cne.902340304. [DOI] [PubMed] [Google Scholar]
- Haber SN, Fudge JL, McFarland NR. Striatonigrostriatal pathways in primates form an ascending spiral from the shell to the dorsolateral striatum. J Neurosci. 2000;20:2369–2382. doi: 10.1523/JNEUROSCI.20-06-02369.2000. [DOI] [PMC free article] [PubMed] [Google Scholar]
- Hikosaka O, Sakamoto M, Usui S. Functional properties of monkey caudate neurons. I. Activities related to saccadic eye movements. J Neurophysiol. 1989;61:780–798. doi: 10.1152/jn.1989.61.4.780. [DOI] [PubMed] [Google Scholar]
- Hof PR, Young WG, Bloom FE, Belichenko PV, Celio MR. Comparative cytoarchitectonic atlas of the C57BL/6 and129/Sv mouse brains. Amsterdam: Elsevier Health Sciences; 2000. [Google Scholar]
- Hollerman JR, Tremblay L, Schultz W. Influence of reward expectation on behavior-related neuronal activity in primate striatum. J Neurophysiol. 1998;80:947–963. doi: 10.1152/jn.1998.80.2.947. [DOI] [PubMed] [Google Scholar]
- Hori Y, Minamimoto T, Kimura M. Neuronal encoding of reward value and direction of actions in the primate putamen. J Neurophysiol. 2009;102:3530–3543. doi: 10.1152/jn.00104.2009. [DOI] [PubMed] [Google Scholar]
- Houk JC, Wise SP. Distributed modular architectures linking basal ganglia, cerebellum, and cerebral cortex: their role in planning and controlling action. Cereb Cortex. 1995;5:95–110. doi: 10.1093/cercor/5.2.95. [DOI] [PubMed] [Google Scholar]
- Humphries MD, Prescott TJ. The ventral basal ganglia, a selection mechanism at the crossroads of space, strategy, and reward. Prog Neurobiol. 2010;90:385–417. doi: 10.1016/j.pneurobio.2009.11.003. [DOI] [PubMed] [Google Scholar]
- Ibáñez-Sandoval O, Tecuapetla F, Unal B, Shah F, Koós T, Tepper JM. Electrophysiological and morphological characteristics and synaptic connectivity of tyrosine hydroxylase-expressing neurons in adult mouse striatum. J Neurosci. 2010;30:6999–7016. doi: 10.1523/JNEUROSCI.5996-09.2010. [DOI] [PMC free article] [PubMed] [Google Scholar]
- Inokawa H, Yamada H, Matsumoto N, Muranishi M, Kimura M. Juxtacellular labeling of tonically active neurons and phasically active neurons in the rat striatum. Neuroscience. 2010;168:395–404. doi: 10.1016/j.neuroscience.2010.03.062. [DOI] [PubMed] [Google Scholar]
- Jaeger D, Kita H, Wilson CJ. Surround inhibition among projection neurons is weak or nonexistent in the rat neostriatum. J Neurophysiol. 1994;72:2555–2558. doi: 10.1152/jn.1994.72.5.2555. [DOI] [PubMed] [Google Scholar]
- Jin X, Costa RM. Start/stop signals emerge in nigrostriatal circuits during sequence learning. Nature. 2010;466:457–462. doi: 10.1038/nature09263. [DOI] [PMC free article] [PubMed] [Google Scholar]
- Jog MS, Kubota Y, Connolly CI, Hillegaart V, Graybiel AM. Building neural representations of habits. Science. 1999;286:1745–1749. doi: 10.1126/science.286.5445.1745. [DOI] [PubMed] [Google Scholar]
- Kalanithi PS, Zheng W, Kataoka Y, DiFiglia M, Grantz H, Saper CB, Schwartz ML, Leckman JF, Vaccarino FM. Altered parvalbumin-positive neuron distribution in basal ganglia of individuals with Tourette syndrome. Proc Natl Acad Sci U S A. 2005;102:13307–13312. doi: 10.1073/pnas.0502624102. [DOI] [PMC free article] [PubMed] [Google Scholar]
- Kalueff AV, Keisala T, Minasyan A, Kuuslahti M, Tuohimaa P. Temporal stability of novelty exploration in mice exposed to different open field tests. Behav Processes. 2006;72:104–112. doi: 10.1016/j.beproc.2005.12.011. [DOI] [PubMed] [Google Scholar]
- Kawaguchi Y. Physiological, morphological, and histochemical characterization of three classes of interneurons in rat neostriatum. J Neurosci. 1993;13:4908–4923. doi: 10.1523/JNEUROSCI.13-11-04908.1993. [DOI] [PMC free article] [PubMed] [Google Scholar]
- Kawaguchi Y, Wilson CJ, Augood SJ, Emson PC. Striatal interneurones: chemical, physiological and morphological characterization. Trends Neurosci. 1995;18:527–535. doi: 10.1016/0166-2236(95)98374-8. [DOI] [PubMed] [Google Scholar]
- Kimchi EY, Laubach M. Dynamic encoding of action selection by the medial striatum. J Neurosci. 2009;29:3148–3159. doi: 10.1523/JNEUROSCI.5206-08.2009. [DOI] [PMC free article] [PubMed] [Google Scholar]
- Kimura M. Behaviorally contingent property of movement-related activity of the primate putamen. J Neurophysiol. 1990;63:1277–1296. doi: 10.1152/jn.1990.63.6.1277. [DOI] [PubMed] [Google Scholar]
- Kimura M, Kato M, Shimazaki H. Physiological properties of projection neurons in the monkey striatum to the globus pallidus. Exp Brain Res. 1990;82:672–676. doi: 10.1007/BF00228811. [DOI] [PubMed] [Google Scholar]
- Kimura M, Yamada H, Matsumoto N. Tonically active neurons in the striatum encode motivational contexts of action. Brain Dev. 2003;25(Suppl 1):S20–S23. doi: 10.1016/s0387-7604(03)90003-9. [DOI] [PubMed] [Google Scholar]
- Koós T, Tepper JM. Inhibitory control of neostriatal projection neurons by GABAergic interneurons. Nat Neurosci. 1999;2:467–472. doi: 10.1038/8138. [DOI] [PubMed] [Google Scholar]
- Koos T, Tepper JM, Wilson CJ. Comparison of IPSCs evoked by spiny and fast-spiking neurons in the neostriatum. J Neurosci. 2004;24:7916–7922. doi: 10.1523/JNEUROSCI.2163-04.2004. [DOI] [PMC free article] [PubMed] [Google Scholar]
- Liang L, DeLong MR, Papa SM. Inversion of dopamine responses in striatal medium spiny neurons and involuntary movements. J Neurosci. 2008;28:7537–7547. doi: 10.1523/JNEUROSCI.1176-08.2008. [DOI] [PMC free article] [PubMed] [Google Scholar]
- Lin SC, Gervasoni D, Nicolelis MA. Fast modulation of prefrontal cortex activity by basal forebrain noncholinergic neuronal ensembles. J Neurophysiol. 2006;96:3209–3219. doi: 10.1152/jn.00524.2006. [DOI] [PubMed] [Google Scholar]
- Mary Christopher S, Butter CM. Consummatory behaviors and locomotor exploration evoked from self-stimulation sites in rats. J Comp Physiol Psychol. 1968;66:335–339. doi: 10.1037/h0026325. [DOI] [PubMed] [Google Scholar]
- Miller BR, Walker AG, Shah AS, Barton SJ, Rebec GV. Dysregulated information processing by medium spiny neurons in striatum of freely behaving mouse models of Huntington's disease. J Neurophysiol. 2008;100:2205–2216. doi: 10.1152/jn.90606.2008. [DOI] [PMC free article] [PubMed] [Google Scholar]
- Mink JW. The basal ganglia: focused selection and inhibition of competing motor programs. Progress in neurobiology. 1996;50:381–425. doi: 10.1016/s0301-0082(96)00042-1. [DOI] [PubMed] [Google Scholar]
- Miyachi S, Hikosaka O, Miyashita K, Kárádi Z, Rand MK. Differential roles of monkey striatum in learning of sequential hand movement. Exp Brain Res. 1997;115:1–5. doi: 10.1007/pl00005669. [DOI] [PubMed] [Google Scholar]
- Montgomery JC, Bodznick D. An adaptive filter that cancels self-induced noise in the electrosensory and lateral line mechanosensory systems of fish. Neuroscience letters. 1994;174:145–148. doi: 10.1016/0304-3940(94)90007-8. [DOI] [PubMed] [Google Scholar]
- Mulder AB, Tabuchi E, Wiener SI. Neurons in hippocampal afferent zones of rat striatum parse routes into multi-pace segments during maze navigation. Eur J Neurosci. 2004;19:1923–1932. doi: 10.1111/j.1460-9568.2004.03301.x. [DOI] [PubMed] [Google Scholar]
- O'Doherty J, Dayan P, Schultz J, Deichmann R, Friston K, Dolan RJ. Dissociable roles of ventral and dorsal striatum in instrumental conditioning. Science. 2004;304:452–454. doi: 10.1126/science.1094285. [DOI] [PubMed] [Google Scholar]
- Oorschot DE. Total number of neurons in the neostriatal, pallidal, subthalamic, and substantia nigral nuclei of the rat basal ganglia: a stereological study using the cavalieri and optical disector methods. J Comp Neurol. 1996;366:580–599. doi: 10.1002/(SICI)1096-9861(19960318)366:4<580::AID-CNE3>3.0.CO;2-0. [DOI] [PubMed] [Google Scholar]
- Pearson K. On lines and planes of closest fit to systems of points in space. Philos Mag. 1901;2:559–572. [Google Scholar]
- Phillips RG, LeDoux JE. Lesions of the dorsal hippocampal formation interfere with background but not foreground contextual fear conditioning. Learn Mem. 1994;1:34–44. [PubMed] [Google Scholar]
- Ravel S, Sardo P, Legallet E, Apicella P. Reward unpredictability inside and outside of a task context as a determinant of the responses of tonically active neurons in the monkey striatum. J Neurosci. 2001;21:5730–5739. doi: 10.1523/JNEUROSCI.21-15-05730.2001. [DOI] [PMC free article] [PubMed] [Google Scholar]
- Ravel S, Legallet E, Apicella P. Responses of tonically active neurons in the monkey striatum discriminate between motivationally opposing stimuli. J Neurosci. 2003;23:8489–8497. doi: 10.1523/JNEUROSCI.23-24-08489.2003. [DOI] [PMC free article] [PubMed] [Google Scholar]
- Rolls ET, Thorpe SJ, Maddison SP. Responses of striatal neurons in the behaving monkey. 1. Head of the caudate nucleus. Behav Brain Res. 1983;7:179–210. doi: 10.1016/0166-4328(83)90191-2. [DOI] [PubMed] [Google Scholar]
- Romo R, Schultz W. Role of primate basal ganglia and frontal cortex in the internal generation of movements. III. Neuronal activity in the supplementary motor area. Exp Brain Res. 1992;91:396–407. doi: 10.1007/BF00227836. [DOI] [PubMed] [Google Scholar]
- Schmitzer-Torbert NC, Redish AD. Task-dependent encoding of space and events by striatal neurons is dependent on neural subtype. Neuroscience. 2008;153:349–360. doi: 10.1016/j.neuroscience.2008.01.081. [DOI] [PMC free article] [PubMed] [Google Scholar]
- Schultz W, Apicella P, Scarnati E, Ljungberg T. Neuronal activity in monkey ventral striatum related to the expectation of reward. J Neurosci. 1992;12:4595–4610. doi: 10.1523/JNEUROSCI.12-12-04595.1992. [DOI] [PMC free article] [PubMed] [Google Scholar]
- Sharott A, Moll CK, Engler G, Denker M, Grün S, Engel AK. Different subtypes of striatal neurons are selectively modulated by cortical oscillations. J Neurosci. 2009;29:4571–4585. doi: 10.1523/JNEUROSCI.5097-08.2009. [DOI] [PMC free article] [PubMed] [Google Scholar]
- Sharp PE, McNaughton BL, Barnes CA. Enhancement of hippocampal field potentials in rats exposed to a novel, complex environment. Brain Res. 1985;339:361–365. doi: 10.1016/0006-8993(85)90105-2. [DOI] [PubMed] [Google Scholar]
- Tepper JM, Bolam JP. Functional diversity and specificity of neostriatal interneurons. Curr Opin Neurobiol. 2004;14:685–692. doi: 10.1016/j.conb.2004.10.003. [DOI] [PubMed] [Google Scholar]
- Tunstall MJ, Oorschot DE, Kean A, Wickens JR. Inhibitory interactions between spiny projection neurons in the rat striatum. J Neurophysiol. 2002;88:1263–1269. doi: 10.1152/jn.2002.88.3.1263. [DOI] [PubMed] [Google Scholar]
- Will B, Toniolo G, Kelche C, Pallage V, Deluzarche F, Misslin R. The effects of postoperative physical environment on novelty seeking behaviour and maze learning in rats with hippocampal lesions. Behav Brain Res. 1986;19:233–240. doi: 10.1016/0166-4328(86)90023-9. [DOI] [PubMed] [Google Scholar]
- Wilson CJ, Chang HT, Kitai ST. Firing patterns and synaptic potentials of identified giant aspiny interneurons in the rat neostriatum. J Neurosci. 1990;10:508–519. doi: 10.1523/JNEUROSCI.10-02-00508.1990. [DOI] [PMC free article] [PubMed] [Google Scholar]
- Wiltschko AB, Pettibone JR, Berke JD. Opposite effects of stimulant and antipsychotic drugs on striatal fast-spiking interneurons. Neuropsychopharmacology. 2010;35:1261–1270. doi: 10.1038/npp.2009.226. [DOI] [PMC free article] [PubMed] [Google Scholar]
- Yamada H, Matsumoto N, Kimura M. Tonically active neurons in the primate caudate nucleus and putamen differentially encode instructed motivational outcomes of action. J Neurosci. 2004;24:3500–3510. doi: 10.1523/JNEUROSCI.0068-04.2004. [DOI] [PMC free article] [PubMed] [Google Scholar]
- Yarom O, Cohen D. Putative cholinergic interneurons in the ventral and dorsal regions of the striatum have distinct roles in a two choice alternative association task. Front Syst Neurosci. 2011;5:36. doi: 10.3389/fnsys.2011.00036. [DOI] [PMC free article] [PubMed] [Google Scholar]
- Yeshenko O, Guazzelli A, Mizumori SJ. Context-dependent reorganization of spatial and movement representations by simultaneously recorded hippocampal and striatal neurons during performance of allocentric and egocentric tasks. Behaval Neurosci. 2004;118:751–769. doi: 10.1037/0735-7044.118.4.751. [DOI] [PubMed] [Google Scholar]
- Yin HH, Knowlton BJ, Balleine BW. Lesions of dorsolateral striatum preserve outcome expectancy but disrupt habit formation in instrumental learning. Eur J Neurosci. 2004;19:181–189. doi: 10.1111/j.1460-9568.2004.03095.x. [DOI] [PubMed] [Google Scholar]