

Abstract
Motor tics, a cardinal symptom of Tourette syndrome (TS), are hypothesized to arise from abnormalities within cerebro-basal ganglia circuits. Yet noninvasive neuroimaging of TS has previously identified robust activation in the cerebellum. To date, electrophysiological properties of cerebellar activation and its role in basal ganglia-mediated tic expression remain unknown. We performed multisite, multielectrode recordings of single-unit activity and local field potentials from the cerebellum, basal ganglia, and primary motor cortex using a pharmacologic monkey model of motor tics/TS. Following microinjections of bicuculline into the sensorimotor putamen, periodic tics occurred predominantly in the orofacial region, and a sizable number of cerebellar neurons showed phasic changes in activity associated with tic episodes. Specifically, 64% of the recorded cerebellar cortex neurons exhibited increases in activity, and 85% of the dentate nucleus neurons displayed excitatory, inhibitory, or multiphasic responses. Critically, abnormal discharges of cerebellar cortex neurons and excitatory-type dentate neurons mostly preceded behavioral tic onset, indicating their central origins. Latencies of pathological activity in the cerebellum and primary motor cortex substantially overlapped, suggesting that aberrant signals may be traveling along divergent pathways to these structures from the basal ganglia. Furthermore, the occurrence of tic movement was most closely associated with local field potential spikes in the cerebellum and primary motor cortex, implying that these structures may function as a gate to release overt tic movements. These findings indicate that tic-generating networks in basal ganglia mediated tic disorders extend beyond classical cerebro-basal ganglia circuits, leading to global network dysrhythmia including cerebellar circuits.
Introduction
Motor tics are a common symptom expressed in a number of central nervous system disorders (Obeso et al., 1983; Vogel et al., 1991; Jankovic and Ashizawa, 1995; Zohar et al., 1997; Defebvre, 2006; Vercueil, 2006), including Tourette syndrome (TS) (Tourette Syndrome Classification Study Group, 1993). Although the underlying pathology of TS has yet to be formalized, it has been generally agreed that the tics in TS are associated with basal ganglia (BG) abnormalities (Mink, 2001; Peterson, 2001; Albin and Mink, 2006), and maybe a consequence of dysfunctional GABAergic networks (Kalanithi et al., 2005; Kataoka et al., 2010). Previously, neuroimaging studies implicated the cerebellum in the pathogenesis of TS (Bohlhalter et al., 2006; Lerner et al., 2007; Tobe et al., 2010; Pourfar et al., 2011; Lerner et al., 2012). In addition, reciprocal connections have been identified between the basal ganglia and cerebellum (Hoshi et al., 2005; Bostan and Strick, 2010; Bostan et al., 2010), which renders the whole picture of TS pathophysiology more complicated. The precise contribution of the cerebellum to basal ganglia-mediated tic expression remains unknown.
The cerebellar activation documented in the neuroimaging literature may reflect an increase of afferent sensory input driven by overt tic movements. Alternatively, the increased cerebellar activity may reflect collateral transmission of descending volleys (Allen and Tsukahara, 1974) originating from the primary motor cortex (M1) that give rise to tic movements (McCairn et al., 2009). In the former, the discharge of cerebellar neurons should follow the first detectable change of muscular activity. In the latter, the discharge of cerebellar neurons should just follow the discharge of primary motor cortex neurons. If, however, cerebellar neurons fire before individual tic movements and their discharge onset is no later than that of primary motor cortex neurons, then it may suggest that the basal ganglia have divergent output channels to the motor cortex and cerebellum. Such findings would support the hypothesis that basal ganglia activity is capable of influencing cerebellar activity, presumably via the disynaptic link, with a latency sufficiently early to affect abnormal movement.
The aim of the present study was threefold: to determine whether and to what extent the cerebellum is involved in basal ganglia mediated tic expression, to assess the temporal relationship between cerebellar firing and muscular activity, and to clarify the recruitment order of abnormal neural discharges in the basal ganglia, cerebellum, and M1. Addressing these questions requires experimental methodologies that enable the measurement of neural signals with millisecond order precision, which cannot be accomplished with functional imaging techniques. Here, we performed extracellular microelectrode recording simultaneously in the cerebellum, basal ganglia, and M1. We generated a reversible, pharmacologic motor tic/TS model in monkeys by microinjecting the GABA antagonist bicuculline into the sensorimotor striatum (putamen) as reported previously (Grabli et al., 2004; McCairn et al., 2009, 2012; Worbe et al., 2009), thereby bypassing the concerns associated with compensatory mechanisms. The model manifested basal ganglia mediated motor tics, where aberrant activity was initiated in the putamen. Our experimental setup allowed not only for testing the cerebellar involvement in tic behavior, but also for comparing response latencies across anatomically segregated global networks consisting of the cerebellum, basal ganglia, and M1.
Materials and Methods
Animals.
Two male macaque monkeys (Macaca fuscata; designated “R” and “B”) were used in this study. The animals' health was monitored by a veterinarian, and fluid consumption, diet, and weight were monitored daily. All procedures were in accordance with the National Institutes of Health Guide for the Care and Use of Laboratory Animals and were approved by the RIKEN Animal Experiment Committee.
Surgical procedure.
The surgical procedures for cranial implantation were conducted under aseptic conditions using pentobarbital anesthesia (30 mg/kg, i.v.), after induction with ketamine HCl (10 mg/kg, i.m.). For cranial implantation for targeting the M1 and basal ganglia structures, we used a stereotaxically implanted square polyetherimide chamber (27 × 27 mm) on the animals' left side (Alpha Omega Engineering). The recording chamber was tilted at 30° in the coronal plane, with the center targeted to the middle of the globus pallidus (GP; stereotactic coordinates at A21, L7, and H15) (Kusama and Mabuchi, 1970). For targeting the cerebellum, we used another polyetherimide chamber (26 × 26 mm), which was tilted at 35° in the coronal plane, with the center targeted to the right dentate nucleus (stereotactic coordinates at A-5, L7, and H4) (Kusama and Mabuchi, 1970). The chambers were fixed into place using plastic bone screws and methyl-methacrylate cement. In addition, a head-holder connector and an electroencephalogram screw (Crist Instrument) were attached to the skull. Prophylactic antibiotics and analgesics were administered postsurgically.
Experimental setup.
The animals were trained to sit in a primate chair and were allowed to complete a simple, visually guided reach task for a liquid reward. This task was introduced merely to have the monkeys calmly sit in the chair during 2–3 h of neuronal recordings. Spontaneous behaviors and task execution were observed and recorded during each experimental session using a multichannel video system (GV-800; Geovision). The system was designed to visualize behavioral sequences from four different locations, each capturing the face, upper limbs, lower limbs, and the behavioral task. Digital images from each of the separate cameras were captured at 25 frames per second and stored on a hard disk for offline analysis. In addition, electromyogram (EMG) signals were sampled from four muscles: biceps brachii, triceps brachii, zygomaticus major, and ventral orbicularis oris. EMG wires were constructed from 100 μm Teflon-coated silver wire (A-M Systems). The EMG wires were percutaneous and inserted just before each experimental session using a 27 gauge hypodermic needle. EMG signals were sampled at 5 kHz and bandpass filtered (5–450 Hz; four pole Butterworth filter).
Electrophysiological recording.
Following recovery from surgery, the animals underwent microelectrode-guided mapping of M1, putamen, external (GPe) and internal (GPi) segments of the globus pallidus, cerebellar cortex (CbllCx), and dentate nucleus. Each region of interest was identified by their characteristic neuronal activity and their relation to known anatomical boundaries, as described previously (McCairn and Turner, 2009; McCairn et al., 2009, 2012). Mapping was compared with a standard stereotaxic atlas (Kusama and Mabuchi, 1970). The preliminary mapping process was followed by experimental sessions. During each experimental session, up to nine glass-coated tungsten microelectrodes (250–750 kΩ at 1 kHz) and an injectrode (28 gauge cannula surrounding a Parylene-coated 50 μm microelectrode extending 0.5 mm beyond the tip of the injection cannula) (Alpha Omega Engineering) were introduced using three separate manipulating towers. The electrode manipulating system could move each electrode independently with 2 μm resolution (dual movement tower and electrode positioning system; Alpha Omega Engineering) or with 1 μm resolution (MO-971A; Narishige). Methodological constraints prevented simultaneous recording of CbllCx neurons with dentate neurons as only a single electrode was used for the cerebellar chamber. The microinjection cannula was connected via a Delrin manifold to a 10 μl syringe (Hamilton) filled with bicuculline (Sigma-Aldrich). The depth of the injection site within the putamen was determined by electrophysiological recording using the injectrode. All electrophysiological data were passed through a low-gain 16 channel headstage (2 Hz to 7.5 kHz bandpass) and then digitized at 24 kHz (16 bit resolution; Tucker Davis Technologies). The digitized signals were filtered (300 Hz to 6 kHz; first-order Butterworth filter) and saved to a disk either as continuous data or as 38-sample-long snippets of the continuous data stream. Once a sufficient number of separable neurons had been identified on the electrodes and were stable for a minimum of 1 min, bicuculline dissolved in physiological saline (15 μg/μl) was slowly injected (2.5–8 μl) into the sensorimotor territory of the putamen at a rate of ∼2 μl/min.
Offline analysis of neuronal activity.
The action potentials of individual neurons were sorted offline (OfflineSorter version 2.8.7; Plexon) using the high-passed signal (200 Hz, four pole high-pass Butterworth filter). Neurons were accepted for further analysis if they met the following criteria: (1) the recording was from intended locations in the cerebro-basal ganglia–cerebellar structure; (2) the acquired action potentials of the neuron were of a consistent distinct shape that could be fully separated with a high degree of certainty from the spike waveforms of other neurons and background noise; (3) the interspike intervals of the neuron were confirmed to have a minimum refractory period of 1.5 ms.
Local field potential (LFP) data were extracted by bandpass filtering (eight pole Butterworth filter; cutoff at 2 Hz/300 Hz; sample rate, 1.5 kHz) of the wide-band extracellular signal. Significant voltage transients in the LFP train, which were termed LFP spikes, were detected by a threshold crossing method (McCairn et al., 2009). Significant differences in LFP spike structure between the tic and intertic interval were tested using a t test across the concatenated tic and intertic matrices of LFP traces. A p value was provided for each analyzed bin (5 ms) with a significance threshold of p = 0.001.
Data analysis.
Following offline sorting of the neuronal data, the spike trains were correlated with behavioral events using a MATLAB (V2007B; MathWorks) and Neuroexplorer (V4; Nex Technologies) environment. The EMG signals were processed off-line, and the envelope was estimated by rectifying the signal, followed by low-pass filtering (10 Hz; eight pole Butterworth filter). Detection of tics used the rectified and filtered EMG signal via a threshold crossing method (3 SDs over the steady-state mean). Behavioral events were identified using frame-by-frame video analysis and aligned to EMG activity to exclude nonrelevant muscular activity, as described previously (McCairn et al., 2009, 2012). The time stamps from the EMG associated with motor tics were then used to construct perievent histograms (using 5 ms bins) for neuronal data. The significance of neuronal activity in perievent histograms was analyzed by constructing 99% confidence limits based on the mean and SD of neuronal activity within the tail of the histogram (activity at 2 to 0.2 s before the tic). A neuron was considered to have a significant perievent response when its activity crossed the assigned confidence level for three successive bins and the z score was >3.
Temporal relationships between single-unit M1 neurons and single units in all other recorded nodes used paired recordings, where the reference for the perievent histograms (1 ms bins) was derived from the onset of burst activity in M1. Burst detection used the Legéndy and Salcman (1985) method. As with EMG associated changes in neuronal activity, significance detection used 99% confidence limits based on the mean and SD of neuronal activity within the tail of the histogram (activity at 2 to 0.2 s before the tic).
Histology.
Following completion of the experiment, the animals were deeply anesthetized using ketamine (10 mg/kg) and sodium pentobarbital (50 mg/kg), and transcardially perfused with saline followed by 4% paraformaldehyde. The whole brain was removed and buffered in graded sucrose solution 10–30% over 21 d. The brain was then frozen at −25°C and cut in the coronal plane using a cryostat (Leica Microsystems). Each section was digitized using a 10 megapixel digital camera. Contours of brain structures were traced using the digitized images, and the anteroposterior position of each injection site was plotted relative to the anterior commissure (AC), taking AC0 as the origin of the system axes. Injection sites and recording tracks in the basal ganglia were identified via the gliosis formed by the electrodes and injectrode (Fig. 1A). Recording sites in the cerebellum were reconstructed with reference to markings made by passing a DC current (20 μA for 20 s) through the recording electrodes at regions where strong tic-related activity was obtained (Fig. 1B).
Figure 1.
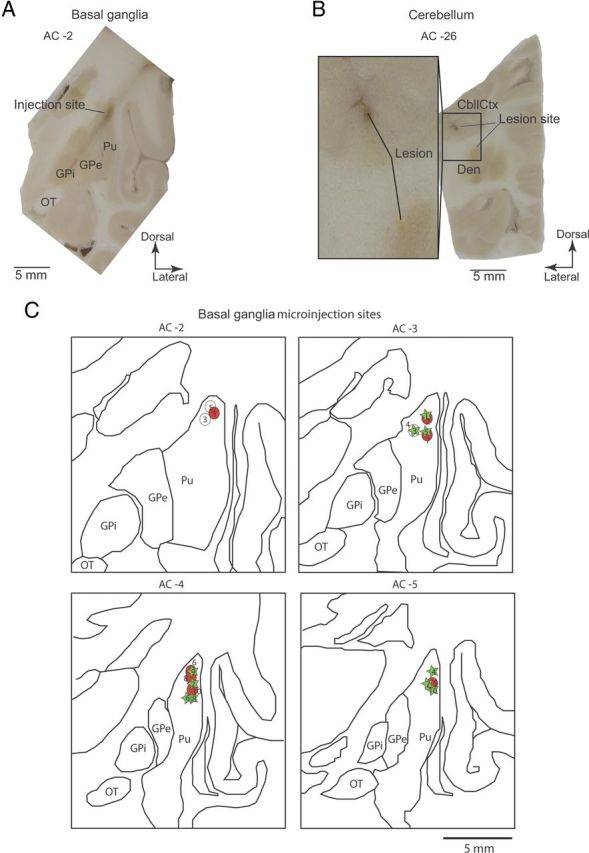
Anatomical reconstruction of injection and recording sites. A, Image of coronal section of the left hemisphere from Monkey R, showing gliosis formed by recording electrode trajectories, and microinjection sites that were targeted to dorsolateral putamen AC-2. Pu, Putamen; OT, optic tract. B, Electrolytic marking lesions made before animals were killed, targeted to the right CbllCx and dentate nucleus, at regions that were highly active before tic initiation. Den, Dentate nucleus. C, Outline drawings reconstructed from the coronal sections of the left hemisphere of Monkey R. The projected injection sites are derived from electrophysiological mapping and postmortem reconstructions from each animal overlaid on the same sections and are summarized in Table 1. Circles, Monkey R; stars, Monkey B.
Results
Multielectrode neuronal recordings in an acute, reversible TS model
We performed multisite, multielectrode recordings of single-unit activity and LFPs in two awake monkeys. In each experimental session (total n = 20), microelectrodes were inserted into the putamen, GPe, GPi, M1, and CbllCx or dentate nucleus to monitor neuronal activity. Once well-isolable neurons had been identified in each structure, a small amount of bicuculline (2.5–8 μl; Table 1) was administered into the sensorimotor putamen. Consistent with previous reports (McCairn et al., 2009, 2012), our injection protocol successfully induced repetitive motor tics primarily in the orofacial region within minutes of injections (7.1 ± 3.9 min, mean ± SD) in most of the sessions (n = 17; Table 1). Histological examinations confirmed that injections were placed into the sensorimotor territories, and recording sites covered M1, putamen, GP (Fig. 1A), CbllCx, and dentate nucleus (B). Reconstruction of all the injection sites is shown in Figure 1C.
Table 1.
Microinjections, anatomical, and behavioral details
| Animal | Injection No. | AC plane (mm)a | Volume (μl) | Onset (min) | Effect |
|---|---|---|---|---|---|
| Monkey R | 1 | 2 | 2.5 | 1 | Facial/forelimb tics |
| 2 | 3 | 5 | 6 | Facial tics | |
| 3 | 3 | 8 | No effect | ||
| 4 | 2 | 8 | No effect | ||
| 5 | 2 | 8 | No effect | ||
| 6 | 4 | 4 | 9 | Facial/forelimb tics | |
| 7 | 3.5 | 2.5 | 5 | Facial/forelimb tics | |
| 8 | 4 | 5 | 4 | Facial/forelimb tics | |
| 9 | 4 | 5 | 6 | Facial tics | |
| 10 | 5 | 5 | 5 | Facial tics | |
| Monkey B | 1 | 4 | 8 | 20 | Facial tics |
| 2 | 3 | 5 | 8 | Facial/forelimb tics | |
| 3 | 3 | 2.5 | 4 | Facial/forelimb tics | |
| 4 | 4 | 5 | 7 | Facial tic | |
| 5 | 3 | 5 | 6 | Facial/forelimb tics | |
| 6 | 4 | 5 | 8 | Facial/forelimb tics | |
| 7 | 4 | 5 | 9 | Facial tic | |
| 8 | 5 | 2.5 | 6 | Facial tic | |
| 9 | 5 | 5 | 9 | Facial/forelimb tic | |
| 10 | 5 | 5 | 8 | Facial tic |
a The anatomical plane at which the injections were placed relative to the anterior commissure. All injections were administered caudally to the AC.
Cerebellar involvement in tic expression
Across the two animals, we recorded from 475 single cells during tic states (M1, 105; putamen, 53; GPe, 144; GPi, 81; CbllCx, 53; dentate, 39). Our most striking finding was that as many as three-quarters of the cerebellar neurons exhibited abnormal discharge associated with tic expression. In CbllCx, 64% (n = 34/53) of the recorded neurons showed tic-related activity. The response of these CbllCx neurons consisted predominantly of bursts of activity before and coincident with each tic (Fig. 2A,B). There were, however, a small number of multiphasic units identified in the population (n = 4). Figure 2B shows a raw neuronal trace of a typical CbllCx neuron that phasically changed activity in relation to tics. The perievent raster and histogram clearly show that the discharge of this neuron preceded tic-related muscular activity (Fig. 2B). A time course analysis for the entire CbllCx population revealed that tic-related neural activity was detectable as early as 111 ms before tic onset, and the activation time ranged between 111 ms before and 131 ms after tic onset (Fig. 2C). Critically, the majority of the responding CbllCx neurons (65%; n = 22/34) fired before tic-related EMG onset.
Figure 2.

Tic-related firing of cerebellar neurons. A, Examples of raw data from EMG (top trace) and activity of a single CbllCx neuron (bottom trace) after administration of bicuculline. EMG is recorded from the orofacial region. The large voltage transients are tic events. B, Quantification of the increase in tic-related rate firing expressed as a perievent raster and histogram. Neuronal activity is aligned to tic onset. C, Histogram representing the distribution of response latencies in CbllCx relative to tic onset. D, Examples of a raw neuronal recording of an excitatory dentate nucleus cell associated with tic events. E, Perievent raster and histogram of the cell shown in D. F, Histogram representing the distribution of response latencies of excitatory dentate nucleus neurons. G, Raw neuronal recording in conjunction with EMG activity of a typical inhibitory dentate cell. H, Perievent raster and histogram of the cell shown in G. I, Histogram representing the distribution of response latencies of inhibitory dentate nucleus neurons. Note the late onset of activity relative to tic activity.
In the dentate nucleus, 85% of the recorded neurons showed significant responses to tic events (n = 33/39). Unlike CbllCx neurons, response patterns varied considerably across neurons in the nucleus: excitation (n = 19; Fig. 2D,E), inhibition (n = 11, Fig. 2G,H), and multiphasic (n = 3). The response latencies in the dentate nucleus ranged from 138 ms before to 85 ms after tic onset (Fig. 2F,I); however, it was typically only excitatory-type cells that were potentially causal to tic expression (Fig. 2F). As shown in Figure 2F, the majority of the excitatory-type cells responded before tic initiation, with the earliest activation time being 138 ms before EMG onset (range, −138 to 85 ms). In contrast, the earliest detectable response of inhibitory-type cells was 4 ms before tic onset (range, −4 to 78 ms; Fig. 2I); in fact, only one cell showed significant activity changes before EMG onset. This finding suggests that inhibitory-type cells responded primarily during the actual movement of the tic, and their responses might have been driven by incoming sensory afferents due to muscular contraction.
Propagation of aberrant basal ganglia activity to M1 and cerebellum
Our multisite recordings allowed direct comparison of neuronal response latencies between different regions in the cerebro-basal ganglia networks. Not surprisingly, focal disruption of GABA transmission within the putamen led to the first detectable change in activity in nearby striatal neurons (Fig. 3A,B), demonstrating that abnormal tic-related activity originated in the putamen in the current animal model. Among 53 neurons recorded in the putamen, 49 (92%) showed periodic tic-related responses. All of the observed responses were excitatory in nature and generally occurred against a background of no activity in the intertic interval (Fig. 3B). This striatal burst occurred as early as 290 ms before tic initiation (range, −290 to 100 ms; Fig. 3C).
Figure 3.

Simultaneous recording of cerebro-basal ganglia activity during tics. A, Examples of raw data from EMG (top trace) and simultaneously recorded single cell activity in putamen, GPe, GPi, and M1 after administration of bicuculline. EMG was recorded from the orofacial region. The large voltage transients are tic events. Str, Striatum. B, Perievent raster and histogram of the putamen cell shown in A. Neuronal activity is aligned to tic onset. C, Histogram representing the distribution of response latencies in putamen relative to tic onset. D, Perievent raster and histogram of the multiphasic GPe cell shown in A. E, Histogram representing the distribution of response latencies of GPe neurons. F, Perievent raster and histogram of the inhibitory GPi cell shown in A. G, Histogram representing the distribution of response latencies of all recorded GPi neurons. Note the early onset of activity. H, Perievent raster and histogram of the M1 cell shown in A. I, Histogram showing the distribution of response latencies for all of the recorded M1 neurons.
Overall, tic-related responses displayed a serial progression consistent with the known anatomical connections in the cerebro-basal ganglia circuits (Fig. 3A). Within the GPe, 63% (n = 91/144) of the recorded cells showed tic-related activity. The most common response was an increase of activity before or coincident with EMG activity (n = 75); however, multiphasic (n = 11; Fig. 3D) or inhibitory responses (n = 5) were also observed. The earliest neural response was detected 261 ms before EMG onset (range, −261 to 296 ms; Fig. 3E). In the GPi, tic-related responses were observed in 75% of the recorded neurons (n = 59/81). In contrast to the GPe, inhibition was predominant in the GPi (n = 49; Fig. 3F), which was followed by multiphasic responses (n = 8) and excitation (n = 2). The earliest neural response started 189 ms before tic onset (range, −189 to 130 ms; Fig. 3G). The aberrant tic-related activity then emerged in the M1 (Fig. 3H), where 95% of the recorded neurons (n = 100/105) showed phasic responses to tic events. These responses were all excitatory and manifested as bursts of activity that occurred against a background of no activity in the intertic interval (Fig. 3H). The earliest activation time in M1 was 122 ms before tic activation (range, −122 to 270 ms; Fig. 3I).
We then directly compared the distribution of onset latency of tic-related neuronal firing between each recorded node including the cerebellum. For this comparison, we first used those neurons that discharged earlier than tic-related EMG onset, on the premise that only these neurons could influence tic initiation. Cumulative distributions of onset latency (Fig. 4) and subsequent Kolmogorov–Smirnov (KS) tests (Table 2) revealed significant differences between each node of the basal ganglia versus M1 and cerebellum. Notably, there was no significant difference in latency distribution between cerebellum and M1. These findings suggest that early tic-related activity in the basal ganglia is followed by that in the M1 and cerebellum.
Figure 4.

Comparison of neuronal response latency between each recorded node. The cumulative plots of neuronal onset latency relative to EMG onset are made using those neurons that discharged earlier than tic-related EMG onset (M1, 67; CbllCx, 21; dentate, 16; putamen, 57; Gpe, 45; GPi, 25).
Table 2.
Kolmogorov–Smirnov hypothesis testing and numerical values
| Condition | Significance | p value | KS statistic |
|---|---|---|---|
| M1 versus CbllCx | No | 0.3605 | 0.2269 |
| M1 versus Dentate | No | 0.4106 | 0.2369 |
| M1 versus Str | Yes | 4.4037e-011 | 0.5049 |
| M1 versus GPe | Yes | 1.0115e-006 | 0.5085 |
| M1 versus GPi | Yes | 2.3107e-005 | 0.5403 |
| CbllCx versus Str | Yes | 3.8155e-006 | 0.6750 |
| CbllCx versus GPe | Yes | 3.3031e-004 | 0.5409 |
| CbllCx versus GPi | Yes | 0.0013 | 0.5500 |
| Dentate versus Str | Yes | 1.7112e-004 | 0.6125 |
| Dentate versus GPe | Yes | 0.0051 | 0.4380 |
| Dentate versus GPi | Yes | 0.0156 | 0.4750 |
Str, Striatum.
We further investigated the latency distribution of responding cells in each recorded node with reference to pair-recorded M1 neurons rather than EMG. The reason for this is that the M1 is considered the final output node of the cerebro-basal ganglia circuits that can directly affect spinal cord neurons. Moreover, this analysis removes any potential confounds from daily EMG placement and any variations in detecting tic onset due to less than optimal electrode positioning (Bronfeld et al., 2011). We found that the response latencies in the putamen were consistently earlier than those in the M1 (−78.0 ± 63.8 ms, mean ± SD; n = 38 pairs; Fig. 5A). Both segments of the pallidum (Fig. 5B,C) also showed earlier onset latencies compared with M1 (GPe-M1, −46.5 ± 62.7 ms, n = 59 pairs; GPi-M1, −58.0 ± 74.3 ms, n = 26 pairs). These findings confirmed that the tic signal propagated through the basal ganglia before reaching the M1.
Figure 5.
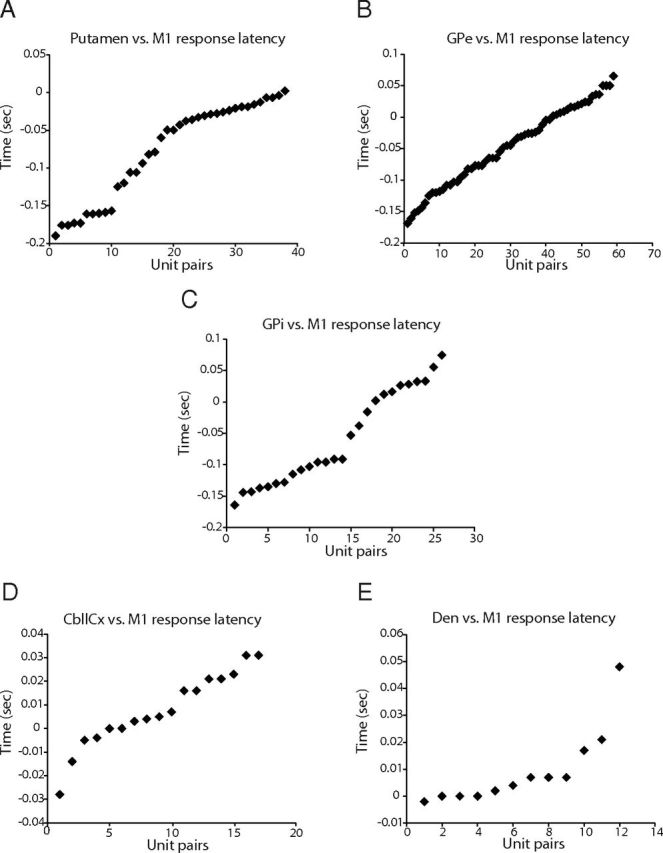
Response latencies of basal ganglia and cerebellar neurons measured relative to pair-recorded M1 neurons. A, Distribution of response latencies of putamen neurons. Negative values indicate that putamen neurons fired before M1 neurons. Note that nearly all activity in the putamen occurred before activity in M1. B, Response latencies of GPe neurons. C, Response latencies of GPi neurons. D, Response latencies of CbllCx neurons. E, Response latencies of dentate nucleus neurons.
As shown above, the relative timings between M1 and cerebellum did not differ statistically when using KS tests and EMG as a marker of tic activity. Paired recording analysis suggested that as a population, activity onset in the cerebellum was almost comparable with (for CbllCx neurons) or lagged behind (for dentate neurons) the responses in M1. Specifically, the difference in onset times between M1 and CbllCx was on average 7.5 ± 15.8 ms (mean ± SD; n = 17 pairs; Fig. 5D), which was not significantly different from 0 (p = 0.07, paired t test). Examination of dentate versus M1 pairs (n = 12) showed that the difference in onset latencies was, on average, 9.2 ± 14.1 ms (Fig. 5E), which was significantly greater than 0 (p = 0.044). A close inspection of the pair-recording data revealed that 47% (8 of 17) of the CbllCx–M1 pairs showed their latency differences that were ≤4 ms, with six pairs of them exhibiting earlier or equal onset times in the CbllCx compared to the M1 (Fig. 5D). In the dentate–M1 pairs (Fig. 5E), 50% (6 of 12) of them showed that their latency difference was ≤4 ms, with four of them demonstrating that dentate neurons fired before or coincidently with M1 neurons (see Discussion).
LFP spikes in tic-generating networks
A cardinal feature of bicuculline injection to the sensorimotor putamen is the synchronous appearance of large periodic LFP spikes at all recorded nodes within the cerebro-basal ganglia circuits. These voltage spikes in the LFP trace occur just before and therefore appear to be causal to EMG bursts (McCairn et al., 2009). Expanding on this previous observation, we found large LFP spikes in both the cortical (Fig. 6A) and deep nuclear divisions of the cerebellum (data not shown), which were also synchronous with EMG bursts. The amplitude and duration of each LFP spike remained unchanged during experimental sessions (CbllCx, 112 ± 18.79 μV, mean ± SEM; dentate, 106 ± 21.03 μV).
Figure 6.

Local field potential recordings during tic states. A, Examples of raw data from EMG (bottom trace) and simultaneously recorded LFPs in putamen (dorsal and ventral regions), GPe, GPi, M1, and CbllCx after administration of bicuculline. The EMG is recorded from the orofacial region. Gray shading shows periods of LFP spike activity in the basal ganglia in the intertic interval; note their absence in M1 and CbllCx. B, Average LFP spike amplitude in the dorsal putamen obtained during tic periods (red trace) and intertic interval (black trace). The inset plot shows statistical comparison of LFP spike shape; note the lack of significant difference between tic-associated LFPs and those in the intertic interval. C, Average LFP spike amplitude in the ventral putamen. Same conventions as in B. D, Average LFP spike amplitude in the GPe. E, Average LFP spike amplitude in the GPi. F, Average LFP spikes in M1. Note the presence of statistical difference in waveform structure between tic state and intertic interval (dashed line in the inset shows the significance level, p = 0.001). G, Average LFP spikes in the CbllCx. Note the presence of statistical difference in waveform structure between tic state and intertic interval.
Within the putamen, a number of discrete LFP spikes were detected. Analysis of LFP spikes revealed a significant difference in amplitude between dorsal and ventral divisions of the nucleus (Fig. 6A). Specifically, LFP spikes were significantly larger in the deeper ventral regions directly below the injection site (dorsal, 164 ± 18.79 μV, mean ± SEM; ventral, 591 ± 21.03 μV; t test, p < 0.001; Fig. 6B,C). It was also found that LFP spikes in the putamen and GP sometimes occurred in the intertic interval despite lack of tic-related EMG activity (Figs. 6A, 7A–D, gray shadings). There was no significant difference in the LFP-spike amplitude between tic and intertic conditions in the basal ganglia structures (Fig. 6A–E; t test analysis of waveform profiles shown in the inset plots).
Figure 7.
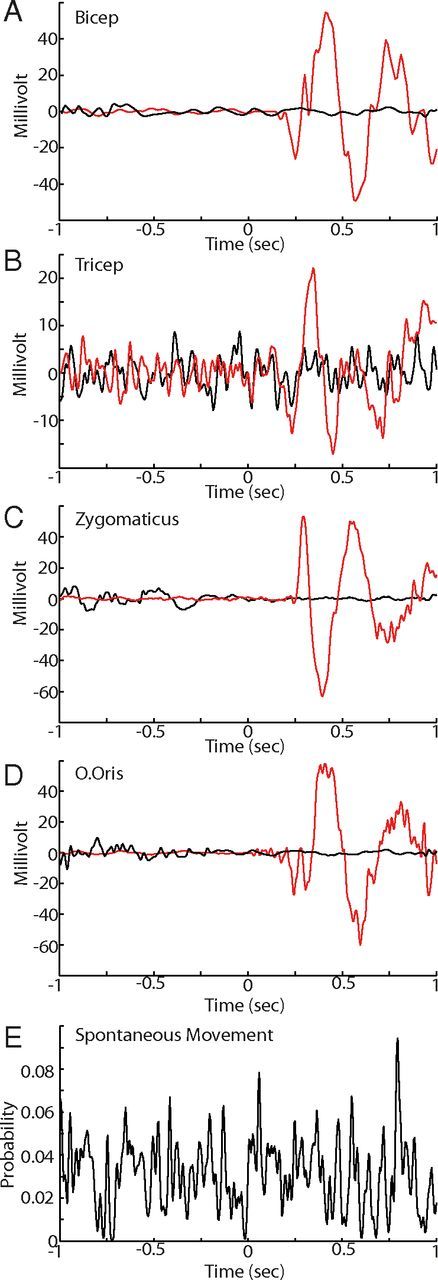
Behavioral analysis between intertic and tic periods. A–D, Examples of raw collapsed EMG traces from an injection day when arm and orofacial tics were present. The data are aligned with the onset of tic-related LFP spikes (red trace) and intertic LFP spikes (black trace) in the striatum. Note that there is no detectable EMG voltage deflection in the intertic interval. E, Probability of a spontaneous movement occurring just before and after intertic LFP spikes. Note the lack of consistent probability increases associated with intertic LFP spikes.
The mean ratio of LFP spikes associated with overt tic movements and those in the intertic interval, although a consistent phenomenon, was highly variable across days and within sessions [6.35 ± 36.8 (mean ± SD)/1]. To determine whether the intertic LFP was associated with any other overt movements, we used frame-by-frame video analysis of any visually detectable movement. (Due to chair constraints, these movements were limited to facial, right forelimb and leg regions.) We found no obvious relationship between spontaneous movement and the appearance of the intertic LFP spikes in the striatum (Fig. 7E). In contrast, large LFP spikes in both M1 and cerebellum were observed only during the tic state with a consistent 1/1 ratio and were absent during the intertic interval, leading to a significant difference in waveform profile between the two conditions (Fig. 6A,F,G). Thus, the emergence of EMG bursts, and therefore the occurrence of tics, was more closely associated with the appearance of large LFP spikes in the cerebellum and M1.
We further analyzed single-unit activity to determine whether there was any change in spiking activity associated with preserved LFP responses in the basal ganglia. We found that in the basal ganglia, spiking activity was either fully (Fig. 8A,C) or partially (Fig. 8B) preserved between the two states. Consistent with the LFP observations, there were significant differences in spike firing in M1 and the cerebellum (Fig. 8D–F). To test the ability of spike firing in each region to predict the onset of tics (basal ganglia vs M1 vs cerebellum), we took a 6 min period from each injection day where there were clear motor tics confined to one region. We then compared the onset of tic-related EMG activity (n = 2542) to identified bursts in the regions of interest using the Legéndy and Salcman (1985) method. Each region had a high probability of being able to detect tic onset from spiking activity, with the probabilities of correct prediction being 0.98, 0.89, and 0.84 for M1, CbllCx, and striatum, respectively.
Figure 8.

Firing rate analysis between the intertic and tic period. A, Comparison of striatal single-cell activity associated with LFP spikes in the intertic (black trace and raster) and tic (red trace and raster) interval. Data are aligned with striatal LFP spike onset. Note the preservation of the response during the intertic interval. B, An example of spiking activity from the GPe between the two states. Note the partial preservation of the response during the intertic interval, with the early inhibitory peak maintained and the later excitatory peak reduced. C, The preservation of response in the GPi between the two intervals. D, Differential M1 activity between the intertic and tic intervals. E, Differential CbllCx activity between the two intervals. F, Differential dentate nucleus activity between the two intervals.
Discussion
Using a nonhuman primate model of motor tics/TS, this study has provided the first electrophysiological evidence showing the involvement of the cerebellum in basal ganglia-mediated tic behavior at the single-cell level. In this model, abnormal tic movements were acute and reversible: they emerged within minutes of drug injection and then disappeared a few hours later. This allowed us to bypass the concerns associated with compensatory mechanisms. The analysis of single-unit activity during the tic state revealed that CbllCx neurons showed a predominantly unidirectional response during tic events (i.e., excitation), while dentate nucleus neurons showed bidirectional changes of activity (i.e., excitation and inhibition), with inhibition coming later than excitation. These responding neurons exhibited phasic modulation in discharge rate that was time locked to individual tic movements. Critically, a sizable number of CbllCx neurons and excitatory-type dentate neurons started their firing before the earliest EMG onset associated with individual tic episodes. This finding suggests that abnormal cerebellar activity in the present study, and probably in TS patients (Bohlhalter et al., 2006; Lerner et al., 2007; Tobe et al., 2010), cannot be ascribed merely to sensory-driven mechanisms.
Our multisite recording technique allowed direct comparison of neuronal response latencies between different neural structures. Not surprisingly, focal disinhibition of the sensorimotor putamen with bicuculline caused tic-related activity in nearby striatal neurons and both segments of the GP. More importantly, such aberrant activity in the basal ganglia then appeared in the M1 and cerebellum with substantially overlapping latencies. Specifically, the latency distribution of early tic-related discharge did not differ between M1 and cerebellum when using EMG as a reference marker. Furthermore, paired neuronal recordings indicated that on a population scale, the onset of M1 activity was statistically indistinguishable from that of CbllCx activity, whereas it was earlier, albeit partially overlapping, than the onset of dentate activity. These data raise the possibility that in addition to transmission via classical cerebrocerebellar descending pathways, aberrant activity identified in the cerebellum, particularly in the CbllCx, might be mediated by the disynaptic link from the basal ganglia to the cerebellum independent of the cerebral cortex (Bostan and Strick, 2010; Bostan et al., 2010).
Potential confounds and limitations
The results from paired recordings between M1 and CbllCx demonstrate overlapping response times to aberrant BG activity, which may indicate divergent pathways exist from the BG. It should be noted, however, that the window of activity for M1 before EMG activation is relatively wide, with activity occurring up to 122 ms before EMG activity. This window potentially makes it possible to record simultaneous M1 and CbllCx neurons, such that it would be theoretically possible to record from a late responding M1 neuron and early responding CbllCx neuron. This possibility is further compounded because M1 to CbllCx transmission can occur in as little as 4–8 ms (Allen and Tsukahara, 1974). To specifically address this confound, it would be necessary to remove cortical input into the system. If cerebellar activity remained after removal of the cortical signals from M1, this would support the existence of a functional subcortical projection from BG to cerebellum.
Another potential confound comes from inferring direct causality on tic expression from the early latency cerebellar activity. The responses observed within the cerebellum may simply reflect collateral transmission of descending volleys, and the observed activity within the cerebellum may not be necessary for tic expression. This limitation could be addressed by suppressing cerebellar activity through pharmacological inhibition, anatomical lesions, or electrical stimulation. Methodological constraints prevented us from applying any of the above methods, and future studies should try to address this issue.
Relevance of findings to TS
Although caution should be exercised with respect to interpretation of the current data set with respect to the ability of the cerebellum to be causal to tic expression, the data are suggestive of a role for the cerebellum in tic expression and that there is interplay between the networks of the BG and motor networks of the M1 and cerebellum in the observed behavioral pathology. Further support for the importance of these networks and in particular for the cerebellum and its ability to induce what are considered classical BG disorders comes from the study of dystonia. Studies in rodents and humans have demonstrated that projections between the cerebellum and BG underlie forms of dystonia (Eidelberg et al., 1995; Calderon et al., 2011; Uluğ et al., 2011). These observations and those from the present study suggest that the cerebellum should be considered when investigating BG disorders.
It has been speculated that cerebellar hyperactivity may contribute to tic initiation in TS patients (Lerner et al., 2007, 2012). In addition to the classical cerebrocerebellar pathways (Allen and Tsukahara, 1974) and the disynaptic STN–CbllCx pathways (Bostan and Strick, 2010; Bostan et al., 2010), the cerebellum might also be capable of influencing tic behavior via pathways that originate in the dentate nucleus and terminate in the putamen (Hoshi et al., 2005). These disynaptic dentate–striatal projections may alter the local network dynamics within the putamen, where aberrant tic-related activity first emerged in the present study. This, in turn, may influence the likelihood of occurrence of subsequent tic episodes. It has been shown that stimulation of the dentate nucleus has persistent effects on striatal activity (Ratcheson and Li, 1969). A tempting hypothesis, which requires future experimental verification, is that once animals have been rendered dyskinetic, dentate-thalamo-striatal disynaptic pathways (Hoshi et al., 2005) play a role in the stability of the dyskinetic state.
Propagation of tic signals through the basal ganglia
A recent study of motor tics using striatal disinhibition has reported that firing of GPi neurons occurs too late to be involved in tic initiation (Bronfeld et al., 2011). We have demonstrated, however, that early activity can be frequently encountered in both segments of the GP. The activity in the GP substantially preceded the onset of tic-related EMG as well as simultaneously recorded M1 activity, which is consistent with pallidal activity recorded in TS patients (Zhuang et al., 2009). We speculate that pallidal recording sites in the study by Bronfeld et al. (2011) and in our study might have differed markedly, thereby causing an apparent discrepancy regarding neuronal onset times. It is our experience that periodic tic-related discharge was widespread in the GP, but early responding cells were localized in its posterior region. This region appears to correspond to the site that receives the largest topographical projections from the corticostriatal motor system (Francois et al., 1984; Parent et al., 1984; Smith and Parent, 1986; Haber et al., 1990; Hedreen and DeLong, 1991). Having identified this region, we focused our recording efforts to sampling from this area. It should be emphasized that the predominant response types in the pallidum we observed, i.e., excitation in the GPe and inhibition in the GPi, were consistent with previous reports (Muramatsu et al., 1990; McCairn et al., 2009, 2012; Bronfeld et al., 2011).
Local field potential activity in cerebro-basal ganglia–cerebellar networks
A consistent, neurophysiological feature of the current tic model was the appearance of large LFP spikes at each node. Overall, these slow, large and periodic voltage deflections were well correlated with the appearance of tic events. Similar results of synchronous LFP activity in the striatum and cerebral cortex have been reported following GABA modulation in felines (McKenzie and Viik, 1975), rodents (Marsden et al., 1975; McKenzie and Viik, 1975; Tarsy et al., 1978), and primates (Darbin and Wichmann, 2008; McCairn et al., 2009). What is novel in the present study was that we identified similar LFP spikes in both cortical and nuclear divisions of the cerebellum. These data suggest that the LFP spikes are a ubiquitous phenomenon affecting key structures in the cortico-basal ganglia–cerebellar networks for developing tics, leading to “global network dysrhythmia.” Interestingly, LFP spikes were present in the basal ganglia not only during expression of tic movements, but also during intertic intervals. In contrast, the emergence of LFP spikes in the cerebellum and M1 was confined to the period of overt tic movements despite ongoing LFP spikes in the basal ganglia during the intertic interval. Thus, the occurrence of tics at the behavioral level was more closely associated with the appearance of LFP spikes in the cerebellum and M1. This finding raises the possibility that the cerebellum and M1 may function as a gate to trigger overt tic movements.
We found that the amplitude of the LFP spikes in the putamen was different between its dorsal and ventral divisions, with larger voltage transients observed in the deeper regions of the putamen relative to the injection site. Previous studies have suggested that the somatotopic arrangement of the putamen follows a dorsal-to-ventral distribution of leg, arm, and then facial areas (Crutcher and DeLong, 1984; Flaherty and Graybiel, 1991). Injection of bicuculline into the dorsal (leg) regions of the putamen may activate the face regions due to activity at the edge of the injection bolus. Neuronal activity at the immediate injection site is usually absent or difficult to find, probably due to excessive bicuculline-derived membrane depolarization, a phenomenon that has been reported in STN neurons after local administration of the drug (Feger et al., 1989). Similar findings of action at a distance relative to injection site in the putamen have been reported previously (Bronfeld et al., 2011). As the face and arm regions are the furthest point from the injection site, these regions may predominate in the behavioral effects observed after injection.
Conclusion
The results presented here demonstrate that tic-generating networks extend beyond classical cerebro-basal ganglia circuits with correlated activity appearing in both cortical and nuclear divisions of the contralateral cerebellum. The global network dysrhythmia identified in this study opens the possibility of targeting the cerebellum as a site of surgical intervention, including deep brain stimulation, for treatment of intractable TS and related disorders. Indeed, early studies have suggested that lesion of the dentate nucleus is beneficial for TS (Nádvorník et al., 1972). The observation of pathological behavior of cerebellar neurons in response to abnormal basal ganglia activity raises the possibility that the cerebellum plays a part in other basal ganglia-mediated disorders, such as Parkinson's disease, dystonia, obsessive-compulsive behavior, and disorders of attention. Multisite recordings in the cerebro-basal ganglia–cerebellar networks using the bicuculline model of cognitive-affective disorders as well as the MPTP (1-methyl-4-phenyl-1,2,3,6-tetrahydropyridine) model of Parkinson's disease will provide a promising avenue to address many intriguing questions.
Footnotes
The monkeys used in this research were provided by the National BioResource Project “Japanese Monkeys” of the Ministry of Education, Culture, Sports, Science & Technology of Japan. We thank Drs. Y. Imamura, Y. Tsunoda, and K. Yoshida for technical assistance.
The authors declare no competing financial interests.
References
- Albin RL, Mink JW. Recent advances in Tourette syndrome research. Trends Neurosci. 2006;29:175–182. doi: 10.1016/j.tins.2006.01.001. [DOI] [PubMed] [Google Scholar]
- Allen GI, Tsukahara N. Cerebrocerebellar communication systems. Physiol Rev. 1974;54:957–1006. doi: 10.1152/physrev.1974.54.4.957. [DOI] [PubMed] [Google Scholar]
- Bohlhalter S, Goldfine A, Matteson S, Garraux G, Hanakawa T, Kansaku K, Wurzman R, Hallett M. Neural correlates of tic generation in Tourette syndrome: an event-related functional MRI study. Brain. 2006;129:2029–2037. doi: 10.1093/brain/awl050. [DOI] [PubMed] [Google Scholar]
- Bostan AC, Strick PL. The cerebellum and basal ganglia are interconnected. Neuropsychol Rev. 2010;20:261–270. doi: 10.1007/s11065-010-9143-9. [DOI] [PMC free article] [PubMed] [Google Scholar]
- Bostan AC, Dum RP, Strick PL. The basal ganglia communicate with the cerebellum. Proc Natl Acad Sci U S A. 2010;107:8452–8456. doi: 10.1073/pnas.1000496107. [DOI] [PMC free article] [PubMed] [Google Scholar]
- Bronfeld M, Belelovsky K, Bar-Gad I. Spatial and temporal properties of tic-related neuronal activity in the cortico-Basal Ganglia loop. J Neurosci. 2011;31:8713–8721. doi: 10.1523/JNEUROSCI.0195-11.2011. [DOI] [PMC free article] [PubMed] [Google Scholar]
- Calderon DP, Fremont R, Kraenzlin F, Khodakhah K. The neural substrates of rapid-onset dystonia-Parkinsonism. Nat Neurosci. 2011;14:357–365. doi: 10.1038/nn.2753. [DOI] [PMC free article] [PubMed] [Google Scholar]
- Crutcher MD, DeLong MR. Single cell studies of the primate putamen. I. Functional organization. Exp Brain Res. 1984;53:233–243. doi: 10.1007/BF00238153. [DOI] [PubMed] [Google Scholar]
- Darbin O, Wichmann T. Effects of striatal GABA-A receptor blockade on striatal and cortical activity in monkeys. J Neurophysiol. 2008;99:1294–1305. doi: 10.1152/jn.01191.2007. [DOI] [PubMed] [Google Scholar]
- Defebvre L. Myoclonus and extrapyramidal diseases. Neurophysiol Clin. 2006;36:319–325. doi: 10.1016/j.neucli.2006.11.003. [DOI] [PubMed] [Google Scholar]
- Eidelberg D, Moeller JR, Ishikawa T, Dhawan V, Spetsieris P, Przedborski S, Fahn S. The metabolic topography of idiopathic torsion dystonia. Brain. 1995;118:1473–1484. doi: 10.1093/brain/118.6.1473. [DOI] [PubMed] [Google Scholar]
- Feger J, Vezole I, Renwart N, Robledo P. The rat subthalamic nucleus: electrophysiological and behavioral data. In: Crossman AR, Sambrook MA, editors. Neural Mechanisms in Disorders of Movement, Current Problems in Neurology. Vol. 9. London: Libbey; 1989. pp. 37–43. [Google Scholar]
- Flaherty AW, Graybiel AM. Corticostriatal transformations in the primate somatosensory system. Projections from physiologically mapped body-part representations. J Neurophysiol. 1991;66:1249–1263. doi: 10.1152/jn.1991.66.4.1249. [DOI] [PubMed] [Google Scholar]
- Francois C, Percheron G, Yelnik J. Localization of nigrostriatal, nigrothalamic and nigrotectal neurons in ventricular coordinates in macaques. Neuroscience. 1984;13:61–76. doi: 10.1016/0306-4522(84)90259-8. [DOI] [PubMed] [Google Scholar]
- Grabli D, McCairn K, Hirsch EC, Agid Y, Féger J, François C, Tremblay L. Behavioural disorders induced by external globus pallidus dysfunction in primates: I. Behavioural study. Brain. 2004;127:2039–2054. doi: 10.1093/brain/awh220. [DOI] [PubMed] [Google Scholar]
- Haber SN, Lynd E, Klein C, Groenewegen HJ. Topographic organization of the ventral striatal efferent projections in the rhesus monkey: an anterograde tracing study. J Comp Neurol. 1990;293:282–298. doi: 10.1002/cne.902930210. [DOI] [PubMed] [Google Scholar]
- Hedreen JC, DeLong MR. Organization of striatopallidal, striatonigral, and nigrostriatal projections in the macaque. J Comp Neurol. 1991;304:569–595. doi: 10.1002/cne.903040406. [DOI] [PubMed] [Google Scholar]
- Hoshi E, Tremblay L, Féger J, Carras PL, Strick PL. The cerebellum communicates with the basal ganglia. Nat Neurosci. 2005;8:1491–1493. doi: 10.1038/nn1544. [DOI] [PubMed] [Google Scholar]
- Jankovic J, Ashizawa T. Tourettism associated with Huntington's disease. Mov Disord. 1995;10:103–105. doi: 10.1002/mds.870100116. [DOI] [PubMed] [Google Scholar]
- Kalanithi PS, Zheng W, Kataoka Y, DiFiglia M, Grantz H, Saper CB, Schwartz ML, Leckman JF, Vaccarino FM. Altered parvalbumin-positive neuron distribution in basal ganglia of individuals with Tourette syndrome. Proc Natl Acad Sci U S A. 2005;102:13307–13312. doi: 10.1073/pnas.0502624102. [DOI] [PMC free article] [PubMed] [Google Scholar]
- Kataoka Y, Kalanithi PS, Grantz H, Schwartz ML, Saper C, Leckman JF, Vaccarino FM. Decreased number of parvalbumin and cholinergic interneurons in the striatum of individuals with Tourette syndrome. J Comp Neurol. 2010;518:277–291. doi: 10.1002/cne.22206. [DOI] [PMC free article] [PubMed] [Google Scholar]
- Kusama T, Mabuchi M. Stereotaxic atlas of the brain of Macaca fuscata. Tokyo: University of Tokyo; 1970. [Google Scholar]
- Legéndy CR, Salcman M. Bursts and recurrences of bursts in the spike trains of spontaneously active striate cortex neurons. J Neurophysiol. 1985;53:926–939. doi: 10.1152/jn.1985.53.4.926. [DOI] [PubMed] [Google Scholar]
- Lerner A, Bagic A, Boudreau EA, Hanakawa T, Pagan F, Mari Z, Bara-Jimenez W, Aksu M, Garraux G, Simmons JM, Sato S, Murphy DL, Hallett M. Neuroimaging of neuronal circuits involved in tic generation in patients with Tourette syndrome. Neurology. 2007;68:1979–1987. doi: 10.1212/01.wnl.0000264417.18604.12. [DOI] [PubMed] [Google Scholar]
- Lerner A, Bagic A, Simmons JM, Mari Z, Bonne O, Xu B, Kazuba D, Herscovitch P, Carson RE, Murphy DL, Drevets WC, Hallett M. Widespread abnormality of the gamma-aminobutyric acid-ergic system in Tourette syndrome. Brain. 2012;135:1926–1936. doi: 10.1093/brain/aws104. [DOI] [PMC free article] [PubMed] [Google Scholar]
- Marsden CD, Meldrum BS, Pycock C, Tarsy D. Focal myoclonus produced by injection of picrotoxin into the caudate nucleus of the rat. J Physiol. 1975;246:96P. [PubMed] [Google Scholar]
- McCairn KW, Turner RS. Deep brain stimulation of the globus pallidus internus in the parkinsonian primate: local entrainment and suppression of low-frequency oscillations. J Neurophysiol. 2009;101:1941–1960. doi: 10.1152/jn.91092.2008. [DOI] [PMC free article] [PubMed] [Google Scholar]
- McCairn KW, Bronfeld M, Belelovsky K, Bar-Gad I. The neurophysiological correlates of motor tics following focal striatal disinhibition. Brain. 2009;132:2125–2138. doi: 10.1093/brain/awp142. [DOI] [PubMed] [Google Scholar]
- McCairn KW, Iriki A, Isoda M. High-frequency pallidal stimulation eliminates tic-related neuronal activity in a nonhuman primate model of Tourette syndrome. Neuroreport. 2012;23:206–210. doi: 10.1097/WNR.0b013e32834fab9d. [DOI] [PubMed] [Google Scholar]
- McKenzie GM, Viik K. Chemically induced chorieform activity: antagonism by GABA and EEG patterns. Exp Neurol. 1975;46:229–243. doi: 10.1016/0014-4886(75)90045-x. [DOI] [PubMed] [Google Scholar]
- Mink JW. Basal ganglia dysfunction in Tourette's syndrome: a new hypothesis. Pediatr Neurol. 2001;25:190–198. doi: 10.1016/s0887-8994(01)00262-4. [DOI] [PubMed] [Google Scholar]
- Muramatsu S, Yoshida M, Nakamura S. Electrophysiological study of dyskinesia produced by microinjection of picrotoxin into the striatum of the rat. Neurosci Res. 1990;7:369–380. doi: 10.1016/0168-0102(90)90011-3. [DOI] [PubMed] [Google Scholar]
- Nádvorník P, Sramka M, Lisý L, Svicka I. Experiences with dentatotomy. Confin Neurol. 1972;34:320–324. doi: 10.1159/000103076. [DOI] [PubMed] [Google Scholar]
- Obeso JA, Rothwell JC, Lang AE, Marsden CD. Myoclonic dystonia. Neurology. 1983;33:825–830. doi: 10.1212/wnl.33.7.825. [DOI] [PubMed] [Google Scholar]
- Parent A, Bouchard C, Smith Y. The striatopallidal and striatonigral projections: two distinct fiber systems in primate. Brain Res. 1984;303:385–390. doi: 10.1016/0006-8993(84)91224-1. [DOI] [PubMed] [Google Scholar]
- Peterson BS. Neuroimaging studies of Tourette syndrome: a decade of progress. Adv Neurol. 2001;85:179–196. [PubMed] [Google Scholar]
- Pourfar M, Feigin A, Tang CC, Carbon-Correll M, Bussa M, Budman C, Dhawan V, Eidelberg D. Abnormal metabolic brain networks in Tourette syndrome. Neurology. 2011;76:944–952. doi: 10.1212/WNL.0b013e3182104106. [DOI] [PMC free article] [PubMed] [Google Scholar]
- Ratcheson RA, Li CL. Effect of dentate stimulation on neuronal activity in the caudate nucleus. Exp Neurol. 1969;25:268–281. doi: 10.1016/0014-4886(69)90050-8. [DOI] [PubMed] [Google Scholar]
- Smith Y, Parent A. Differential connections of caudate nucleus and putamen in the squirrel monkey (Saimiri sciureus) Neuroscience. 1986;18:347–371. doi: 10.1016/0306-4522(86)90159-4. [DOI] [PubMed] [Google Scholar]
- Tarsy D, Pycock CJ, Meldrum BS, Marsden CD. Focal contralateral myoclonus produced by inhibition of GABA action in the caudate nucleus of rats. Brain. 1978;101:143–162. doi: 10.1093/brain/101.1.143. [DOI] [PubMed] [Google Scholar]
- Tobe RH, Bansal R, Xu D, Hao X, Liu J, Sanchez J, Peterson BS. Cerebellar morphology in Tourette syndrome and obsessive-compulsive disorder. Ann Neurol. 2010;67:479–487. doi: 10.1002/ana.21918. [DOI] [PMC free article] [PubMed] [Google Scholar]
- Tourette Syndrome Classification Study Group. Definitions and classification of tic disorders. Arch Neurol. 1993;50:1013–1016. doi: 10.1001/archneur.1993.00540100012008. [DOI] [PubMed] [Google Scholar]
- Uluğ AM, Vo A, Argyelan M, Tanabe L, Schiffer WK, Dewey S, Dauer WT, Eidelberg D. Cerebellothalamocortical pathway abnormalities in torsinA DYT1 knock-in mice. Proc Natl Acad Sci U S A. 2011;108:6638–6643. doi: 10.1073/pnas.1016445108. [DOI] [PMC free article] [PubMed] [Google Scholar]
- Vercueil L. Myoclonus and movement disorders. Neurophysiol Clin. 2006;36:327–331. doi: 10.1016/j.neucli.2006.12.002. [DOI] [PubMed] [Google Scholar]
- Vogel CM, Drury I, Terry LC, Young AB. Myoclonus in adult Huntington's disease. Ann Neurol. 1991;29:213–215. doi: 10.1002/ana.410290217. [DOI] [PubMed] [Google Scholar]
- Worbe Y, Baup N, Grabli D, Chaigneau M, Mounayar S, McCairn K, Féger J, Tremblay L. Behavioral and movement disorders induced by local inhibitory dysfunction in primate striatum. Cereb Cortex. 2009;19:1844–1856. doi: 10.1093/cercor/bhn214. [DOI] [PubMed] [Google Scholar]
- Zhuang P, Hallett M, Zhang X, Li J, Zhang Y, Li Y. Neuronal activity in the globus pallidus internus in patients with tics. J Neurol Neurosurg Psychiatry. 2009;80:1075–1081. doi: 10.1136/jnnp.2008.161869. [DOI] [PubMed] [Google Scholar]
- Zohar AH, Pauls DL, Ratzoni G, Apter A, Dycian A, Binder M, King R, Leckman JF, Kron S, Cohen DJ. Obsessive-compulsive disorder with and without tics in an epidemiological sample of adolescents. Am J Psychiatry. 1997;154:274–276. doi: 10.1176/ajp.154.2.274. [DOI] [PubMed] [Google Scholar]