

Abstract
Parvalbumin (PV)-producing fast-spiking neurons are well known to generate gamma oscillation by mutual chemical and electrical connections in the neocortex. Although it was clearly demonstrated that PV neurons form a dense gap junction network with each other not only at the proximal sites but also at the distal dendrites, comprehensive quantitative data on the chemical connections are still lacking. To elucidate the connectivity, we investigated inhibitory inputs to PV neurons in the somatosensory cortex, using the transgenic mice in which the dendrites and cell bodies of PV neurons were clearly visualized. We first examined GABAergic inputs to PV neurons by labeling postsynaptic and presynaptic sites with the immunoreactivities for gephyrin and vesicular GABA transporter. The density of GABAergic inputs was highest on the cell bodies, and almost linearly decreased to the distal dendrites. We then investigated inhibitory inputs from three distinct subgroups of GABAergic interneurons by visualizing the axon terminals immunopositive for PV, somatostatin (SOM), or vasoactive intestinal polypeptide (VIP). PV and SOM inputs were frequently located on the dendrites with the ratio of 2.5:1, but much less on the cell bodies. By contrast, VIP inputs clearly preferred the cell bodies to the dendrites. Consequently, the dendritic and somatic compartments of PV neurons received ∼60 and 62% of inhibitory inputs from PV and VIP neurons, respectively. This compartmental organization of inhibitory inputs suggests that PV neurons, together with gap junctions, constitute mutual connections at the dendrites, and that their activities are negatively controlled by the somatic inputs of VIP neurons.
Introduction
Neocortical GABAergic interneurons constitute 20–30% of neurons in the mammalian cerebral cortex. They are divided into at least three distinct subgroups by chemical markers in the mouse neocortex (Xu et al., 2010): (1) parvalbumin (PV)-producing cells, (2) somatostatin (SOM)-producing cells, and (3) the cells immunoreactive for other markers such as vasoactive intestinal polypeptides (VIPs). PV neurons, mostly corresponding to fast-spiking (FS) neurons (Kawaguchi and Kubota, 1993), are the major component of cortical GABAergic interneurons, and have attracted particular attention in the basic and clinical neurosciences. PV-producing FS neurons are considered to participate in the generation of gamma oscillation (Whittington et al., 1995; Hestrin and Galarreta, 2005; Somogyi and Klausberger, 2005; Bartos et al., 2007), and to enhance information processing by controlling the activity of pyramidal cells (Sohal et al., 2009). It has also been reported that PV-producing FS neurons play a key role in motor control (Isomura et al., 2009), higher order brain functions such as memory (Letzkus et al., 2011), and psychiatric disorders including schizophrenia (Lewis et al., 2005, 2012). It is, therefore, a crucial issue to reveal the precise structural rules of the PV neuron network, as pointed out previously (Bartos et al., 2007).
The connectivity between FS neurons in the neocortex has been extensively investigated by using paired recording experiments with acute slices. FS neurons are interconnected with each other through chemical and electrical synapses (Galarreta and Hestrin, 1999, 2001, 2002; Gibson et al., 1999). These mutual connections were reportedly located mainly on the cell bodies and proximal dendrites between neighboring pairs of FS basket cells, the major population of FS neurons, by light and electron microscopic analyses (Tamás et al., 1997, 1998, 2000; Gupta et al., 2000). However, it was recently demonstrated that gap junctions are distributed not only at the proximal sites but also at the distal dendrites of PV neurons in the rat and cat neocortex by confocal laser-scanning and electron microscopic observations of the immunoreactivity for gap junction protein connexin36 (Fukuda and Kosaka, 2003; Fukuda et al., 2006). On the other hand, there was no quantitative study about the chemical connections at the distal dendrites between PV neurons.
We have recently generated transgenic mice expressing somatodendritic membrane-targeted green fluorescent protein (GFP) almost specifically in PV neurons, and succeeded in visualizing their dendrites and cell bodies efficiently (Kameda et al., 2012). We then found that GABAergic terminals were more densely distributed on the cell bodies than on the dendrites, compared with glutamatergic ones in the primary somatosensory cortex (S1). This result leads to a further question about inhibitory inputs to PV neurons: Are there any positional preferences of inhibitory inputs to PV neurons among GABAergic subgroups? To address this question, we here visualized different presynaptic GABAergic subgroup markers such as PV, SOM, and VIP in the transgenic mice, and quantitatively investigated these subgroup inputs. In addition, to estimate inhibitory synaptic inputs more accurately than before, we used the immunoreactivity for gephyrin as a postsynaptic marker for inhibitory synapses (Fritschy et al., 2008).
Materials and Methods
All animal care and use were in accordance with the National Institutes of Health Guide for the Care and Use of Laboratory Animals, and the experiments were approved by the Committee for Animal Care and Use and that for Recombinant DNA Study in Kyoto University. Ten adult male C57BL/6 mice (8 weeks; Japan SLC, Hamamatsu) and five adult male transgenic mice (8 weeks) were used in the present study. The transgenic mice express somatodendritic membrane-targeted GFP (myrGFP-LDLRct) specifically in PV neurons. The dendrites and cell bodies were sufficiently visualized in the mice compared with immunofluorescence staining for PV. Indeed, the dendrites were clearly observed with GFP immunoreactivity up to their ends, and small swellings were usually found ∼1.0 μm from the end of the dendrites (Kameda et al., 2012, their Fig. 2A–C″ and Fig. 7A). All efforts were made to minimize animal suffering and the number of animals used.
Figure 2.

Chemical characterization of three distinct subgroups of GABAergic neurons in the S1. A–C″, We performed double immunofluorescence labeling for PV, SOM, and VIP, and found no overlap in the cell bodies between these chemical markers in the mouse S1. D–F″, GAD67 mRNA and the immunoreactivity for PV, SOM, or VIP were visualized with FastRed (magenta) and AF488 (green), respectively. Almost all of the cells immunoreactive for PV, SOM, or VIP displayed the signals for GAD67 mRNA (arrowheads). G–I, PV, SOM, or VIP immunoreactivity in VGAT-immunopositive terminal-like structures in the S1. VGAT and PV, SOM, or VIP immunoreactivities were visualized with AF488 (green) and AF647 (magenta), respectively. We randomly selected six sites in the middle portion of each layer of the S1 in three wild mice, acquired 3D image stacks under a confocal laser-scanning microscope, and the colocalization of the immunoreactivities in the axon terminal-like structures (arrowheads). Approximately 80 of VGAT-positive terminals at each site were analyzed in the present study. Arrows in G indicated the presumed dendrites or axon fibers, which were not punctate but usually showed long or straight profiles in the 3D stack. Scale bars: (in F″) A–F′, 20 μm; (in I) G, H, 2 μm.
Figure 7.

A summary diagram. A, The density of GABAergic, PV, SOM, and VIP inputs to PV neurons at different somatodendritic positions. B, Each column represents the relative frequencies of PV, SOM, and VIP inputs in GABAergic inputs to PV neurons. C, Schematic diagram summarizing the neocortical GABAergic network. See Discussion for more details. Pyr, pyramidal cell.
Tissue preparation.
Five transgenic mice and four wild mice were deeply anesthetized with chloral hydrate (70 mg/100 g body weight), and perfused transcardially with 20 ml of 5 mm phosphate-buffered 0.9% saline (PBS; pH 7.4), followed by perfusion for 10 min with the same volume of 4% formaldehyde, 75%-saturated picric acid, and 0.1 m Na2HPO4 (adjusted to pH 7.0 with NaOH). The brains were removed, and postfixed for 4 h at 4°C with the same fixative. After cryoprotection with 30% sucrose in PBS, the brains were cut into 30-μm-thick frontal sections on a freezing microtome.
For in situ hybridization histochemistry, we instead used 4% formaldehyde in 0.1 m sodium phosphate (PB; pH 7.4) as a fixative and postfixed the brain blocks with the same fixative for 3 d at 4°C in three wild mice. After cryoprotection with 30% sucrose in PBS, the brains were cut into 20-μm-thick frontal sections on a freezing microtome.
Double labeling with fluorescence in situ hybridization and immunofluorescence.
The following hybridization procedure was performed as reported previously (Hioki et al., 2010). Briefly, free-floating sections were hybridized for 16–20 h at 60°C with 1 μg/ml digoxigenin (DIG)-labeled sense or antisense riboprobe (Roche Applied Science) for glutamate decarboxylase 67 kDa isoform (GAD67; Tamamaki et al., 2003) in a hybridization buffer. After washes and ribonuclease A (RNase A) treatment, the sections were incubated overnight with a mixture of 1:1000-diluted alkaline phosphatase-conjugated anti-DIG sheep antibody (11–093-274–910; Roche Applied Science) and one of the following antibodies: mouse monoclonal antibody against PV (P-3088; Sigma; 1:4000); rabbit polyclonal antibody against SOM (A09211; Peninsula Laboratories; 1:2000); and rabbit polyclonal antibody against VIP (20077; ImmunoStar; 1:500). The sections were then incubated for 2 h with 5 μg/ml Alexa Fluor (AF)488-conjugated antibody against mouse IgG or rabbit IgG (A-11029 or A-11034; Invitrogen), and finally reacted with HNPP Fluorescence Detection kit (HNPP/FastRed; Roche Applied Science) for several hours. Sense probe detected no signal higher than the background.
Double immunofluorescence labeling.
The brain sections obtained from the wild mice were incubated overnight with one of the following mixtures: (1) 1/4000-diluted mouse anti-PV antibody and 1/2000-diluted rabbit anti-SOM antibody, (2) 1/4000-diluted mouse anti-PV antibody and 1/500-diluted rabbit anti-VIP antibody, (3) 1/500-diluted rat anti-SOM antibody (MAB354; Millipore) and 1/500-diluted rabbit anti-VIP antibody, (4) 1 μg/ml mouse anti-gephyrin antibody (147011; Synaptic Systems) and 1 μg/ml rabbit anti-vesicular GABA transporter (VGAT) antibody (131003; Synaptic Systems), (5) 1 μg/ml mouse anti-VGAT antibody (131011; Synaptic Systems) and 1 μg/ml rabbit anti-gephyrin antibody (147003; Synaptic Systems), (6) 1 μg/ml rabbit anti-VGAT antibody and 1/4000-diluted mouse anti-PV antibody, (7) 1 μg/ml mouse anti-VGAT antibody and 1/2000-diluted rabbit anti-SOM antibody; and (8) 1 μg/ml mouse anti-VGAT antibody and 1/500-diluted rabbit anti-VIP antibody. The incubation was performed at room temperature in PBS containing 0.3% Triton X-100, 0.25% λ-carrageenan and 1% normal donkey serum (NDS) (PBS-XCD). Lambda carrageenan is a soluble substance that belongs to a family of linear sulfated polysaccharides and contributes to a high viscosity of the incubation medium. We have been applying this substance to the immunostaining, since it was helpful in avoiding uneven binding of antibodies to sections (Kaneko and Mizuno, 1988). After several washes, the sections were incubated for 2 h with a mixture of 5 μg/ml AF488-conjugated antibody against mouse IgG, rabbit IgG, or rat IgG (A-21208; Invitrogen) and 5 μg/ml AF594-conjugated antibody against rabbit IgG (A-11037; Invitrogen) or AF647-conjugated antibody against rabbit IgG or mouse IgG (A-21245 or A-21236; Invitrogen) in PBS-XCD.
Triple immunofluorescence labeling.
The brain sections obtained from the transgenic mice were incubated overnight with a mixture of 1.0 μg/ml guinea pig anti-GFP antibody (Nakamura et al., 2008), 1.0 μg/ml mouse or rabbit anti-gephyrin antibody, and one of the following antibodies: 1 μg/ml rabbit anti-VGAT antibody, 1/4000-diluted mouse anti-PV antibody, 1/2000-diluted rabbit anti-SOM antibody, and 1/500-diluted rabbit anti-VIP antibody. The sections were then incubated overnight with a mixture of 5 μg/ml AF488-conjugated antibody against guinea pig IgG (A-11073; Invitrogen), AF568-conjugated antibody against mouse or rabbit IgG (A-11031 or A-11036; Invitrogen), and AF647-conjugated antibody against rabbit or mouse IgG.
Image acquisition.
The sections were mounted onto aminopropyltriethoxysilane-coated glass slides and coverslipped with CC/Mount (K002; Diagnostic BioSystems) or 50% (v/v) glycerol and 2.5% (w/v) triethylenediamine in PBS. For cell counting, the sections were observed under an epifluorescence microscope Axiophot (Carl Zeiss) with appropriate filter sets for AF488 (450–490 nm excitation and 514–565 nm emission), FastRed, and AF594 (530–585 nm excitation and ≥615 nm emission), using a 40× objective lens (Plan-NEOFLUAR, NA = 0.75; Carl Zeiss). The digital images were captured with the QICAM FAST digital monochrome camera (QIMAGING), modified (≤20% contrast enhancement) in software Canvas X (ACD Systems), and saved as TIFF files. Neocortical areas and cortical layers were determined by NeuN immunoreactivity or DAPI nuclear staining.
Other sections were observed under an AOBS-TCS SP2 confocal laser-scanning microscope (Leica) with a 63× oil-immersion objective lens (HCX PL APO, NA = 1.40; Leica) and the pinhole set at 1.0 Airy disk unit. Image size was 512 × 512 pixels, and the zoom factor was set to 1, 16, or 32, which corresponded to a pixel dimension of 465, 29.06, or 14.53 nm in both the X and Y directions, respectively. AF488, AF568, or AF647 was excited with 488, 543, or 633 nm laser beams and observed through 500–580, 590–650, or 660–850 nm emission prism windows, respectively. Up to 150 images with a Z-interval of 122 nm were acquired per stack, and deconvolved using software Huygens Essential (version 3.7; Scientific Volume Imaging) with the following parameters: microscopic type, confocal; back projected pinhole diameter, 238 nm; lens objective NA, 1.4; lens immersion refractive index, 1.515; medium refractive index, 1.515; excitation wavelength, 488, 543, or 633 nm; emission wavelength, 519, 603, or 668 nm; vertical mapping function, log; algorithm, classical maximum likelihood estimation; background estimation mode, lowest; relative background, 0%; maximum iteration number, 40; signal-to-noise ratio, 3–10; quality threshold, 0.1; iteration mode, fast; photobleaching correction, auto; and brick layout, auto. Morphological parameters (dendritic length, section area, and somatic length) in the 3D images were measured by using software LSM 5 Image Examiner (Carl Zeiss). All confocal images were modified (≤40% contrast enhancement) in software Canvas X and saved as 8-bit/color TIFF files.
Immunoelectron microscopy.
Three wild mice were deeply anesthetized with chloral hydrate, perfused transcardially with 20 ml of PBS, and then perfused with the same volume of 4% paraformaldehyde and 0.05% glutaraldehyde in 0.1 m sodium PB, pH 7.4. After postfixation for 20 h with 4% paraformaldehyde in 0.1 m PB at 4°C, the brain blocks were cut into 50-μm-thick coronal sections with a Super Microslicer Zero 1 (Dosaka). Sections were placed in PBS containing 30% sucrose for 1 h and then freeze-thawed with liquid nitrogen for enhancement of the penetration of antibody (Li et al., 2012).
Subsequently, the sections were pre-incubated for 30 min in PBS containing 20% NDS, 0.1% Photo-flo (Kodak), and then incubated overnight at 4°C with a mixture of 5 μg/ml anti-VGAT mouse antibody and 5 μg/ml rabbit antibody against gephyrin in PBS containing 2% NDS and 0.1% Photo-flo. After incubation overnight at 4°C with a mixture of 10 μg/ml biotinylated anti-mouse IgG donkey antibody (Jackson ImmunoResearch Laboratories) and 1/20-diluted gold-conjugated anti-rabbit pig IgG goat antibody (Ultra-small Gold Reagent; Aurion), the sections were postfixed with 1% glutaraldehyde in 0.1 m PB for 10 min. After washes with distilled water, gold particles were developed in the dark with a silver enhancement kit (R-GENT SE-EM; Aurion). The sections were incubated for 4 h with avidin-biotinylated peroxidase complex (1:100; ABC-Elite; Vector Laboratories) in PBS and reacted for 40–60 min with 0.02% diaminobenzidine (DAB) and 0.0002% H2O2 in 0.1 m Tris-HCl, pH 7.6. The sections were then washed with 0.1 m PB, placed for 40 min in 0.1 m PB containing 1% osmium tetroxide, counterstained for 30 min with 1% uranyl acetate, dehydrated, and flat embedded in epoxy resin.
After polymerization of the resin, each tissue samples were cut into 70-nm-thick ultrathin sections by a diamond knife on an ultramicrotome (Leica Ultracut UCT) and mounted on pioloform-coated copper grids (Stork Veco; Eerbeek). The sections were finally examined with an electron microscope (H-7650; Hitachi) at 80 kV. All the digital images were modified (≤30% contrast enhancement) in software Canvas X and saved as 8-bit TIFF files.
Estimation of synaptic input density to PV-expressing neurons.
After triple immunofluorescence staining for GFP, gephyrin, and one of the presynaptic markers as described above, we randomly selected eight PV neurons in the middle one-third portion of each layer of the S1 in the transgenic mice without reference to the barrel-septum structures, and acquired image stacks under a confocal laser-scanning microscope to locate the sample points (Fig. 1A,A′). Since the dendritic length of L4–L5 PV neurons was shorter than that of L2/3 and L6 PV neurons (Kameda et al., 2012) and even the longest dendrite of randomly selected L4–L5 neurons was often 140 μm long and a little longer, we selected a long dendrite per cell and sampled the data on the dendritic compartments at 20, 80, and 140 μm away from the cell body alongside the dendrite (Fig. 1B). All the dendrites analyzed here were located in the same layer as the cell bodies were located.
Figure 1.
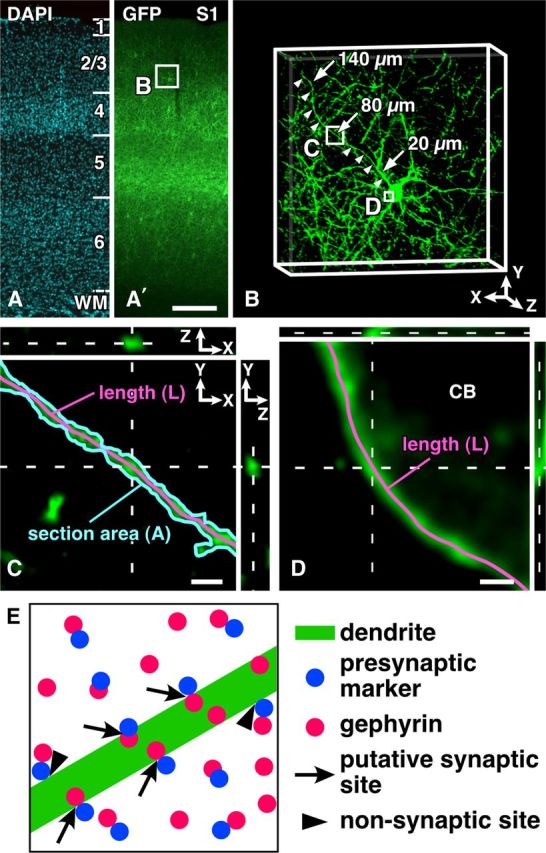
Sampling of PV neurons in the S1 and estimation of the surface area. A, A′, After triple immunofluorescence staining for GFP, gephyrin, and one of the presynaptic markers, we randomly selected two PV neurons in the middle portion of each cortical layer of the S1 in the four transgenic mice (a total of eight neurons in each layer). B, We then captured 3D image stacks, chose a long dendrite (arrowheads) per cell, and marked the sites at the distances of 20, 80, and 140 μm away from the cell body (CB) alongside the dendrite (arrows). C, D, At high magnification, we acquired 3D image stacks at 13.0–21.7 μm long dendritic compartments (20, 80, and 140 μm away from CB) and at the somatic compartment (three image stacks were randomly selected per soma), and calculated the surface area [μm2]. For further details, see Materials and Methods. E, Schematic demonstration of the input sites of inhibitory terminals onto a GFP-positive dendrite. We counted close contacts/appositions between presynaptic marker-positive punctae and GFP-positive somatodendritic compartments as inhibitory input sites, only when gephyrin immunoreactivity was apposed to the presynaptic punctae from the GFP-positive side (arrows). Arrowheads indicate the close contacts that are not judged as input sites, since gephyrin immunoreactivity is observed outside of the GFP-positive postsynaptic site. Scale bars: (in A′) A, 200 μm; C, 2 μm; D, 1 μm.
3D image stacks of higher magnification were captured at the dendritic compartments located at the three different distances from the cell body (zoom factor = 16; Fig. 1C). Each analyzed dendritic compartment was 13.0–21.7 μm long, and its center was located exactly at 20, 80, or 140 μm from the cell body. The surface area of the dendrite (Sd) was estimated by the following formula when the dendrite was regarded as cylinder: the diameter of the dendrite (D) = [section area (A)]/[dendritic length (L)] and then, Sd = π × D × L. On the somatic membrane, we randomly selected three sites per soma in the thin optical section that ran through the center of the cell body, and acquired 3D image stacks of higher magnification (zoom factor = 32; Fig. 1D). The somatic membrane of three analyzed sites was almost perpendicular to XY plane, and the surface area (Sc) was estimated by the following formula: Sc = ∑3 sites {length (L) × [thickness of the optical section in z-axis (0.610–1.464 μm)]}.
To count the number of putative synaptic input sites on the somatodendritic membrane of PV neurons, we observed the image stack in 3D by using software LSM 5 Image Examiner. We first observed close contacts between presynaptic marker-positive punctae and GFP-positive dendrites or cell bodies in all the XY, XZ, and YZ planes, continually changing the Z depth in the image stack. The two fluorescences often overlapped partially with each other probably because of the limited spatial resolution of the fluorescence microscopy. Further, only when the immunoreactivity for postsynaptic marker gephyrin was found at the somatodendritic side of the contact, did we count the contact as a putative synaptic input site (Fig. 1E, arrows). Finally, we divided the number of putative synaptic inputs by the surface area of somatodendritic membrane (Sd or Sc) to obtain synaptic input density [/μm2].
Statistical analysis.
Multiple comparisons were performed by Tukey's multiple-comparison test after one-way ANOVA (Prism4.0c; GraphPad Software.). The frequency histogram of PV neurons against the density of VIP inputs on the cell bodies was analyzed by nonlinear regression with a mixture of Gaussian distributions. Fitting was performed by maximum likelihood estimation, and the model was selected by the Bayesian information criterion (Schwarz, 1978) (Igor 5.05; WaveMetrics).
Results
Three distinct subgroups of GABAergic neurons
In the present study, we investigated the cell type-specific inhibitory inputs to PV neurons by visualizing presynaptic terminals with the anti-PV, anti-SOM, or anti-VIP antibody. Although these chemical markers were well known to constitute three distinct subgroups in the rat neocortex (Kawaguchi and Kubota, 1996, 1997), there was a controversy in the mouse visual cortex about the presence (Gonchar et al., 2007) or absence of VIP neurons that were immunoreactive for SOM (Xu et al., 2010). We thus attempted to determine whether or not these chemical markers might show overlap in the mouse S1. As reported by Xu et al. (2010), we observed no colocalization between SOM and VIP immunoreactivities as well as between PV and SOM or between PV and VIP immunoreactivities (Fig. 2A–C″) at least by the present immunofluorescence method and antibodies. The previous (Xu et al., 2010) and present findings thus indicate that these three makers distinguish the separate subgroups of neocortical GABAergic interneurons in the mouse neocortex. In addition, the proportion of those three subgroups in GABAergic neurons was estimated by combining fluorescence in situ hybridization for GAD67 mRNA and immunofluorescence for PV, SOM, or VIP in the S1 (Fig. 2D–F″). PV-, SOM-, and VIP-positive cells accounted for 43.5, 22.9, or 9.7% of GAD67-expressing neurons, respectively, across entire layers (Table 1), collectively covering 76.1% of GABAergic neurons.
Table 1.
Laminar distributions of three distinct subgroups of GABAergic neurons in the S1
| PV | SOM | VIP | |
|---|---|---|---|
| L1 | 0 (0/201)a | 0 (0/147) | 2.3 ± 2.0b (4/183) |
| L2/3 | 33.4 ± 3.2 (413/1216) | 13.2 ± 3.1 (171/1276) | 23.7 ± 2.1 (301/1271) |
| L4 | 54.2 ± 5.1 (617/1122) | 16.1 ± 3.1 (158/1006) | 8.2 ± 2.6 (84/1003) |
| L5 | 49.7 ± 4.3 (659/1317) | 32.5 ± 4.9 (454/1398) | 2.0 ± 0.5 (27/1340) |
| L6 | 43.2 ± 5.5 (390/895) | 31.9 ± 2.4 (353/1107) | 4.4 ± 0.7 (38/868) |
| Total | 43.5 ± 3.0 (2079/4751) | 22.9 ± 1.7 (1136/4934) | 9.7 ± 1.0 (454/4665) |
a The denominator and numerator in parentheses are the total number of the cells expressing GAD67 mRNA and that of neurons positive for individual chemical marker, respectively.
b Data are given as mean ± SD of the percentages in three mice.
We further examined GABAergic nature of the axon terminal-like structures immunopositive for PV, SOM, or VIP by dual immunolabeling with anti-VGAT antibody in the S1. In the 3D image stacks of confocal laser-scanning microscopy (CF-LSM), we observed the colocalization of PV, SOM, or VIP immunoreactivity in VGAT-positive punctae (Fig. 2G–I). In L1 of the S1, only 8% of VGAT-immunopositive punctae showed PV immunoreactivity, whereas >30% of those displayed the immunoreactivity for SOM or VIP (Table 2). In L2–L6, ∼40%, 30%, or 20% of VGAT-positive punctae exhibited the immunoreactivity for PV, SOM, or VIP, respectively (Table 2). Inversely, >95% of PV-, SOM-, or VIP-immunoreactive punctae were positive for VGAT. Since VGAT immunoreactivity was localized to synaptic vesicles in GABAergic axon terminals (Chaudhry et al., 1998), the last finding indicated that the punctae immunoreactive for PV, SOM, or VIP could be used as a presynaptic terminal marker of the GABAergic subgroup.
Table 2.
Laminar distributions of inhibitory presynaptic terminals positive for PV, SOM, or VIP in the S1
| PV |
SOM |
VIP |
||||
|---|---|---|---|---|---|---|
| PV/VGAT | VGAT/PV | SOM/VGAT | VGAT/SOM | VIP/VGAT | VGAT/VIP | |
| L1 | 7.9 ± 1.8a (38/475)b | 96.3 ± 6.4 (38/39) | 30.8 ± 3.2 (151/487) | 98.0 ± 1.7 (151/154) | 33.1 ± 3.0 (161/491) | 95.3 ± 0.9 (161/169) |
| L2/3 | 38.7 ± 2.9 (190/494) | 95.9 ± 2.3 (190/198) | 22.6 ± 2.9 (105/467) | 93.7 ± 1.6 (105/112) | 23.0 ± 2.5 (113/486) | 95.1 ± 1.6 (113/119) |
| L4 | 45.9 ± 4.4 (229/498) | 94.4 ± 1.0 (229/243) | 26.7 ± 7.6 (130/494) | 97.0 ± 1.1 (130/134) | 20.7 ± 5.1 (101/499) | 98.3 ± 2.9 (101/103) |
| L5 | 43.8 ± 0.9 (214/489) | 95.6 ± 1.7 (214/224) | 28.8 ± 0.8 (143/495) | 96.4 ± 2.8 (143/148) | 21.5 ± 1.8 (102/471) | 92.7 ± 0.2 (102/110) |
| L6 | 40.1 ± 3.9 (197/487) | 94.2 ± 3.9 (197/209) | 31.0 ± 1.7 (146/473) | 97.3 ± 0.9 (146/150) | 21.7 ± 1.6 (106/488) | 94.7 ± 2.6 (106/112) |
| Total | 35.5 ± 1.0 (868/2443) | 95.1 ± 1.5 (868/913) | 28.1 ± 2.8 (675/2416) | 96.7 ± 0.8 (675/698) | 23.9 ± 1.7 (583/2435) | 95.2 ± 1.1 (583/613) |
a Data are given as mean ± SD of the percentages in three mice.
b The denominator and numerator in parentheses are the total number of the axon terminal-like structures immunoreactive for VGAT and individual presynaptic marker, respectively, in three mice.
Immunohistochemical characterization of gephyrin
To visualize inhibitory postsynaptic sites, we used the immunoreactivity for gephyrin in the present study. Gephyrin provides a scaffold for postsynaptic proteins, GABAA, and glycine receptors, being an anchor to the cytoskeleton (Fritschy et al., 2008). It has been reported that gephyrin immunoreactivity is localized at the postsynaptic sites of symmetrical synapses in the cerebellar cortex and trigeminal motor nucleus (Sassoè-Pognetto et al., 2000; Li et al., 2012). To characterize the distribution of gephyrin immunoreactivity in the mouse neocortex, we first observed the immunoreactivities for gephyrin and VGAT by the CF-LSM in the S1. In the 3D image stacks, the two immunoreactivities were judged to form close contacts/appositions when we recognized the contacts in all the XY, XZ, and YZ planes (Fig. 3A1–A3). The close contacts/appositions often showed a partial overlap of fluorescence signals probably because of the limited spatial resolution of the CF-LSM. Approximately 96% (1906 of 1986, three animals) of gephyrin-immunopositive punctae were closely apposed to VGAT-immunopositive punctae, and inversely 98% (1906/1947) of VGAT-positive punctae were in close apposition to gephyrin-positive punctae. This clearly indicated intimate relationship of VGAT and gephyrin immunoreactivities in the mouse neocortex.
Figure 3.
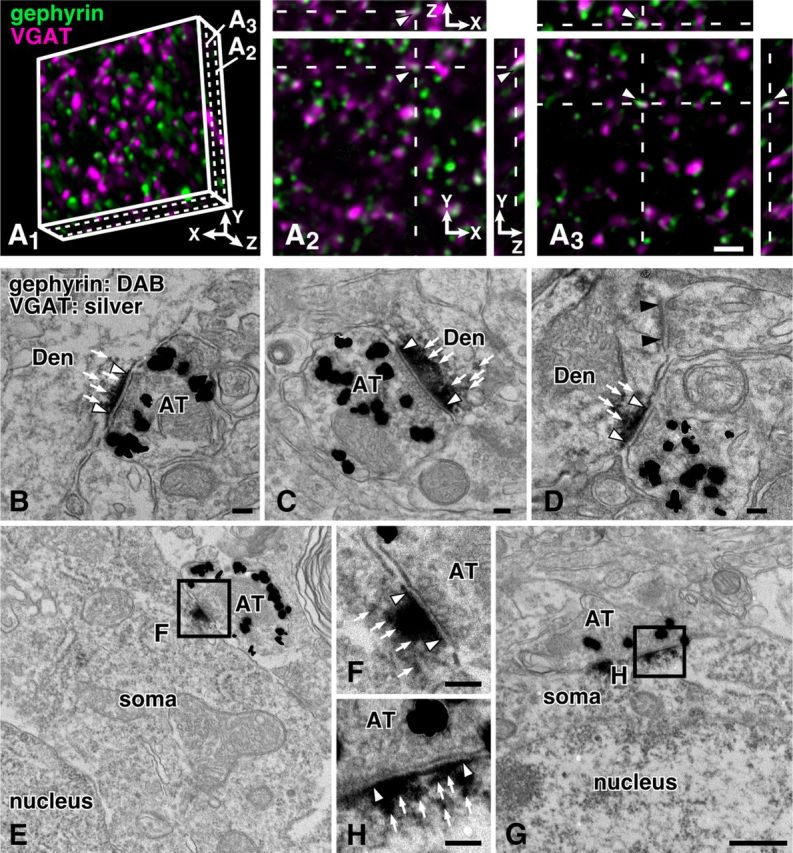
Light and electron microscopic distribution of gephyrin immunoreactivity in the S1. A1–A3, Gephyrin and VGAT immunoreactivities were visualized with AF488 (green) and AF647 (magenta), respectively. Almost all of the immunoreactivities were closely apposed to each other (arrowheads). B–H, Gephyrin and VGAT immunoreactivities were labeled with DAB reaction products (white arrows) and silver grains, respectively. Gephyrin immunoreactivity was localized at the postsynaptic sites (between two white arrowheads) facing VGAT-positive axon terminals (AT). Black arrowheads indicate the unlabeled asymmetric synapse. Den, dendrite. Scale bars: (in A3) A2, 2 μm; (in G) E, 500 nm; (in H) B–D, F, 100 nm.
We then investigated the intimate relationship of gephyrin and VGAT immunoreactivities in the S1 by electron microscopy. When VGAT immunoreactivity was singly labeled with silver grains, the immunoreactivity was distributed in the axon terminals forming symmetric synaptic contacts, but not with asymmetric ones (data not shown) as reported previously (Chaudhry et al., 1998). In the double immunostaining for VGAT and gephyrin (Fig. 3B–H), gephyrin immunoreactivity indicated by peroxidase reaction products was localized at the postsynaptic sites of those VGAT-immunopositive synapses in both somatic and dendritic profiles. When membrane contacts between VGAT-positive and gephyrin-positive profiles were randomly examined, we found synaptic specialization in 92.4% (61/66, three animals) of those contacts. These results indicate that gephyrin is a reliable marker for inhibitory postsynaptic sites at least in the neocortex.
GABAergic inputs to PV neurons
GABAergic inputs to PV neurons were investigated quantitatively with VGAT and gephyrin immunoreactivities. PV-producing interneurons in the rodent cerebral cortex contained the largest population of FS basket cells and the two minor populations of chandelier and multipolar bursting cells (Kawaguchi and Kondo, 2002; Blatow et al., 2003; Markram et al., 2004; Burkhalter, 2008). In the mouse neocortex, chandelier and multipolar bursting cells were reportedly located exclusively at the border of L1 and L2 (Blatow et al., 2003; Woodruff et al., 2009). Thus, to concentrate the present analysis to FS basket cells, we randomly selected eight PV neurons in the middle portion of each layer in the present study. In addition, we chose one dendrite per cell, and all the dendrites were located in the same layer as the cell bodies.
Many VGAT-positive punctae made close appositions in the S1 with the GFP-positive somatodendritic membrane of PV neurons in the 3D CF-LSM image stacks as reported previously (Kameda et al., 2012). To increase the reliability of detecting putative synaptic sites, we used gephyrin immunoreactivity with the triple immunolabeling method. Only when gephyrin immunoreactivity was found at the somatodendritic side of those close contacts, were the contacts counted as putative GABAergic input sites (arrowheads in Fig. 4A1–B4). We thereby obtained the number of putative GABAergic inputs and the surface area of the GFP-positive somatodendritic membrane in the image stacks, and calculated the input density [/μm2] (Table 3). The density of GABAergic inputs to PV neurons was significantly higher on the cell bodies than on the dendrites (Fig. 4C,D). There was no significant difference in the input density among cortical layers (L2–L6; Table 3). We further estimated the average number of GABAergic inputs per PV neuron using the data of somatic size and dendritic width and length in the report of Kameda et al. (2012), and found that the dendrites received ∼6-fold more inputs (1787) than the cell bodies (310) (Fig. 4D). Although the sampling of somatodendritic membrane of PV neurons was performed without reference to the barrel-septum structure in the S1, no signs for the presence of such columnar structures were noticed in the CF-LSM images of VGAT-positive punctae.
Figure 4.

GABAergic inputs to PV neurons. A1–B4, GFP, gephyrin, and VGAT were labeled with AF488 (green), AF568 (red), and AF647 (blue), respectively. VGAT-positive axon terminals were in close apposition to gephyrin immunoreactivity on the GFP-positive dendrites and cell bodies (arrowheads). C, We estimated the surface area of the dendrites and cell bodies, and then calculated the number of inputs per surface area [/μm2] in each layer (a total of eight neurons in each layer). GABAergic inputs clearly preferred the cell bodies, and the density was almost linearly decreased to the distal dendrites. Each symbol represents mean ± SD. D, The data obtained from all 32 dendrites and cell bodies were pooled. We further estimated the number of total inputs per PV neuron, using the data on the surface area [μm2] and the input density [/μm2]. The number of inputs to the cell bodies in each layer was estimated by the following formula, presuming the cell body to be spherical: [the mean number of inputs per surface area (Table 3)] × 4 × [section area of the cell body (Kameda et al., 2012)]. The number of inputs to the dendrites in each layer was estimated by the formula: D20 × A0–50, D80 × A50–110 and D140 × A≥110, where Dx = [the mean number of inputs per surface area around x μm from the cell body (Table 3)] and Ay = [the total surface area of y μm from the cell body (Kameda et al., 2012)]. Finally, the average number of GABAergic inputs per PV neuron in all layers (blue bars in D) was estimated by the following formula: ∑layer{[the mean number of inputs per PV neurons in each layer] × [the laminar distribution rate (%) of PV neurons in each layer (Kameda et al., 2012)]}. Statistical significance was judged by the Tukey's multiple-comparison test after one-way ANOVA: *p < 0.05; **p < 0.01; ***p < 0.001. Scale bars: (in A4) A1–A3, 2 μm; (in B4) B1–B3, 1 μm.
Table 3.
GABAergic inputs to PV neurons
| Cell body (CB) | Dendrite |
|||
|---|---|---|---|---|
| 20 μm from CB | 80 μm from CB | 140 μm from CB | ||
| Number of inputs | ||||
| L2/3 | 10.13 ± 2.03 | 18.88 ± 2.47 | 11.88 ± 1.64 | 8.00 ± 1.41 |
| L4 | 9.63 ± 1.41 | 20.75 ± 1.91 | 12.88 ± 1.64 | 8.88 ± 2.36 |
| L5 | 8.75 ± 2.05 | 18.88 ± 2.03 | 11.38 ± 2.88 | 8.50 ± 1.31 |
| L6 | 10.00 ± 1.31 | 19.25 ± 3.81 | 12.13 ± 2.23 | 8.13 ± 1.36 |
| Total | 9.63 ± 1.74 | 19.44 ± 2.65 | 12.06 ± 2.12 | 8.38 ± 1.62 |
| Surface area [μm2] | ||||
| L2/3 | 25.9 ± 6.0 | 50.1 ± 9.9 | 39.9 ± 5.5 | 29.5 ± 2.8 |
| L4 | 21.8 ± 2.5 | 53.3 ± 9.6 | 41.0 ± 8.5 | 33.2 ± 5.6 |
| L5 | 21.3 ± 3.6 | 47.3 ± 7.4 | 38.7 ± 9.0 | 34.7 ± 10.3 |
| L6 | 23.4 ± 3.0 | 49.7 ± 18.1 | 38.1 ± 4.7 | 31.4 ± 3.3 |
| Total | 23.1 ± 4.2 | 50.1 ± 11.6 | 39.4 ± 6.9 | 32.2 ± 6.3 |
| Density [10−2/μm2] | ||||
| L2/3 | 39.3 ± 3.2 | 38.3 ± 5.3 | 29.9 ± 2.6 | 27.1 ± 3.5 |
| L4 | 44.0 ± 3.2 | 39.7 ± 5.6 | 32.1 ± 5.2 | 26.7 ± 5.8 |
| L5 | 40.7 ± 4.3 | 40.5 ± 5.5 | 30.6 ± 9.1 | 25.9 ± 6.1 |
| L6 | 42.9 ± 3.4 | 40.4 ± 6.4 | 31.9 ± 5.1 | 25.9 ± 3.6 |
| Total | 41.7 ± 3.9 | 39.7 ± 5.5 | 31.1 ± 5.7 | 26.4 ± 4.7 |
We randomly selected two PV neurons in each layer in four transgenic mice (a total of eight neurons in every layer), and calculated the number of inputs, surface area [μm2], and input density [10−2/μm2]. Data are given as mean ± SD. CB, cell body.
Axodendritic inputs of PV or SOM neurons to PV neurons
To reveal which type(s) of inhibitory inputs preferred the cell bodies or dendrites of PV neurons in the S1, we first investigated PV-immunopositive synaptic inputs to PV neurons with the CF-LSM by detecting putative inhibitory synapses with the aid of gephyrin immunoreactivity (Fig. 5A1–B4). We found that PV inputs were frequently located on the dendrites, but much less on the cell bodies of PV neurons (Fig. 5D; Table 4). This finding was striking to us since previous reports described that PV neurons received many axosomatic inputs from PV neurons in the neocortex (Kisvárday et al., 1993; Tamás et al., 1997, 1998, 2000; Fukuda and Kosaka, 2003). The density of PV inputs to PV neurons at any somatodendritic location showed no statistically significant difference among the cortical layers (Table 4).
Figure 5.
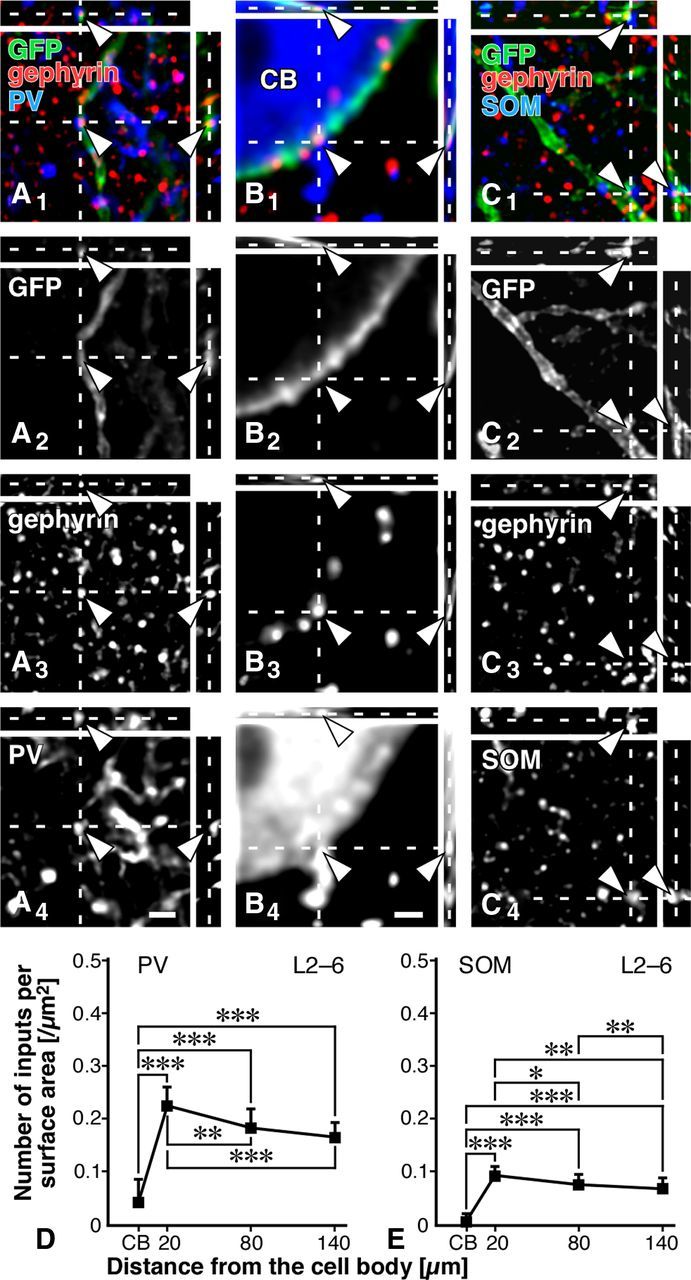
PV and SOM inputs to PV neurons. A1–C4, GFP, gephyrin, and either PV or SOM were labeled with AF488 (green), AF568 (red), and AF647 (blue), respectively. PV-positive axon terminals were frequently found in close apposition to gephyrin immunoreactivity on the GFP-positive dendrites, but much less on the cell bodies (arrowheads). SOM-positive axon punctae formed close contacts with the immunoreactivity for gephyrin on the GFP-positive dendrites, whereas few SOM-positive ones apposed to gephyrin immunoreactivity on the cell bodies. Note that the immunofluorescence signal for PV at the distal dendrite was sometimes too weak to be detected under the CF-LSM, whereas that for GFP was strong and clear (A1–A4). D, E, The data obtained from all 32 dendrites and cell bodies were pooled. For the data in each layer, see Tables 4 and 5. Each symbol represents mean ± SD. Statistical significance was judged by the Tukey's multiple-comparison test after one-way ANOVA: *p < 0.05; **p < 0.01; ***p < 0.001. Scale bars: (in A4) A1–A3, C1–C4, 2 μm; (in B4) B1–B3, 1 μm.
Table 4.
PV inputs to PV neurons
| Cell body (CB) | Dendrite |
|||
|---|---|---|---|---|
| 20 μm from CB | 80 μm from CB | 140 μm from CB | ||
| Number of inputs | ||||
| L2/3 | 0.75 ± 0.89 | 11.13 ± 2.17 | 7.25 ± 2.25 | 4.38 ± 1.30 |
| L4 | 1.13 ± 1.25 | 10.75 ± 2.12 | 7.63 ± 1.19 | 5.63 ± 1.06 |
| L5 | 1.00 ± 0.93 | 11.63 ± 1.60 | 6.63 ± 1.41 | 5.00 ± 0.93 |
| L6 | 1.25 ± 1.39 | 11.50 ± 1.60 | 7.13 ± 1.25 | 5.63 ± 1.30 |
| Total | 1.03 ± 1.09 | 11.25 ± 1.83 | 7.16 ± 1.55 | 5.16 ± 1.22 |
| Surface area [μm2] | ||||
| L2/3 | 25.0 ± 3.8 | 52.0 ± 11.3 | 39.7 ± 4.8 | 28.3 ± 4.2 |
| L4 | 24.2 ± 3.5 | 49.1 ± 11.2 | 40.5 ± 3.3 | 32.5 ± 6.5 |
| L5 | 23.6 ± 3.1 | 50.7 ± 9.6 | 37.3 ± 8.4 | 30.8 ± 6.6 |
| L6 | 24.4 ± 4.0 | 52.7 ± 12.3 | 39.8 ± 8.6 | 32.3 ± 6.4 |
| Total | 24.3 ± 3.5 | 51.1 ± 10.7 | 39.3 ± 6.5 | 31.0 ± 6.0 |
| Density [10−2/μm2] | ||||
| L2/3 | 3.1 ± 3.7 | 21.9 ± 3.9 | 18.3 ± 5.0 | 15.4 ± 3.8 |
| L4 | 4.5 ± 5.0 | 22.5 ± 4.5 | 18.8 ± 2.1 | 17.7 ± 4.0 |
| L5 | 4.3 ± 3.8 | 23.2 ± 2.7 | 18.1 ± 3.8 | 16.5 ± 2.6 |
| L6 | 5.2 ± 5.8 | 22.5 ± 4.2 | 18.5 ± 4.6 | 17.4 ± 1.6 |
| Total | 4.3 ± 4.5 | 22.5 ± 3.7 | 18.4 ± 3.8 | 16.7 ± 3.1 |
We randomly selected two PV neurons in each layer in four transgenic mice (a total of eight neurons in every layer), and calculated the number of inputs, surface area [μm2], and input density [10−2/μm2]. Data are given as mean ± SD. CB, cell body.
We then observed that SOM inputs also preferred the dendritic compartment to the somatic compartment of PV neurons (Fig. 5C1–C4,E; Table 5). No significant difference in the density of SOM inputs to PV neurons was noticed among the different cortical layers (Table 5), as was seen in the density of PV inputs. However, the density of SOM inputs to PV neurons was less than half of PV inputs. These findings indicated that the dendrites of PV neurons were innervated most abundantly by PV neurons and less frequently by SOM neurons. The results further suggested that the cell bodies of PV neurons received inhibitory inputs from other types of neurons than PV or SOM neurons, since the GABAergic input density on the somatic membrane (41.7 × 10⁻²/μm2) was much higher than the sum of the PV and SOM input densities (5.0 × 10⁻²/μm2).
Table 5.
SOM inputs to PV neurons
| Cell body (CB) | Dendrite |
|||
|---|---|---|---|---|
| 20 μm from CB | 80 μm from CB | 140 μm from CB | ||
| Number of inputs | ||||
| L2/3 | 0.13 ± 0.35 | 4.38 ± 0.74 | 2.75 ± 0.71 | 2.25 ± 0.46 |
| L4 | 0.13 ± 0.35 | 4.88 ± 1.13 | 3.13 ± 0.83 | 2.50 ± 0.93 |
| L5 | 0.13 ± 0.35 | 4.50 ± 0.93 | 2.75 ± 0.46 | 2.25 ± 0.46 |
| L6 | 0.25 ± 0.46 | 4.63 ± 1.19 | 3.13 ± 0.83 | 2.25 ± 0.46 |
| Total | 0.16 ± 0.37 | 4.59 ± 0.98 | 2.94 ± 0.72 | 2.31 ± 0.59 |
| Surface area [μm2] | ||||
| L2/3 | 22.9 ± 3.2 | 46.2 ± 7.2 | 35.2 ± 6.8 | 33.0 ± 3.7 |
| L4 | 24.4 ± 3.7 | 50.5 ± 11.6 | 40.5 ± 8.3 | 35.2 ± 7.6 |
| L5 | 23.4 ± 2.8 | 50.6 ± 11.1 | 39.4 ± 11.2 | 33.9 ± 7.6 |
| L6 | 24.8 ± 4.4 | 51.6 ± 5.0 | 43.2 ± 9.0 | 34.0 ± 5.3 |
| Total | 23.9 ± 3.5 | 49.7 ± 9.0 | 39.6 ± 9.0 | 34.0 ± 6 |
| Density [10−2/μm2] | ||||
| L2/3 | 0.7 ± 2.0 | 9.5 ± 1.5 | 7.8 ± 0.9 | 6.9 ± 1.6 |
| L4 | 0.5 ± 1.6 | 10.0 ± 2.7 | 8.1 ± 2.9 | 7.3 ± 3.2 |
| L5 | 0.6 ± 1.6 | 9.1 ± 1.7 | 7.4 ± 2.1 | 6.9 ± 1.8 |
| L6 | 1.2 ± 2.2 | 8.9 ± 2.0 | 7.4 ± 2.4 | 6.8 ± 2.1 |
| Total | 0.7 ± 1.8 | 9.4 ± 2.0 | 7.7 ± 2.1 | 7.0 ± 2.2 |
We randomly selected two PV neurons in each layer in four transgenic mice (a total of eight neurons in every layer), and calculated the number of inputs, surface area [μm2], and input density [10−2/μm2]. Data are given as mean ± SD. CB, cell body.
Axosomatic inputs of VIP neurons to PV neurons
We then analyzed inhibitory inputs of VIP neurons to PV neurons. In contrast to PV or SOM inputs, VIP inputs clearly preferred the cell bodies to the dendrites, and approximately two-thirds of GABAergic inputs to PV cell bodies were derived from VIP neurons (Fig. 6A1–C; Table 6). In addition, we observed a similar distribution of VIP inputs to PV neurons throughout L2–L6 without statistically significant difference among the different layers (Table 6). Since the distribution of VIP, PV, or SOM input density displayed no difference among cortical layers, PV neurons might have a common rule of receiving inhibitory inputs across all layers.
Figure 6.

VIP inputs to PV neurons. A1–B4, GFP, gephyrin, and VIP were labeled with AF488 (green), AF568 (red), and AF647 (blue), respectively. VIP-positive axon terminals were frequently observed in close apposition to gephyrin immunoreactivity on the GFP-positive cell bodies, but less on the dendrites (arrowheads). C, The data obtained from all 32 dendrites and cell bodies were pooled. For the data in each layer, see Table 6. Each symbol represents mean ± SD. Statistical significance was judged by Tukey's multiple-comparison test after one-way ANOVA: **p < 0.01; ***p < 0.001. D, We randomly selected 20 PV neurons in each cortical layer of the S1 in three transgenic mice, and analyzed VIP inputs to the cell bodies of PV neurons (240 neurons in total). The frequency histogram against the input density was well fitted with a single Gaussian distribution (r = 0.94), compared with the mixture of Gaussian distributions, on the basis of the Bayesian information criterion. Scale bars: (in A4) A1–A3, 2 μm; (in B4) B1–B3, 1 μm.
Table 6.
VIP inputs to PV neurons
| Cell body (CB) | Dendrite |
|||
|---|---|---|---|---|
| 20 μm from CB | 80 μm from CB | 140 μm from CB | ||
| Number of inputs | ||||
| L2/3 | 5.75 ± 1.39 | 2.13 ± 0.64 | 0.88 ± 0.64 | 0.63 ± 0.52 |
| L4 | 6.38 ± 1.51 | 2.50 ± 1.07 | 1.13 ± 0.83 | 0.75 ± 0.71 |
| L5 | 6.25 ± 1.16 | 2.38 ± 0.52 | 1.13 ± 0.83 | 0.63 ± 0.52 |
| L6 | 6.00 ± 1.60 | 2.25 ± 0.71 | 0.88 ± 0.83 | 0.63 ± 0.52 |
| Total | 6.09 ± 1.38 | 2.31 ± 0.74 | 1.00 ± 0.76 | 0.66 ± 0.55 |
| Surface area [μm2] | ||||
| L2/3 | 22.5 ± 3.7 | 48.4 ± 7.6 | 39.7 ± 3.5 | 33.7 ± 4.5 |
| L4 | 24.8 ± 2.4 | 52.1 ± 11.8 | 39.3 ± 7.6 | 33.5 ± 7.7 |
| L5 | 23.1 ± 2.5 | 51.8 ± 8.2 | 38.7 ± 3.7 | 31.2 ± 4.0 |
| L6 | 24.2 ± 3.7 | 50.2 ± 11.7 | 38.1 ± 9.5 | 28.7 ± 4.5 |
| Total | 23.7 ± 3.1 | 50.6 ± 9.7 | 39.0 ± 6.3 | 31.8 ± 5.5 |
| Density [10−2/μm2] | ||||
| L2/3 | 26.2 ± 7.4 | 4.5 ± 1.5 | 2.6 ± 2.0 | 1.8 ± 1.5 |
| L4 | 25.9 ± 6.3 | 4.8 ± 2.1 | 2.8 ± 2.1 | 2.2 ± 2.5 |
| L5 | 27.0 ± 3.1 | 4.6 ± 0.7 | 2.8 ± 2.0 | 1.9 ± 1.6 |
| L6 | 25.1 ± 6.6 | 4.4 ± 0.9 | 2.5 ± 2.6 | 2.3 ± 2.0 |
| Total | 26.0 ± 5.8 | 4.6 ± 1.3 | 2.6 ± 2.1 | 2.0 ± 1.8 |
We randomly selected two PV neurons in each layer in four transgenic mice (a total of eight neurons in every layer), and calculated the number of inputs, surface area [μm2], and input density [10−2/μm2]. Data are given as mean ± SD.
Since the presence of two types of PV neurons with and without VIP inputs to the cell bodies was reported in the rat S1 (Dávid et al., 2007), we further analyzed VIP inputs to the cell bodies of PV neurons in the S1. We randomly selected 20 PV neurons in the middle portion of each layer of the S1 from a transgenic mouse, thus a total of 60 neurons in each layer from three mice, and estimated the density of VIP inputs on the cell bodies. The mean density was 0.24–0.25 [/μm2] without significant difference among L2–L6. We then plotted the frequency histogram of 240 PV neurons against the density of VIP inputs on the cell bodies (Fig. 6D). The resulting histogram from the 240 PV neurons was well fitted with a single Gaussian distribution (r = 0.94). Judging from the Bayesian information criterion (BIC), this single Gaussian distribution was the best distribution (BIC value = −595.06), compared with the sum of two (−587.5) or more Gaussian distributions. This statistically suggested that there was only one population of PV neurons in terms of the axosomatic VIP inputs in the mouse S1.
Discussion
We quantitatively analyzed inhibitory inputs to PV-producing neurons, which were presumed to be mostly FS basket cells in the present study, by using transgenic mice in which PV neurons were visualized in a Golgi stain-like fashion. To count the number of inhibitory inputs as accurately as possible with the CF-LSM, we used gephyrin immunoreactivity as a postsynaptic marker. We first analyzed GABAergic inputs to PV neurons with VGAT immunoreactivity, and found that the density of GABAergic inputs was higher on the cell bodies than on the dendrites. However, since the surface area of the dendrites was much larger than that of cell bodies, GABAergic inputs per PV neuron were ∼6-fold more numerous on the dendrites than on the cell bodies, suggesting the importance of dendritic GABAergic inputs. We then investigated inhibitory inputs from three distinct subgroups of GABAergic neocortical interneurons, i.e., PV, SOM, and VIP neurons, which covered ∼76% of GABAergic neurons in the mouse S1. We discovered the compartmental organization of inhibitory inputs to PV neurons. The targets of PV and SOM inputs were almost exclusively the dendrites, and ∼60 and 25% of inhibitory inputs to the dendrites were derived from PV and SOM neurons, respectively. In contrast, VIP inputs clearly preferred the cell bodies to the dendrites, and ∼62% of inhibitory inputs to the cell bodies were originated from VIP neurons (Fig. 7A,B).
PV-producing FS basket cells are known to target the cell bodies and proximal dendrites of pyramidal cells, and precisely control the activity of pyramidal cells (Thomson et al., 1996; Tamás et al., 1997; Somogyi et al., 1998; Freund and Katona, 2007; Thomson and Lamy, 2007; Tanaka et al., 2011). Furthermore, FS basket cells are connected with each other, and many efforts have been made to reveal the mutual connections by paired recording experiments. It has been demonstrated that FS basket cells were reciprocally connected through electrical and chemical synapses in the neocortex (Tamás et al., 1997, 1998, 2000; Galarreta and Hestrin, 1999, 2001, 2002; Gibson et al., 1999; Gupta et al., 2000). In these reports, both connections were mostly restricted at the cell bodies and proximal dendrites by light and electron microscopic analyses. However, it was recently reported that gap junctions were distributed not only at the proximal sites but also at the distal dendritic segments. In addition, the total number of gap junctions were more numerous at the dendritic compartment than at the somatic compartment (Fukuda and Kosaka, 2003; Fukuda et al., 2006). As discussed in these previous reports, this discrepancy might be explained by the difference of methodological approaches. (1) Paired recording techniques would cause errors in estimating the spatial distribution of the connections. Since the slice preparation damaged the neuronal processes and reduced the chance of detecting electrical and chemical coupling between distal pairs, closely spaced pairs would be preferentially analyzed. (2) Furthermore, paired recordings were generally performed on the cell bodies, and thus, it was very difficult to detect coupling among distal dendritic segments because of electrotonic attenuation of gap junction activity and GABAergic PSPs evoked in the distal dendrites.
In the present study, we revealed that chemical connections between PV neurons were most abundantly distributed on the proximal dendrites and least on the cell bodies (Fig. 7A,B). To exclude the possibility of underestimation of the axosomatic inputs due to false-negative staining for PV-positive terminals around the cell bodies, we carefully observed PV-positive terminals using the other transgenic mice (Kameda et al., 2012). In the mice, membrane-targeted GFP (myristoylation/palmitoylation site-attached GFP) was expressed specifically in PV neurons and not only the dendrites but also the axons were well labeled. By triple immunofluorescence staining for GFP, PV, and VGAT, we found that almost all the GFP-positive GABAergic terminals were immunoreactive for PV (Kameda et al., 2012, their Fig. 4C1–C4). In addition, these triple-positive terminals frequently surrounded GFP- and PV-negative cell bodies, presumably those of pyramidal neurons, but only sparsely surrounded GFP- and PV-positive cell bodies (data not shown). These findings indicate that the axon terminals of PV neurons were sufficiently labeled for the analysis of the mutual axosomatic connections of PV neurons. Therefore, it is unlikely that the axosomatic connections between PV neurons were largely underestimated in the present study. Although previous immunohistochemical studies demonstrated the mutual chemical connections of PV neurons at the proximal sites in the rat and cat neocortex (Kisvárday et al., 1993; Fukuda and Kosaka, 2003), the distal dendrites were not visualized well in those studies, and the connections in the distal sites might have been underestimated.
We here discovered that GABAergic inputs per PV neuron were six times more numerous on the dendrites than on the cell bodies and, more importantly, that the dendritic compartment of PV neurons received GABAergic inputs chiefly from PV neurons (Fig. 7C). Since a PV-producing FS basket cell projects axon fibers around its cell body mainly in a horizontal direction (Kawaguchi and Kubota, 1993; Kisvárday et al., 1993), the present results indicate that the mutual connections of PV neurons are formed mostly on the dendrites of PV neurons in the same and adjacent layers. Since the dendritic localization is disadvantageous for evoking GABAergic postsynaptic potentials (PSPs) in the cell body (Kameda et al., 2012) and PV neurons are electrically connected by gap junctions mainly at their dendritic compartments (Fukuda and Kosaka, 2003; Fukuda et al., 2006), the dendritic GABAergic inputs between PV neurons, together with the gap junctions, might serve as a piece of machinery generating local oscillatory activity rather than as a simple inhibitory device (Bartos et al., 2007).
In contrast to PV inputs to the dendrites, most somatic inhibitory inputs to PV neurons were derived from VIP neurons. It was reported that PV neurons were separated into two different groups in terms of perisomatic VIP inputs in the rat S1 (Dávid et al., 2007). The first group received strong inputs on the cell bodies and proximal dendrites from VIP neurons, whereas the second group admitted a few or no inputs. To examine whether or not PV neurons could be divided into two types by the number of VIP inputs in the mouse S1, we statistically analyzed VIP-positive somatic inputs on 240 PV neurons. The resulting frequency histogram against VIP input density was well fitted with a single Gaussian distribution, suggesting that PV neurons in the mouse S1 were not statistically divided into two groups. This discrepancy could be accounted for by the difference in species and sampling method. In the rat neocortex, chandelier neurons were not restricted to L1–L2 border, but distributed widely in L2/3 (Peters et al., 1982; Somogyi et al., 1982). Dávid et al. (2007) randomly sampled rat PV neurons in cortical layers including L2/3. Thus, it is likely that chandelier cells were contained in the analysis David et al. (2004), and their second group lacking VIP inputs might be chandelier cells. In contrast, in the mouse cortex, chandelier cells and multipolar bursting cells were located at the border of L1 and L2, and we randomly selected PV neurons in the middle portion of L2/3 to exclude those neurons from the present analysis. Thus, we might have analyzed a relatively homogeneous subpopulation of PV neurons, which were presumed to be FS basket cells.
Since the perisomatic location of inhibitory synapses is effective for evoking GABAergic PSPs in the cell bodies (Kameda et al., 2012) and thus for controlling action potential generation (Williams and Stuart, 2003; Andrásfalvy and Mody, 2006), it is likely that PV neurons are efficiently inhibited by the axosomatic inputs of VIP neurons. VIP neurons belong to the bipolar or bitufted type of cortical interneurons, their cell bodies are located mainly in L2/3, and their axon fibers run vertically through the cortical layers (Connor and Peters, 1984; Kawaguchi and Kubota, 1996; Bayraktar et al., 2000). The present results were in good agreement with the previous findings that bipolar or bitufted cells frequently innervate the somata and dendrites of other inhibitory neurons in the rat and monkey neocortex (Meskenaite, 1997; Gonchar and Burkhalter, 1999). These facts suggest that PV neurons in the superficial and deep cortical layers are inhibited simultaneously by vertically running VIP axons (Fig. 7C). This vertical inhibition may hence be helpful for the synchronization of PV neurons in the different cortical layers. Recently, L1 interneurons have been reported to innervate the cell bodies of PV neurons in L2/3, and disinhibit L2/3 pyramidal cells via inhibition of PV neurons in the mouse cortex (Letzkus et al., 2011). It is, therefore, presumable that VIP neurons control the activity of pyramidal cells within a vertical columnar or subcolumnar structure by translaminar disinhibition through the axosomatic inputs to PV neurons.
In summary, the present study provides the first evidence for the compartmental organization of inhibitory inputs to PV neurons. The dendritic compartment principally received GABAergic inputs from PV neurons, and the somatic compartment from VIP neurons. These two compartments might play different functional roles in the generation of local oscillatory activity and in the translaminar disinhibition of pyramidal cell column, respectively.
Footnotes
This work was supported by Grants-in-Aid for Scientific Research (22700367, 22300113, 23650175, 23700413); Grants-in-Aid for Scientific Research on Innovative Areas “Neural Diversity and Neocortical Organization” (23123510) and “Mesoscopic Neurocircuitry” (23115101); JST CREST from The Ministry of Education, Culture, Sports, Science, and Technology (MEXT) of Japan; and Fujiwara Memorial Foundation. We thank Drs. Y.R. Tanaka and M.S.Y. Lung for comments on this manuscript, and K. Okamoto-Furuta for her technical assistance in electron microscopy.
The authors declare no competing financial interests.
References
- Andrásfalvy BK, Mody I. Differences between the scaling of miniature IPSCs and EPSCs recorded in the dendrites of CA1 mouse pyramidal neurons. J Physiol. 2006;576:191–196. doi: 10.1113/jphysiol.2006.115428. [DOI] [PMC free article] [PubMed] [Google Scholar]
- Bartos M, Vida I, Jonas P. Synaptic mechanisms of synchronized gamma oscillations in inhibitory interneuron networks. Nat Rev Neurosci. 2007;8:45–56. doi: 10.1038/nrn2044. [DOI] [PubMed] [Google Scholar]
- Bayraktar T, Welker E, Freund TF, Zilles K, Staiger JF. Neurons immunoreactive for vasoactive intestinal polypeptide in the rat primary somatosensory cortex: morphology and spatial relationship to barrel-related columns. J Comp Neurol. 2000;420:291–304. [PubMed] [Google Scholar]
- Blatow M, Rozov A, Katona I, Hormuzdi SG, Meyer AH, Whittington MA, Caputi A, Monyer H. A novel network of multipolar bursting interneurons generates theta frequency oscillations in neocortex. Neuron. 2003;38:805–817. doi: 10.1016/s0896-6273(03)00300-3. [DOI] [PubMed] [Google Scholar]
- Burkhalter A. Many specialists for suppressing cortical excitation. Front Neurosci. 2008;2:155–167. doi: 10.3389/neuro.01.026.2008. [DOI] [PMC free article] [PubMed] [Google Scholar]
- Chaudhry FA, Reimer RJ, Bellocchio EE, Danbolt NC, Osen KK, Edwards RH, Storm-Mathisen J. The vesicular GABA transporter, VGAT, localizes to synaptic vesicles in sets of glycinergic as well as GABAergic neurons. J Neurosci. 1998;18:9733–9750. doi: 10.1523/JNEUROSCI.18-23-09733.1998. [DOI] [PMC free article] [PubMed] [Google Scholar]
- Connor JR, Peters A. Vasoactive intestinal polypeptide-immunoreactive neurons in rat visual cortex. Neuroscience. 1984;12:1027–1044. doi: 10.1016/0306-4522(84)90002-2. [DOI] [PubMed] [Google Scholar]
- Dávid C, Schleicher A, Zuschratter W, Staiger JF. The innervation of parvalbumin-containing interneurons by VIP-immunopositive interneurons in the primary somatosensory cortex of the adult rat. Eur J Neurosci. 2007;25:2329–2340. doi: 10.1111/j.1460-9568.2007.05496.x. [DOI] [PubMed] [Google Scholar]
- Freund TF, Katona I. Perisomatic inhibition. Neuron. 2007;56:33–42. doi: 10.1016/j.neuron.2007.09.012. [DOI] [PubMed] [Google Scholar]
- Fritschy JM, Harvey RJ, Schwarz G. Gephyrin: where do we stand, where do we go? Trends Neurosci. 2008;31:257–264. doi: 10.1016/j.tins.2008.02.006. [DOI] [PubMed] [Google Scholar]
- Fukuda T, Kosaka T. Ultrastructural study of gap junctions between dendrites of parvalbumin-containing GABAergic neurons in various neocortical areas of the adult rat. Neuroscience. 2003;120:5–20. doi: 10.1016/s0306-4522(03)00328-2. [DOI] [PubMed] [Google Scholar]
- Fukuda T, Kosaka T, Singer W, Galuske RA. Gap junctions among dendrites of cortical GABAergic neurons establish a dense and widespread intercolumnar network. J Neurosci. 2006;26:3434–3443. doi: 10.1523/JNEUROSCI.4076-05.2006. [DOI] [PMC free article] [PubMed] [Google Scholar]
- Galarreta M, Hestrin S. A network of fast-spiking cells in the neocortex connected by electrical synapses. Nature. 1999;402:72–75. doi: 10.1038/47029. [DOI] [PubMed] [Google Scholar]
- Galarreta M, Hestrin S. Spike transmission and synchrony detection in networks of GABAergic interneurons. Science. 2001;292:2295–2299. doi: 10.1126/science.1061395. [DOI] [PubMed] [Google Scholar]
- Galarreta M, Hestrin S. Electrical and chemical synapses among parvalbumin fast-spiking GABAergic interneurons in adult mouse neocortex. Proc Natl Acad Sci U S A. 2002;99:12438–12443. doi: 10.1073/pnas.192159599. [DOI] [PMC free article] [PubMed] [Google Scholar]
- Gibson JR, Beierlein M, Connors BW. Two networks of electrically coupled inhibitory neurons in neocortex. Nature. 1999;402:75–79. doi: 10.1038/47035. [DOI] [PubMed] [Google Scholar]
- Gonchar Y, Burkhalter A. Connectivity of GABAergic calretinin-immunoreactive neurons in rat primary visual cortex. Cereb Cortex. 1999;9:683–696. doi: 10.1093/cercor/9.7.683. [DOI] [PubMed] [Google Scholar]
- Gonchar Y, Wang Q, Burkhalter A. Multiple distinct subtypes of GABAergic neurons in mouse visual cortex identified by triple immunostaining. Front Neuroanat. 2007;1:3. doi: 10.3389/neuro.05.003.2007. [DOI] [PMC free article] [PubMed] [Google Scholar]
- Gupta A, Wang Y, Markram H. Organizing principles for a diversity of GABAergic interneurons and synapses in the neocortex. Science. 2000;287:273–278. doi: 10.1126/science.287.5451.273. [DOI] [PubMed] [Google Scholar]
- Hestrin S, Galarreta M. Electrical synapses define networks of neocortical GABAergic neurons. Trends Neurosci. 2005;28:304–309. doi: 10.1016/j.tins.2005.04.001. [DOI] [PubMed] [Google Scholar]
- Hioki H, Nakamura H, Ma YF, Konno M, Hayakawa T, Nakamura KC, Fujiyama F, Kaneko T. Vesicular glutamate transporter 3-expressing nonserotonergic projection neurons constitute a subregion in the rat midbrain raphe nuclei. J Comp Neurol. 2010;518:668–686. doi: 10.1002/cne.22237. [DOI] [PubMed] [Google Scholar]
- Isomura Y, Harukuni R, Takekawa T, Aizawa H, Fukai T. Microcircuitry coordination of cortical motor information in self-initiation of voluntary movements. Nat Neurosci. 2009;12:1586–1593. doi: 10.1038/nn.2431. [DOI] [PubMed] [Google Scholar]
- Kameda H, Hioki H, Tanaka YH, Tanaka T, Sohn J, Sonomura T, Furuta T, Fujiyama F, Kaneko T. Parvalbumin-producing cortical interneurons receive inhibitory inputs on proximal portions and cortical excitatory inputs on distal dendrites. Eur J Neurosci. 2012;35:838–854. doi: 10.1111/j.1460-9568.2012.08027.x. [DOI] [PubMed] [Google Scholar]
- Kaneko T, Mizuno N. Immunohistochemical study of glutaminase-containing neurons in the cerebral cortex and thalamus of the rat. J Comp Neurol. 1988;267:590–602. doi: 10.1002/cne.902670411. [DOI] [PubMed] [Google Scholar]
- Kawaguchi Y, Kondo S. Parvalbumin, somatostatin and cholecystokinin as chemical markers for specific GABAergic interneuron types in the rat frontal cortex. J Neurocytol. 2002;31:277–287. doi: 10.1023/a:1024126110356. [DOI] [PubMed] [Google Scholar]
- Kawaguchi Y, Kubota Y. Correlation of physiological subgroupings of nonpyramidal cells with parvalbumin- and calbindinD28k-immunoreactive neurons in layer V of rat frontal cortex. J Neurophysiol. 1993;70:387–396. doi: 10.1152/jn.1993.70.1.387. [DOI] [PubMed] [Google Scholar]
- Kawaguchi Y, Kubota Y. Physiological and morphological identification of somatostatin- or vasoactive intestinal polypeptide-containing cells among GABAergic cell subtypes in rat frontal cortex. J Neurosci. 1996;16:2701–2715. doi: 10.1523/JNEUROSCI.16-08-02701.1996. [DOI] [PMC free article] [PubMed] [Google Scholar]
- Kawaguchi Y, Kubota Y. GABAergic cell subtypes and their synaptic connections in rat frontal cortex. Cereb Cortex. 1997;7:476–486. doi: 10.1093/cercor/7.6.476. [DOI] [PubMed] [Google Scholar]
- Kisvárday ZF, Beaulieu C, Eysel UT. Network of GABAergic large basket cells in cat visual cortex (area 18): implication for lateral disinhibition. J Comp Neurol. 1993;327:398–415. doi: 10.1002/cne.903270307. [DOI] [PubMed] [Google Scholar]
- Letzkus JJ, Wolff SB, Meyer EM, Tovote P, Courtin J, Herry C, Lüthi A. A disinhibitory microcircuit for associative fear learning in the auditory cortex. Nature. 2011;480:331–335. doi: 10.1038/nature10674. [DOI] [PubMed] [Google Scholar]
- Lewis DA, Hashimoto T, Volk DW. Cortical inhibitory neurons and schizophrenia. Nat Rev Neurosci. 2005;6:312–324. doi: 10.1038/nrn1648. [DOI] [PubMed] [Google Scholar]
- Lewis DA, Curley AA, Glausier JR, Volk DW. Cortical parvalbumin interneurons and cognitive dysfunction in schizophrenia. Trends Neurosci. 2012;35:57–67. doi: 10.1016/j.tins.2011.10.004. [DOI] [PMC free article] [PubMed] [Google Scholar]
- Li Z, Ge S, Zhang F, Zhang T, Mizuno N, Hioki H, Kaneko T, Gao G, Li J. Distribution of gephyrin-immunoreactivity in the trigeminal motor nucleus: an immunohistochemical study in rats. Anat Rec. 2012;295:641–651. doi: 10.1002/ar.22426. [DOI] [PubMed] [Google Scholar]
- Markram H, Toledo-Rodriguez M, Wang Y, Gupta A, Silberberg G, Wu C. Interneurons of the neocortical inhibitory system. Nat Rev Neurosci. 2004;5:793–807. doi: 10.1038/nrn1519. [DOI] [PubMed] [Google Scholar]
- Meskenaite V. Calretinin-immunoreactive local circuit neurons in area 17 of the cynomolgus monkey, Macaca fascicularis. J Comp Neurol. 1997;379:113–132. [PubMed] [Google Scholar]
- Nakamura KC, Kameda H, Koshimizu Y, Yanagawa Y, Kaneko T. Production and histological application of affinity-purified antibodies to heat-denatured green fluorescent protein. J Histochem Cytochem. 2008;56:647–657. doi: 10.1369/jhc.2008.950915. [DOI] [PMC free article] [PubMed] [Google Scholar]
- Peters A, Proskauer CC, Ribak CE. Chandelier cells in rat visual cortex. J Comp Neurol. 1982;206:397–416. doi: 10.1002/cne.902060408. [DOI] [PubMed] [Google Scholar]
- Sassoè-Pognetto M, Panzanelli P, Sieghart W, Fritschy JM. Colocalization of multiple GABA(A) receptor subtypes with gephyrin at postsynaptic sites. J Comp Neurol. 2000;420:481–498. doi: 10.1002/(sici)1096-9861(20000515)420:4<481::aid-cne6>3.0.co;2-5. [DOI] [PubMed] [Google Scholar]
- Schwarz G. Estimating the dimension of a model. Ann Statist. 1978;6:461–464. [Google Scholar]
- Sohal VS, Zhang F, Yizhar O, Deisseroth K. Parvalbumin neurons and gamma rhythms enhance cortical circuit performance. Nature. 2009;459:698–702. doi: 10.1038/nature07991. [DOI] [PMC free article] [PubMed] [Google Scholar]
- Somogyi P, Klausberger T. Defined types of cortical interneurone structure space and spike timing in the hippocampus. J Physiol. 2005;562:9–26. doi: 10.1113/jphysiol.2004.078915. [DOI] [PMC free article] [PubMed] [Google Scholar]
- Somogyi P, Freund TF, Cowey A. The axo-axonic interneuron in the cerebral cortex of the rat, cat and monkey. Neuroscience. 1982;7:2577–2607. doi: 10.1016/0306-4522(82)90086-0. [DOI] [PubMed] [Google Scholar]
- Somogyi P, Tamás G, Lujan R, Buhl EH. Salient features of synaptic organisation in the cerebral cortex. Brain Res Brain Rev. 1998;26:113–135. doi: 10.1016/s0165-0173(97)00061-1. [DOI] [PubMed] [Google Scholar]
- Tamamaki N, Yanagawa Y, Tomioka R, Miyazaki J, Obata K, Kaneko T. Green fluorescent protein expression and colocalization with calretinin, parvalbumin, and somatostatin in the GAD67-GFP knock-in mouse. J Comp Neurol. 2003;467:60–79. doi: 10.1002/cne.10905. [DOI] [PubMed] [Google Scholar]
- Tamás G, Buhl EH, Somogyi P. Fast IPSPs elicited via multiple synaptic release sites by different types of GABAergic neurone in the cat visual cortex. J Physiol. 1997;500:715–738. doi: 10.1113/jphysiol.1997.sp022054. [DOI] [PMC free article] [PubMed] [Google Scholar]
- Tamás G, Somogyi P, Buhl EH. Differentially interconnected networks of GABAergic interneurons in the visual cortex of the cat. J Neurosci. 1998;18:4255–4270. doi: 10.1523/JNEUROSCI.18-11-04255.1998. [DOI] [PMC free article] [PubMed] [Google Scholar]
- Tamás G, Buhl EH, Lörincz A, Somogyi P. Proximally targeted GABAergic synapses and gap junctions synchronize cortical interneurons. Nat Neurosci. 2000;3:366–371. doi: 10.1038/73936. [DOI] [PubMed] [Google Scholar]
- Tanaka YH, Tanaka YR, Fujiyama F, Furuta T, Yanagawa Y, Kaneko T. Local connections of layer 5 GABAergic interneurons to corticospinal neurons. Front Neural Circuits. 2011;5:12. doi: 10.3389/fncir.2011.00012. [DOI] [PMC free article] [PubMed] [Google Scholar]
- Thomson AM, Lamy C. Functional maps of neocortical local circuitry. Front Neurosci. 2007;1:19–42. doi: 10.3389/neuro.01.1.1.002.2007. [DOI] [PMC free article] [PubMed] [Google Scholar]
- Thomson AM, West DC, Hahn J, Deuchars J. Single axon IPSPs elicited in pyramidal cells by three classes of interneurones in slices of rat neocortex. J Physiol. 1996;496:81–102. doi: 10.1113/jphysiol.1996.sp021667. [DOI] [PMC free article] [PubMed] [Google Scholar]
- Whittington MA, Traub RD, Jefferys JG. Synchronized oscillations in interneuron networks driven by metabotropic glutamate receptor activation. Nature. 1995;373:612–615. doi: 10.1038/373612a0. [DOI] [PubMed] [Google Scholar]
- Williams SR, Stuart GJ. Voltage- and site-dependent control of the somatic impact of dendritic IPSPs. J Neurosci. 2003;23:7358–7367. doi: 10.1523/JNEUROSCI.23-19-07358.2003. [DOI] [PMC free article] [PubMed] [Google Scholar]
- Woodruff A, Xu Q, Anderson SA, Yuste R. Depolarizing effect of neocortical chandelier neurons. Front Neural Circuits. 2009;3:15. doi: 10.3389/neuro.04.015.2009. [DOI] [PMC free article] [PubMed] [Google Scholar]
- Xu X, Roby KD, Callaway EM. Immunochemical characterization of inhibitory mouse cortical neurons: three chemically distinct classes of inhibitory cells. J Comp Neurol. 2010;518:389–404. doi: 10.1002/cne.22229. [DOI] [PMC free article] [PubMed] [Google Scholar]