

Abstract
Rodents can robustly distinguish fine differences in texture using their whiskers, a capacity that depends on neuronal activity in primary somatosensory “barrel” cortex. Here we explore how texture was collectively encoded by populations of three to seven neuronal clusters simultaneously recorded from barrel cortex while a rat performed a discrimination task. Each cluster corresponded to the single-unit or multiunit activity recorded at an individual electrode. To learn how the firing of different clusters combines to represent texture, we computed population activity vectors across moving time windows and extracted the signal available in the optimal linear combination of clusters. We quantified this signal using receiver operating characteristic analysis and compared it to that available in single clusters. Texture encoding was heterogeneous across neuronal clusters, and only a minority of clusters carried signals strong enough to support stimulus discrimination on their own. However, jointly recorded groups of clusters were always able to support texture discrimination at a statistically significant level, even in sessions where no individual cluster represented the stimulus. The discriminative capacity of neuronal activity was degraded when error trials were included in the data, compared to only correct trials, suggesting a link between the neuronal activity and the animal's performance. These analyses indicate that small groups of barrel cortex neurons can robustly represent texture identity through synergistic interactions, and suggest that neurons downstream to barrel cortex could extract texture identity on single trials through simple linear combination of barrel cortex responses.
Introduction
Rodents use their whiskers to detect and explore objects (Diamond et al., 2008; Diamond and Arabzadeh, 2012). Among whisker-mediated sensory capacities, the ability to discriminate textures is notable (Guić-Robles et al., 1989; Carvell and Simons, 1990; Morita et al., 2011). Texture discrimination requires the somatosensory “barrel” cortex (Guić-Robles et al., 1992). Texture encoding has been the object of several recent investigations (Prigg et al., 2002; Arabzadeh et al., 2005; von Heimendahl et al., 2007; Lottem and Azouz, 2008; Ritt et al., 2008; Wolfe et al., 2008; Jadhav et al., 2009; Lottem and Azouz, 2009). One study examined neuronal “clusters” (single units or multiple units recorded on an electrode) in barrel cortex of rats trained to use their whiskers to distinguish a rough surface from a smooth one (von Heimendahl et al., 2007). On average, clusters responded with a higher firing rate when the rats palpated the rough texture compared to the smooth one. An individual cluster's response contained, on average, 3% of the maximum possible information about texture identity. However, taking an average information value masks the fact that information varied markedly across clusters. Moreover, the performance of the animal in discriminating texture was better than the performance supported by even the most informative cluster. Here we hypothesize that the rat's choice could be guided by the collective signals of neuronal ensembles.
Several lines of research have considered how neuronal ensembles represent stimuli. Neuronal populations in the anesthetized somatosensory cortex can represent stimulus location using distributed codes, where the signal improves with the number of neurons in the population (Ghazanfar et al., 2000; Petersen and Diamond, 2000; Foffani et al., 2008). From previous work, two main questions remain. First, how are object properties—beyond stimulus location—encoded by a population? Here we extend the study of population coding to a more complex feature, surface texture. Second, how does the population signal relate to the animal's percept? Addressing this point requires the animal to be active and make explicit choices, an approach lacking in studies of anesthetized animals.
We aim to characterize how interactions within a barrel cortex population can contribute to the overall signal (Petersen et al., 2001). One possibility is that individual signals are conditionally independent. In that case, an ensemble code could result from the pooling of uncorrelated signals. The alternative is that interactions affect the message. Then, correlations in the population could result in net redundancy or synergy, reducing or increasing (respectively) the information conveyed (Averbeck et al., 2006).
To assess these possibilities, we have extracted the texture signal from a population of simultaneously recorded, separate neuronal clusters and compared this to the signal in the individual constituent clusters. A proposed mechanism for coding and decoding is more significant if it involves biologically realistic operations. For this reason, we have estimated the magnitude of the population signal extracted by an optimal linear combination of cluster activity, an operation that could be achieved by a downstream cell performing a weighted sum over inputs from barrel cortex neurons.
Materials and Methods
Experimental methods
The results of the present study were derived from data described previously in another form (von Heimendahl et al., 2007). The complete methods for data collection are described there, and below we provide an abbreviated outline.
Subjects.
Two adult male Wistar rats (Harlan) were used. All experiments were conducted in accordance with NIH, international, and institutional standards for the care and use of animals in research and were supervised by a consulting veterinarian.
Apparatus.
The arena was situated in a Faraday cage and was illuminated by LEDs emitting infrared light (wavelength, >880 nm) in which albino rats have negligible visual function. The apparatus was constructed in aluminum and consisted of a rectangular platform (36 × 11 cm) that faced a hexagonal platform (side length, 10 cm). The rectangle's shorter edge faced the hexagon across a gap of adjustable width. Platforms were elevated 30 cm above a table.
Two textures of 3 × 10 cm were formed from acrylic glass plates. To make the smooth texture, the glass was left intact. The second texture was formed by pressing P100 sandpaper onto the heated plate. This left the surface with a negative mold of the sandpaper. The two textures had the same size, overall shape, and odor.
Texture discrimination task.
For 1 week, each rat was handled and habituated to the training arena under dim visible light. Then, the visible light was switched off and only invisible infrared illumination remained. For the rest of the experiment, training sessions were held once a day for ∼1 h, usually during the dark phase of the light/dark cycle. The goal of training was for the rat to learn to discriminate between the smooth and rough textures using the long whiskers of its snout. Rough and smooth texture trials were randomly interleaved.
Rats underwent whisker clipping to encourage them to use the whiskers that were in the receptive field of recorded neuronal clusters. All long whiskers (Greek whiskers and arcs 1–4; not arcs 5 and beyond, which are difficult to see and cut in an awake rat) on both sides were clipped, except for those of interest: C1 and C2 in one rat, D2 and D3 in the other.
In each trial, one texture was present, mounted on the hexagonal platform across the gap. The rat perched on the front edge of the rectangular platform and extended itself forward to contact the discriminandum with its whiskers (Fig. 1A, top). After palpating the texture, the rat withdrew and approached either the left or right drinking spout mounted near the platform (Fig. 1A, bottom). The texture identity indicated the correct side to choose. Rats were trained with a fixed association (e.g., turn left on rough, right on smooth). Between trials, the discriminanda's mount was turned about its vertical axis by a computer-controlled stepping motor.
Figure 1.

Spiking signals for whisker-driven texture discrimination in barrel cortex. A, Design of the texture-discrimination task. The rat contacted the texture with its whiskers (top drawing, inset) and then turned to the reward spout (bottom drawing). B, Video frame showing texture contact of the whisker (highlighted in red) that projects to the recorded neuronal clusters. C, Spike rasters for simultaneously recorded clusters (different colors), relative to moment of withdrawal (gray line), for five trials of each type in an example session. Rectangles depict contact periods for the clusters' principal whisker. Whisker contact was a principal determinant of spiking. Although in the small number of trials illustrated here it appears that the rat touched the rough texture more than the smooth texture, previous studies (von Heimendahl et al., 2007; Zuo et al., 2011) showed that in a large data set, rats generate the same number of contacts and same total touch time when encountering different textures. D, Top, Histogram of neuronal responses aligned to the first touch in each trial, averaged over clusters (same session as in C). Shaded region denotes SD over clusters and trials in the session. The touch-induced increase in rate was larger than any difference due to texture. Bottom, Aligning by moment of withdrawal did reveal a texture-dependent difference: contact with a rough texture produced a higher rate 50–250 ms before the time of withdrawal.
Video recording and analysis.
Vibrissal motion and contact was recorded by high-speed (1000 fps; 512 × 512 pixels) digital video cameras (Motionpro 2000; Redlake) triggered by a light sensor positioned near the discriminanda. Films were usually 1 s long.
Films were analyzed off-line. For touch analysis, we extracted touch times (onset–offset) of the whiskers that were in the recorded neuronal clusters' receptive field. For a touch to be counted, the whisker had to be in contact with the texture plate and show a visible bending due to contact. Moreover, we extracted the withdrawal time—the instant when the rat's behavior changed in a way indicating to the observer that it was about to stop examining the texture to proceed toward the water spout. Independent analysis by different observers showed withdrawal time deviations of just a few milliseconds. Trials in which whisker touches could not be discerned were excluded from touch-based analysis, and trials in which the moment of withdrawal could not be extracted were discarded. Specifically, we used head trajectory as a measure of withdrawal, and took withdrawal time (t = 0) as the first video frame in which the head moved in a backward, lateral direction toward the reward spout. This was a reliable indicator of the rat's intention because trajectory, once initiated, never deviated toward the alternative reward spout. Post-withdrawal texture signals (Fig. 1C) occurred because the whiskers often remained in contact with the textured plate for a few tens of milliseconds even as the head moved backward, and the clusters continued to encode texture properties. Our analysis sought to reveal the texture signals underlying the animal's decision to withdraw toward the selected spout. Hence, we referred all times to the moment of withdrawal and focused on activity preceding the decision.
Surgery.
Rats were anesthetized with a mixture of Zoletil (30 mg/kg) and xylazine (5 mg/kg) delivered intraperitoneally, and a craniotomy was then made over barrel cortex. A 12 electrode drive (Neuralynx) was positioned above the craniotomy and attached by phosphate dental cement. Recording sessions in the apparatus began ∼10 d after electrode implantation.
Electrophysiological recordings.
Tungsten microelectrodes (Frederick Haer) were of 76 μm shaft diameter and 1–4 MΩ in impedance. Individual microelectrodes were advanced, independently of one another, by rotation of a screw in the drive to a depth of ∼600 μm, where it became possible to distinguish action potential waveforms evoked by manual whisker stimulation. Data reported here came from recordings at depths of 600–850 μm, as measured by the microdrive. This depth reading, together with the short response latencies (∼5 ms) and the small receptive fields (one to two whiskers), suggest an electrode position in layer 4.
Data analysis
Spike sorting and data selection.
All analyses were performed using Matlab (MathWorks). Spikes were semiautomatically sorted off-line on the basis of the energy and principal components using KlustaKwik (K. D. Harris, University College London, London, UK) algorithms and the MClust package (A. D. Redish University of Minnesota, Minneapolis, MN). Most electrodes yielded a multiunit neuronal cluster, but in some cases (n = 5) we could isolate single units with a pronounced refractory period. Only neuronal clusters with stable waveform and firing rate over the course of a session were considered in the analysis. For each cluster, the receptive field was mapped by manual stimulation of vibrissae.
Sessions were included only if they fulfilled three criteria: First, activity was recorded from at least three neuronal clusters. Second, uncut whiskers (those used by the animal to solve the task) were within the receptive field of recorded clusters; the receptive fields of the different clusters overlapped and included the relevant whiskers. Third, texture contact periods could be determined from whisker-tracking video analysis. In total, nine sessions satisfied these conditions.
Population vectors and linear discriminant analysis.
In previous work, the stimulus signal carried by barrel cortex populations has been quantified by mutual information methods (Montani et al., 2009; Petersen et al., 2009; Panzeri and Diamond, 2010). As the present work is a step from single-cluster decoding to population decoding, we considered linear discriminant (LD) methods to be effective. Computing information measures for a neuronal population requires estimation of the joint stimulus–response probabilities. For a population of n neurons, each of them having M possible response values, the population response can have Mn possible values, increasing exponentially with the number of neurons (Panzeri et al., 2007). In experiments with behaving animals it is difficult to collect enough data for the distribution over all Mn possible responses to be well sampled, despite recent improvements in sampling bias compensation (Panzeri et al., 2007). In linear discriminant analysis (LDA), as described below, the comparison between activity distributions corresponding to different stimuli is performed on a one-dimensional projection of the overall n-dimensional distribution.
We constructed time-dependent population activity vectors by temporally binning the activity of each jointly recorded cluster (Fig. 2; bin size, B = 50 ms; step size from bin to bin, S = 5 ms). Because B was larger than S, there was overlap between time bins. This had the effect of oversampling neuronal activity and effectively smoothing the temporal trajectory of population vectors. We explored parameter values over physiologically relevant ranges to ensure that texture signals in the neuronal population were optimally extracted, while verifying that qualitative results were robust to the specific choice of parameter (Fig. 3).
Figure 2.

Population vector and linear discriminant extraction from collective activity. A, Time-dependent population vectors were constructed by temporally binning the activity of jointly recorded clusters (N1, N2, N3, etc.; bin size B sets temporal resolution). Successive bins were displaced by a step S. To analyze coding over different periods, we focused on a moving window (width W, ending at times T2, T1, etc.). Times were taken relative to withdrawal. B, Representation of procedure for linear discriminant extraction. In clusters N1 and N2, rough and smooth stimuli evoke two response distributions (red and blue). Separate observation of N1 and N2 activity (marginal distributions along edges of main plot) results in poor discrimination due to the large overlap between rough and smooth response distributions. However, a linear combination (linear discriminant) minimizes overlap (note distributions projected onto optimal axis) and optimizes discrimination. Left and right panels show results for sliding windows ending at T = −100 and −400 ms, respectively. Since spike counts are integer values, different repeats of the same spike count combination fall on the same value. To aid visualization of all repeats and represent the density of the activity distribution, we randomly jittered each repeat by a small value. C, ROC curves for single clusters, summed activity, and observed population LD. Note that response distributions were better separated, and ROC areas correspondingly larger, at T = −100 ms compared to T = −400 ms, suggesting a link to the animal's decision.
Figure 3.

Effects of bin size and window size on population signal. A, Population A as a function of bin size B (30, 50, and 70 ms) and overall window width W. Values for a given time T correspond to Apop for data collected from −T ms to the withdrawal time of the animal (set to 0). Curves represent the overall mean across all sessions. Error bars indicate SEM across sessions. B, Population A as a function of the end time of the window, T, for three different widths W (100, 300, and 500 ms). Curves are means across all sessions. Error bars indicate SEM. Note the negligible effect of W on peak time.
We used receiver operating characteristic (ROC) analysis (Green and Swets, 1966) to compute the most discriminative linear combination of clusters and compared the resulting signal with that based on observation of single clusters. We measured the discrimination performance of clusters and populations using the area under the ROC curve (denoted by A). To do so, it was necessary to develop shuffling procedures to remove sampling bias and to assess the statistical significance of the signal. The area under ROC achieved by chance-level performance [where the probability of true positives (TPs) equals the probability of false positives (FPs)] is equal to 0.5. However, for small sample sizes, biases can result in an inflated estimate of A, particularly as the number of clusters grows. For example, if two neuronal clusters respond at random but the data set contains just one rough trial and one smooth trial, it is possible to construct an infinite number of discriminants that will result in perfect stimulus separation, giving an observed value A equal to 1 until additional trials are added. Thus, sampling bias is generated when the number of trials is limited, and will result in an overestimate whereby a true chance performance level Achance = 0.5 is observed as Achanceobs > 0.5.
For each data set, we estimated sampling bias as follows. We shuffled texture identity across trials to eliminate any dependence between texture and neuronal activity and produce chance-level discrimination. Then we computed the area under the resulting ROC. This shuffling procedure was repeated 500 times; the area under ROC was averaged over all repetitions and taken as Achanceobs. Since Achance should equal 0.5, the difference between Achanceobs and 0.5 was a sampling bias. In computing the corrected value of A, we accounted for this sampling bias by subtracting it from the observed A: Acorrected = A − sampling_bias = A − (Achanceobs − 0.5) = A − Achanceobs + 0.5.
To take sampling bias into account when searching for the optimal population discriminant, optimization was performed on this difference. All presented values of A were corrected in this way. Chance-level discrimination after bias correction corresponds to an expected area under the ROC equal to 0.5. To assess if a measured A was beyond chance level, i.e., was significantly larger than 0.5, we defined the significance level as the 95th percentile of the distribution of trial-shuffled A, corresponding to p < 0.05. In other words, p was computed as the probability that the measured A could have resulted from a chance relationship between neuronal activity and texture identity.
We extracted the optimal linear discriminant by using a genetic optimization algorithm. Most methods for linear discriminant search assume certain conditions: for example, that both distributions should have homogeneous covariance matrices (homoscedasticity). Such methods are suboptimal for data sets that violate those assumptions. In our data set, the different activity distributions often had very diverse covariance matrices. It was therefore necessary to adopt a method that does not depend on any assumptions on the geometry of the distributions. We sought an approach robust against spurious solutions, as follows. Any algorithm for discriminant determination based on ROC analysis must find the global maximum of the area under the ROC, as a function of the direction in activity space onto which the distributions are projected. Since the function “area under ROC” varies continuously with changes in direction, a global maximum always exists, but it can be difficult to find due to the existence of multiple local maxima. To circumvent this, we implemented a genetic algorithm approach using the Matlab genetic algorithm (ga) package. The individual population size was 20 “chromosomes.” The algorithm starts with an initial population of identical chromosomes, all of which provide the classical solution from Fisher discriminant analysis. This starting point ensures convergence to the classical Fisher discriminant for homoscedastic distributions. The algorithm stopped when the weighted average of the relative change in the best fitness function value over 200 generations became smaller than 10−6. We always compared the result of the best genetic algorithm-derived discriminant with that of the Fisher LDA as a check.
Computing effects of synergy and noise correlation.
To compute Aindep, the area under the ROC of two or more clusters under the assumption of conditional independence, we used a method similar to that described in the study by Haker et al. (2005). We started by combining ROC curves for the individual clusters, as follows. Any ROC curve plots the probability of true positive calls (hits; in the present data set, the call was made as to whether a texture was rough) against that of false positives (false alarms), with both probabilities generated by varying the detection threshold. Hence, each point on an individual cluster's ROC curve corresponds to a pair of values [FPc(i), TPc(i)], where c = 1, 2, …, n denotes the cluster, and i is an index running over all points on the ROC curve. For two clusters under the assumption of conditional independence, a joint true positive rate and false positive rate can be set for each arbitrary value of the clusters' detection thresholds, by simply taking the product of the corresponding individual FP and TP: IFP1,2(i,j) = FP1(i) * FP2(j) and ITP1,2(i,j) = TP1(i) * TP2(j), respectively.
An identical IFP value can potentially be generated from many possible combinations of FP values from the individual clusters (corresponding to different detection thresholds); however, only one such combination will result in the highest ITP value compatible with the IFP. By running through all possible IFP values and finding the highest ITP for each, we constructed the population ROC curve ensuring the maximum possible area. This principle was extended to populations of more than two clusters, such that the “independent” ROC curve consisted of a sequence of true positive and false positive probabilities, obtained by optimally pooling the activity of individual clusters. The resulting area under the ROC was Aindep.
To quantify synergistic or redundant effects, we compared the signal gained by observation of clusters with their true interactions to the signal gained by combining equivalent, but independent or shuffled, clusters. Comparisons were based on the relative difference between Apop for the observed population and A for the independent or shuffled populations, Aindep and Ashuff, respectively Hence, synergy was defined as (Apop − Aindep)/Apop, and the relative signal gain from noise correlations was (Apop − Ashuff)/Apop. The values entered in these measures were each quantity's peak; i.e., Apop was taken at its peak time (as seen in Fig. 4), and likewise for the other quantities. Peaks did not necessarily occur at the same times. All results were qualitatively robust when values were entered at common times [for example, at the time of peak (Apop − Aindep) or (Apop − Ashuff)].
Figure 4.

Examples of discrimination from collective activity. A, Temporal evolution of discrimination capacity (area under ROC, A) for single clusters (Aindiv), summed activity (Asummed), and population optimal LD (Apop) in two different sessions (Sessions 1 and 2). B, p values for Apop over time. Note that the values of A arising early in the trial were not significantly beyond random performance. C, Density of whisker touches over time, measured as fraction of trials on which touch (contact) occurred at a particular time. D, Angle between optimal LD (computed over all time windows) and LD for each particular time window along the trial. E, Comparison of the temporal evolution of Apop based on the overall optimal discriminant computed using the entire session duration and on optimal discriminants computed for different time windows. Error bars indicate SD across sessions.
Results
Barrel cortex activity during whisker-mediated texture discrimination
To explore how groups of neuronal clusters combine to represent texture, we analyzed recordings acquired during performance of a texture discrimination task by freely moving rats (von Heimendahl et al., 2007). The apparatus was situated in a room with visible light extinguished; invisible infrared light was used for video recording. On each trial, a textured plate, either rough or smooth, was presented. The rat perched on the front edge of a platform and extended itself forward to contact the discriminandum with its whiskers. After palpating the texture with its whiskers, the rat withdrew and turned to either the left or right spout, where it received a water reward, provided its choice was correct (Fig. 1A). Recordings were performed from two rats during nine recording sessions. Before the recording sessions, most whiskers were clipped bilaterally to leave the rat only the set of five or six whiskers that were topographically related (Petersen, 2007) to the clusters isolated at the electrodes implanted in contralateral cortex. During texture palpation, whiskers were imaged using a high-speed camera, and the individual whisker associated with each neuronal cluster was identified (Fig. 1B). By visual inspection, whisker touch times (contact onset and offset) were logged as well as the moment when the rat began to withdraw, which was taken as proxy for the animal's moment of choice.
Figure 1C displays raster plots of the activity of five jointly recorded neuronal clusters during rough and smooth trials. The spikes of each cluster are represented by a different color, and intervals of whisker contact with the plates are enclosed by black rectangles. Much of the overall variability in spiking can be explained by whisker contact versus noncontact. Across the data set, there was no significant difference between smooth and rough trials in the duration of exploration or the number or duration of whisker contacts. Peritouch response histograms averaged over all five clusters show that whisker contact induced a clear increase in firing rate (Fig. 1D, top), as observed in the study by von Heimendahl et al. (2007). The contact-induced increase in firing rate was greater than any difference in firing rate associated with texture identity. However, when response histograms were aligned by moment of withdrawal rather than by first contact time, a difference in the firing rate evoked by rough and smooth textures did emerge: on average, the rough texture elicited more spikes from ∼250 to ∼50 ms before withdrawal (Fig. 1D, bottom). Previous work showed that through this difference in firing, individual clusters carry significant information about texture identity (von Heimendahl et al., 2007). While the observations illustrated in Figure 1 confirm two major findings reported previously, (1) that whisker contact with the plates evokes an increase in firing rate and (2) that differences in texture cause a modulation in the response evoked by contact (von Heimendahl et al., 2007), our goal here is to go beyond single-cluster properties to determine how clusters combine to generate a population representation of texture identity.
Population vector and linear discriminant extraction from collective activity
To characterize texture-dependent variations in activity within simultaneously recorded groups of clusters, we constructed sequences of population activity vectors (Stopfer et al., 2003; Mazor and Laurent, 2005) from the data of each session (Fig. 2A). Each population vector was built from the number of spikes produced by neuronal clusters within a time bin (bin size set here to 50 ms; Fig. 2A, B), with time referenced to the rat's withdrawal from the texture. Each component of the vector corresponded to one cluster's spike count in that bin. Hence, a population vector described the joint activity of clusters during a small chunk of time of size B. A sequence of successive population vectors was built by shifting the time bin by a step of size S = 5 ms. As shown in Figure 2A, the time bins making up a given population vector overlapped those of the adjacent population vectors, because B was larger than S. Thus, three instances of population vectors for a population of n simultaneously recorded clusters would be the n-dimensional vectors constructed between, say, −500 and −450 ms, −495 and −445 ms, or −490 and −440 ms.
To track how neuronal activity evolved within trials, we considered sets of population vectors contained within a sliding window (Fig. 2A; window width, W, set to 300 ms). Each sliding window comprised an ensemble of population vectors built from neuronal activity recorded within the window. Since the sliding windows preceded withdrawal (set to 0 ms), the windows were labeled by their negative time stamp. For example, the set of population vectors included in the window ending at T = −200 ms comprised activity from −500 to −200 ms. This set consisted of the population vectors corresponding to time bins −500 to −450 ms, −495 to −445 ms, −490 to −440 ms, etc. We considered windows that ended at times later than T = −600 ms, as whisker contact rarely preceded the withdrawal time by >600 ms. For each window, rough and smooth trials were analyzed separately, giving rise to two sets of population vectors.
In the next step, we represented the set of population vectors corresponding to a given window as a cloud of points in n-dimensional space, where n ranged from 3 to 7 in the sessions considered. Each population vector was defined by its endpoint in space, with coordinates equal to the spike counts of the (1, …, n) simultaneously recorded neuronal clusters in the selected time bin. For example, if three simultaneously recorded clusters generated three, five, and zero spikes within the time bin from −500 to −450 ms, then the population vector would be (3,5,0), corresponding to a point located at those coordinates in three-dimensional space. The population vectors associated with the two stimuli generated two corresponding distributions (“clouds”) of points (Fig. 2B).
Given this form of representation, quantifying the neuronal population's ability to discriminate texture reduces to measuring the degree of segregation between the two distributions of points. The first step was to identify the dimension along which the distributions were best separated. To accomplish this, the separation between distributions was quantified by constructing a ROC curve and computing the area under the curve, A (Fig. 2B,C; see Materials and Methods) (Green and Swets, 1966; Britten et al., 1992). The area between the ROC curve and the diagonal line, according to signal detection theory (Green and Swets, 1966), is equal to the increase with respect to chance that an ideal observer would correctly classify a randomly chosen trial as rough or smooth: the area under the diagonal line, equal to 0.5, corresponds to chance-level performance. To correct for sampling bias, instead of the simple diagonal line, we used an ROC curve produced by a shuffling procedure as our estimate of chance-level discrimination (see Materials and Methods). This procedure is more conservative when the number of trials is finite. The final measure A was equal to the performance (proportion of correct trials) supported by the linear discriminant: its expected value for random discrimination was 0.5.
We used a genetic optimization algorithm to determine the spatial dimension along which the distributions were best separated according to the ROC measure. The algorithm identified the direction that produced the highest A and thus best revealed the population's ability to support discrimination between textures. In Figure 2B (left), the responses to rough (red) and smooth (blue) stimuli are well separated along the optimal linear discriminant (diagonal line) in the window ending 100 ms before the rat's withdrawal. In contrast, responses in a time window ending 400 ms before the rat's withdrawal were not separable (Fig. 2B, right). The observation that population responses supported rigorous discriminability shortly before the animals' withdrawal will be further developed later.
To assess the gain in discrimination afforded by the coordinated population relative to individual clusters, we compared A computed for the population linear discriminant (Apop) with A computed for the ROC curves of individual clusters (Aindiv) and A computed for the ROC curve constructed from the summed activity of the population (Asummed). Summing the activity is equivalent to giving the same weight to all clusters. Figure 2C depicts these ROC curves for a population of two clusters in two time windows (same data set as in Fig. 2B). In this example, 100 ms before the rat's withdrawal time (Fig. 2C, left) the population afforded a higher degree of texture discrimination than did the individual clusters or their summed activity. The clusters provided poor stimulus discriminability 400 ms before withdrawal time (Fig. 2C, right).
The above analysis relied on setting values for a number of temporal parameters: window width W, bin size B, and shift step size S. We explored the effects of variations in parameter values as follows. From previous analysis, we knew that individual whisker contacts during texture exploration last 25–60 ms and that a number of such contacts are made, giving a total exploration time per trial ranging between 90 and 225 ms (von Heimendahl et al., 2007). We reasoned that, to be biologically relevant, bin sizes should be in the range of durations of individual contacts. Thus, we explored values of B between 30 and 70 ms. Similarly, we reasoned that the overall window over which bins were collected should be several hundred ms long, comparable to the full duration of integration periods. Figure 3A plots the value of Apop for windows ending at 0 ms relative to withdrawal and having width W from 100 to 1100 ms, averaged across all recording sessions. The panel shows that while B = 50 ms was a good choice of bin size, varying B in the range from 30 to 70 ms only had a weak effect on Apop. Window width had a stronger effect: the best signals derived from W in the range 200–400 ms. Figure 3B shows Apop for windows extending back from time T relative to withdrawal until T − W. This plot confirms the results in Figure 3A while showing that, regardless of choice of W, the most discriminative signals in neuronal activity occurred over the period ending ∼100–75 ms before withdrawal, implying that peak discrimination time was robust against the choice of W. Based on these findings, we selected bin size B = 50 ms and window width W = 300 ms for all further analyses. Varying step size between 1 and 40 ms had negligible effects (data not shown); we used S = 5 ms for further analyses.
Texture discrimination afforded by coordinated activity
Figure 4 shows results for the populations recorded in two sessions. In Figure 4A, Apop, Aindiv, and Asummed are plotted as a function of sliding window time relative to withdrawal, for each of the two sessions. In both sessions, there was considerable variability in Aindiv across clusters. Also in both sessions, Apop was always greater than Asummed, indicating that the better performance of the population compared to single clusters cannot be explained by the averaging of noise across clusters. The advantage of Apop over Asummed was particularly pronounced in Session 2. Another feature common to both sessions is that peak performance occurred for sliding windows ending at approximately T = −100 ms relative to withdrawal. Figure 4B shows that the ability of the coordinated population signal to support texture discrimination reached statistically significant values by ∼300 ms before withdrawal (p < 0.05; for statistical test, see Materials and Methods).
However, the two sessions differed in one key respect. In Session 1, the best single cluster's signal almost matched that of the population, suggesting that interactions did not contribute. In contrast, in Session 2, the full population far outperformed any of the single clusters. Across sessions, we found a varying degree of “advantage” of Apop over the single clusters: some sessions included one or two clusters that effectively discriminated rough from smooth and were not improved upon by considering the population, while other sessions displayed poor discrimination at the single-cluster level, but robust discrimination in the recorded population.
As expected, the time course of Apop paralleled the probability, per trial, that the whisker providing input to the population contacted the surface (Fig. 4C). There were hardly any touches in the earliest period of the trials (−600 to −400 ms relative to withdrawal), consistent with the absence of any signal in neuronal activity during the same period. Over the last 400 ms before the moment of withdrawal, whisker contact probability increased progressively, providing the sensory signals that generated the neuronal code.
In the analyses presented until now, the optimal linear discriminant was computed separately for each 300 ms time window ending from T = −600 ms until the time of withdrawal, 0 ms. This form of analysis assumes that an observer can, in each window, apply the corresponding optimal linear decoder to incoming signals, equivalent to receiving input from each cluster with the optimal weight for that window. However, it is not reasonable to suppose that the many synapses ending on a target neuron could assume weights varying optimally over time. A simpler and more plausible model is that the profile of incoming weights is stable across time. In this alternative scheme, the decoder receives and linearly combines inputs according to a template that is fixed over the duration of the trial. When the stimulus identity becomes explicit through this decoding operation, the rat is ready to make a choice. In other words, the decoder utilizes a single discriminant across all time points.
This model predicts that if we define (1) the optimal linear discriminant for each time window and (2) the linear discriminant that provides the greatest discriminability for any of the tested time windows, these two linear discriminants should be aligned in approximately the final 100 ms before time of withdrawal. A measure of the alignment between discriminants is the angle between them; the smaller the angle, the more alike are two discriminants. We performed the test for the same two sessions and found that the optimal discriminant direction for the window ending 50–100 ms before withdrawal was aligned with the optimal discriminant direction of the entire trial (Fig. 4D, black line). This finding held up across sessions (Fig. 4D, angle averaged across all sessions given by the gray plot).
A second prediction is that if we determine separately optimal discriminants according to neuronal activity in different time windows, the discriminant based on the critical 200 ms prewithdrawal period will provide the highest peak discriminability of all discriminants computed for the whole duration. The test is shown in Figure 4E, where the discriminant optimized according to the final 200 ms before withdrawal (orange line) supports poor stimulus discrimination early in the trial (600 to 400 ms before withdrawal), but provides peak overall stimulus discrimination.
Together, the results shown in Figure 4, D and E, are consistent with a mechanism in which a downstream decoder of activity could combine inputs according to a stable template and would achieve peak discrimination of the stimuli in the final 200 ms before withdrawal; indeed, the implication is that the emergence of the best stimulus representation leads the rat to make a choice and to withdraw.
Next, we considered the temporal dynamics of discrimination capacity just before the moment of withdrawal. Averaging Apop over sessions shows that the discrimination capacity in the population activity reached its peak from ∼50 to 100 ms before the moment of withdrawal, slightly later than the peaks of individual clusters (Fig. 5A,B). This peak was not sensitive to the choice of window width W, as shown in Figure 3B. The instant of the rat's decision as to texture identity, as signaled by withdrawal from the texture, was thus closer in time to the population texture signal than it was to the signal in the individual clusters. The delay between peak texture signal and withdrawal can be attributed to the time necessary to transform the explicit stimulus representation into a motor response.
Figure 5.

Robust collective discrimination from variable single-cluster discrimination. A, Evolution in time of Apop, Asummed, and Aindiv for best individual cluster per session, averaged across all sessions (n = 9). Note slightly later peak time for Apop. B, Histogram of times of peak for Apop and Aindiv (individual clusters). In individual sessions, peak A for the population tended to occur closer to the moment of withdrawal than did peak A for individual clusters. C, Apop and Aindiv for all sessions, ranked by Apop. Example sessions from Figure 4 are marked with an asterisk. For individual clusters (gray symbols), multiunits are squares and single units are circled. Note heterogeneity in Apop and also in the distance from single cluster values, Aindiv, to Apop. D, p values for discrimination capacity in each session. While many single clusters could not support discrimination between rough and smooth, populations always contained a signal sufficient for discrimination at the p < 0.05 level. Error bars indicate SEM.
Robust population signal emerges from heterogeneous single-cluster signals
As evident in Figure 4, there was much variability across sessions in the increase in texture signal afforded by the population compared to that afforded by the signals of the individual clusters. This suggests that there was marked diversity in the way signals were combined within the sampled populations.
To gain insight into the relationship between individual and population signals in different sessions, we plotted peak Apop values for all nine sessions (Fig. 5C) as well as the corresponding p values for discriminability (Fig. 5D). As a general trend, the presence of more informative individual clusters tended to result in a more informative population. The area under the ROC for single units tended to be smaller than that for the multiunit clusters (Fig. 5C; two-way Kruskal–Wallis test, p < 0.01). Beyond these trends, the difference between Apop and the largest value of Aindiv, i.e., between the performance of the population and that of its constituent individual clusters, varied widely. For instance, in the session ranked 1 (Fig. 4, Session 1), the maximum value of Aindiv was close to Apop, whereas in the sessions ranked 2, 3, and 4, the maximum value of Aindiv was much lower than Apop. Figure 5D plots the statistical significance of the area under the ROC and shows that most individual clusters (65%, 26 of 40) could not support texture discrimination at a statistically significant level, consistent with (von Heimendahl et al., 2007). In contrast, the jointly recorded population was able to support texture discrimination at a statistically significant level in all sessions (p < 0.05). This was true even for sessions where, remarkably, no individual cluster reached significance (Fig. 5D, sessions ranked 5, 6, and 9). A downstream neuron receiving input from a randomly sampled, heterogeneous set of clusters could extract a reliable texture signal by linearly combining the activity of the different clusters.
Contribution of interactions between clusters
The widely varying improvement in discriminability afforded by the full population could be attributed to the nature of the interactions between clusters: interactions might have a synergistic or redundant effect, depending on whether the signals carried by different clusters complemented and enhanced each other or did not. To quantify the discriminability gained by interactions, we compared the signal extracted from the observed population, Apop, with a measure of the signal available to a decoder that did not take into account the relationships between clusters, referred to as Aindep. Since Aindep ignores interactions, it can be computed by combining different clusters that were recorded concurrently during a common set of trials, or recorded in different sessions. To obtain Aindep, we built an optimal ROC curve based on the assumption that the distributions of activity for different clusters were conditionally independent of each other (Haker et al., 2005). We then computed the area under the ROC curve. Figure 6A shows Apop and Aindep plotted for all sessions ranked in order of the value of Apop. For some sessions (e.g., Sessions 2 and 3), Apop was greater than Aindep, indicating a synergistic interaction between clusters. Conversely, for other sessions, Apop was slightly smaller, indicating redundancy across clusters (e.g., Sessions 1 and 7). Comparing Figure 6A with Figure 5C indicates a tendency toward redundancy in sessions that had several strongly discriminative clusters (e.g., Session 1) and a tendency toward synergy in sessions where no cluster discriminated strongly on its own (e.g., Sessions 3 and 5).
Figure 6.

Synergy and redundancy in barrel cortex populations. A, Observed Apop compared to Aindep and Asummed for all sessions. B, Behavior of synergy as a function of the number of clusters, for all sessions and subsets of clusters. Each point is an average over all possible subpopulations with the same number of clusters. Synergy did not depend systematically on the number of recorded clusters. C, Relationship between synergy and spread (variation of Aindiv across single clusters within a session). Synergy was a saturating function of spread. D, Aindep for increasing number of clusters pooled across different sessions. Error bars indicate SD across combinations of clusters.
Next, we asked whether the amount of synergy or redundancy in a session was correlated with other properties of the population. For this purpose, we defined the measure of synergy, syn, as the difference between Apop and Aindep normalized by Apop as follows: syn = (Apop − Aindep)/Apop.
We first hypothesized that synergy could be related to the number of clusters sampled, n. Figure 6B plots the dependence of synergy on n for all sessions; for each session and value of n, synergy was computed as the average over all possible combinations of subpopulations with exactly n clusters. For a given session, the largest possible n was the total number of recorded clusters. Error bars give the SD across subpopulations. Clearly, there was no strict dependence of synergy on n: for instance, for n = 4, mean values of synergy range widely, from −0.4 to +0.4. Moreover, the shape of the curve relating synergy to n was variable across sessions and was sometimes nonmonotonic (Fig. 6B, dark blue session).
Further examination of Figures 5C and 6A reveals that sessions where sensory information varied widely across clusters also tended to display high synergy, particularly when the average signal carried by each cluster was not large. We speculated that synergy might be related to variability in the signal conveyed by individual clusters. For example, clusters that conveyed little texture information on their own might nevertheless enhance the signal carried by other clusters. To quantify the variability, or spread, of signal strength across clusters for each session, we computed the SD of Aindiv values across individual clusters and divided it by the mean Aindiv across the same clusters. Figure 6C shows the dependence of synergy on spread for all sessions, computed using the full set of clusters in each session as well as partial subsets of clusters. The principal result is that, within and across sessions, synergy had a clear, monotonically increasing and saturating relationship with spread.
A framework for interpreting this result is that when several clusters individually conveyed strong information, the spread tended to be small, and the collective signal was redundant; strongly informative clusters likely behaved in a correlated manner, conveying their sensory signals in a similar way. Conversely, when a session contained both poorly informative and moderately informative clusters, spread tended to be larger, and the clusters that were less informative (when taken alone) were able to enhance the signal carried by other clusters.
Texture signals in a pooled population
Our method for estimating Aindep, the area under the ROC curve assuming conditional independence of clusters, does not require clusters to be recorded simultaneously, and therefore permits pooling of clusters across sessions to achieve a larger sample size. We thus pooled the entire set of recorded clusters to build a curve describing how Aindep grows as a function of population size (Fig. 6D). For the binary discrimination task at hand (rough versus smooth), the texture information carried by a population of pooled clusters saturated with about n ≈ 20 clusters (Fig. 6D). This suggests that receiving input from a population of independent (noninteracting) neuronal clusters larger than about 20 would not further enhance a decoder's representation of texture. For larger stimulus sets, larger numbers of clusters would likely be required to reach saturation.
Noise correlations underlying synergy and redundancy
In general, synergistic or redundant effects in a population are determined by the extent to which the stimulus-independent variability of the responses of different neurons is correlated—the so-called “noise correlations” (Gawne and Richmond, 1993; Panzeri et al., 1999; Petersen et al., 2001, 2002a, b; Averbeck et al., 2006; Montani et al., 2009; Ince et al., 2010). To gain insight into the interactions underlying synergy and redundancy, we measured the contribution of noise correlations to the population signal in each session as follows. First, we rearranged the session's population vectors by shuffling the response of each cluster across trials and time bins. As all bins remained within the same overall sliding window of size W and within the same stimulus category after the shuffling procedure, this manipulation left intact the texture signal in each individual cluster, but eliminated noise correlations across clusters. We then computed optimal discriminants and measured the resulting discriminability, termed Ashuff. Examples are shown in Figure 7A. These plots depict the temporal evolution of Apop and Ashuff for the two sessions displayed in Figure 4. In Session 1 (also the session ranked 1 in group plots in Figs. 5, 6), shuffling increased the texture information available in the population, meaning that noise correlations must have caused neurons to be redundant. In contrast, in Session 2 (ranked 3 in Figs. 5, 6), shuffling decreased the texture information, meaning that correlations had a synergistic effect. The separation between the Apop and Ashuff curves shows that correlations and their effects became significant in the last ∼200 ms before the rat's moment of withdrawal.
Figure 7.

Noise correlations underlying synergy and redundancy. A, Temporal evolution of Apop and Ashuff for the two sessions from Figure 4. In Session 1, shuffling increased the texture information conveyed by the population, whereas in Session 2, shuffling decreased the information. Error bars indicate SEM across repeats. B, Synergy plotted against relative gain compared to shuffling. There was a clear correlation between synergy and the relative gain. C, Behavior of the relative gain compared to shuffling, as a function of the number of clusters, for all sessions and subsets of clusters. Error bars indicate SD across combinations of clusters.
To specify whether noise correlations were the fundamental factor that determined synergy or redundancy within sets of recorded populations, we compared the difference in signal resulting from noise correlations to the overall amount of synergy or redundancy for each session. The first step was to quantify the relative gain, the signal gained or lost by noise correlations, as relative gain = (Apop − Ashuff)/Apop. Next, we plotted synergy (syn, defined above) against relative gain (Fig. 7B). The two measures were highly correlated across sessions (Spearman's r = 0.87, p = 0.0045). Moreover, within individual recording sessions, the information gained from noise correlations varied with population size (Fig. 7C) in the same way as the quantity of overall synergy (compare Fig. 6B). This confirms that the presence of synergy or redundancy in a given recorded population could be explained largely by the effects of noise correlation.
Performance of linear discriminant classifier
The previous results demonstrate that a decoder linearly weighing the activity of multiple inputs would be able to robustly read out the identity of the stimulus if we consider average performance across trials. However, the rat makes its choice based on the evidence available in single trials, making a test of single-trial decoding particularly relevant. Identifying the stimulus as rough or smooth on a single trial requires a decision boundary. Therefore, our approach was to find the optimal linear discriminant based on all trials but the current one (Fig. 8A). To do so, we obtained the distributions of activity in smooth and rough trials and projected them onto the linear discriminant, as above (Fig. 8B, top).
Figure 8.
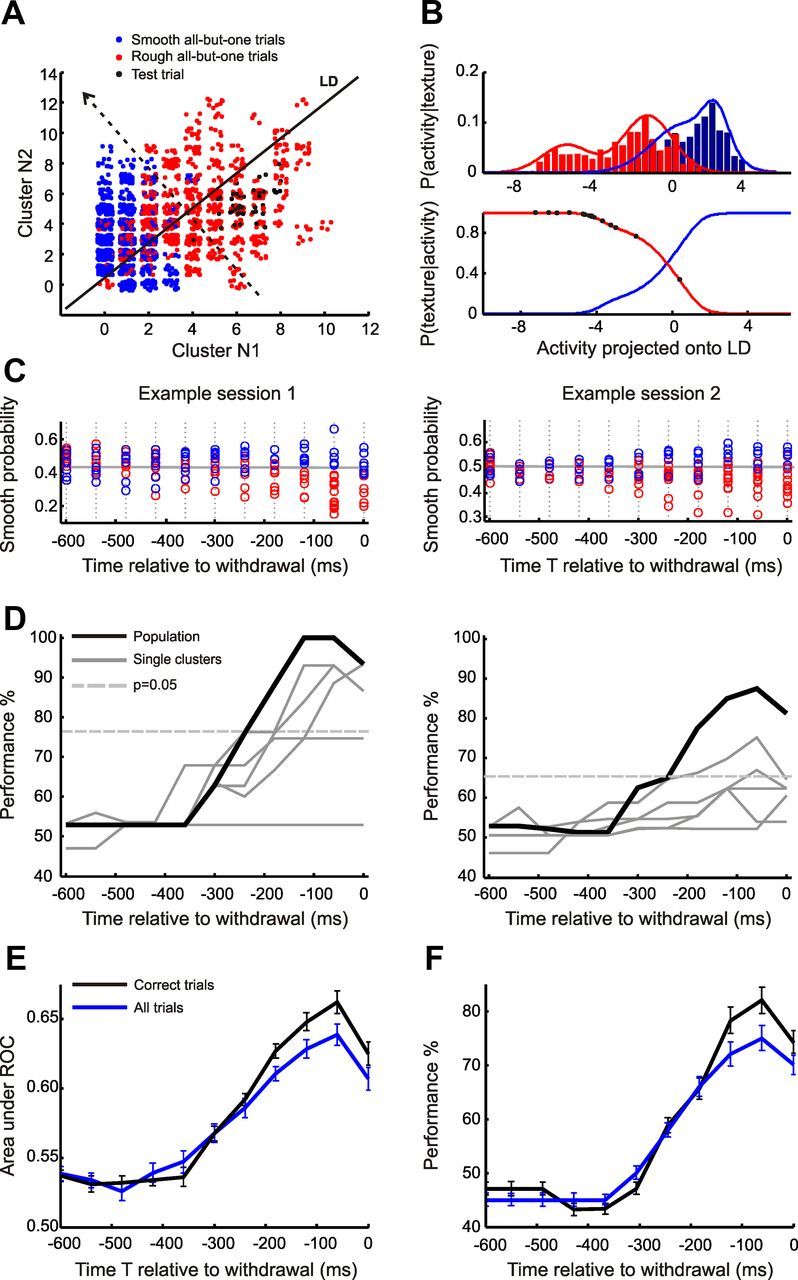
Performance of linear discriminant-based classifier. A, To compute classification performance, LDs were obtained for all trials but one. Red and blue clouds show activity distributions on all trials but one. Black dots show activity on the remaining trial. B, Population activity on the remaining trial was then classified as resulting from a rough or smooth stimulus using a estimator. Top, Histograms for rough- and smooth-evoked activity, P(activity|texture), projected onto the LD. Bottom, Posterior functions P(smooth|activity) and P(rough|activity) obtained for all trials but one using Bayes' rule. Black dots, Activity values collected during the remaining trial, which was rough. Note that activity values are more consistent with a rough than with a smooth trial. C, Probability of classifying texture as smooth on a given trial, as a function of population activity projected onto the LD as in B, plotted against the time at which the activity was recorded for example Sessions 1 and 2 (Fig. 4). Each data point corresponds to one trial and is labeled according to the true identity of the texture presented on that trial. Note that early in the trial, activity associated with rough (red) and smooth (blue) trials was completely overlapping, but separated in the final 300 ms before withdrawal. D, Classification performance based only on correct recorded trials for example Sessions 1 and 2. Time resolution: 60 ms. E, Across-session averages of area under ROC for correct-only trials and for all trials (correct and incorrect). F, Across-session averages of classification performance for trials labeled as in D. Error bars indicate SEM.
Next, we used Bayes' rule to determine the posterior probability of the texture being smooth or rough (Fig. 8B, bottom). Figure 8C shows the resulting probability of the texture being smooth depending on the activity collected on each trial, in each time bin (temporal resolution, 60 ms), for the two sessions shown in Figures 4 and 7. Next, we computed the decision boundary as the border that most accurately sorted trials into smooth and rough (Fig. 8C, gray line). Figure 8D plots the resulting performance of the classifier (defined as the percentage of correctly classified trials) for the two example sessions. In Session 1 (Fig. 8D, left), classification performance reached 100%. In this session, single clusters also allowed high classification performance, beyond 90% in some time windows and well above the significance threshold of p = 0.05. Conversely, in Session 2 (Fig. 8D, right) single clusters yielded poor classification performance: for the majority of clusters, <65% and below the significance threshold. Yet the population reached ∼90% performance, underscoring the robust performance of jointly recorded populations even when the constituent single clusters did not do well.
Note that the classifier approach effectively provides a cross-validation of the LDA results presented previously: for each test trial's corresponding set of all-but-one trials, the linear discriminant was constructed in the same manner as for the previous figures in this paper. Classification performances of 90–100% such as were achieved on the data set in Session 1 imply that the all-trials-but-one classifiers were stable, and that there were effectively no outlier trials giving rise to overfitting. Similarly, for Session 2, the population-based classifier almost reached 90%. These results indicate that, for the present data set, LDA led to stable classification.
As was true for previous analyses (Figs. 4, 5), one can assess the validity of the proposed linear classification scheme by considering not only the quantity of stimulus signal in population activity, but also the time at which the signal reached its peak. In that vein, we note that in both of the illustrated sessions (Fig. 8D), single-trial performance peaked within the last 200 ms before the rat's withdrawal from the texture, exactly the expected time of its explicit recognition of the stimulus. This was also true for the remaining sessions (data not shown).
The above analysis was based on trials correctly classified by the rat. If the rat's brain used some form of classifier resembling our model, then we would expect that behavioral errors might occur on trials in which neuronal activity caused an incorrect stimulus “readout.” In that case, the reliability of the population code would be reduced on error trials. To test this notion, we constructed the linear discriminant using activity collected on all trials, including those where the rat made an error. The result was that, across sessions, both Apop (Fig. 8E) and the single-trial performance of the linear classifier (Fig. 8F) were significantly degraded on the full set of trials compared to the set of correct trials. Thus, a decoder more frequently “misclassified” the stimulus when the classifier was constructed using activity from the rats' correct plus error trials than when using activity only from correct trials. In short, the trial-to-trial variations in the barrel cortex population signal, decoded by a linear classifier, were correlated with behavioral performance. These results are consistent with a causal relationship between the population's “linear” signal and the animals' choices.
Discussion
Stimulus signals carried by small populations
We developed a linear discriminant method to analyze neuronal population activity in the barrel cortex of rats performing a texture discrimination task. A signal robust enough to provide stimulus identity in single-trial responses was present in the population's activity in every experimental session. The stimulus could be extracted from population activity simply by linearly weighting the responses of different neuronal clusters. This was particularly remarkable given that recorded populations were small (three to seven clusters) and were not selected on the basis of a strong stimulus-dependent response. Thus, the population signal was present even in sessions where the single clusters were not informative.
The majority of neuronal clusters in our data set consisted of multiple units recorded on a single electrode, i.e., of clusters containing more than one neuron. Of a total of n = 40 clusters, n = 5 corresponded to well-sorted single units. For these, the area under ROC was smaller than that for the multiunit clusters (Fig. 5C). This enhanced discrimination afforded by multiunit clusters confirms the increase in discriminability resulting from the pooling of neurons, as reported in Figures 4–6. From the point of view of our discriminant analysis, including all spikes from a cluster of multiple units is equivalent to forcibly assigning equal weight to all the separate units contained therein. This is effectively the same operation done in the computation of Asummed, the discriminability achieved by direct accumulation of the activity of different clusters (Figs. 4, 6). We found that Asummed was always less than Apop, the discriminability obtained with the population's optimal linear discriminant. It follows that the inclusion of multi-unit recordings in our population analysis leads to nonoptimal weighting of single units, that is, the multiunit clusters are single units summed with the same weights. Hence, the Apop in our analysis must be a lower bound on the A achievable by optimal linear decoding of fully sorted single neurons. In sum, our results are likely an underestimate of the total signal that could be extracted from sets of neurons.
The functional significance of a linearly decodable population signal is that a downstream neuron receiving input from a set of barrel cortex neurons could integrate these inputs in such a way as to give an explicit response about stimulus identity. For instance, a receiving neuron could fire in the presence of one stimulus and not fire in the presence of the other. This could be a mechanism for achieving the increasingly sparse representation that is characteristic of higher-order areas (Quiroga et al., 2008; DiCarlo et al., 2012).
Implications for population texture encoding
Our results emphasize that during a texture discrimination task, when the animal is touching the surface with multiple whiskers, multiple clusters in different barrel columns become activated, yet only a minority carry strong texture signals by firing rate (von Heimendahl et al., 2007). The heterogeneous nature of the sensory representation across single neurons is consistent with other studies of barrel cortex; neuronal activity associated with texture exploration is sparse and selective (Jadhav et al., 2009). In other behaviors, most neurons are not informative about the particular task being studied. For example, in a whisker-based object localization task performed by mice, only 43% of neurons in the relevant cortical barrel column carried a significant signal about target position (O'Connor et al., 2010). Neurons within a barrel column appear to be not only “topographically specialized” according to the principal whisker of the cortical column (Harris et al., 1999; Petersen, 2007), but also “functionally specialized,” so that any specific sensory task may engage only a fraction of the total population.
Functional specialization of response properties is consistent with results in anesthetized animals showing that different neurons within a local volume can have heterogeneous sensory tuning properties (Andermann and Moore, 2006; Kerr et al., 2007; Sato et al., 2007; Kremer et al., 2011). In rodents, a spatially disorganized “salt-and-pepper” arrangement of sensory response properties is present in other sensory modalities as well (Ohki et al., 2005; Ohki and Reid, 2007; Bandyopadhyay et al., 2010; Rothschild et al., 2010; Ko et al., 2011).
The heterogeneity of coding on a neuron-by-neuron basis might appear at first glance to compromise the animal's ability to identify textures: if only a minority of neurons carry strong sensory signals, how can downstream circuits sample from the population in a way that allows them to obtain a robust message? Our results show a way around this apparent problem: in barrel cortex, the strong texture signal carried individually by a relatively sparse minority of clusters exists in the context of a population code whereby synergistic interactions allow groups of clusters—even when relatively small in number—to jointly transmit texture information.
A further possible coding mechanism is the temporal pattern of action potentials within each touch. Due to kinematic profiles of whisker motion that differ according to texture (Lottem and Azouz, 2008; Wolfe et al., 2008; Jadhav et al., 2009; Lottem and Azouz, 2009; Zuo et al., 2011), neurons may carry texture information by sequences of spikes (Arabzadeh et al., 2006; Jadhav et al., 2009). Further analysis of data from behaving rats is required to evaluate this candidate coding mechanism.
Extrapolating to larger populations: task performance and synergy
The overall picture that emerges from our data is that even small sets of neuronal clusters can carry a complete message. By simulating clusters as noninteracting, we pooled them across sessions and found that the population texture signal saturated at ∼20 clusters (Fig. 6D). Yet, neurons may interact in a synergistic manner that allows a population to carry a strong texture signal with even fewer clusters. Does barrel cortex encode objects with such small numbers of clusters? In answering this question, several points should be noted.
First, the texture discrimination task was binary, and animals were well trained. An increase in task difficulty, either by forcing the rat to discriminate between two stimuli more similar to each other or by increasing the number of stimuli to be discriminated, would increase the population size necessary to carry a complete stimulus signal (Kampa et al., 2011).
Second, as the number of neurons in a population increases, synergy will necessarily deteriorate. Indeed, any very large set of neurons will include some that individually carry a reliable texture signal, so the rest of the population must be redundant with them. As the number of recorded neurons nears the full sample, the net contribution from synergistic interactions will diminish, and the overall texture signal in the recorded population will saturate (Zohary et al., 1994; Abbott and Dayan, 1999; Sompolinsky et al., 2001; Wilke and Eurich, 2002; Shamir and Sompolinsky, 2006). The present study included small numbers of clusters and did not reach a redundant regime: the stable positive synergy found for comparatively small populations cannot be directly extrapolated to larger samples.
Third, the number of targets that receive stimulus information from barrel cortex is large. Prominent reciprocal projections are found between primary somatosensory cortex and secondary somatosensory cortex, motor cortex, perirhinal cortex, and thalamus. Barrel cortex also projects to striatum, thalamic reticular nucleus, zona incerta, anterior pretectal nucleus, superior colliculus, pons, red nucleus, and spinal trigeminal brain stem nuclei (for review, see Aronoff et al., 2010). For the purpose of distributing sensory information, barrel cortex may need many sets of responding populations, each projecting to a different target area. In this light, an efficient code like that demonstrated in this study is advantageous.
Robustness of linear decoder analysis
Our method for discriminant analysis specified the best discrimination achievable by linear summation of the activity of recorded clusters. Such a linear method necessarily provides a lower bound on the discrimination capacity that could be gained by observing the collective activity. Enhanced discrimination could potentially be obtained through more elaborate nonlinear methods. However, we found that several nonlinear methods (support vector machines, Fisher kernel discriminant) did not yield significantly improved results. Such methods, which involve free parameters, only resulted in increased ROC areas compared to LDA for very specific parameter choices that overfit the data. Linear methods have been used successfully to study population encoding in other cortical areas (Hung et al., 2005; Meyers et al., 2008; Nikolić et al., 2009). This previous work is consistent with our own results in that nonlinear decoding often does not significantly improve on linear methods. Rather, the information contained in the population can be decoded from barrel cortex activity by a weighted linear sum of inputs. Such a linear combination of responses across clusters is accessible to downstream neurons through known physiological mechanisms (Koch, 1999).
Footnotes
This work was supported by the Human Frontier Science Program (Project RG0041/2009-C); European Research Council Advanced Grant CONCEPT (Project 294498); European Union FET Grants BIOTACT (Project 215910), CORONET (Project 269459), and SICODE (Project 284553); the Compagnia San Paolo; Spanish Ministry of Science and Innovation Grants BFU2008-03017/BFI and Consolider CSD2007-00023 (cofunded by the European Fund for Regional Development); and Valencia Regional Government Grants PROMETEO/2011/086 and ACOMP2010/199.
References
- Abbott LF, Dayan P. The effect of correlated variability on the accuracy of a population code. Neural Comput. 1999;11:91–101. doi: 10.1162/089976699300016827. [DOI] [PubMed] [Google Scholar]
- Andermann ML, Moore CI. A somatotopic map of vibrissa motion direction within a barrel column. Nat Neurosci. 2006;9:543–551. doi: 10.1038/nn1671. [DOI] [PubMed] [Google Scholar]
- Arabzadeh E, Zorzin E, Diamond ME. Neuronal encoding of texture in the whisker sensory pathway. PLoS Biol. 2005;3:e17. doi: 10.1371/journal.pbio.0030017. [DOI] [PMC free article] [PubMed] [Google Scholar]
- Arabzadeh E, Panzeri S, Diamond ME. Deciphering the spike train of a sensory neuron: counts and temporal patterns in the rat whisker pathway. J Neurosci. 2006;26:9216–9226. doi: 10.1523/JNEUROSCI.1491-06.2006. [DOI] [PMC free article] [PubMed] [Google Scholar]
- Aronoff R, Matyas F, Mateo C, Ciron C, Schneider B, Petersen CC. Long-range connectivity of mouse primary somatosensory barrel cortex. Eur J Neurosci. 2010;31:2221–2233. doi: 10.1111/j.1460-9568.2010.07264.x. [DOI] [PubMed] [Google Scholar]
- Averbeck BB, Latham PE, Pouget A. Neural correlations, population coding and computation. Nat Rev Neurosci. 2006;7:358–366. doi: 10.1038/nrn1888. [DOI] [PubMed] [Google Scholar]
- Bandyopadhyay S, Shamma SA, Kanold PO. Dichotomy of functional organization in the mouse auditory cortex. Nat Neurosci. 2010;13:361–368. doi: 10.1038/nn.2490. [DOI] [PMC free article] [PubMed] [Google Scholar]
- Britten KH, Shadlen MN, Newsome WT, Movshon JA. The analysis of visual motion: a comparison of neuronal and psychophysical performance. J Neurosci. 1992;12:4745–4765. doi: 10.1523/JNEUROSCI.12-12-04745.1992. [DOI] [PMC free article] [PubMed] [Google Scholar]
- Carvell GE, Simons DJ. Biometric analyses of vibrissal tactile discrimination in the rat. J Neurosci. 1990;10:2638–2648. doi: 10.1523/JNEUROSCI.10-08-02638.1990. [DOI] [PMC free article] [PubMed] [Google Scholar]
- Diamond ME, Arabzadeh E. Whisker sensory system—From receptor to decision. Prog Neurobiol. 2012 doi: 10.1016/j.pneurobio.2012.05.013. Advance online publication. Retrieved March 7, 2013. [DOI] [PubMed] [Google Scholar]
- Diamond ME, von Heimendahl M, Knutsen PM, Kleinfeld D, Ahissar E. ‘Where’ and ‘what’ in the whisker sensorimotor system. Nat Rev Neurosci. 2008;9:601–612. doi: 10.1038/nrn2411. [DOI] [PubMed] [Google Scholar]
- DiCarlo JJ, Zoccolan D, Rust NC. How does the brain solve visual object recognition? Neuron. 2012;73:415–434. doi: 10.1016/j.neuron.2012.01.010. [DOI] [PMC free article] [PubMed] [Google Scholar]
- Foffani G, Chapin JK, Moxon KA. Computational role of large receptive fields in the primary somatosensory cortex. J Neurophysiol. 2008;100:268–280. doi: 10.1152/jn.01015.2007. [DOI] [PMC free article] [PubMed] [Google Scholar]
- Gawne TJ, Richmond BJ. How independent are the messages carried by adjacent inferior temporal cortical neurons? J Neurosci. 1993;13:2758–2771. doi: 10.1523/JNEUROSCI.13-07-02758.1993. [DOI] [PMC free article] [PubMed] [Google Scholar]
- Ghazanfar AA, Stambaugh CR, Nicolelis MA. Encoding of tactile stimulus location by somatosensory thalamocortical ensembles. J Neurosci. 2000;20:3761–3775. doi: 10.1523/JNEUROSCI.20-10-03761.2000. [DOI] [PMC free article] [PubMed] [Google Scholar]
- Green DM, Swets JA. Signal detection theory and psychophysics. New York: Wiley; 1966. [Google Scholar]
- Guić-Robles E, Valdivieso C, Guajardo G. Rats can learn a roughness discrimination using only their vibrissal system. Behav Brain Res. 1989;31:285–289. doi: 10.1016/0166-4328(89)90011-9. [DOI] [PubMed] [Google Scholar]
- Guić-Robles E, Jenkins WM, Bravo H. Vibrissal roughness discrimination is barrelcortex-dependent. Behav Brain Res. 1992;48:145–152. doi: 10.1016/s0166-4328(05)80150-0. [DOI] [PubMed] [Google Scholar]
- Haker S, Wells WM, 3rd, Warfield SK, Talos IF, Bhagwat JG, Goldberg-Zimring D, Mian A, Ohno-Machado L, Zou KH. Combining classifiers using their receiver operating characteristics and maximum likelihood estimation. Med Image Comput Comput Assist Interv. 2005;8:506–514. doi: 10.1007/11566465_63. [DOI] [PMC free article] [PubMed] [Google Scholar]
- Harris JA, Petersen RS, Diamond ME. Distribution of tactile learning and its neural basis. Proc Natl Acad Sci U S A. 1999;96:7587–7591. doi: 10.1073/pnas.96.13.7587. [DOI] [PMC free article] [PubMed] [Google Scholar]
- Hung CP, Kreiman G, Poggio T, DiCarlo JJ. Fast readout of object identity from macaque inferior temporal cortex. Science. 2005;310:863–866. doi: 10.1126/science.1117593. [DOI] [PubMed] [Google Scholar]
- Ince RA, Senatore R, Arabzadeh E, Montani F, Diamond ME, Panzeri S. Information-theoretic methods for studying population codes. Neural Netw. 2010;23:713–727. doi: 10.1016/j.neunet.2010.05.008. [DOI] [PubMed] [Google Scholar]
- Jadhav SP, Wolfe J, Feldman DE. Sparse temporal coding of elementary tactile features during active whisker sensation. Nat Neurosci. 2009;12:792–800. doi: 10.1038/nn.2328. [DOI] [PubMed] [Google Scholar]
- Kampa BM, Roth MM, Göbel W, Helmchen F. Representation of visual scenes by local neuronal populations in layer 2/3 of mouse visual cortex. Front Neural Circuits. 2011;5:18. doi: 10.3389/fncir.2011.00018. [DOI] [PMC free article] [PubMed] [Google Scholar]
- Kerr JN, de Kock CP, Greenberg DS, Bruno RM, Sakmann B, Helmchen F. Spatial organization of neuronal population responses in layer 2/3 of rat barrel cortex. J Neurosci. 2007;27:13316–13328. doi: 10.1523/JNEUROSCI.2210-07.2007. [DOI] [PMC free article] [PubMed] [Google Scholar]
- Ko H, Hofer SB, Pichler B, Buchanan KA, Sjöström PJ, Mrsic-Flogel TD. Functional specificity of local synaptic connections in neocortical networks. Nature. 2011;473:87–91. doi: 10.1038/nature09880. [DOI] [PMC free article] [PubMed] [Google Scholar]
- Koch C. Biophysics of computation: information processing in single neurons. New York: Oxford UP; 1999. [Google Scholar]
- Kremer Y, Léger JF, Goodman D, Brette R, Bourdieu L. Late emergence of the vibrissa direction selectivity map in the rat barrel cortex. J Neurosci. 2011;31:10689–10700. doi: 10.1523/JNEUROSCI.6541-10.2011. [DOI] [PMC free article] [PubMed] [Google Scholar]
- Lottem E, Azouz R. Dynamic translation of surface coarseness into whisker vibrations. J Neurophysiol. 2008;100:2852–2865. doi: 10.1152/jn.90302.2008. [DOI] [PubMed] [Google Scholar]
- Lottem E, Azouz R. Mechanisms of tactile information transmission through whisker vibrations. J Neurosci. 2009;29:11686–11697. doi: 10.1523/JNEUROSCI.0705-09.2009. [DOI] [PMC free article] [PubMed] [Google Scholar]
- Mazor O, Laurent G. Transient dynamics versus fixed points in odor representations by locust antennal lobe projection neurons. Neuron. 2005;48:661–673. doi: 10.1016/j.neuron.2005.09.032. [DOI] [PubMed] [Google Scholar]
- Meyers EM, Freedman DJ, Kreiman G, Miller EK, Poggio T. Dynamic population coding of category information in inferior temporal and prefrontal cortex. J Neurophysiol. 2008;100:1407–1419. doi: 10.1152/jn.90248.2008. [DOI] [PMC free article] [PubMed] [Google Scholar]
- Montani F, Ince RA, Senatore R, Arabzadeh E, Diamond ME, Panzeri S. The impact of high-order interactions on the rate of synchronous discharge and information transmission in somatosensory cortex. Philos Transact A Math Phys Eng Sci. 2009;367:3297–3310. doi: 10.1098/rsta.2009.0082. [DOI] [PubMed] [Google Scholar]
- Morita T, Kang H, Wolfe J, Jadhav SP, Feldman DE. Psychometric curve and behavioral strategies for whisker-based texture discrimination in rats. PLoS One. 2011;6:e20437. doi: 10.1371/journal.pone.0020437. [DOI] [PMC free article] [PubMed] [Google Scholar]
- Nikolić D, Häusler S, Singer W, Maass W. Distributed fading memory for stimulus properties in the primary visual cortex. PLoS Biol. 2009;7:e1000260. doi: 10.1371/journal.pbio.1000260. [DOI] [PMC free article] [PubMed] [Google Scholar]
- O'Connor DH, Peron SP, Huber D, Svoboda K. Neural activity in barrel cortex underlying vibrissa-based object localization in mice. Neuron. 2010;67:1048–1061. doi: 10.1016/j.neuron.2010.08.026. [DOI] [PubMed] [Google Scholar]
- Ohki K, Reid RC. Specificity and randomness in the visual cortex. Curr Opin Neurobiol. 2007;17:401–407. doi: 10.1016/j.conb.2007.07.007. [DOI] [PMC free article] [PubMed] [Google Scholar]
- Ohki K, Chung S, Ch'ng YH, Kara P, Reid RC. Functional imaging with cellular resolution reveals precise micro-architecture in visual cortex. Nature. 2005;433:597–603. doi: 10.1038/nature03274. [DOI] [PubMed] [Google Scholar]
- Panzeri S, Diamond ME. Information carried by population spike times in the whisker sensory cortex can be decoded without knowledge of stimulus time. Front Synaptic Neurosci. 2010;2:17. doi: 10.3389/fnsyn.2010.00017. [DOI] [PMC free article] [PubMed] [Google Scholar]
- Panzeri S, Schultz SR, Treves A, Rolls ET. Correlations and the encoding of information in the nervous system. Proc R Soc Lond B Biol Sci. 1999;266:1001–1012. doi: 10.1098/rspb.1999.0736. [DOI] [PMC free article] [PubMed] [Google Scholar]
- Panzeri S, Senatore R, Montemurro MA, Petersen RS. Correcting for the sampling bias problem in spike train information measures. J Neurophysiol. 2007;98:1064–1072. doi: 10.1152/jn.00559.2007. [DOI] [PubMed] [Google Scholar]
- Petersen CC. The functional organization of the barrel cortex. Neuron. 2007;56:339–355. doi: 10.1016/j.neuron.2007.09.017. [DOI] [PubMed] [Google Scholar]
- Petersen RS, Diamond ME. Spatial-temporal distribution of whisker-evoked activity in rat somatosensory cortex and the coding of stimulus location. J Neurosci. 2000;20:6135–6143. doi: 10.1523/JNEUROSCI.20-16-06135.2000. [DOI] [PMC free article] [PubMed] [Google Scholar]
- Petersen RS, Panzeri S, Diamond ME. Population coding of stimulus location in rat somatosensory cortex. Neuron. 2001;32:503–514. doi: 10.1016/s0896-6273(01)00481-0. [DOI] [PubMed] [Google Scholar]
- Petersen RS, Panzeri S, Diamond ME. Population coding in somatosensory cortex. Curr Opin Neurobiol. 2002a;12:441–447. doi: 10.1016/s0959-4388(02)00338-0. [DOI] [PubMed] [Google Scholar]
- Petersen RS, Panzeri S, Diamond ME. The role of individual spikes and spike patterns in population coding of stimulus location in rat somatosensory cortex. Biosystems. 2002b;67:187–193. doi: 10.1016/s0303-2647(02)00076-x. [DOI] [PubMed] [Google Scholar]
- Petersen RS, Panzeri S, Maravall M. Neural coding and contextual influences in the whisker system. Biol Cybern. 2009;100:427–446. doi: 10.1007/s00422-008-0290-5. [DOI] [PubMed] [Google Scholar]
- Prigg T, Goldreich D, Carvell GE, Simons DJ. Texture discrimination and unit recordings in the rat whisker/barrel system. Physiol Behav. 2002;77:671–675. doi: 10.1016/s0031-9384(02)00917-4. [DOI] [PubMed] [Google Scholar]
- Quiroga RQ, Kreiman G, Koch C, Fried I. Sparse but not ‘grandmother-cell’ coding in the medial temporal lobe. Trends Cogn Sci. 2008;12:87–91. doi: 10.1016/j.tics.2007.12.003. [DOI] [PubMed] [Google Scholar]
- Ritt JT, Andermann ML, Moore CI. Embodied information processing: vibrissa mechanics and texture features shape micromotions in actively sensing rats. Neuron. 2008;57:599–613. doi: 10.1016/j.neuron.2007.12.024. [DOI] [PMC free article] [PubMed] [Google Scholar]
- Rothschild G, Nelken I, Mizrahi A. Functional organization and population dynamics in the mouse primary auditory cortex. Nat Neurosci. 2010;13:353–360. doi: 10.1038/nn.2484. [DOI] [PubMed] [Google Scholar]
- Sato TR, Gray NW, Mainen ZF, Svoboda K. The functional microarchitecture of the mouse barrel cortex. PLoS Biol. 2007;5:e189. doi: 10.1371/journal.pbio.0050189. [DOI] [PMC free article] [PubMed] [Google Scholar]
- Shamir M, Sompolinsky H. Implications of neuronal diversity on population coding. Neural Comput. 2006;18:1951–1986. doi: 10.1162/neco.2006.18.8.1951. [DOI] [PubMed] [Google Scholar]
- Sompolinsky H, Yoon H, Kang K, Shamir M. Population coding in neuronal systems with correlated noise. Phys Rev E Stat Nonlin Soft Matter Phys. 2001;64 doi: 10.1103/PhysRevE.64.051904. 051904. [DOI] [PubMed] [Google Scholar]
- Stopfer M, Jayaraman V, Laurent G. Intensity versus identity coding in an olfactory system. Neuron. 2003;39:991–1004. doi: 10.1016/j.neuron.2003.08.011. [DOI] [PubMed] [Google Scholar]
- von Heimendahl M, Itskov PM, Arabzadeh E, Diamond ME. Neuronal activity in rat barrel cortex underlying texture discrimination. PLoS Biol. 2007;5:e305. doi: 10.1371/journal.pbio.0050305. [DOI] [PMC free article] [PubMed] [Google Scholar]
- Wilke SD, Eurich CW. Representational accuracy of stochastic neural populations. Neural Comput. 2002;14:155–189. doi: 10.1162/089976602753284482. [DOI] [PubMed] [Google Scholar]
- Wolfe J, Hill DN, Pahlavan S, Drew PJ, Kleinfeld D, Feldman DE. Texture coding in the rat whisker system: slip-stick versus differential resonance. PLoS Biol. 2008;6:e215. doi: 10.1371/journal.pbio.0060215. [DOI] [PMC free article] [PubMed] [Google Scholar]
- Zohary E, Shadlen MN, Newsome WT. Correlated neuronal discharge rate and its implications for psychophysical performance. Nature. 1994;370:140–143. doi: 10.1038/370140a0. [DOI] [PubMed] [Google Scholar]
- Zuo Y, Perkon I, Diamond ME. Whisking and whisker kinematics during a texture classification task. Philos Trans R Soc Lond B Biol Sci. 2011;366:3058–3069. doi: 10.1098/rstb.2011.0161. [DOI] [PMC free article] [PubMed] [Google Scholar]