Abstract
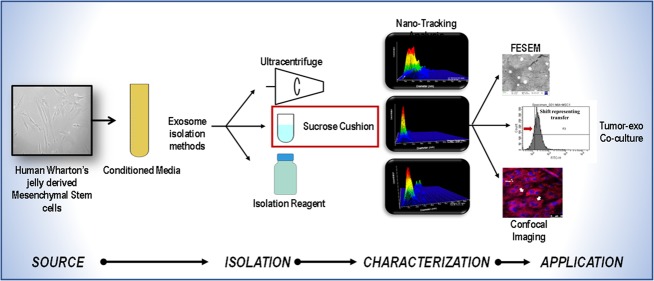
Cell-derived exosomes (30–200 nm) as biological “nanocarriers” have attracted a great deal of interest for therapeutic applications due to their ability to internalize in in vivo biological systems (i.e., cells). Although they can be harvested from various sources including stem cells, yet an appropriate isolation and characterization protocol to obtain “pure” exosomal population is needed. For potential clinical applications, understanding the functional ability of exosomes and their purity, that is, free from microvesicles, apoptotic bodies, and protein aggregates, is a pre-requisite. To achieve high purity and yield of exosomes from human Wharton’s jelly-derived mesenchymal stem cells (hWJ-MSCs) in the size range of 30–200 nm, we have performed and compared three isolation procedures: ultracentrifugation (UC), sucrose cushion (SC), and commercially available reagent (CR). The isolated exosomes were characterized using nanoparticle tracking analysis (NTA), field emission scanning electron microscopy (FESEM), and atomic force microscopy (AFM). Furthermore, to understand the therapeutic potential of the hWJ-MSC-derived exosomes (hWJ-ME) to target pancreatic tumor cells, the internalization efficacy has been evaluated on the MiaPaCa-2 cell lines using confocal microscopy and flow cytometry. The NTA results showed sucrose cushion to be an optimal method for exosome isolation with high purity (86.8%), as compared to UC (40.5%; p = 0.050) and CR (38%; p = 0.050). Optical analysis by FESEM and AFM revealed that SC-isolated exosomes presented a spherical morphology, whereas UC- and CR-isolated exosomes exhibited an uneven morphology. Furthermore, the data from confocal images and flow cytometry showed that hWJ-ME were internalized by MiaPaCa-2, demonstrating the feasibility of exosomes as a “potential nanocarrier”. Thus, our study suggests that a combination of NTA (yield), AFM (dimensions), and FESEM (morphology and topography) could provide sensitive biophysical characterization of hWJ-ME. In the future, enriched exosomes could be used as a delivery vehicle to transport target-specific drugs or gene-silencing constructs to tumors.
1. Introduction
Intercellular communication relies on basic biochemical cues that are essential for mechanistic action of various biological processes in the cell. Cross-talk among the cells through the microenvironment is vital for the survival, proliferation, and regulation of inter- and intra-cellular processes. The cellular microenvironment is highly complex consisting of hormones, cytokines, growth factors, extracellular matrix, cellular vesicles, and many more.1 Among these, cell-derived vesicles are an important constituent of the cellular microenvironment, playing a crucial role in intracellular communication and trafficking.2
Cell-derived extracellular vesicles (EVs) such as exosomes, microvesicles, and apoptotic bodies have been subcategorized based on their size and composition, as shown in Figure 1. Exosomes, originating from endocytic compartments of biological cells, inherit cell (parent)-specific proteins, which could be harvested for developing novel therapeutic modalities.3 Exosomes are made up of lipid bilayers, which consist of RNA and functional miRNA that could be used in targeted therapies.4 Apart from their nanoscale size (30–200 nm), exosomes have the advantage of not only being able to activate the host immune system due to its highly immunogenic surface receptors but are also less toxic to the host, compared to their bioengineered counterparts, that is, nanoparticles such as liposomes.5,6 These bio-nanoparticles exhibit clinical potential both in diagnostics as a predictive biomarker, and in therapeutics as a drug delivery vehicle.7 More recently, cell-derived exosomes used as delivery vehicles have shown promising results in cancer treatment, as compared to conventional (chemotherapy) and somatic adult stem cell therapies.8−10
Figure 1.
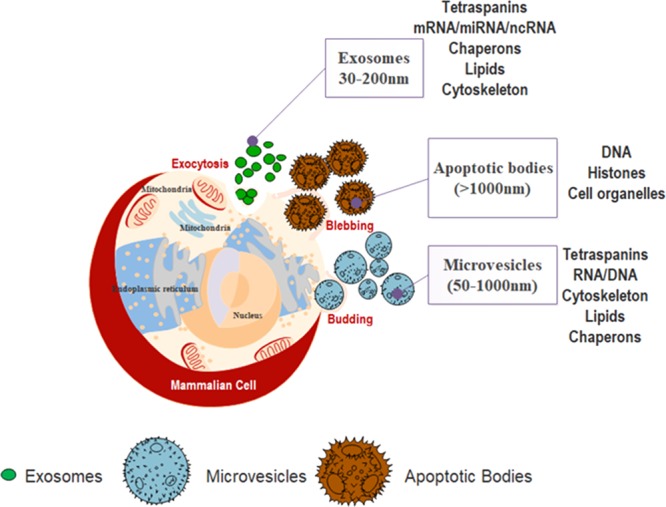
Schematic representation of origin, composition, and size range of extracellular vesicles (EVs): exosomes, microvesicles, and apoptotic bodies. All mammalian cells secrete extracellular vesicles, exosomes (30–200 nm), microvesicles (50–1000 nm), and apoptotic bodies (>1000 nm) in the cell microenvironment. The contents of exosomes are tetraspanins, mRNA/RNA/scRNA, chaperons, lipids, and cytoskeleton, many of which are found in microvesicles (i.e., tetraspanins, RNA, chaperons, lipids, and cytoskeleton proteins). Apoptotic bodies consist of DNA, histones, and cell organelles.
In recent years, stem cell-derived exosomes have been reported to be efficient drug delivery vehicles, owing to their homing capabilities toward inflammation sites.11,12 Mesenchymal stem cells (MSCs), isolated from umbilical cord and adipose tissue, are being extensively studied as an alternative to embryonic stem cells. The varied sources of MSC have shown differential effects on tumor progression,13−16 which implies that the parent source of exosomes is an important factor to be considered for development of therapeutic interventions since their functional/biological properties largely rely on its origin. Recent evidence has also suggested inhibitory effects of MSCs on cancer cells through suppression of immune response and induction of apoptosis.17,18 Sources such as bone marrow (BM) and adipose tissue are donor-dependent, invasive procedures; thus, environmental factors such as usage of drugs during the lifetime and age may influence the quality, viability, and characteristics of these MSCs. Therefore, there is a need to identify a source of MSCs, which can provide exosomes that can be harvested efficiently and can be scaled up for mass production. Among the different sources, Wharton’s jelly-derived MSCs (WJ-MSCs) are comparatively less studied but can be an ideal source for a large quantity of MSCs.19 The isolation of WJ-MSCs from naïve umbilical cord tissues has minimal ethical concerns being a non-invasive technique with minimal risk to the donor and further can be scaled up in vitro for mass production of the cells and exosomes. Moreover, WJ-MSCs have shown a better myogenic potential, engraftment properties, unaltered chromosomal changes (karyotyping), low immunogenicity, and higher proliferative capabilities when compared to other sources.20,21
Although exosomes have exhibited novel and improved opportunities in diagnostics and treatment modalities of cancer and other complex diseases, their isolation protocols and characterization are still ambiguous.22
In the present study, we aim to standardize the protocol for efficient isolation of hWJ-ME through biophysical characterization using nanoparticle tracking analysis (NTA), field emission scanning electron microscopy (FESEM), and atomic force microscopy (AFM). Three different isolation methods, that is, ultracentrifugation (UC), sucrose cushion (SC), and total exosome isolation commercial reagent (CR), have been used and compared on this basis. The results indicate that SC is more efficient compared to commonly used UC. In addition, these exosomes were shown to successfully internalize into the MiaPaCa-2 cell line. Thus, showing that, hWJ-MSC-derived exosomes could be a valuable drug delivery vehicle or “nanocarrier” with a putative role in cancer and other human diseases.
2. Results
2.1. Characterization of hWJ-MSCs
We characterized the hWJ-MSCs that were cryopreserved from three independent adult donors (18–35 years old) (Figure 2A). Their osteocytic and adipocytic differential potentials were verified by staining with Alizarin S and Oil red (Figure 2B). The analysis of hWJ-MSCs was performed using flow cytometry to evaluate the expression of surface markers as per ISCT (International Society for Cellular Therapy) guidelines. The results showed positive expression of CD105 (83 ± 1.3%), CD90 (95.7 ± 1.4%), CD73 (95.5 ± 1.3%), and CD44 (93.7 ± 1.25%) and a negative expression for CD34 (3.2 ± 1.1%), CD14 (2.6 ± 1.3%), HLA-DR (1.7 ± 1.3%), and CD19 (3.5 ± 1.2%) (Figure 2C,D). The MSCs were karyotyped to assess chromosomal integrity (Figure 2E). All results confirmed that the MSCs had phenotypic and multilineage capacity as per the guidelines.
Figure 2.
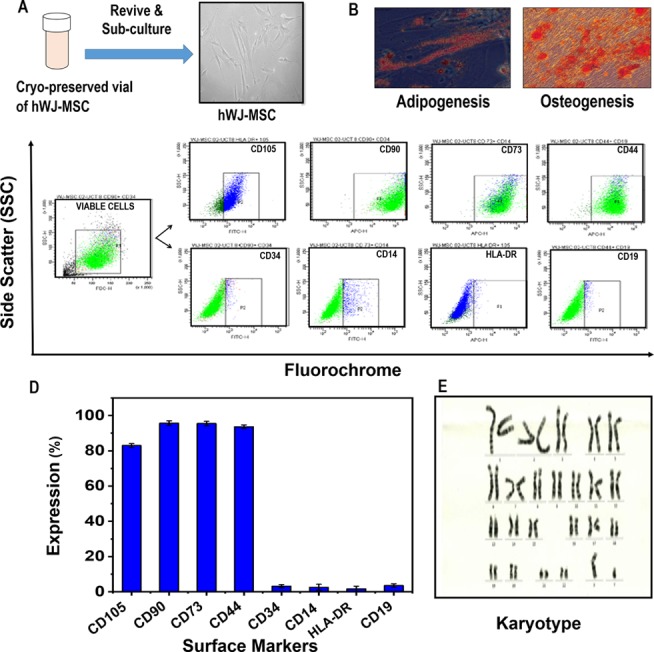
Characterization of hWJ-MSCs. (A) Morphology of hWJ-MSCSs revived from a cryopreserved vial, (B) differentiation potential, (C) representative graphs of flow cytometric analysis (CD105, CD73, CD90, CD44, CD34, CD19, CD14, and HLA-DR), (D) expression of MSC surface markers, and (E) karyotyping.
2.2. Comparative Evaluation of Exosomes Purified from Three Different Isolation Methods Using Nanoparticle Tracking Analysis
Exosomes from human Wharton’s jelly-derived MSCs were purified using UC, SC, and CR. Evaluation of the size and concentration of exosomes obtained from all three isolation methods was done using NTA and is shown in Figure 3. Figure 3A shows the exosomal size and concentration observed in NTA analysis for the three isolation methods (UC, SC, and CR) represented in 3D and 2D graphics, and Figure 3B represents their comparative distribution cumulatively. A heterogeneous population of vesicle particulate with broad size variation (multiple peaks) was observed in UC-exosomal isolate, as revealed by the distinct peaks shown in Figure 3A1. The presence of a single peak (30–200 nm) as shown in Figure 3A2 presented a homogeneous and narrow sized distribution of exosomes in the SC method. The CR method showed multiple narrow peaks, ranging from 30−300 nm as compared to UC method (Figure 3A3). The data shown in Figure 3A has been summarized in Table 1, representing their total concentration, mean size, and detection threshold values.
Figure 3.
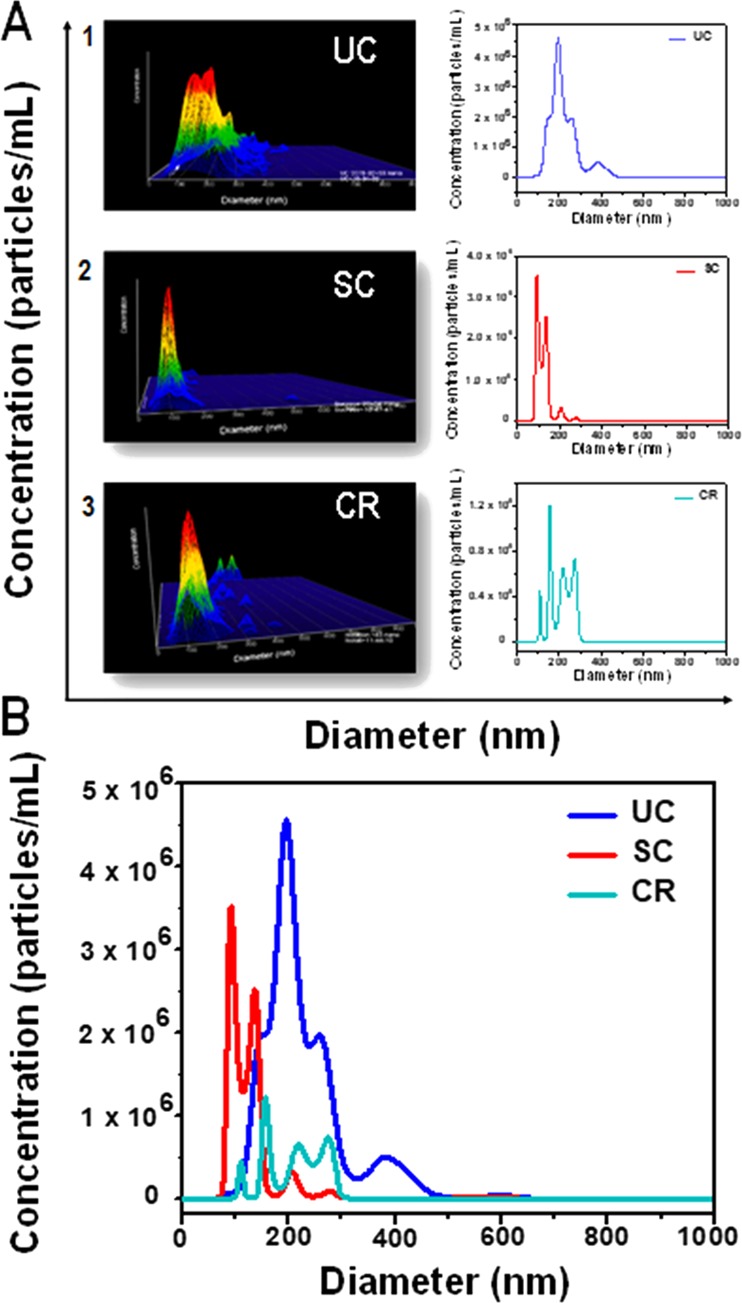
(A) Representative graphs (in 3D and 2D) of hWJ-MSC-derived exosomes (0–1000 nm) separated by ultracentrifugation (UC), sucrose cushion (SC), and commercial reagent (CR) methods using nanoparticle tracking analysis (NTA) and (B) cumulative size distribution profiles of UC, SC, and CR.
Table 1. Total Concentration, Mean, and Detection Threshold of Particles within the 0–1000 nm Size Range Identified Using the NTA 3.3 Software.
| 0–1000 nm | UC | SC | CR |
|---|---|---|---|
| concentration (particles/mL) | 1.36 × 10⁹ | 0.8 × 10⁹ | 0.28 × 10⁹ |
| mean size (nm) | 220.2 | 170.9 | 186.8 |
| detection threshold | 5 | 5 | 5 |
Table 2 shows the pure exosome population in a size cutoff range of 30–200 nm obtained from NTA using the NTAv3.3 software. The three methods, that is, SC, CR, and UC, revealed 86.8 ± 8.2% (0.65 × 10⁹ particles/mL), 37.8 ± 7.1% (0.22 × 10⁹ particles/mL), and 40.5 ± 2.6% (0.52 × 10⁹ particles/mL) exosomes (concentration), respectively, within the specified size range of 30–200 nm. The percentage of exosomes isolated by each method is further represented in a pie chart as shown in Figure 4.
Table 2. Comparison of Concentration and Percentage of Exosomes (30–200 nm Size) Obtained among the Three Methods (UC, SC, and CR).
| 30–200 nm | UC | SC | CR |
|---|---|---|---|
| concentration (particles/mL) | 0.52 × 10⁹ | 0.65 × 10⁹ | 0.22 × 10⁹ |
| no. of exosomes (in %) | 40.5 ± 2.6 | 86.8 ± 8.2 | 37.8 ± 7.1 |
Figure 4.

Pie chart representing number of exosomes (30–200 nm) purified from the total yield of UC, SG, and CR isolation methods using the NTA 3.3 software.
The exosomes isolated from three isolation techniques were quantified using NTA. The sucrose cushion method yielded 45%, commercial reagent yielded 31%, and ultracentrifugation yielded 28% of exosomes in the size range of 30–200 nm.
2.3. Identification of Exosomal Population Using CD9
To validate the biological origin of exosomes, it is imperative to ascertain the presence of specific biomolecules (i.e., tetraspanins), which are responsible for functional activities related to migration, fusion, and signaling. A study has reported tetraspanins such as CD9, CD63, and CD81 present on endocytic membranes as exosomal biomarkers.26 A recent report has suggested that CD9 present on the exosomal surface plays a major role in intercellular communication via its fusion with the host cell membrane.27 This could be used as a marker for identification of exosomes within a mixture of extracellular vesicles. In the present study, CD9 has been used to examine the purity of exosomes isolated from the three methodologies, that is, UC, SC, and CR, using NTA. CD9 was labeled with the fluorophore BV510, which was detected in real time under the light scattering mode using a 532 nm filter.
Figure 5 represents the fluorescence of BV510-labeled anti-CD9 bound to the hWJ-ME surface of the 30–200 nm size range. The exosomes isolated using UC represented 26.4% of the total, presenting peaks at 37 and 105 nm (Figure 5A). CR showed 68.8% CD9 positivity, presenting multiple signals at 34, 98, and 152 nm (Figure 5C), whereas the SC method showed a 100% CD9 expression at 30 and 90 nm only (Figure 5B).
Figure 5.
Expression of CD9 using fluorescence NTA in exosomes isolated from (A) ultracentrifugation, (B) sucrose cushion, and (C) commercial reagent.
2.4. Field Emission Scanning Electron Microscopy and Atomic Force Microscopy
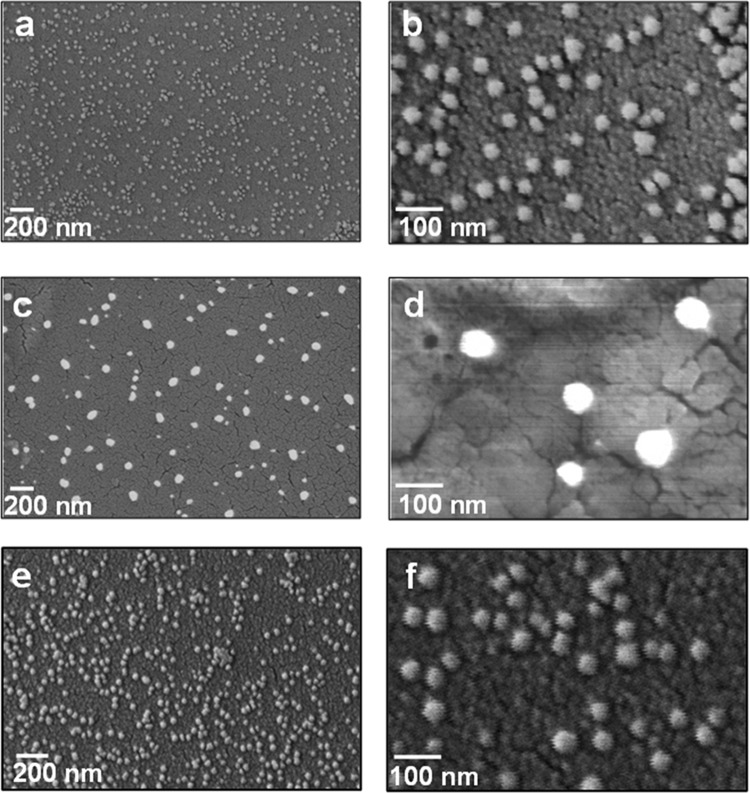
The morphological aspects of hWJ-ME were investigated using FESEM and AFM. Figure 6 revealed FESEM images of hWJ-ME obtained from UC (Figure 6a,b), SC (Figure 6c,d), and CR (Figure 6e,f) at different scales. The appearance of nearly spherical vesicles (∼30–80 nm diameter) without a central deformation, isolated using UC, SC, and CR, respectively, has been corroborated by Sharma et al.28 The difference in exosomal size obtained using NTA (30–200 nm) and FESEM (30-80 nm) is attributed to the fact that NTA measures the hydrodynamic size in the solution unlike the defined boundary structure analysis as by FESEM.29Figure 6d (a higher magnification image) reveals that the SC method shows a narrower size distribution of isolated exosomes, which is akin to the NTA observations (Figure 3).
Figure 6.
FESEM images of hWJ-ME derived from (a, b) UC, (c, d) SC, and (e, f) CR methods at different magnifications.
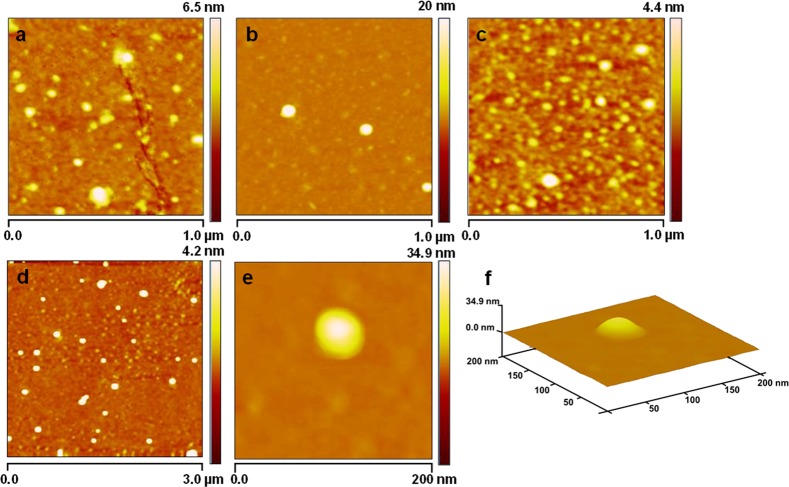
Furthermore, the three-dimensional structure and subvesicular organization of purified hWJ-ME were analyzed using atomic force microscopy in tapping mode.30Figure 7 shows the morphology of hWJ-ME purified using UC, SC, and CR methods. The appearance of hWJ-ME of varying sizes in Figures 7a and 7c corresponds to the presence of different sizes of hWJ-ME purified from UC and CR, respectively. On the other hand, Figure 7b shows a narrow size distribution of hWJ-ME purified using SC. These observations are corroborated by FESEM and NTA analysis. Furthermore, to investigate the size distribution and homogeneous nature of the hWJ-ME purified from the SC method and subvesicular organization of a single isolated vesicle, we have analyzed their morphology by scanning a larger area (3 μm) at 200 nm magnification. Figure 7d reveals fairly homogeneous and nearly spherical hWJ-ME purified by SC with a narrow size distribution of 30–80 nm without any apparent intervesicular fusion or aggregation. Furthermore, Figure 7e,f depicts the morphology of a single hWJ-ME isolated by SC.
Figure 7.
Morphological and substructural organization of hWJ-ME isolated by UC, SC, and CR using atomic force microscopy. (a–c) Morphology of hWJ-ME derived from UC, SC, and CR, respectively. (d) Narrow size distribution (30–80 nm) of the hWJ-ME purified by SC without apparent intervesicular fusion over a 3 μm area scan. (e, f) Substructural organization of a single hWJ-ME isolated using SC.
2.5. Internalization of hWJ-ME in MiaPaCa-2 Cells
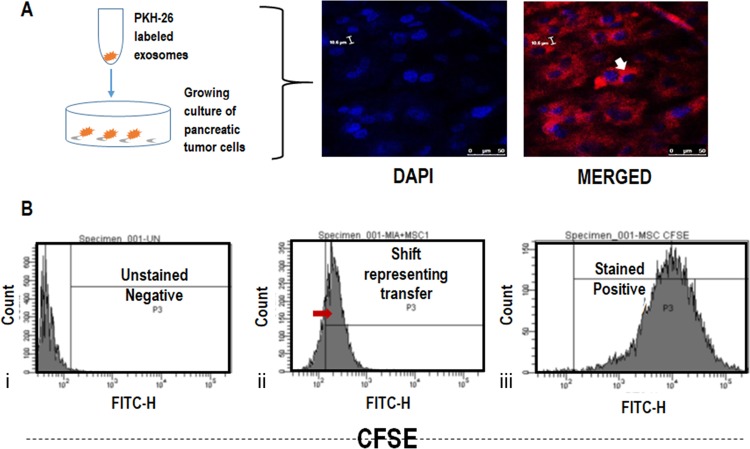
MSCs have shown therapeutic potential and hold large opportunities in the future.31 Apart from stem cell therapies, stem cell-derived exosomes are being considered as prospective candidates for cancer treatment. It is thus important to understand their interaction with different tumor types. For this reason, we have performed co-culture experiments using PKH26-labeled exosomes seeded on MiaPaCa-2 cells and observed using confocal microscopy (Figure 8A). It was observed that PKH26-labeled exosomes (562 nm) surrounded the nucleus (DAPI-stained) of MiaPaCa-2 cells.
Figure 8.
(A) Migration of hWJ-MSC exosomes (PKH26-stained) to the nucleus (DAPI-stained) of MiaPaCa-2 cells observed by confocal microscopy. (B) Intracellular uptake of CFSE-labeled hWJ-ME by MiaPaCa-2 cells. (i) Unstained tumor cells (ii) MSC-tumor co-culture, and (iii) CFSE-labeled MSCs.
Furthermore, to understand the migration/transfer of exosomes from MSCs to the surrounding cells (pancreatic tumor cells), unlabeled MiaPaCa-2 cells were co-cultured with MSCs labeled with the intracellular dye CFSE (FITC) and incubated for 48 h. The transfer of CFSE-labeled hWJ-ME was studied using flow cytometry. A shift in the fluorescence (FITC) showed that dye transfer took place from the labeled MSC cells to unlabeled MiaPaCa-2 cells (Figure 8B). Since CFSE is an intracellular dye, a passive transfer of dye seems unlikely. The result indicates that exosomes released from the CFSE-MSCs may have transfected the tumor cells, thereby generating an FITC signal. This experiment demonstrates the capacity of MSCs or their derivatives (exosomes) to target the pancreatic tumor cells, probably via MSC exosomal interactions.
3. Discussion
Extracellular vesicles in the size range of 30–200 nm, classified as exosomes, have exhibited immense potential in therapeutic and diagnostic applications. Earlier reports about the potential functions of EVs have not been conclusive; however, with extensive progress, it is being observed that exosomes are far more complex than originally thought.32 The multifunctionality of exosomes is attributed to their size, content, and representation of the parent cell. Although exosomes have many potential applications, a standardized protocol for their isolation and characterization is still lacking.
In the present study, we have attempted to identify an efficient exosome isolation method of hWJ-MSCs using three different techniques, that is, UC, SC, and CR. Literature reports UC as the most common isolation technique, but high-speed centrifugation results in loss of viable exosomes and other constituents of EVs.33,34 Isolation of exosomes using CR is limited due to high costs related to its implementation in mass production and poor purification performance, allowing the presence of contaminants such as proteins and polymeric materials.35 To overcome these limitations, addition of a sucrose cushion during ultracentrifugation can segregate the EVs based on their flotation densities, size, and prevent the cell membrane rupture resulting from high centrifugal forces.36 To optimize the isolation efficacy of hWJ-ME, UC and SC methods were compared with CR on the basis of size and morphology obtained by NTA, FESEM, and AFM. Our findings based on concentration, yield (NTA), and morphology (FESEM and AFM) suggest sucrose cushion as a high-efficiency extraction method to isolate hWJ-ME. Although transmission electron microscopy (TEM) is considered a gold standard for characterizing the morphology of exosomes, we show here that the combined use of FESEM and AFM is a viable characterization approach.35 In addition, the sample preparation procedure in TEM leads to dehydration of the exosomal membrane, which results in a cup-shaped morphology (flattened spheres). In contrast, using FESEM and AFM allows exosomes to retain their spherical morphology and hydration while being imaged. FESEM imaging revealed that SC-isolated exosomes (30–80 nm) have a round and uniform morphology with unimodal distribution. AFM results revealed homogeneous spherical hWJ-MEs without any apparent intervesicular fusion or aggregation using SC. These spherical vesicles showed a round bulging morphology with an intense core region that may correspond to the presence of proteins and mRNA.29 On the other hand, cell fractions obtained from UC and CR showed the presence of other EV constituents, representing a heterogeneous size population.
NTA technology offers relatively faster acquisition of size and concentration of exosomes while providing a real-time visualization than other methodologies such as dynamic light scattering (DLS) and flow cytometry. Since the technique captures the scattering light and particles under Brownian motion, it is easy to derive the polydispersity information of the sample. Additionally, NTA provides the hydrodynamic size of unaltered vesicles and does not require any harsh sample preparation that can change the morphology of the exosomes. The recent advances in flow cytometry permit analysis of particles sized <30 nm,37 but the technology cannot accurately quantify exosomes as the quantification is based on the reference beads, thus reducing its sensitivity. The capacity of NTA to predict the size and concentration of extracellular vesicles and their subtypes (exosomes) could be exploited to a greater extent by quantifying the differential concentration in normal and diseased/inflammatory conditions.
Exosomes carry specific markers from their parent cell and thus could possess properties similar to their source. These markers could become a double-edged sword as they could be used both for diagnostics and therapeutic purposes.38−40 Current methodologies, such as Western blotting and flow cytometry, for identification of exosomes are cumbersome and ambiguous. Several reports have shown characterization of exosomes by immunophenotyping (CD63/CD81/CD9), with surface marker expression pattern being less than 50%.27,28 Such low expression levels could be related to the fact that the exosomal yield from the standard isolation protocols consist of particles that are outside the exosomal size range (as per our data). The presence of exosomal surface biomarkers provides an edge to characterize them according to their size distribution using fluorescent NTA technology, which may prove to be an ideal and real-time alternative to current techniques, allowing ease in operation and analysis.41,42 In the present study, the CD9-labeled exosomes were investigated using fluorescent NTA, and the expression pattern was based on size and concentration alone. It was observed that exosomes isolated using SC highly expressed the CD9 protein. This supports our results using FESEM and AFM, showing hWJ-ME enrichment.
Furthermore, the cellular uptake and internalization of hWJ-ME by pancreatic cancer cell line MiaPaCa-2 confirmed the therapeutic potential of hWJ-ME to target cancer cells; however, more detailed studies are required to establish this. From a therapeutic standpoint, MSCs are one of the most promising candidates for exosome production.43 Exosomes derived from MSCs have the capability of immune modulation, and their ability to migrate to the inflammatory site makes them desirable for therapeutic application.
In addition, MSC-derived exosomes possess the intracellular communication ability. MSC exosomes can act as a nanocargo to transfer diverse components such as DNA/RNA/miRNA/siRNA and drugs.44,45 Furthermore, the changes in the membrane composition of MSC exosomes due to the activation/inactivation status of the cell results in differential functional abilities, altering the cellular pathway of the recipient cells.46 Thus, hWJ-ME can be used as potential nanovehicles to deliver biomolecules such as miRNA/siRNA and chemodrugs. Munoz et al.46 also showed that functional anti-miR9 could be delivered by MSC exosomes to confer chemosensitivity to glioblastoma multiforme cells (U87 and T98G cells), suggesting that exosomes act via the gap junctional intercellular communication. Pascucci et al.47 showed the antitumorigenic efficacy of chemotherapeutic drug (i.e., paclitaxel) release in pancreatic cancer cell line CFPAC-1 by MSC exosomes. Similarly, in the present study, the internalization of CFSE-labeled hWJ-ME in MiaPaCa-2 tumor cells demonstrates the capability of hWJ-ME to interact with the tumor cells. Detailed studies are still required to explore the real potential of exosomes in cancer therapeutics.
4. Conclusions
We have successfully isolated viable exosomes with increased yield and homogeneity from hWJ-MSCs. NTA results showed SC to be the best method for exosome isolation with high purity (86.8%) as compared to UC (40.5%; p = 0.050) and CR (38%; p = 0.050). Furthermore, high levels of CD9 expression of hWJ-ME isolated through SC confirm the exosomal purity. It is evident from our study that a combinational approach of NTA, FESEM, and AFM can efficiently quantify and evaluate the size and morphology of exosomes. Furthermore, the flow cytometric analysis of hWJ-MSCs labeled with CFSE (intracellular dye) has shown internalization of exosomes into pancreatic tumor cells and suggesting functional ability of hWJ-ME to invade the tumor cells, as seen by confocal imaging. Thus, hWJ-ME show a great potential as nanocarriers to target tumor cells with high efficiency to deliver biomolecules such as miRNA/siRNA and chemodrugs.
5. Methodology
5.1. Human Wharton’s Jelly-Derived Mesenchymal Stem Cells
5.1.1. Subculturing of Human Wharton’s Jelly-Derived Mesenchymal Stem Cells (hWJ-MSCs)
MSCs were isolated from Wharton’s jelly of the umbilical cord after obtaining ethical clearance (reference no. ICSCR/14/3) and consent from healthy pregnant women undergoing normal child delivery. MSCs from three independent donors were collected, characterized, and cryopreserved.
The cryopreserved vials of hWJ-MSCs [passage 4 (P4)] were revived and expanded (P5). The cells were grown as monolayers in Dulbecco’s modified Eagle’s medium–low glucose (DMEM-LG, Thermo Fisher Scientific, Waltham, MA, USA) media supplemented with 20% fetal bovine serum (FBS, Biological Industries, Cromwell, CT, USA), 3% MEM Vitamins (Sigma-Aldrich, St. Louis, MO, USA), 3% MEM NEAA (Sigma-Aldrich, St. Louis, MO, USA), 3% GlutaMAX (Sigma-Aldrich, St. Louis, MO, USA), and 1% antibiotic–antimycotic (Sigma-Aldrich, St. Louis, MO, USA) solution and maintained in a 37 °C and 5% CO2 incubator. These MSCs were characterized for their differentiation capabilities (osteocytes and adipocytes) and surface markers (CD105+/CD90+/CD73+/CD45–/CD19–/HLA-DR–) (BD Biosciences, San Jose, CS, USA) as per International Society for Cellular Therapy (ISCT) guidelines.48
5.1.2. Collection of Conditioned Media
Cells were grown up to 70% confluency and washed once with Dulbecco’s phosphate buffer saline (DPBS; pH 7.0; Thermo Fisher Scientific, Waltham, MA, USA) followed by rinsing with DMEM-LG without FBS. The media was replaced by DMEM devoid of FBS, and cultures were grown for 48 h at 37 °C and 5% CO2. After 48 h, the medium was collected, hereafter referred to as conditioned medium (CM). The CM was pooled from 3xT-175 flasks and centrifuged at 300g for 5 min followed by 2000g for 30 min at room temperature (RT). Supernatant was filtered through a 0.22 μm membrane and stored at 4 °C for use within a week and/or stored at −80 °C for future experiments. A total of three independent patient-derived MSCs were used for collection of CM.
5.2. Exosome Isolation and Purification
We used three different isolation protocols to purify exosomes derived from hWJ-MSCs. All the methods were repeated independently in triplicates.
5.2.1. Ultracentrifugation Method (UC)
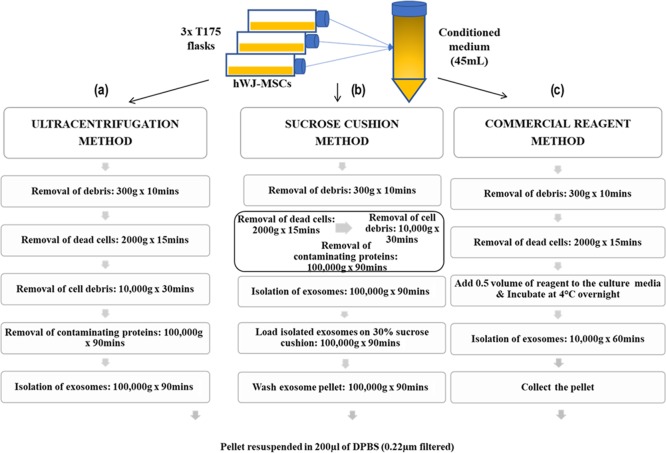
We have isolated hWJ-ME using a slightly modified protocol of Pospichalova et al.49 Briefly, 15 mL of pooled CM (as described in Section 5.1.2) was sequentially centrifuged at 10,000g for 30 min at 4 °C. The supernatant was again centrifuged at 100,000g for 90 min at 4 °C. The pellet obtained was resuspended in 0.22 μm filtered DPBS and again centrifuged at 100,000g for 90 min at 4 °C. The resulting pellet (exosomes) was resuspended in 200 μL of filtered DPBS, aliquoted, and stored at −80 °C for further experimentations; the same has been schematized in Figure 9a.
Figure 9.
Schematic representation of exosome isolation methods: (a) ultracentrifugation, (b) sucrose gradient, and (c) commercial reagent.
5.2.2. Sucrose Cushion Method (SC)
Figure 9b summarizes the protocol for isolating exosomes using sucrose that was adapted from Gupta et al.,50 with slight modifications. Briefly, CM was sequentially centrifuged at 10,000g for 30 min and 100,000g for 90 min and washed with DPBS at 100,000g for 90 min at 4 °C. The resuspended exosomes were layered on 1 mL of 30% sucrose solution and centrifuged at 100,000g for 90 min. The purified exosomes were collected from the sucrose-DPBS interphase and washed again with DPBS for 90 min at 100,000g. The resulting pellet was resuspended in 200 μL of DPBS, aliquoted, and stored at −80 °C for further experimentations.
5.2.3. Commercial Reagent (CR)
In addition to the previous methods, a commercially available total exosome isolation reagent (Thermo Fischer Scientific, Waltham, MA, USA) was used as per the manufacturer’s protocol. Briefly, 1:2 ratio (reagent/CM) was thoroughly mixed by pipetting and vortexing. This mixture was incubated at 4 °C overnight (i.e., 16 h) in a rotor shaker. After 16 h, the mixture was centrifuged at 10,000g for 60 min at 4 °C. The pellet obtained (exosomes) was resuspended in 200 μL of filtered DPBS, aliquoted, and stored at −80 °C for further experimentations, as depicted in Figure 9c.
5.3. Characterization of Exosomes
5.3.1. Nanoparticle Tracking Analysis (NTA)
The concentration and size distribution of exosomes were determined by nanoparticle tracking analysis (NTA) in a NanoSight (Malvern Instruments Ltd., Malvern, U.K.) NS300 system equipped with a high-sensitivity CMOS camera and a 405/532 nm laser. Diluted (1000-fold) fractions from each isolation method were acquired, and a 60 s video was recorded. Analysis was performed using the NTA 3.3 software (Malvern Instruments Ltd., Malvern, U.K.).
5.3.2. Enumeration of Fluorescence-Labeled Exosomes Using NTA
Exosomes were labeled with 1:100 diluted CD9-BV510 (mouse anti-human; BD Biosciences, San Jose, CA, USA) for 60 min at room temperature and vortexed intermittently. The labeled exosomes were then diluted (1:1000) in deionized water and acquired using the NanoSight. The camera level was maintained at 12 for the light scatter mode and 16 for the fluorescence scatter mode between samples. Videos of typically 60 s duration were taken, with a frame rate of about 30 frames/s. Analysis was performed using the NTA 3.3 software.
5.3.3. Atomic Force Microscopy (AFM)
The size, shape, and morphology of purified exosomes were investigated using atomic force microscopy (AFM, Veeco-V) employing tapping mode. Briefly, all three exosomes samples (UC, SC, and CR) were diluted (1:1000) in filtered DPBS and spin-coated onto the surface of a freshly cleaved silicon substrate. For preparation of each measurand, 20 μL of the diluted exosome sample was mounted onto a silicon substrate and spin-coated at 1500 rpm for 30 s. The images were analyzed using the NanoScope 7.20 (Build R1.30937) software.
5.3.4. Field Emission Scanning Electron Microscopy (FESEM)
The morphology of purified exosomes was further analyzed employing a field emission scanning electron microscope (FESEM, Zeiss, model Supra 40VP). Briefly, exosomes were resuspended and diluted in 1 mL of filtered DPBS (1:1000), and 20 μL of the diluted sample was coated on a silicon substrate using a spin coater (1500 rpm for 30 s) and mounted on an SEM stub for analysis.
5.4. Uptake of Labeled Exosomes by Tumor Cells in Vitro
5.4.1. Fluorescent Labeling of Exosomes Using PKH-26
Prior to labeling of the exosomes, 4 μL of PKH26 dye (PKH26 Red Fluorescent Cell Linker Kit for General Cell Membrane Labeling, Sigma) was diluted in 1000 μL of diluent C to a final concentration of 4 μM. Briefly, 5 × 10⁷ purified exosomes were resuspended in 1 mL of diluent C, mixed with 1 mL of diluted PKH26 (4 μM), and incubated for 4 min at 37 °C. The reaction was stopped by adding DMEM + 10% FBS and centrifuged at 100,000g for 90 min. To remove the unbound dye, the pellets (exosomes) were again washed and centrifuged at 100,000g for 90 min.
5.4.2. Carboxyfluorescein Succinimidyl Ester Labeling of hWJ-MSCs
Briefly, 1 × 10⁶ MSCs were washed with DPBS and centrifuged at 400g for 5 min at RT. The pellet was resuspended in 1 mL of DPBS and incubated with 5 μM (10 mM stock in DMSO) of carboxyfluorescein succinimidyl ester (CFSE) at 37 °C for 45 min. After the incubation, DPBS (9 mL) was added to the cells and centrifuged at 400g for 5 min at RT. The pellet obtained was washed, counted (trypan blue), and resuspended in an appropriate volume of DMEM + 10% FBS media as per need of further experiment.
5.4.3. Co-culture of Labeled Exosomes and Unlabeled Pancreatic Tumor Cells
To observe the exosomal internalization into MiaPaCa-2 cells (pancreatic cancer cell line; purchased from National Center for Cell Science, Pune, India), hWJ-ME labeled with PKH26 (as described in Section 5.4.1) were overlaid on MiaPaCa-2 cells. Briefly, 3 × 10⁴ MiaPaCa-2 cells were seeded on coverslips in a 24-well plate overnight at 37 °C and 5% CO2. The labeled exosomes (PKH26) were overlaid on the growing MiaPaCa-2 cells and analyzed using confocal microscopy (LEICA TCS SP5 II) after 48 h of incubation.
5.4.4. Dye Transfer Assay
CFSE-labeled MSCs (as described in Section 5.4.2) were co-cultured with unlabeled MiaPaCa-2 cells to decipher the mechanism of exosome transfer. Briefly, 3 × 10⁵ CFSE-labeled MSCs were co-cultured with 3 × 10⁵ unlabeled MiaPaCa-2 cells and incubated for 48 h at 37 °C and 5% CO2 in a 12-well plate. The co-cultured and individual cells (CFSE-MSCs and unlabeled MiaPaCa-2 cells) were acquired using flow cytometry (FACSAria III, BD Biosciences) and analyzed using the FACSDiva software v6.2.
5.5. Statistical Analysis
Exosomes are reported in the unit of diameters (nanometers). Further, the diameters are represented as mean ± standard deviation. The statistical difference between the three different methods was calculated using the Kruskal–Wallis test, and further paired comparisons were performed using the Mann–Whitney U test. p < 0.05 was considered to be statistically significant.
Acknowledgments
The authors would like to thank Kriti Jain (SGRH) for advising and providing technical support to carry out the flow cytometry experiments, Parul Chugh (SGRH) for the statistical analysis, and the co-workers at the Department of Research, SGRH. The authors would like to acknowledge Bhaskar Gahtori (NPL) for providing technical support to carry out FESEM experiments and Sandeep Singh (NPL) for the AFM experiments.
Glossary
Abbreviations
- MSC
mesenchymal stem cells
- hWJ-MSCs
human Wharton’s jelly-derived mesenchymal stem cells
- hWJ-ME
human Wharton’s jelly-mesenchymal stem cell-derived exosomes
- UC
ultracentrifugation
- SC
sucrose cushion
- CR
commercial reagent
- FESEM
field emission scanning electron microscopy
- AFM
atomic force microscopy
- NTA
nanoparticle tracking analysis
- CFSE
carboxyfluorescein succinimidyl ester
- CD
cluster of differentiation
- EVs
extracellular vesicles
- DMEM
Dulbecco’s modified Eagle’s medium
- DPBS
Dulbecco’s phosphate buffer saline
- RT
room temperature
- CM
conditioned media
- DAPI
4′,6-diamidino-2-phenylindole
- ISCT
International Society for Cellular Therapy
- HLA-DR
human leukocyte antigen–DR isotype
- 3D
three-dimensional
- 2D
two-dimensional
- FITC
fluorescein isothiocyanate
- TEM
transmission electron microscopy
Author Contributions
The manuscript was written through contributions of all authors. All authors have given approval to the final version of the manuscript. N.C. performed exosome isolation/characterization, in vitro assays, and framing of the manuscript. B.D.A. performed the FESEM and AFM. N.J. analyzed the NTA data. P.Y. isolated hWJ-MSCs. S.W. contributed in manuscript proofreading. S.P.S. contributed in inference of FESEM and AFM along with advising on the editing of the manuscript. S.C. conceptualized, guided, framed, and edited the manuscript.
This work was supported by the grant provided by Research and Development programme (RDP), Sir Ganga Ram Hospital (SGRH), India. N.C. is a recipient of DST-INSPIRE fellowship (IF150183). B.D. is a recipient of University Grant Commission fellowship (2061510098).
The authors declare no competing financial interest.
References
- Barthes J.; Özçelik H.; Hindié M.; Ndreu-Halili A.; Hasan A.; Vrana N. E. Cell microenvironment engineering and monitoring for tissue engineering and regenerative medicine: the recent advances. Biomed Res. Int. 2014, 2014, 921905. 10.1155/2014/921905. [DOI] [PMC free article] [PubMed] [Google Scholar]
- Cheng L.; Zhao W.; Hill A. F. Exosomes and their role in the intercellular trafficking of normal and disease associated prion proteins. Mol. Aspects Med. 2018, 60, 62–68. 10.1016/j.mam.2017.11.011. [DOI] [PubMed] [Google Scholar]
- Schey K. L.; Luther J. M.; Rose K. L. Proteomics characterization of exosome cargo. Methods 2015, 87, 75–82. 10.1016/j.ymeth.2015.03.018. [DOI] [PMC free article] [PubMed] [Google Scholar]
- Mathivanan S.; Fahner C. J.; Reid G. E.; Simpson R. J. ExoCarta 2012: database of exosomal proteins, RNA and lipids. Nucleic Acids Res. 2011, 40, D1241–D1244. 10.1093/nar/gkr828. [DOI] [PMC free article] [PubMed] [Google Scholar]
- Yang T.; Martin P.; Fogarty B.; Brown A.; Schurman K.; Phipps R.; et al. Exosome delivered anticancer drugs across the blood–brain barrier for brain cancer therapy in Danio Rerio. Pharm. Res. 2015, 2003–2014. 10.1007/s11095-014-1593-y. [DOI] [PMC free article] [PubMed] [Google Scholar]
- Sercombe L.; Veerati T.; Moheimani F.; Wu S. Y.; Sood A. K.; Hua S. Advances and Challenges of Liposome Assisted Drug Delivery. Front. Pharmacol. 2015, 6, 286. 10.3389/fphar.2015.00286. [DOI] [PMC free article] [PubMed] [Google Scholar]
- Properzi F.; Logozzi M.; Fais S. Exosomes: the future of biomarkers in medicine. Biomarkers Med. 2013, 7, 769–78. 10.2217/bmm.13.63. [DOI] [PubMed] [Google Scholar]
- Tian Y.; Li S.; Song J.; Ji T.; Zhu M.; Anderson G. J.; et al. A doxorubicin delivery platform using engineered natural membrane vesicle exosomes for targeted tumor therapy. Biomaterials 2015, 35, 2383–2390. 10.1016/j.biomaterials.2013.11.083. [DOI] [PubMed] [Google Scholar]
- Saari H.; Lázaro-Ibáñez E.; Viitala T.; Vuorimaa-Laukkanen E.; Siljander P.; Yliperttula M. Microvesicle- and exosome-mediated drug delivery enhances the cytotoxicity of paclitaxel in autologous prostate cancer cells. J. Controlled Release 2015, 220, 727–37. 10.1016/j.jconrel.2015.09.031. [DOI] [PubMed] [Google Scholar]
- Shtam T. A.; Kovalev R. A.; Varfolomeeva E. Y.; Makarov E. M.; Kil Y. V.; Filatov M. V. Exosomes are natural carriers of exogenous siRNA to human cells in vitro. Cell Commun. Signaling 2013, 11, 88. 10.1186/1478-811X-11-88. [DOI] [PMC free article] [PubMed] [Google Scholar]
- Lai R. C.; Arslan F.; Lee M. M.; Sze N. S. K.; Choo A.; Chen T. S.; Salto-Tellez M.; Timmers L.; Lee C. N.; El Oakley R. M.; Pasterkamp G.; de Kleijn D. P. V.; Lim S. K. Exosome secreted by MSC reduces myocardial ischemia/reperfusion injury. Stem Cell Res. 2010, 214–222. 10.1016/j.scr.2009.12.003. [DOI] [PubMed] [Google Scholar]
- Wang X.; Gu H.; Qin D.; Yang L.; Huang W.; Essandoh K.; Wang Y.; Caldwell C. C.; Peng T.; Zingarelli B.; Fan G.-C. Exosomal miR-223 contributes to mesenchymal stem cell-elicited cardioprotection in polymicrobial sepsis. Sci. Rep. 2015, 5, 13721. 10.1038/srep13721. [DOI] [PMC free article] [PubMed] [Google Scholar]
- Bortolotti F.; Ukovich L.; Razban V.; Martinelli V.; Ruozi G.; Pelos B.; Dore F.; Giacca M.; Zacchigna S. In vivo therapeutic potential of mesenchymal stromal cells depends on the source and the isolation procedure. Stem Cell Rep. 2015, 4, 332–339. 10.1016/j.stemcr.2015.01.001. [DOI] [PMC free article] [PubMed] [Google Scholar]
- Brini A. T.; Coccè V.; Ferreira L. M. J.; Giannasi C.; Cossellu G.; Giannì A. B.; Angiero F.; Bonomi A.; Pascucci L.; Falchetti M. L.; Ciusani E.; Bondiolotti G.; Sisto F.; Alessandri G.; Pessina A.; Farronato G. Cell-mediated drug delivery by gingival interdental papilla mesenchymal stromal cells (GinPa-MSCs) loaded with paclitaxel. Expert Opin. Drug Delivery 2016, 13, 789–98. 10.1517/17425247.2016.1167037. [DOI] [PubMed] [Google Scholar]
- Kabashima-Niibe A.; Higuchi H.; Takaishi H.; Masugi Y.; Matsuzaki Y.; Mabuchi Y.; Funakoshi S.; Adachi M.; Hamamoto Y.; Kawachi S.; Aiura K.; Kitagawa Y.; Sakamoto M.; Hibi T. Mesenchymal stem cells regulate epithelial-mesenchymal transition and tumor progression of pancreatic cancer cells. Cancer Sci. 2013, 104, 157–64. 10.1111/cas.12059. [DOI] [PMC free article] [PubMed] [Google Scholar]
- Saito K.; Sakaguchi M.; Maruyama S.; Iioka H.; Putranto E. W.; Sumardika I. W.; Tomonobu N.; Kawasaki T.; Homma K.; Kondo E. Stromal mesenchymal stem cells facilitate pancreatic cancer progression by regulating specific secretory molecules through mutual cellular interaction. J. Cancer 2018, 9, 2916–2929. 10.7150/jca.24415. [DOI] [PMC free article] [PubMed] [Google Scholar]
- Ho I. A. W.; Toh H. C.; Ng W. H.; et al. Human bone marrow-derived mesenchymal stem cells suppress human glioma growth through inhibition of angiogenesis. Stem Cells 2013, 31, 146–155. 10.1002/stem.1247. [DOI] [PubMed] [Google Scholar]
- Zhu Y.; Sun Z.; Han Q.; et al. Human mesenchymal stem cells inhibit cancer cell proliferation by secreting DKK-1. Leukemia 2009, 23, 925–933. 10.1038/leu.2008.384. [DOI] [PubMed] [Google Scholar]
- Zhao G.; Liu F.; Lan S.; et al. Large-scale expansion of Wharton’s jelly-derived mesenchymal stem cells on gelatin microbeads, with retention of self-renewal and multipotency characteristics and the capacity for enhancing skin wound healing. Stem Cell Res. Ther. 2015, 6, 38. 10.1186/s13287-015-0031-3. [DOI] [PMC free article] [PubMed] [Google Scholar]
- Kalaszczynska I.; Ferdyn K. Wharton’s jelly derived mesenchymal stem cells: future of regenerative medicine? Recent findings and clinical significance. BioMed Res Int. 2015, 2015, 430847. 10.1155/2015/430847. [DOI] [PMC free article] [PubMed] [Google Scholar]
- El Omar R.; Beroud J.; Stoltz J. F.; Menu P.; Velot E.; Decot V. Umbilical cord mesenchymal stem cells: the new gold standard for mesenchymal stem cell-based therapies?. Tissue Eng., Part B 2014, 20, 523–544. 10.1089/ten.teb.2013.0664. [DOI] [PubMed] [Google Scholar]
- Tang Y.-T.; Huang Y.-Y.; Zheng L.; Qin S.-H.; Xu X.-P.; An T.-X.; et al. Comparison of isolation methods of exosomes and exosomal RNA from cell culture medium and serum. Int. J. Mol. Med. 2017, 40, 834–844. 10.3892/ijmm.2017.3080. [DOI] [PMC free article] [PubMed] [Google Scholar]
- Andreu Z.; Yáñez-Mó M. Tetraspanins in extracellular vesicle formation and function. Front. Immunol. 2014, 5, 442. 10.3389/fimmu.2014.00442. [DOI] [PMC free article] [PubMed] [Google Scholar]
- Buschow S. I.; Nolte-‘t Hoen E. N. M.; van Niel G.; Pols M. S.; Ten Broeke T.; Lauwen M.; et al. MHC II in dendritic cells is targeted to lysosomes or T cell-induced exosomes via distinct multivesicular body pathways. Traffic 2009, 10, 1528–1542. 10.1111/j.1600-0854.2009.00963.x. [DOI] [PubMed] [Google Scholar]
- Sharma S.; LeClaire M.; Gimzewski J. K. Ascent of atomic force microscopy as a nanoanalytical tool for exosomes and other extracellular vesicles. Nanotechnology 2018, 29, 132001. 10.1088/1361-6528/aaab06. [DOI] [PubMed] [Google Scholar]
- Havrdova M.; Polakova K.; Skopalik J.; Vujtek M.; Mokdad A.; Homolkova M.; et al. Field emission scanning electron microscopy (FE-SEM) as an approach for nanoparticle detection inside cells. Micron 2014, 67, 149–154. 10.1016/j.micron.2014.08.001. [DOI] [PubMed] [Google Scholar]
- Sharma S.; Rasool H. I.; Palanisamy V.; Mathisen C.; Schmidt M.; Wong D. T.; Gimzewski J. K. Structural-mechanical characterization of nanoparticle exosomes in human saliva, using correlative AFM, FESEM, and force spectroscopy. ACS Nano 2010, 4, 1921–1926. 10.1021/nn901824n. [DOI] [PMC free article] [PubMed] [Google Scholar]
- Hessvik N. P.; Llorente A. Current knowledge on exosome biogenesis and release. Cell. Mol. Life Sci. 2018, 75, 193–208. 10.1007/s00018-017-2595-9. [DOI] [PMC free article] [PubMed] [Google Scholar]
- Wei X.; Yang X.; Han Z.-p.; Qu F.-f.; Shao L.; Shi Y.-f. Mesenchymal stem cells: a new trend for cell therapy. Acta Pharmacol. Sin. 2013, 34, 747–754. 10.1038/aps.2013.50. [DOI] [PMC free article] [PubMed] [Google Scholar]
- Jeppesen D. K.; Hvam M. L.; Primdahl-Bengtson B.; Boysen A. T.; Whitehead B.; Dyrskjøt L.; Ørntoft T. F.; Howard K. A.; Ostenfeld M. S. Comparative analysis of discrete exosome fractions obtained by differential centrifugation. J. Extracell. Vesicles 2014, 3, 25011. 10.3402/jev.v3.25011. [DOI] [PMC free article] [PubMed] [Google Scholar]
- Momen-Heravi F.; Balaj L.; Alian S.; Mantel P. Y.; Halleck A. E.; Trachtenberg A. J.; et al. Current methods for the isolation of extracellular vesicles. Biol. Chem. 2013, 394, 1253–1262. 10.1515/hsz-2013-0141. [DOI] [PMC free article] [PubMed] [Google Scholar]
- Li P.; Kaslan M.; Lee S. H.; Yao J.; Gao Z. Progress in Exosome Isolation Techniques. Theranostics 2017, 7, 789–804. 10.7150/thno.18133. [DOI] [PMC free article] [PubMed] [Google Scholar]
- Welsh J. A.; Holloway J. A.; Wilkinson J. S.; Englyst N. A. Extracellular Vesicle Flow Cytometry Analysis and Standardization. Front. Cell Dev. Biol. 2017, 5, 78. 10.3389/fcell.2017.00078. [DOI] [PMC free article] [PubMed] [Google Scholar]
- Melo S. A.; Luecke L. B.; Kahlert C.; Fernandez A. F.; Gammon S. T.; Kaye J.; et al. Glypican-1 identifies cancer exosomes and detects early pancreatic cancer. Nature 2015, 523, 177–182. 10.1038/nature14581. [DOI] [PMC free article] [PubMed] [Google Scholar]
- Li Y.; Zhang Y.; Qiu F.; Qiu Z. Proteomic identification of exosomal LRG1: a potential urinary biomarker for detecting NSCLC. Electrophoresis 2011, 32, 1976–1983. 10.1002/elps.201000598. [DOI] [PubMed] [Google Scholar]
- Skog J.; Würdinger T.; van Rijn S.; Meijer D. H.; Gainche L.; Curry W. T. Jr.; et al. Glioblastoma microvesicles transport RNA and proteins that promote tumour growth and provide diagnostic biomarkers. Nat. Cell Biol. 2008, 10, 1470–1476. 10.1038/ncb1800. [DOI] [PMC free article] [PubMed] [Google Scholar]
- Mendt M.; Kamerkar S.; Sugimoto H.; et al. Generation and testing of clinical-grade exosomes for pancreatic cancer. JCI Insight 2018, 3, e99263 10.1172/jci.insight.99263. [DOI] [PMC free article] [PubMed] [Google Scholar]
- Dragovic R. A.; Gardiner C.; Brooks A. S.; Tannetta D. S.; Ferguson D. J. P.; Hole P.; Carr B.; Redman C. W. G.; Harris A. L.; Dobson P. J.; et al. Sizing and phenotyping of cellular vesicles using Nanoparticle Tracking Analysis. Nanomed.: Nanotechnol. Biol. Med. 2011, 7, 780–788. 10.1016/j.nano.2011.04.003. [DOI] [PMC free article] [PubMed] [Google Scholar]
- Saveyn H.; de Baets B.; Thas O.; Hole P.; Smith J.; van der Meeren P. Accurate particle size distribution determination by nanoparticle tracking analysis based on 2-D Brownian dynamics simulation. J. Colloid Interface Sci. 2010, 352, 593–600. 10.1016/j.jcis.2010.09.006. [DOI] [PubMed] [Google Scholar]
- Yeo R. W. Y.; Lai R. C.; Zhang B.; Tan S. S.; Yin Y.; Teh B. J.; Lim S. K. Mesenchymal stem cell:an efficient mass producer of exosomes for drug delivery. Adv. Drug Delivery Rev. 2013, 65, 336–341. 10.1016/j.addr.2012.07.001. [DOI] [PubMed] [Google Scholar]
- Lai R. C.; Tan S. S.; Teh B. J.; et al. Proteolytic Potential of the MSC Exosome Proteome: Implications for an Exosome-Mediated Delivery of Therapeutic Proteasome. Int. J. Proteomics 2012, 2012, 971907. 10.1155/2012/971907. [DOI] [PMC free article] [PubMed] [Google Scholar]
- de Araujo Farias V.; O’Valle F.; Serrano-Saenz S.; et al. Exosomes derived from mesenchymal stem cells enhance radiotherapy-induced cell death in tumor and metastatic tumor foci. Mol. Cancer 2018, 17, 122. 10.1186/s12943-018-0867-0. [DOI] [PMC free article] [PubMed] [Google Scholar]
- Munoz J. L.; Bliss S. A.; Greco S. J.; Ramkissoon S. H.; Ligon K. L.; Rameshwar P. Delivery of Functional Anti-miR-9 by Mesenchymal Stem Cell-derived Exosomes to Glioblastoma Multiforme Cells Conferred Chemosensitivity. Mol. Ther. - Nucleic Acids 2013, 2, e126 10.1038/mtna.2013.60. [DOI] [PMC free article] [PubMed] [Google Scholar]
- Pascucci L.; Coccè V.; Bonomi A.; Ami D.; Ceccarelli P.; Ciusani E.; et al. Paclitaxel is incorporated by mesenchymal stromal cells and released in exosomes that inhibit in vitro tumor growth: a new approach for drug delivery. J. Controlled Release 2014, 192, 262–70. 10.1016/j.jconrel.2014.07.042. [DOI] [PubMed] [Google Scholar]
- Dominici M.; Le Blanc K.; Mueller I.; Slaper-Cortenbach I.; Marini F. C.; et al. Minimal criteria for defining multipotent mesenchymal stromal cells. The International Society for Cellular Therapy position statement. Cytotherapy 2006, 8, 315–317. 10.1080/14653240600855905. [DOI] [PubMed] [Google Scholar]
- Pospichalova V.; Svoboda J.; Dave Z.; et al. Simplified protocol for flow cytometry analysis of fluorescently labeled exosomes and microvesicles using dedicated flow cytometer. J. Extracell. Vesicles 2015, 4, 25530. 10.3402/jev.v4.25530. [DOI] [PMC free article] [PubMed] [Google Scholar]
- Gupta S.; Rawat S.; Arora V.; et al. An improvised one-step sucrose cushion ultracentrifugation method for exosome isolation from culture supernatants of mesenchymal stem cells. Stem Cell Res. Ther. 2018, 9, 180. 10.1186/s13287-018-0923-0. [DOI] [PMC free article] [PubMed] [Google Scholar]


