Abstract
It remains controversial whether and how spatial frequency (SF) is represented tangentially in cat visual cortex. Several models were proposed, but there is no consensus. Worse still, some data indicate that the SF organization previously revealed by optical imaging techniques simply reflects non-stimulus-specific responses. Instead, stimulus-specific responses arise from the homogeneous distribution of geniculo-cortical afferents representing X and Y pathways. To clarify this, we developed a new imaging method allowing rapid stimulation with a wide range of SFs covering more than 6 octaves with only 0.2 octave resolution. A benefit of this method is to avoid error of high-pass filtering methods which systematically under-represent dominant selectivity features near pinwheel centers. We show unequivocally that SF is organized into maps in cat area 17 (A17) and area 18 (A18). The SF organization in each area displays a global anteroposterior SF gradient and local patches. Its layout is constrained to that of the orientation map, and it is suggested that both maps share a common functional architecture. A17 and A18 are bound at the transition zone by another SF gradient involving the geniculo-cortical and the callosal pathways. A model based on principal component analysis shows that SF maps integrate three different SF-dependent channels. Two of these reflect the segregated excitatory input from X and Y geniculate cells to A17 and A18. The third one conveys a specific combination of excitatory and suppressive inputs to the visual cortex. In a manner coherent with anatomical and electrophysiological data, it is interpreted as originating from a subtype of Y geniculate cells.
Introduction
Hubel and Wiesel (1963) revolutionized neurophysiology, innovating moving bar stimuli to show that the retinotopic organization of primary and secondary visual cortex is superimposed with columnar organized patches representing orientation. However, the question of the cortical representation of the width and spacing of these bars [spatial frequency (SF), corresponding to the structure and texture of visual stimuli] remains a subject of debate. Is it distributed heterogeneously across the cortical surface, and if so, how might this arise from afferent pathways?
Anatomical and physiological studies in cats have described two principal afferent pathways, referred to as X and Y, originating in specific retinal ganglion cell populations and separately relayed by distinct subsets of neurons of the dorsal lateral geniculate nucleus (dLGN; for review, see Shapley and Lennie, 1985). These two pathways are differentially selective to SF at given retinal eccentricities (Derrington and Fuchs, 1979; Lehmkuhle et al., 1980; Troy, 1983), with X cells being more suitable for fine detail discrimination (high SF), and Y cells for global information about shape (low SF). They provide the main inputs to neurons in area 17 (A17) of the visual cortex (Ferster and LeVay, 1978; Freund et al., 1985; Humphrey et al., 1985). As a result, the SF selectivity of neurons in this area is widely believed to be inherited, at least partly, from these two functional pathways.
Recent evidence has further extended this scheme, showing that responses in A17 detected by intrinsic signal optical imaging can be fully explained as a linear combination of SF filters representing these two streams. By modeling low and high SF channels from experimental data, Sirovich and Uglesich (2004) showed that these two channels could explain ∼95% of the intrinsic signal in response to visual stimuli. An important consequence of this model, however, is the absence of SF organization tangentially across the surface of A17. Although such organization has remained controversial over years, this conclusion strongly contrasts with previous optical imaging studies that have systematically shown that stimulation with various SFs evokes responses at different cortical locations (Hübener et al., 1997; Everson et al., 1998; Issa et al., 2000). Sirovich and Uglesich (2004) challenged these observations and concluded that “non-stimulus-specific responses biased previous interpretations, and that no columnar organization for spatial frequency exists in A17.”
We reinvestigated this conclusion and showed that it is incorrect. SF organization and its relation to geniculate afferents were studied by recording intrinsic signals with new optical imaging techniques from extensive portions of cat visual cortex including A17, A18, and the transition zone (TZ) between these two areas. The results show unequivocally that SF is topographically organized in each area, although SF maps display distinctive characteristics. In the TZ, both the geniculo-cortical (GC) pathway and transcallosal (TC) pathways contribute to SF representation. A model developed to explain these data shows that SF organization in cat visual cortex requires, in addition to contributions of both X and Y pathways, a third SF-dependent pathway that exerts suppressive influences in A17 and A18. This latter pathway is proposed to originate from a subtype of Y cells in the dLGN.
Materials and Methods
Eight adult cats (four male, four female), born from different litters in our colony, were studied. They were all in good health and had no apparent malformations or pathologies. All experiments were performed in accordance with the relevant institutional and national guidelines and regulations [i.e., those of the Collège de France, the CNRS, and the DDPP (JO 87–848, consolidated after revision on May 30, 2001, Certificate numbers 75–337, 75–1753, and 75–1754, French Ministère de l'Agriculture et de la Pêche]. Experiments also conformed to the relevant regulatory standards recommended by the European Community Directive (Directive 2010/63/UE) and the US National Institutes of Health Guidelines.
Surgical procedure.
On the day of the optical imaging experiment, animals were anesthetized with saffan (initial dose, 1.2 mg/kg, i.m.; supplements, 1:1 in saline, administered intravenously as needed). After tracheal and venous cannulation, electrocardiogram, temperature, and expired CO2 probes were placed for continuous monitoring. Animals were installed in the Horsley-Clarke stereotactic frame and prepared for acute recordings. The scalp was incised in the sagittal plane, and a large craniotomy was performed overlying areas 17 and 18 of both hemispheres. The nictitating membranes were then retracted with eye drops (Neo-Synephrine 5%, Ciba Vision Ophthalmics), and the pupils were dilated with atropine eye drops (atropine 1%, MSD-Chibret). Scleral lenses were placed to protect the cornea and focus the eyes on the tangent screen 28.5 cm distant. The size of the lenses was adapted to the eye of each cat. Animals were then paralyzed with an infusion of Pavulon [0.2 ml/kg (0.4 mg/kg), i.v.], and breathing was assisted artificially through a tracheal cannula with a 3:2 mixture of N2O and O2 containing 0.5–1.0% isoflurane. The respiration frequency was adjusted to ∼18 breaths/min, and the volume adapted to the ratio of exhaled CO2 (partial pressure of carbon dioxide was maintained at 4%). Paralysis was maintained throughout the recording by continuous infusion of a mixture of Pavulon (0.1 ml/kg/h) diluted in glucose (5%) and NaCl (0.9 g/L). At the end of a recording session, the animal was given a lethal dose of pentobarbital. The experiments lasted in total <12 h.
Section of the optic chiasm.
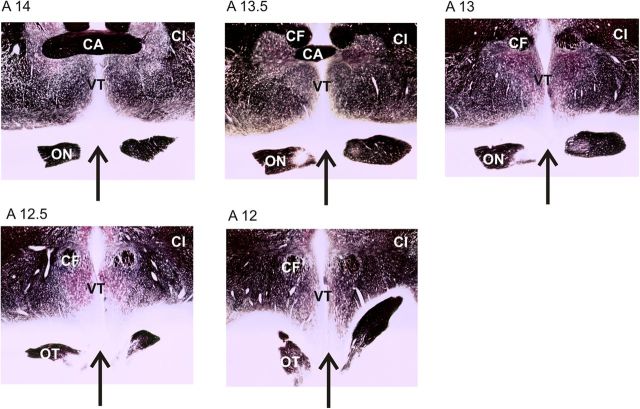
In two of the eight animals, chiasmotomy was performed 3 d before the optical imaging experiment to suppress responses from crossed retinal fibers originating mainly from the nasal retina. This surgery allows selective activation of the callosal (CC) pathway or the GC pathway converging onto the same visual cortex, depending on the stimulated eye (Berlucchi and Rizzolatti, 1968). Anesthesia was induced and maintained with Saffan (initial, 1.2 mg/kg, i.m., as above; supplements, 1:1 in saline, administered intravenously ad libitum). Each cat was installed supine in a Horsley-Clarke stereotactic apparatus. The electrocardiogram and the rectal temperature were continuously monitored. While the mouth was maintained open, the soft palate was cut along the midline. The exposed bony palate was treated with a local anesthetic (Xylocaine 2%, AstraZeneca) and drilled to expose the dura. The dura was incised, and the underlying optic chiasm was cut totally in the midsagittal plane. Antibiotics were applied both locally (Cébénicol, 80 mg/ml, Chauvin-Bausch & Lomb) and intramuscularly (Extencilline, 1 MU/kg, Aventis). Finally, the soft palate was sutured, and an oral analgesic was administered (Metacam, 0.1 mg/kg, Boehringer Ingelheim). The completeness of the optic chiasm section was verified postmortem using gold chloride staining (Schmued, 1990) on 50 μm frontal sections (Fig. 1).
Figure 1.
Histological control of optic chiasm sections. Fibers on 50 μm frontal brain sections were stained postmortem using gold-chloride (Schmued, 1990). The completeness of the optic chiasm section is indicated with a black arrow at various anteroposterior coordinates. CA, Commissura anterior; CF, columna fornicis; CI, capsula interna; ON, optic nerve; OT, optic tract; VT, ventriculus tertius.
The section of the optic chiasm was used here to study the specific role of the corpus callosum in SF perception. The corpus callosum links the two hemispheres, and callosal terminals in cat are found at and around the TZ (Payne and Siwek, 1991; Houzel et al., 1994). When the sectioning of the optic chiasm is performed, activity can still be recorded at and around the TZ when the eye contralateral to the recorded hemisphere is stimulated (Lepore and Guillemot, 1982; Milleret et al., 2005; Rochefort et al., 2009). These responses are specific to signals transmitted via the corpus callosum. Indeed, when the corpus callosum is also sectioned (Milleret and Houzel, 2001), visually evoked activity can no longer be recorded.
Optical imaging.
The cortex was illuminated at 545 nm to reveal the vascular pattern of the cortical surface, and at 700 nm to record the intrinsic signals. The focal plane was adjusted to 500 μm below the cortical surface. The optic discs were plotted by tapetal reflection on a sheet of paper covering the tangent screen placed 28.5 cm in front of the animal. The center of the screen was situated 8 cm (∼15°) below the middle of the two optic discs; that is, ∼8.5° into the lower visual field of the animal (Bishop et al., 1962). Intrinsic optical signals were recorded while the animals were exposed to visual stimuli displayed on a CRT monitor. The size of the display subtended a visual angle of ∼75° × 56°. The image had a resolution of 14 pixels per degree, and the refresh rate was 88 Hz. Frames were acquired by CCD video camera (1M60, DALSA) at the rate of 40 frames per second and were stored after binning by 2 × 2 pixels spatially and by 12 frames temporally using the LongDaq system (Optical Imaging). Images were acquired with a resolution of ∼25 μm/pixel (compare Figs. 2, 11), or by using a teleconverter with a twofold finer resolution (compare Figs. 4, 5, and 6, 8, 9, and 10).
Figure 2.
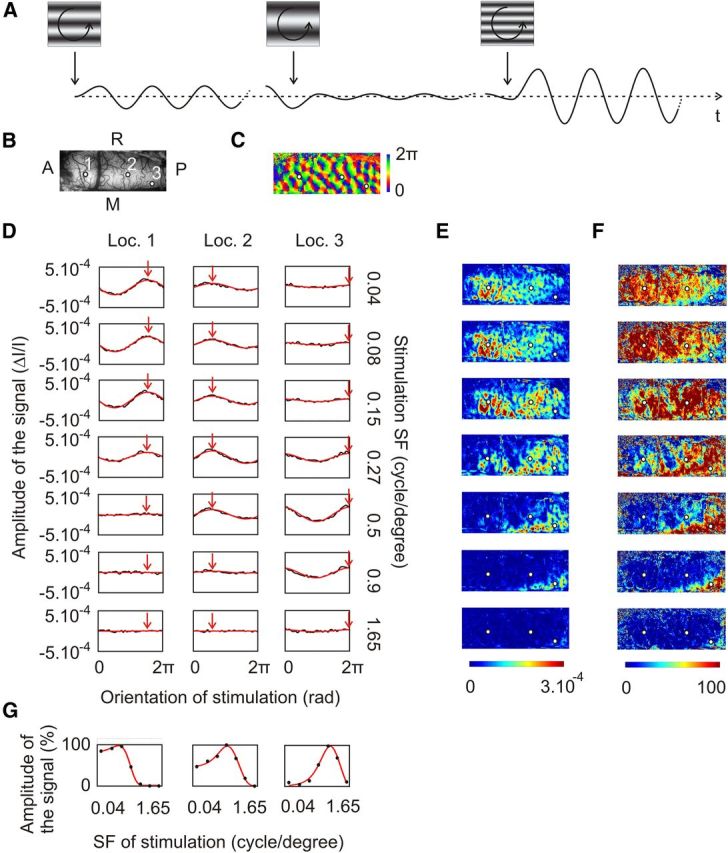
Stimulation paradigm and analysis method. A, Top, Sine-wave gratings drifting at 2 Hz are rotated continuously at 2 rpm. Ten full rotations are successively presented for each SF in random order (three SFs are represented here). Bottom, Schematic responses for single pixels in the recorded data are modeled as sine functions peaking at the preferred orientation. The magnitude of the peak varies with SF. B, Blood vessel pattern. The three cortical locations are referred to below. C, Orientation map obtained by calculating the Fourier transform at each pixel of the signal illustrated in A. D, Determination of the magnitude of the signal elicited by each SF. For each location shown in B, the average temporal signal for each SF was interpolated with a sine function whose frequency was equal to that of the stimulus rotation and whose phase (red arrow) was equal to the preferred orientation shown in C. E, Maximal intensity maps for each SF (SFs are as in D). F, Normalized maximal intensity maps for each SF. At each pixel, values in E were rescaled by setting the greatest value among all SFs to 100. G, DOG interpolation at each cortical location shown in B for the maximal intensities in F. For all Figures: A, anterior; P, posterior; L, left; R, right.
Figure 11.
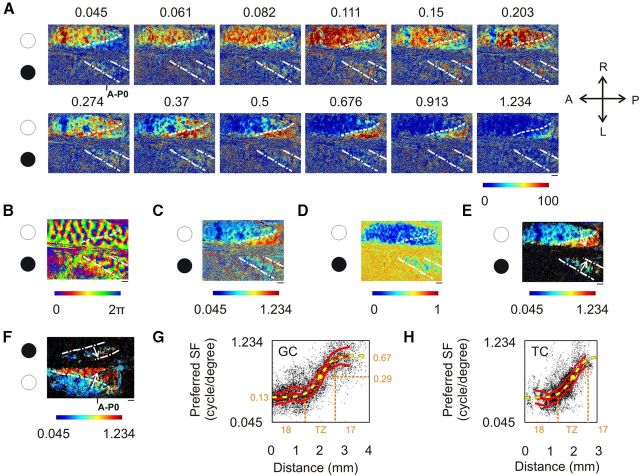
Spatial frequency representation in the TZ in a split-chiasm preparation. A–E, The right eye was stimulated (white circle), and the left one was occluded (black circle). Because of the chiasmotomy, the upper (right) hemisphere was activated by the GC pathway and the lower (left) hemisphere by the TC pathway. A, Maximal intensity maps for the 12 SFs. B, Preferred orientation map. C, Preferred SF map based on maximum detection method. The scale is logarithmic. D, Map of the error-of-fit following DOG function interpolation. E, Preferred SF map based on DOG function interpolation. Black domains correspond to cortical regions with error-of-fit >0.5. Scale is logarithmic. F, Same as in E for another animal with left eye stimulation. G, Evolution of the preferred SF across the TZ for GC activation (i.e., in the direction of the white arrows in E and F in hemispheres ipsilateral to the open eye). The data for this (black points) are pixels chosen randomly from data from all animals. The three red curves represent the median value ± MAD. Sigmoid interpolation for the median values is shown in yellow. H, Same analysis as in G for TC activation (i.e., in the direction of the white arrows in E and F in hemispheres contralateral to the open eye). The median value could be fitted with the same sigmoid as in G. Scale bar, 1 mm.
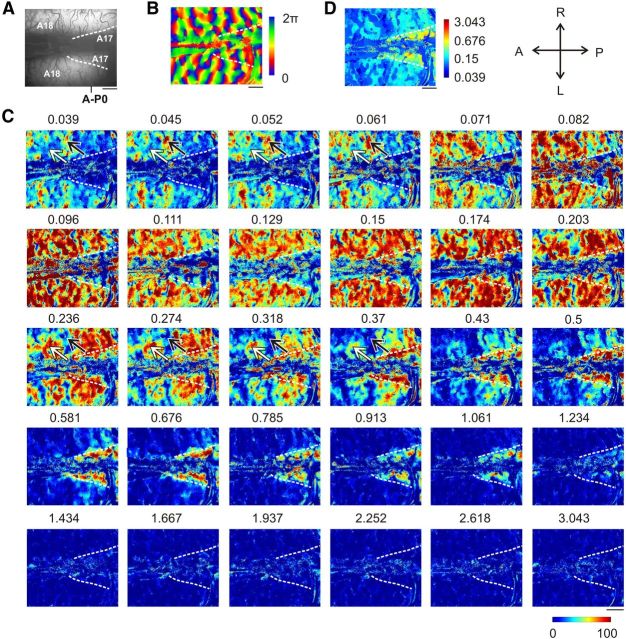
Figure 4.
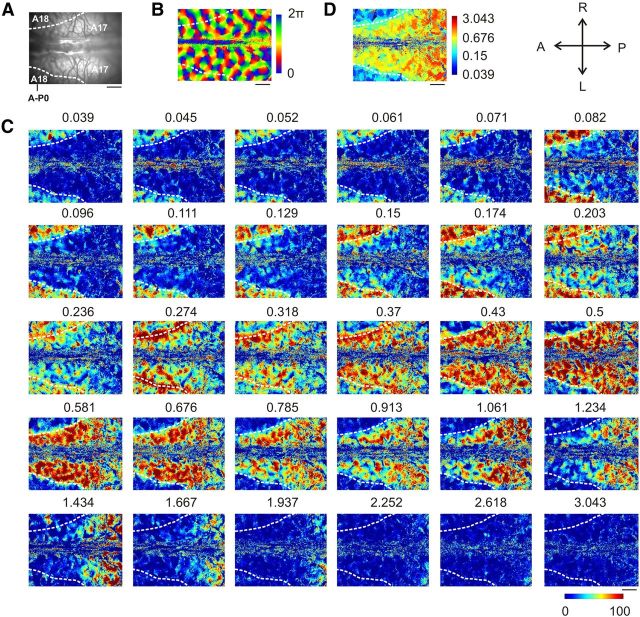
Spatial frequency map in A17. A, Blood vessel patterns. B, Preferred orientation map. C, Maximal intensity maps for the 30 SFs presented. The signal at each pixel that elicited the maximum activation was normalized at 100%. Note the progression from anterior to posterior with increasing SF. D, Preferred SF map based on a maximum detection method. Scale is logarithmic. Scale bar, 1 mm.
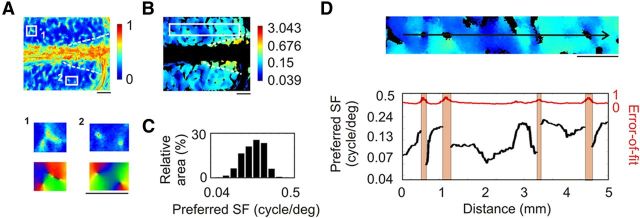
Figure 5.
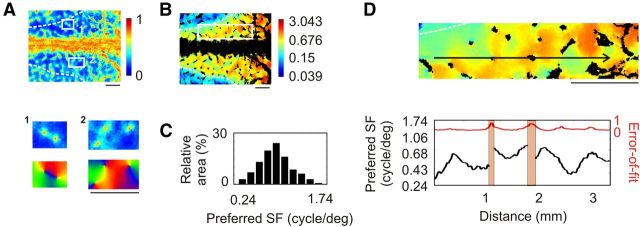
Spatial frequency map with interpolation in A17. A, Map of the error-of-fit following DOG function interpolation (higher values indicate higher error). Two regions of interest with high error-of-fit are enlarged in A1 and A2 (top panels) and compared with the local orientation map (bottom panels). B, Preferred SF map based on DOG function interpolation. Black domains correspond to cortical regions with error-of-fit >0.5. The scale is logarithmic. C, Cortical distribution of preferred SF in A17. D, Top, Enlargement of the region of interest defined in B by the white rectangle. Black arrow indicates anteroposterior axis. Bottom, SF profile along the arrow. The error-of-fit along the same axis appears in red. Red vertical bars correspond to where error-of-fit exceeded 0.5. Scale bar, 1 mm.
Figure 6.
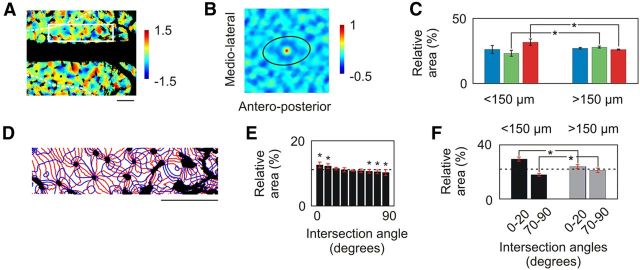
Organization of the spatial frequency map in A17. A, Map of local SF extrema expressed in octaves. Slow varying components were subtracted from the SF map shown in Figure 5B through polynomial interpolation (Ribot et al., 2006). B, 2D spatial autocorrelation structure for the map of local extrema. The secondary peaks, representing characteristic periods in various directions, are linked by a black ellipse. C, Average cortical distribution (±SD, n = 5) of the SF map shown in A for cortical domains located within 150 μm from pinwheel centers (left) and those located further away (right). SF was divided into three classes: the first two groups each included the thirds of the pixels with the lowest minima (blue) and the highest maxima (red), respectively. The third group (green) contained the intermediate pixels. Asterisks indicate significant difference between groups (Mann–Whitney test, p < 0.01). D, Contours of iso-orientation (red) and iso-SF (blue) lines for the region of interest defined in A by the white rectangle. E, Histograms showing the average distribution (±SD, n = 5) of the intersection angle between iso-orientation and iso-SF lines. Asterisks indicate significant deviation (t test, p < 0.05) from the distribution for which pixels in the two maps were randomly shuffled. The dashed line indicates the distribution in case of uniformity. F, Histograms showing the average distribution (±SD, n = 5) of the intersection angle between iso-orientation and iso-SF lines for angles between 0° and 20° and for angles between 70° and 90°. Black bars correspond to cortical domains located within 150 μm from pinwheel centers, and gray bars correspond to those located farther away. Asterisks indicate significant difference between groups (t test, p < 0.01). Scale bar, 1 mm.
Figure 8.
Spatial frequency map in A18. A–D, Same format as in Figure 4 but for A18. Note that in C the global anteroposterior gradient does not appear as clearly as in A17 (Fig. 4C). But the patchy structure does appear as clearly: the black arrow points to a location activated by SFs <0.061 cpd but not by SFs between 0.236 and 0.37 cpd. This strongly contrasts with the cortical location defined by the white arrow, which responds inversely. Scale bar, 1 mm.
Figure 9.
Spatial frequency map with interpolation in A18. Same legend as in Figure 5 but for A18. A, Map of the error-of-fit following DOG function interpolation. Two regions of interest with high error-of-fit are enlarged in A1 and A2 (top panels) and compared with the local orientation map (bottom panels). B, Preferred SF map based on DOG function interpolation. Black domains correspond to cortical regions with error-of-fit >0.5. Scale is logarithmic. C, Cortical distribution of preferred SF in A17. D, Top, Enlargement of the region of interest defined in B by the white rectangle. Black arrow indicates anteroposterior axis. Bottom, SF profile along the arrow. The error-of-fit along the same axis appears in red. Red vertical bars correspond to where error-of-fit exceeded 0.5. Scale bar, 1 mm.
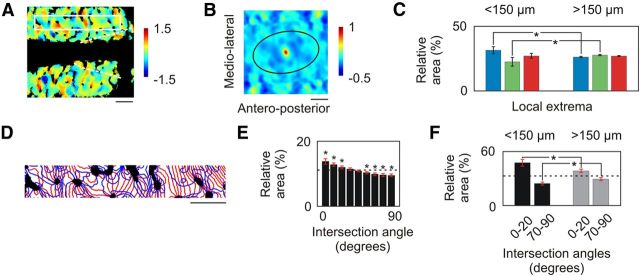
Figure 10.
Organization of the spatial frequency map in A18. Same as in Figure 6 but for A18. A, Map of local SF extrema expressed in octaves. B, 2D spatial autocorrelation structure for the map of local extrema. C, Average cortical distribution (SD, n=5) of the SF map shown in A for cortical domains located close to pinwheel centers (left) and those located further away (right). Asterisks indicate significant difference between groups (MannγÇôWhitney test, p<0.01). D, Contours of iso-orientation (red) and iso-SF (blue) lines for the region of interest defined in A by the white rectangle. E, Histograms showing the average distribution (SD, n=5) of the intersection angle between iso-orientation and iso-SF lines. Asterisks indicate significant deviation (Student's t test, p<0.05) from the distribution for which pixels in the two maps were randomly shuffled. F, Histograms showing the average distribution (SD, n=5) of the intersection angle between iso-orientation and iso-SF lines for angles between 0° and 20° and for angles between 70° and 90°. Black bars correspond to cortical domains located close to pinwheel centers, and gray bars correspond to those located farther away. Asterisks indicate significant difference between groups (Student's t test, p<0.01). Scale bar, 1 mm.
Stimulation.
Full-screen visual stimuli were presented continuously to the animal (Fig. 2A). Each stimulus consisted of sine-wave gratings drifting in one direction and rotating in a counterclockwise manner (Kalatsky and Stryker, 2003). The angular speed of the rotation was 2 rotations per minute (rpm). Temporal frequency representation was assumed to be constant across A17 and A18, and the temporal frequency of the drifting was set at 2 Hz. Although previous studies suggest that preferred temporal frequency might actually vary with preferred SF at the level of a single neuron (DeAngelis et al., 1993), our preliminary data in A17 and A18 (Ribot et al., 2008b) have conversely shown that population activity is always the strongest at a temporal frequency of 2 Hz, regardless of the actual SF preference of cortical domains. This justifies the use of a single temporal frequency of stimulation. Note, however, that an additional velocity existed because of the rotation. Such an artifact was more important for high SFs and at large eccentricities. The contrast was set at 50% to ensure the production of smooth sine-wave gratings (Xu et al., 2007). In the intact animals (i.e., with an intact optic chiasm; n = 6), 30 SFs ranging linearly in a logarithmic scale from 0.039 to 3.043 cycles/° (cpd) were presented in random order. This corresponded to an increment of only 0.2 octave between two SFs. Ten full rotations were presented for each SF. At the end of the last rotation, the first frame of the first rotation for the next SF was presented without interruption. The total duration of the recording was 2.5 h. In animals in which chiasmotomy was performed, 12 SFs were presented monocularly ranging from 0.045 to 1.234 cpd.
Image processing.
Data analysis was based on the method developed by Kalatsky and Stryker (2003) to extract periodic signals from intrinsic data in Fourier space. Although this method has been shown to be very efficient to reconstruct functional maps in mouse visual cortex, we found the maps in cat to be of rather poor quality compared with those obtained by Kalatsky and Stryker (2003) and decided to preprocess raw data with additional filtering. A common approach for this is high-pass filtering of images (Dadvand et al., 2006; Vanni et al., 2010). However, since SF representation is anisotropic in both A17 and A18 (Movshon et al., 1978), active domains may have very different sizes depending on the stimulus SF. High-pass filtering is thus risky since it spatially limits the size of the activated areas. Instead, here we selected a multivariate analysis technique, the generalized indicator function method (Yokoo et al., 2001; Ribot et al., 2006), that does not require any assumptions about the spatial characteristics of the activity patterns. This procedure was applied to raw data for each SF separately. A minimal low-pass filter (with a Gaussian kernel of 3 × 3 pixels and of 1 pixel SD) was also applied for smoothing the data.
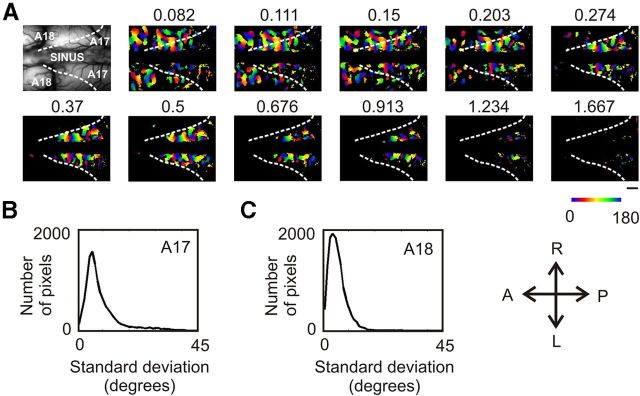
To construct the orientation map, a Fourier transform was performed on the temporal signal of each pixel for all SFs together. The phase at the frequency of rotation was calculated to obtain the preferred orientation (plus the hemodynamic delay; Fig. 2C) at each pixel (Kalatsky and Stryker, 2003). This operation was motivated by the observation that preferred orientation in A17 is invariant to the SF of stimulation (Webster and De Valois, 1985; Issa et al., 2000; Tani et al., 2012). However, little evidence exists concerning this issue in A18. Since data from both areas are presented here, further support for this invariance is provided in Figure 3. Orientation maps with classical techniques for optical imaging were recorded in A17 and A18 for 11 SFs of stimulation (Fig. 3A). The differences between maps were assessed quantitatively by calculating for each pixel the SD of the preferred orientation over the 11 SFs. The distribution of these SDs is plotted in the histogram in Figure 3, B and C, for A17 and A18, respectively. The results show that 95% of the pixels in A17 and 99% in A18 have an SD less than the sampling interval of 22.5°. It is thus concluded that orientation preference is independent of stimulus SF in both areas. This justifies the calculation of only one preferred orientation map from all SFs together (Fig. 2C). All orientation maps are shown with the hemodynamic delay. Their values range between 0 and 2π, and correspond to the phase extracted at half the frequency of rotation.
Figure 3.
Invariance of preferred orientation to stimulus SF using classical techniques for optical imaging. A, Preferred orientation maps for which classical techniques for optical imaging were used are presented for 11 SFs of stimulation (for detailed methods, see Tanaka et al., 2007, 2009). Briefly, data were acquired during the episodic presentation of sine-wave gratings drifting backward and forward at a temporal frequency of 2 Hz. Stimuli were presented in pseudorandom order at four orientations (0°, 45°, 90°, or 135°) and 11 SFs (from 0.082 to 1.667 cpd with a 0.43 octave increment). Data were processed with the generalized indicator function method (Yokoo et al., 2001) and additionally smoothed with a low-pass Gaussian filter (SD: 100 μm). For each SF, the preferred orientation and the magnitude maps were calculated by the use of the vector sum method (Blasdel and Salama, 1986). For each orientation map, only pixels with the highest magnitude are shown (others appear in black). The magnitude threshold was defined as the average magnitude over all SFs in A17 and A18. Then, at each pixel, the SD of the preferred orientation over stimulus SF was calculated. The distributions of SDs in A17 and in A18 are shown in the histograms in B and C. On all figure maps, the white dashed line indicates A17/A18 border. Scale bar, 1 mm.
Then intrinsic signals related to each SF were considered separately. For each pixel, the modulation of the signal induced by the rotation of the gratings was interpolated via a least-squares method with a cosine function whose phase was equal to the preferred orientation at this pixel (Fig. 2, compare D, red arrow, B, three cortical locations) and whose frequency was equal to half the frequency of rotation. As a result, magnitude maps for preferred orientations were obtained for each stimulus SF (Fig. 2E). These maps are referred to as “maximal intensity maps” in the text. Pixels with negative values, which corresponded to interpolation peaking at orthogonal orientations, were rectified to zero. The same maps are normalized in Figure 2F. For this, values were rescaled for each pixel by setting the greatest value among all SFs to 100.
Finally, the location of the functional “border” between A17 and A18 was estimated based on the difference between the maximal intensity maps at 0.15 and 0.5 cpd (Bonhoeffer et al., 1995; Ohki et al., 2000). The TZ was defined with precision on the basis of the data obtained through GC activation in Figure 11G.
Determining the preferred spatial frequency.
Two methods were used to determine the preferred SF at each pixel. Maximum detection method selects the SF stimulus that leads to the strongest signal at each pixel. The second method interpolates the intrinsic signals at each pixel with a difference of Gaussians (DOG) function:
 |
where SFstim represents the SF of stimulation, A1 and A2 represent the amplitude of each Gaussian function, and σ1 and σ2 are related to the bandwidth of each Gaussian function. Values for A1, A2, σ1, and σ2 were optimized to provide a least-squares error fit to the data using Matlab (Fig. 2G).
At each pixel, the error-of-fit was defined by
 |
where S(SFstim) represents the values of the intrinsic signal for the SF of stimulation. It ranged between 0 (perfect fit) and 1 (worst fit).
Finally, two parameters were extracted from this interpolation: the preferred SF, which represents the peak of the tuning curve, and the “full-width at half-height” (FWHH), which was defined as the ratio between the highest and the lowest frequencies to which the pixel was at least half as responsive as it was to its preferred SF. The latter parameter was expressed in octaves. In A17, the FWHH of 97.7% of pixels could be calculated. In A18, this number dropped at 63.8% because of the low-pass nature of the responses.
Results
In previous experiments, SF organization was investigated by episodically presenting stimuli with different orientations and different SFs. Here, a new optical imaging protocol based on recent techniques (Kalatsky and Stryker, 2003) was developed. For each SF, the maximal amplitude of the signal induced by the continuous presentation of virtually all orientations was extracted. This protocol drastically reduced the recording time and allowed us to increase by a factor of four the number of SFs tested. SFs values spanned >6 octaves with only 0.2 octave resolution. Both high- and low-resolution optical imaging were used to map SF organization in extensive portions of visual cortex, including A17, A18, and the TZ.
A spatial frequency map in area 17
Figure 4 shows the organization of SF with a region of interest (ROI) in A17, also including a small part of A18 (Fig. 4A). Figure 4B represents the preferred orientation map, and Figure 4C the maximal intensity maps induced by the presentation of 30 SFs (Movie 1). While SFs between 0.274 to 1.937 cpd preferentially activated A17, SFs <0.274 cpd activated A18 more effectively. Responses to higher SFs were located in the posterior part of the ROI, and no responses could be evoked for SFs >2.252 cpd. In A17, the preferred SF map based on maximum detection (Fig. 4D) was composed of patches for the respective preferred SFs, suggesting a modular organization.
Movie 1.
Single-condition maps in A17. Single-condition maps for each SF of stimulation are shown sequentially for the same cat as in Figure 4. Each panel corresponds to one SF of stimulation, as in Figure 4C. Each frame corresponds to one orientation, as illustrated in Figure 2A. The speed is twice the speed of rotation.
To test the robustness of SF tuning at each cortical location, a DOG (see Materials and Methods) interpolation was performed at each pixel. The resulting map of the error-of-fit is represented in Figure 5A. It ranged between 0 (perfect fit) and 1 (worst fit). It was typically <0.5 (71% of the pixels here), but small domains with poorer error-of-fit were also sparsely distributed all over A17 (Fig. 5A, 1 and 2, top). Most of the latter domains corresponded to the so-called “orientation pinwheel centers” (Fig. 5A, 1 and 2, bottom), around which all orientation preferences are represented (Bonhoeffer and Grinvald, 1991). This was consistent in all animals: 92.7 ± 4.7% of pixels located within 25 μm from pinwheel centers, but only 28.5 ± 7.3% of pixels located further away had an error-of-fit >0.5 (paired t test, n = 6, p < 0.001). This shows that the preferred SF is not accurately determined around pinwheel centers with our optical imaging methods. Thus, those cortical regions with an error-of-fit >0.5 were eliminated from further analyses.
A preferred SF map determined with DOG interpolation is shown in Figure 5B. Within A17, its values ranged from 0.24 to 1.74 cpd [Fig. 5C; median 0.56 cpd ± 0.34 octave median absolute deviation (MAD)]. The median (±MAD) value of the FWHH was 2.41 ± 0.30 octaves; that is, almost 1 octave higher than the 1.5 octave FWHH obtained on average from cell recordings in A17 by Movshon et al. (1978). The preferred SF map exhibited a global anteroposterior gradient of ∼0.19 octave/mm with the highest SFs located posteriorly. In addition to this global SF gradient, the preferred SF also varied at a smaller spatial scale, manifesting a patchy organization. A closer view of this map in the right hemisphere is shown in the top panel of Figure 5D, and an SF profile along an anteroposterior axis appears in the bottom panel (over ∼3.3 mm). The preferred SF changed continuously, with local increases and decreases. However, when crossing pinwheel centers (where SF preference could not be calculated), the preferred SF could exhibit large changes (Fig. 5D) of ∼9.5 and −4.3 octaves/mm—much greater than the global anteroposterior gradient.
The periodic arrangement of the patches was obtained by subtracting slow varying components from the SF map in Figure 5B. This revealed local minima and maxima in the SF map (Fig. 6A). The 2D autocorrelation structure of this map (Fig. 6B) consisted of a quasi-periodic arrangement of local extrema (Paik and Ringach, 2011), with periods ranging between 0.79 mm in the mediolateral direction and 1.43 mm in the anteroposterior direction (Fig. 6B). The distribution of these extrema was additionally constrained by the layout of the orientation map (Fig. 6C). SF domains with local maxima were over-represented within 150 μm from pinwheel centers compared with those located further away (Mann–Whitney test, p < 0.001). By contrast, those with intermediate values were under-represented (Mann–Whitney test, p < 0.001). Finally, iso-orientation and iso-SF lines shown in Figure 6D tended to intersect preferentially for weak angles between 0° and 20° (see Fig. 9E; t test, p < 0.05). On the other hand, higher intersection angles with values between 60° and 90° were significantly under-represented (t test, p < 0.05). This indicates that these lines tend to run parallel to each other. This tendency was more prominent close to pinwheel centers (Fig. 6F; t test, p < 0.01).
Altogether, the results obtained with our new experimental procedure argue for the existence of a topographic organization for preferred SFs in cat A17 characterized by the coexistence of a global SF gradient and a regular arrangement of local patches.
High-pass filtering altered SF organization around pinwheel centers in previous studies
A striking feature of the SF maps in A17 obtained with this method is the representation of a large range of SFs around pinwheels. This strongly contrasts with previous studies showing that pinwheel centers were represented at cortical domains representing extreme SFs (Shoham et al., 1997; Issa et al., 2000). In these studies, the animal was stimulated episodically with various orientations and SFs, and Gaussian high-pass filtering was applied to remove spatially slow-varying artifacts from the image data. One implicit assumption of this method is that the zero baseline after subtraction of these artifacts is the same for each stimulus condition. This implies that the DC component subtracted by the high-pass filtering should be equal for each stimulus condition.
This implicit assumption was investigated in Figure 7A by plotting the average signal strength in A17 for data shown in Figure 4C for each stimulus SF. These values are proportional to the DC components subtracted with high-pass filtering methods. Indeed, since each orientation activates half of the cortical domains, the DC component is around half of the average signal strength. The resulting average signal strength is clearly anisotropic with respect to stimulus SF. It is at least two times higher for intermediate SFs at ∼0.45 cpd than for extreme SFs <0.2 or >1.27 cpd. As a consequence, the DC component subtracted by high-pass filtering varies with stimulus SF.
Figure 7.
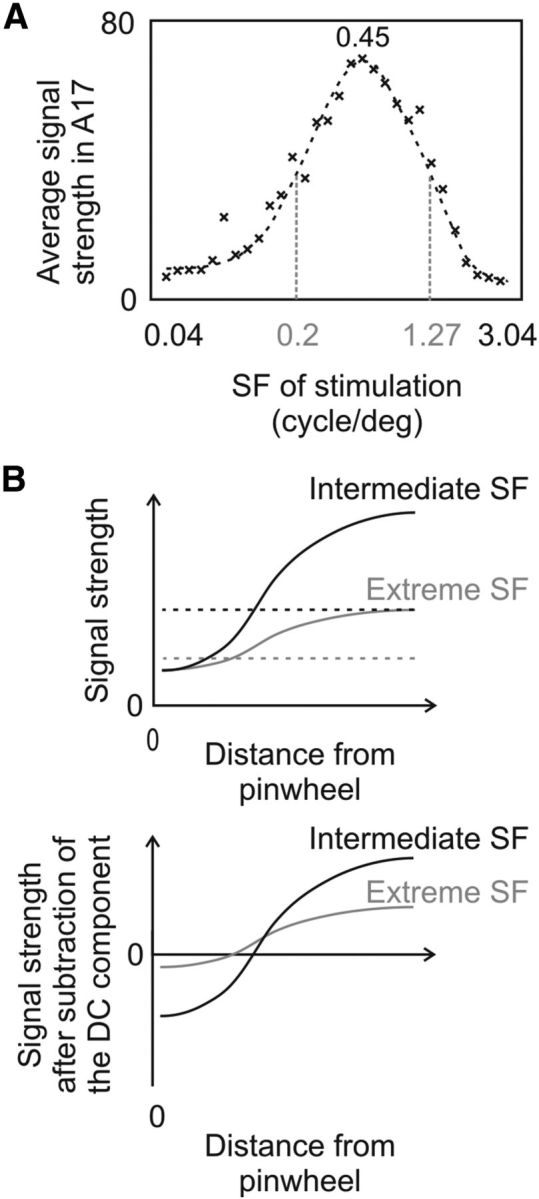
High-pass filtering alters SF organization around pinwheel centers. A, Average signal strength over A17 for data shown in Figure 4C for each stimulus SF. The DC components subtracted with a high-pass filtering method are approximately half of these values. B, Impact of DC component subtraction on SF organization. An idealized response is plotted along an iso-orientation line departing from a pinwheel (top) when the animal is stimulated with intermediate (black) and extreme (gray) SFs for the same orientation as the iso-orientation line. Close to the pinwheel center, the signal was assumed to be weak and of equal strength. The DC components for each SF are shown with dashed lines. The bottom shows the same responses when the DC component is subtracted. However, close to the pinwheel center, the extreme SF response dominates relative to the intermediate SF response.
Direct consequences on SF organization are illustrated in Figure 7B. In this example, we considered an iso-orientation line departing from a pinwheel and schematized in the top panel of Figure 7B the intrinsic signal in response to the optimal orientation of stimulation for intermediate-stimulus (black line) and extreme-stimulus (gray line) SFs. The signal at pinwheel was assumed to be weak. Indeed, a recent two-photon imaging study has shown that neurons located close to pinwheel centers have a weak response strength and that a large proportion of cells are unresponsive to an oriented, drifting grating (Ohki et al., 2006). For simplicity here, the signal at the pinwheel center was assumed to be of equal strength for the two curves. When their respective DC components (dashed lines) are subtracted, the response strength for intermediate SFs is underestimated compared with that of extreme SFs (Fig. 7B, bottom). In particular, close to pinwheel centers, extreme SF responses dominate over intermediate SF responses. This phenomenon can explain why pinwheel centers were preferentially located at domains of extreme SFs in previous studies (Shoham et al., 1997; Issa et al., 2000) and justifies the use of the present method for mapping SF representation with optical imaging techniques.
Alteration of functional maps through high-pass filtering is to be expected for all visual attributes with unequal representation. This also includes ocular dominance, since the contralateral eye is over-represented compared with the ipsilateral eye (Hubel and Wiesel, 1962); direction selectivity for which downward and temporal directions are more prominent (Ribot et al., 2008a); and even orientation selectivity, since cardinal orientations are over-represented compared with oblique orientations (Coppola et al., 1998; Imamura et al., 2006). The impact of this is crucial: signal strength of over-represented features is systematically underestimated around pinwheels centers when high-pass filtering is used.
A spatial frequency map in area 18
Next, SF organization in A18 was investigated (Fig. 8A). The orientation map (Fig. 8B) and the maximal intensity maps for 30 SFs (Fig. 8C; Movie 2) were recorded in the same way as for Figure 4. Some cortical domains were strongly activated by SFs <0.061 cpd, but only weakly by SFs >0.236 cpd (Fig. 8C, black arrows). These domains strongly contrasted with some other neighboring domains that responded inversely (Fig. 8C, white arrows), suggesting an organization for SF in A18. In fact, preferred SF maps based on the maximum detection (Fig. 8D) or the DOG interpolation analyses (Fig. 9B) both exhibited a modular organization. Similar to A17, cortical domains located near pinwheel centers exhibited a high error-of-fit (for examples, see Fig. 9E, 1 and 2). Indeed, the proportion of pixels located within 25 μm from pinwheel centers with an error-of-fit >0.5 (89.3 ± 4.5%) was much larger than the percentage of pixels located further away (14.8 ± 7.3%; paired t test, p < 0.001). As before, cortical regions with an error-of-fit >0.5 were excluded from further analysis.
Movie 2.
Single-condition maps in A18. Single-condition maps for each SF of stimulation are shown sequentially for the same cat as in Figure 8. Each panel corresponds to one SF of stimulation, as in Figure 8C. Each frame corresponds to one orientation, as illustrated in Figure 2A. The speed is twice the speed of rotation.
Confirming electrophysiological unit recordings in A18 (Movshon et al., 1978), preferred SFs ranged from 0.039 to 0.5 cpd (Fig. 9C; median 0.15 cpd ± 0.38 octave MAD), i.e., almost 2 octaves lower than those in A17. However, the median (±MAD) value of the FWHHs was 2.55 ± 0.25 octaves; that is, >1 octave higher than the 1.5 octave FWHH obtained on average from cell recordings in A18 (Movshon et al., 1978). The SF organization was composed of a global anteroposterior gradient of ∼0.19 octave/mm punctuated by local patches selective for different SFs. The organization was mostly continuous (Fig. 9D, bottom). However, across orientation pinwheel centers the preferred SF could shift dramatically (approximately −13.3, −4.7, 12.2, and −5.4 octaves/mm; Fig. 9D). The arrangement of local extrema in the autocorrelation map (Fig. 10B) was quasi-periodic, with periods ranging between 1.16 mm in the mediolateral direction and 1.83 mm in the anteroposterior direction. Cortical domains representing the local minima were over-represented within 150 μm from pinwheel centers (Fig. 10C; Mann–Whitney test, p < 0.001), while cortical domains with intermediate SF values were under-represented (Mann–Whitney test, p < 0.001). Finally, iso-orientation lines and iso-SF lines (Fig. 10D, red and blue lines, respectively) tended to run parallel to each other (Fig. 10E; t test, p < 0.05), especially at cortical regions close to pinwheel centers (Fig. 10F; t test, p < 0.01).
These results demonstrate the existence of an SF map in A18 whose organization strongly resembles that of A17.
The transition zone between A17 and A18 assures continuity through a specific SF gradient
The TZ corresponds to a cortical region of ∼1 mm width on the border between A17 and A18 (17/18 border; Figs. 4, 5, 6, 8, 9, 10, dashed white line). Figures 6A and 10A show that the SF representation in the TZ exhibits local extrema that reflect the patchy organization present in both A17 and A18. The SF representation in the TZ is additionally constrained by the very different ranges of SFs that activate the respective areas, implying the existence of yet another SF gradient to ensure the continuity between the two areas (Bonhoeffer et al., 1995; Issa et al., 2000; Ohki et al., 2000). But previous approaches did not permit this gradient to be precisely characterized. The TZ also occupies a strategic location since it represents the central vertical part of the visual field. It contributes to the unification of the two hemifields through the integration of retino-GC inputs with TC signals from the opposite hemisphere (Milleret et al., 2005; Rochefort et al., 2007; Bui Quoc et al., 2011). The following results concern investigation of the SF gradient at the TZ through independent stimulation of the GC and TC pathways in animals with section of the optic chiasm, permitting monocular stimulation of each pathway (Berlucchi and Rizzolatti, 1968).
The SF gradient in the TZ appeared from GC pathway stimulation (Fig. 11A–E), after stimulation of the right eye and exploring the right (Fig. 11A–E, top) hemisphere. The preferred SF maps defined with both the maximum detection method (Fig. 11C) and with the DOG interpolation (Fig. 11E) exhibited an abrupt change in SF at the 17/18 border. The SF map of another animal with GC stimulation through the left eye confirms this (Fig. 11F). The SF gradient at the 17/18 border was investigated in Figure 11G by plotting the preferred SFs along the 17/18 border, from 2 mm within A18 to 2 mm within A17 (Fig. 11E,F, white arrow in the hemisphere ipsilateral to the stimulated eye). The variation of the preferred SF (red line; ±MAD) could be well fitted with a sigmoid function (yellow dashed line, linear regression, r = 0.99) whose center peaked at 0.29 cpd (yellow dot). The region at which the slope of the sigmoid was maximal was defined as the TZ. It was ∼1.2 mm wide and ranged from 610 μm toward A18 to 610 μm toward A17. SF ranged accordingly from 0.13 to 0.67 cpd. The continuity in SF representation for the GC pathway is therefore ensured by an abrupt SF gradient of ∼2.2 octaves/mm.
Following TC pathway stimulation, responses were restricted to a band running from the posterior to the anterior parts of visual cortex, with a maximum width of ∼3 mm (Fig. 11A–E, pair of dash-dot white lines in the hemisphere contralateral to the stimulated eye). Within this band, the lowest SFs were represented laterally and anterior (near A18), while the highest SFs were confined medially and posterior (near A17). This tendency could be seen in SF preference maps from both the maximum detection method (Fig. 11C) and DOG interpolation (Fig. 11E). Within this band, only one-third of the pixels had an error-of-fit <0.5. These pixels had a median preferred SF value of 0.18 cpd ± 0.55 octave MAD. The TC activation also evoked a gradient of SF between A17 and A18. This is illustrated in detail in Figure 11H, where the preferred SFs are plotted over a region including the TZ and neighboring A17 and A18 (Fig. 11E,F, along the axis indicated by the white arrow in the hemisphere contralateral to the stimulated eye). The variation of preferred SF (red line, ±MAD) could be fitted with the same sigmoid function as in Figure 11G (yellow dashed line, linear regression, r = 0.98). This indicates that the TC pathway establishes the same SF gradient at the TZ as the GC pathway. But TC responses were not restricted to the TZ. They extended from 1390 μm in A18 to 390 μm in A17. Most of the activated pixels were located in the TZ (61.4%), as well as in A18 (35.6%), but only 2% were located in A17. This result is consistent with previous results (Houzel et al., 1994) showing that bouton terminals of callosal axons are present mainly in the TZ (78%) and A18 (21%), but are almost absent in A17 (1%). Moreover, since only a few TC units elicit spike activity in A18 (Milleret et al., 1994), intrinsic signals in this area are likely to reflect subthreshold activity.
Altogether, these data indicate that the GC and TC pathways establish the same SF gradient in the TZ. This gradient ensures continuity in the representation of SFs between A17 and A18 of the same hemisphere.
Principal component analysis
To better understand how cortical afferent pathways could give rise to these results, we compared them with the model proposed by Sirovich and Uglesich (2004). These authors showed that intrinsic signals in A17 can be fully explained as a linear combination of two SF channels representing X and Y geniculate inputs. This was tested here with a principal component analysis (PCA) of the SF response profile of more than half a million pixels obtained by calculating maximal intensity maps for 30 SFs in six animals. Contrary to Sirovich and Uglesich (2004), data not only from A17, but also from the TZ and/or A18, were analyzed. Indeed, although anatomical studies converge on the view that both X and Y cells do project to A17, several physiological studies have questioned the role of Y cell inputs to this area. For instance, Y cells typically respond to SFs <0.15 cpd, whereas cells in A17 do not (Movshon et al., 1978). Moreover, simple cells in the geniculate recipient layers of A17 typically lack the characteristics of Y cells in the dLGN, such as nonlinearity of spatial summation (Ferster and Jagadeesh, 1991). As a consequence, a description of the Y pathway based solely on A17 investigation should be viewed with caution. Instead, other cortical targets of Y geniculate cells should be considered, such as A18 and the TZ (Freund et al., 1985; Humphrey et al., 1985).
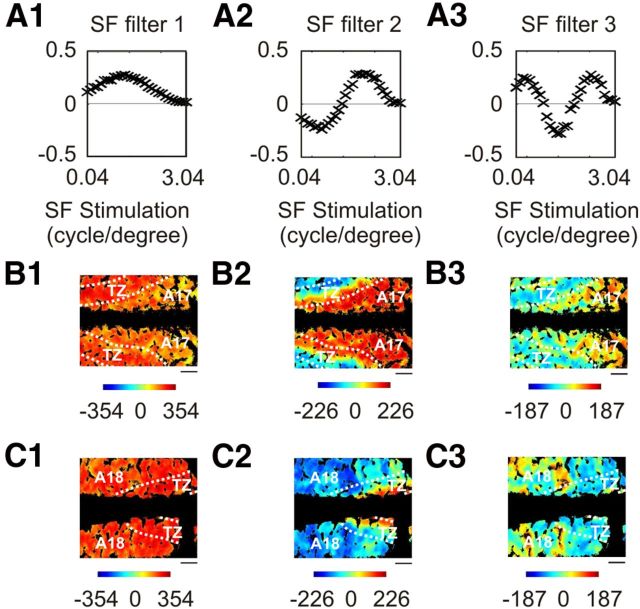
The three SF filters with the highest contributions in the PCA could explain 70.4, 16.6, and 3.4% of the total variability of the data (Fig. 12A). In contrast, each of the other SF filters typically explained approximately ≤1% of the variability of the data and exhibited noisy modulation. The latter SF filters were discarded from further analysis. As a result, in the orthogonal basis formed by the three remaining SF filters, the SF response profile of a pixel, |data〉, is simply expressed as follows:
where ci represents the contribution of the SF filter |SFfilteri〉 to the SF response profile |data〉 given by the inner product:
The contribution of each SF filter is illustrated in Figure 12, B and C, respectively, by taking data illustrated in Figures 4, 5, 6, 8, 9, and 10 as references. These contributions were also analyzed for each cortical area (Table 1, A). In this, c1 was always positive and constituted more than half of the contribution to A17, A18, and the TZ. In contrast, c2 was mostly positive in A17, mostly negative in A18, and could be of either sign in the TZ. Finally, c3 was biased toward positive values in A17 and A18, and toward negative values in the TZ.
Figure 12.
Principal component analysis of SF data. Data are from six animals where A17 and/or A18 were recorded. The first three SF filters are represented in A. Each SF filter is normalized and represented on a logarithmic scale. They represent 70.4% (A1), 16.6% (A2), and 3.4% (A3) of the total variability of the data, respectively. The contributions of each SF filter to maximal intensity maps shown in Figures 4C (A17) and 8C (A18) are shown in B and C, respectively. Scale bar, 1 mm.
Table 1.
Areal distribution of positive and negative contributions
| A17 |
A18 |
TZ |
|||||||
|---|---|---|---|---|---|---|---|---|---|
| >0 | <0 | Total | >0 | <0 | Total | >0 | <0 | Total | |
| A (%) | |||||||||
| c1 | 50.3 | 0 | 50.3 | 62.8 | 0 | 62.8 | 65.4 | 0 | 65.4 |
| c2 | 37.4 | 0.1 | 37.5 | 0.3 | 25.1 | 25.4 | 16.3 | 7.3 | 23.6 |
| c3 | 10.9 | 1.3 | 12.2 | 7.5 | 4.3 | 11.8 | 3.4 | 7.6 | 11.0 |
| B (%) | |||||||||
| cH | 84.2 | 0.0 | 84.2 | 10.1 | 5.3 | 15.4 | 52.9 | 0.7 | 53.6 |
| cL | 4.6 | 11.2 | 15.8 | 84.6 | 0.0 | 84.6 | 44.0 | 2.4 | 46.4 |
| C (%) | |||||||||
| cH | 53.8 | 0.0 | 53.8 | 9.4 | 2.1 | 11.5 | 33.7 | 1.1 | 34.8 |
| cL | 13.5 | 0.9 | 14.4 | 54.3 | 0.4 | 54.7 | 22.6 | 4.0 | 26.6 |
| cM | 2.3 | 29.5 | 31.8 | 15.9 | 17.9 | 33.8 | 27.8 | 10.8 | 38.6 |
Since in PCA each eigenvector is orthogonal to the others, the resulting SF filters have no direct translation to identified neurons in the dLGN. For instance, X and Y cells respond to overlapping ranges of SFs (Lehmkuhle et al., 1980) despite their differences in high and low SF selectivity. Their tuning curves are thus not orthogonal to each other and surpassing this orthogonality constraint is necessary to interpret these results in terms of the respective influences of the various geniculate afferents to the visual cortex. As developed below, this can be done by defining an oblique coordinate system in which the new SF filters (1) will take positive values, as would be expected from the responses of a geniculate cell that transmits information to the visual cortex; and (2) will be well described by a DOG function. Indeed, this function also provides a good estimate of the SF tuning of geniculate cells (Dawis et al., 1984).
Model based on the first two spatial frequency filters
In this first model, we excluded the third SF filter, which represented only 3.4% of the total variance. This enabled a direct comparison with the Sirovich and Uglesich (2004) model for calculating two basis vectors representing higher and lower SFs from the dominant SF filters.
A18 receives mainly Y geniculate inputs (Freund et al., 1985; Humphrey et al., 1985), while A17 is also innervated by X cells (Humphrey et al., 1985). As a result, A17 and A18 differ in the proportions of Y and X cell inputs from the dLGN. Since X cells are more selective for high SFs, and Y cells to low SFs (Derrington and Fuchs, 1979; Lehmkuhle et al., 1980; Troy, 1983), A17 and A18 differ in the low and the high SF components that optimally activate each area. The second SF filter reflects these properties: lower SF components are dominant in A18, while higher SF components are dominant in A17. We therefore inferred that this SF filter reflects the difference between higher and lower SF components. In contrast, since the contribution of the first SF filter was positive in A17 and A18, we assumed this vector to reflect the sum of higher and lower SF components. In consequence, we defined two basis vectors corresponding to higher and lower SF filters as follows:
 |
and
 |
where NH(αH) = and NL(αL) = are the normalization factors, with parameters αH and αL taking positive values.
Note that |H(αH)〉 and |L(αL)〉 determine an oblique coordinate system, where the orthogonality of the vectors is restored if and only if αHαL = 1. Using thus defined oblique basis vectors, the contribution of each vector to the dataset is given by the coefficients cH(αH,αL) and cL(αH,αL) of the equation:
 |
and are simply expressed as
 |
 |
where c1 and c2 were defined in Equation 3.
We searched for values of αH and αL such that |H(αH)〉 and |L(αL)〉 were best fitted by a DOG function. Figure 13A shows the resulting least-squares error following the interpolation. In Figure 13B, |H(αH)〉 and |L(αL)〉 were plotted for representative values of αH and αL. The best fit was obtained for αH = 0.65 and αL = 0.44 (Fig. 13A, red dots). For these parameters, |H(αH)〉 and |L(αL)〉 had maximum values at 0.43 and 0.12 cpd, respectively, and bandwidths of 2.88 and 3.12 octaves (Fig. 13B, red curves). These values differ markedly from those obtained by Sirovich and Uglesich (2004), who found maxima at 1.25 and 0.41 cpd, respectively. But our results better reflect the typical optimum contrast sensitivities of X and Y cells. Indeed, the average optimum contrast sensitivity of X cells varies from 0.7 cpd at retinal eccentricity of <5° to ∼0.3 cpd at retinal eccentricities between 15° and 20° (Troy, 1983). For Y cells, these are significantly lower (0.3 and 0.09 cpd, respectively; Troy, 1983). The peak values found for |H〉 and |L〉 are thus in the range of values that yield optimum contrast sensitivities for X and Y cells. It is therefore reasonable to assume that these vectors reflect average inputs from X and Y cells in our region of interest.
Figure 13.
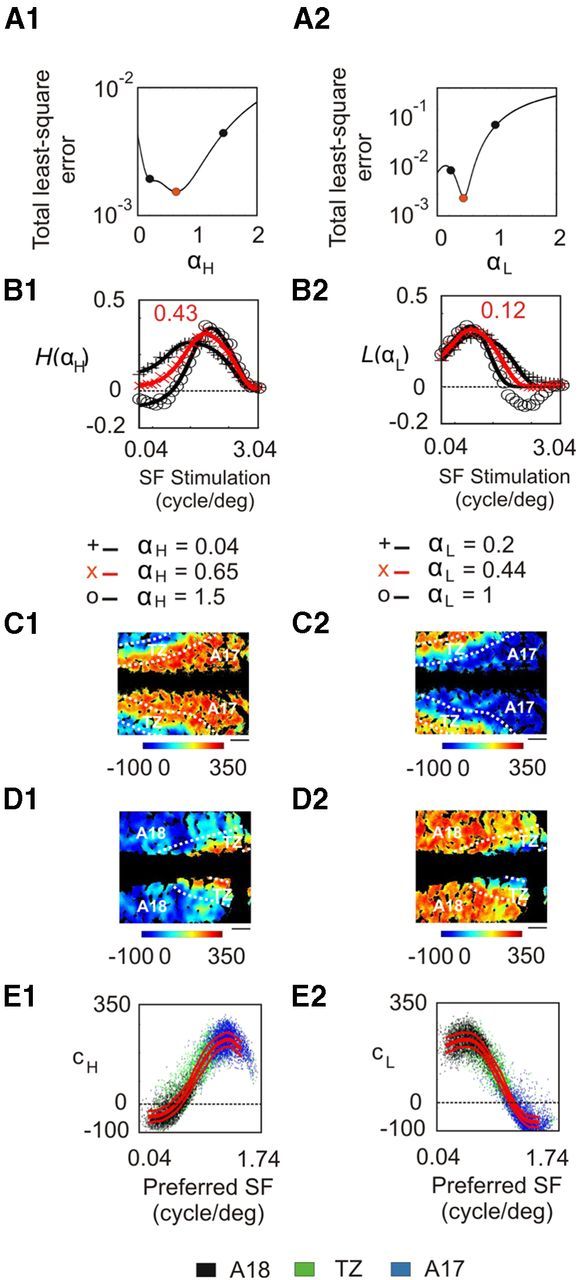
Model based on the first two SF filters. These filters were rearranged and tested in A1 and A2 for different values of αH and αL in Equations 5 and 6. The resulting |H〉 and |L〉 vectors are shown in B1 and B2 for three characteristic values of αH and αL, which are represented as filled circles in A1 and A2. Red curves correspond to the lowest error values with DOG interpolation. The contributions of the |H〉 and |L〉 vectors (Eqs. 8 and 9) to the data in Figures 4 (A17) and 8 (A18) appear in C and D, respectively. E, Representation of the contributions of |H〉 and |L〉 vectors with respect to the preferred SF. Dots correspond to pixels chosen randomly from data from all animals. The three red curves represent the median value ± MAD. Scale bar, 1 mm.
cH and cL are illustrated in Figure 13, C and D, for the same animals as in Figure 12. These contributions differ markedly with respect to the preferred SF (Fig. 13E), as well as between areas 17 and 18 (Table 1, B). cH gradually increased with preferred SF (Fig. 13E1). In A17, it was positive and largely dominated relative to cL. In A18, it was weak and could be of either sign (Table 1, B). By contrast, cL decreased with preferred SF (Fig. 13E2), and constituted most of the contribution to A18. cL did not exceed 16% in A17, which is drastically different from the results obtained by Sirovich and Uglesich (2004), who found that |H〉 and |L〉 vectors contributed equally at each pixel in A17. Instead, our results support the view that the contributions of |H〉 and |L〉 are largely dominant in A17 and A18, respectively.
Limits of the model and inclusion of the third spatial frequency filter
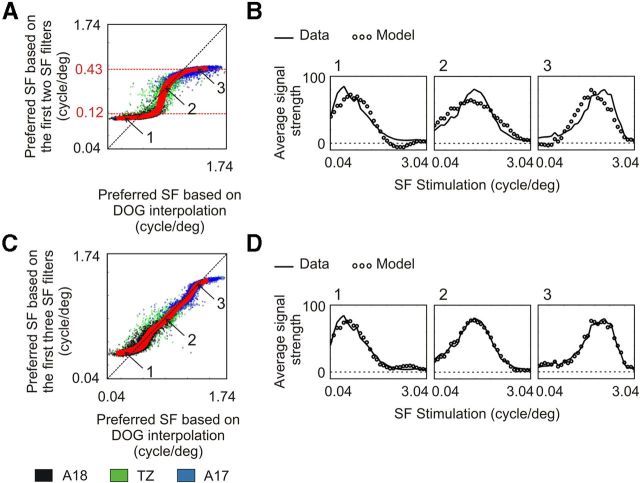
Next, the third SF filter represented in Figure 12A3 was included in the model. Although this component explained only 3.4% of the total variance of the data, it had a great impact on the calculation of preferred SF in A17 and A18. As shown in Figure 14A, when considering only the first two SF filters, a clear mismatch could be observed in the determination of the preferred SF (linear regression, r = 0.66). Preferred SF values hardly exceeded 0.43 cpd and were typically >0.12 cpd, which are the values imposed by the peaks of |H〉 and |L〉 vectors. Three representative examples are shown in Figure 14B for cortical domains preferring SFs around 0.07 (1), 0.25 (2), and 0.71 (3) cpd. In each case, the average signal strength is shown with respect to stimulus SF for optical imaging data (full line) and the model (circles). A clear mismatch can be observed between the two curves (linear regression, r = 0.84, 0.77, and 0.84, respectively).
Figure 14.
Limits of the model based on the first two SF filters. A, Relationship between the preferred SF calculated from the two first SF filters and the preferred SF based on DOG interpolation. Dots correspond to pixels chosen randomly from data from all animals. The three red curves represent the median value ± MAD. B, Three representative examples for domains preferring SFs around 0.07 (1), 0.25 (2), and 0.71 (3) cpd. In each case, the average tuning curves for optical imaging data (continuous line) and the model (circles) are plotted as a function of SF. C, Relationship between the preferred SF calculated from the three first SF filters and the preferred SF based on DOG interpolation. The tuning curve for the same cortical domains as in B are shown in D for optical imaging data (continuous line) and the model (circles).
In contrast, when the third SF filter was added, a better match could be obtained in the determination of preferred SF (Fig. 14C; linear regression, r = 0.91). The tuning curves (Fig. 14D) for the same representative domains as in Figure 14B this time closely resembled each other (linear regression, r = 0.96, 0.99, and 0.98, respectively), although a small deviation in preferred SF could still be observed for pixels preferring extreme SFs (Fig. 14D, left). This indicates that an accurate model must include this component.
Model based on the first three spatial frequency filters
The third SF filter had three peaks (Fig. 12A3), suggesting that the addition of another basis vector with a DOG shape in the model could explain it. We denote this vector |M〉. As in the previous section, |H〉, |L〉, and |M〉 were assumed to be equal to the weighted sum of the SF filters represented in Figure 12A, following the equation:
 |
where N(α2, α3) = is the normalization factor with α2 and α3 taking either positive or negative values.
|H(α2, α3)〉, |L(α2, α3)〉, and |M(α2, α3)〉 were hypothesized to be well fitted with a DOG function, and we searched for optimal combinations of filters and weighting coefficients as solutions for this problem. Figure 15A shows the total least-squares error following DOG interpolation for different values of α2 and α3. Four local minima, represented in Figure 15B–E, could be found for only three solutions. Two local minima (Fig. 15B,C) correspond to the |H〉 and |L〉 vectors found in the previous section. For these vectors, the values of α2 were similar (α2 = 0.61 and α2 = −0.51, respectively), while α3 was weak (α3 = −0.04 and α3 = 0.05, respectively). Consequently, the representations of |H〉 and |L〉 (Fig. 15B,C) resemble the ones obtained in the previous model: their maxima are 0.41 and 0.11 cpd, respectively, and their bandwidths are 2.91 and 2.98 octaves. The two other local minima (Fig. 15D,E) correspond to two vectors denoted |M〉 and |M′〉. The vector |M〉 (Fig. 15D) has a maximum at 0.22 cpd and a bandwidth slightly lower than the one obtained for the |H〉 and |L〉 channels (2.67 octaves). The vector |M′〉 (Fig. 15E), on the other hand, peaks at 0.13 cpd and is only weakly selective for SF with a bandwidth of >5.1 octaves.
Figure 15.
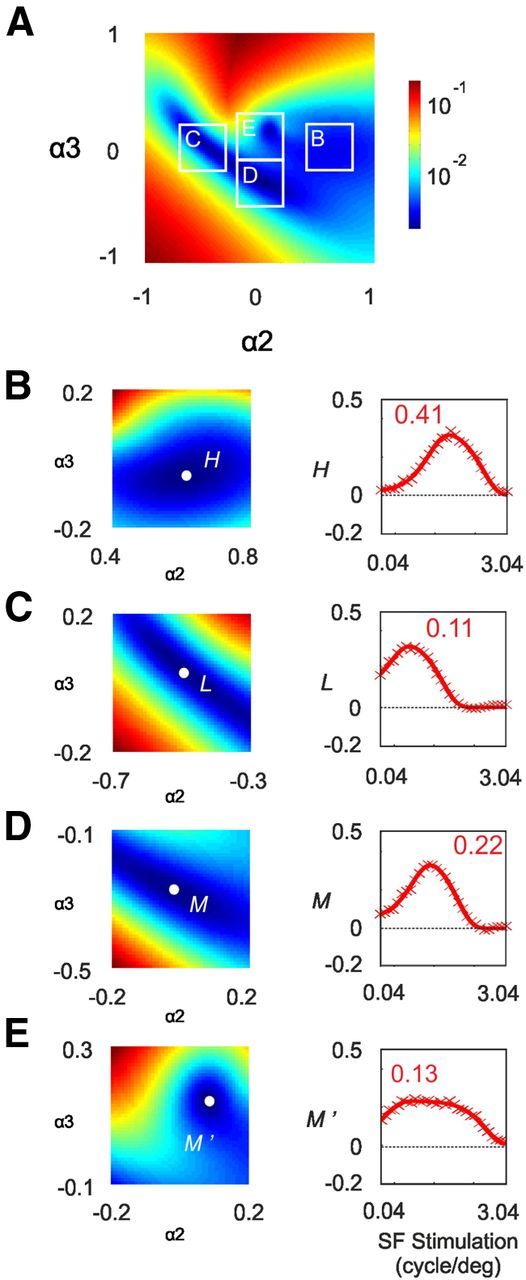
Characterization of the model based on the first three SF filters. A, Least-squares error following DOG interpolation plotted for different values of α2 and α3 in Equation 10. Scale is logarithmic. B–E, The least-squares error around the four local minima are enlarged and rescaled in the left panels. In the right panels, the four solutions |H〉, |L〉, |M〉, and |M′〉 are represented. Inset numbers are peak values of SF.
First, we considered the basis formed by the vectors |H〉, |L〉, and |M〉, represented in Figure 16A, to be a parsimonious yet comprehensive solution of the problem. Note that these vectors, as in the model when only the two first SF filters were retained, are simply a transcription of the three first SF filters. Altogether, they still explain 90.4% of the total variability of the data. These three vectors determine an oblique coordinate system, and their contributions cH, cL, and cM follow the equation:
These contributions are illustrated in Figure 16, B and C, for the same data as in Figures 4 and 8. cH and cL were slightly modified compared with Figure 13. cH decreased with respect to preferred SF between 0.04 and 0.18 cpd (Fig. 16D1), then increased and reached its maximum for the highest SFs. In A17, it was positive, and constituted half of the total contribution (Table 1, C), that is, ∼30% less than in the model when only the two first SF filters were retained. cL first decreased with preferred SF between 0.04 and 0.36 cpd (Fig. 16D2), then increased again. In A18, it was positive and dominated over cH and cM, but, here again, with a 30% loss compared with the previous model (Table 1, B and C). The decrease of cH and cL values in A17 and A18 was compensated by the contribution of the |M〉 vector that represented one-third of the total contribution in each area. But while cM was negative in A17, it could have either sign in A18. Figure 16D3 shows that cM had a positive maximum for SFs around 0.23 cpd, and decreased for cortical domains preferring lower and higher SFs. In the TZ, cM was biased toward positive values, with 10.8% of the 38.6% total contribution being negative. In this area, the other two-thirds of the total contribution were constituted mostly by positive values of cH and cL.
Figure 16.
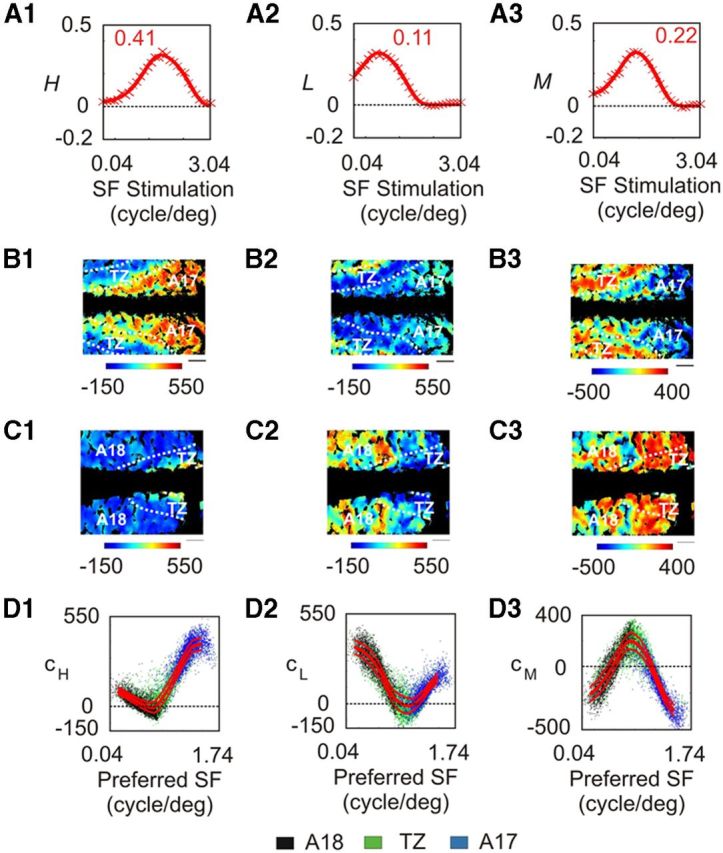
Contribution of the |H〉, |L〉, and |M〉 vectors to optical imaging data. A, Representation of the |H〉, |L〉, and |M〉 vectors from left to right. The contributions of each vector to data in Figures 4 (A17) and 8 (A18) appear in B and C, respectively. D, Representation of the contributions of |H〉, |L〉, and |M〉 vectors with respect to preferred SF. Dots correspond to pixels chosen randomly from data from all animals. The red curves represent the median value ± MAD. Scale bar, 1 mm.
A similar analysis was performed when the vectors |H〉, |L〉, and |M′〉 were considered as solutions of the problem (Fig. 17). But in that case the contribution of |H〉 for pixels preferring the highest SFs in A17 was negative (Fig. 17D1). This contradicts the accepted notion that X geniculate cells send excitatory inputs to this area. Thus, this basis is not coherent with the present data.
Figure 17.
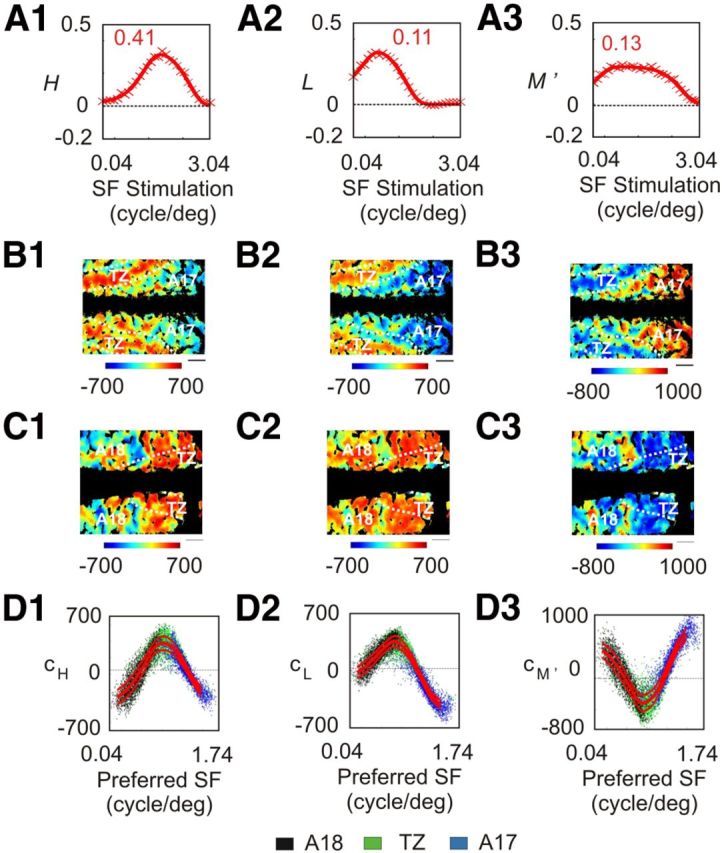
Contribution of the |H〉, |L〉, and |M′〉 vectors to optical imaging data. A–D, Same analysis as in Figure 16 on the basis formed by the three vectors |H〉, |L〉, and |M′〉. Scale bar, 1 mm.
Altogether, this model shows that in SF maps in A17, A18, and the TZ, 90.4% can be explained by positive and negative contributions of three basis vectors with a DOG shape, |H〉, |L〉, and |M〉.
Discussion
In this study, our newly developed stimulation paradigm characterized the organization of SF responses in cat primary and secondary visual cortex at an unprecedentedly fine resolution. A PCA and comparison of models with the data revealed that three distinct SF channels, having positive or negative contributions, are necessary to develop an optimal solution explaining the SF maps in A17, A18, and the TZ in a manner coherent with anatomical and electrophysiological data. The results are interpreted in relation to current knowledge about X and Y geniculate afferent inputs to the visual cortex.
Existence of spatial frequency maps in visual cortex
Our results demonstrate unequivocally that SF is tangentially organized in cat visual cortex. The organization is similar in A17 and A18 despite the very different ranges of SFs that activate each area. It is characterized by the coexistence of a global anteroposterior gradient and local patches typical of the representation of other visual attributes such as orientation. In A17, the existence of such patches is consistent with previous optical imaging studies (Shoham et al., 1997; Everson et al., 1998; Issa et al., 2000; Mallik et al., 2008; Tani et al., 2012). In A18, the present study extends and provides further detail to the recent observation that SFs of 0.15, 0.08, and 0.04 cpd preferentially activate different cortical locations (Tani et al., 2012).
Paradoxically, our results are also in accordance with the view that the preferred SF of individual cells is weakly clustered within columns. Previous unit recordings among neighboring neurons have indeed shown that preferred SF is less similar than are other properties, such as preferred orientation (Tolhurst and Thompson, 1982; DeAngelis et al., 1999). As a result, the range of SFs that activate a population of neighboring neurons should be wider than that of individual neurons. Accordingly, we show that the median full-width at half-height for SF selectivity with optical imaging is 1 octave higher than the one found at the level of individual cells.
The TZ reveals an SF map that differs from those of A17 and A18. It is restricted to a narrow band of ∼1.2 mm running all along the 17/18 border. It includes a specific SF gradient whose value is 11 times greater than the global anteroposterior gradients found in A17 and A18. This gradient involves inputs from both the GC and the TC pathways.
Spatial frequency and orientation maps underlie the same functional architecture
The layout of SF maps is constrained to that of orientation maps. A17 and A18 exhibit a regular arrangement of local extrema of SF responses with characteristic periods on the scale of those of orientation maps. We also show that cortical domains locally representing intermediate SFs are under-represented close to orientation pinwheel centers. This agrees with previous observations that cortical domains with extreme SFs are preferentially located close to pinwheel centers (Shoham et al., 1997; Issa et al., 2000). However, we found this tendency to be weak, with only high SFs exhibiting this property in A17, and only low SFs in A18. Rather, instead of being located at the center of a patch representing extreme SFs, our data indicate that pinwheels are preferentially located close to a fracture where SF changes abruptly and around which a large range of SFs is represented.
These results have consequences with regard to the independence of orientation and SF maps. The traditional view is that the layout of cortical maps are organized such that lines of iso-properties tend to run perpendicular to each other (Hübener et al., 1997; Yu et al., 2005; Farley et al., 2007). Such a relationship is regarded as a way to achieve uniform coverage, so that all combinations of respective parameters are equally represented across the cortical surface (Swindale et al., 2000). A model with orientation pinwheel centers located at the center of domains coding for extreme SFs is consistent with this view (Issa et al., 2000, 2008). In contrast, our data indicates that iso-orientation and iso-SF lines tend to run parallel to each other. This suggests instead that orientation and SF maps in the cat are not independently disposed, but rather would share a common functional architecture. Furthermore, the colinearity between iso-orientation and iso-SF lines was especially strong close to orientation pinwheel centers, suggesting that pinwheels themselves are common organizers for the two maps. Altogether, our data indicate that the layouts of orientation and SF maps are not independent, but rather share common organizing principles.
Representation of spatial frequency at orientation pinwheel centers
Several interpretations can be given to the colocalization of pinwheel centers with domains of high error-of-fit in the SF map. First, cortical domains around these singular points could be unselective to stimulus SF and no map of preferred SF would exist there. Instead, these locations could be selective to more complex features and thus not well described by the two distinct parameters representing preferred orientation and preferred SF. This idea is supported by a recent two-photon imaging studies showing a large percentage of unresponsive cells to oriented, drifting gratings close to pinwheels (Ohki et al., 2006). This interpretation recalls the suggestion of Basole et al. (2003) that separable cortical maps representing preferred orientation and preferred SF (as well as speed) were not sufficient to predict the preferred orientations within a complex stimulus composed of drifting, oriented textures. Instead, they argued that a single map of spatiotemporal energy was required to understand responses to complex stimuli. Although further theoretical studies could reconcile the latter results with the classical view of separate sets of cortical maps (Baker and Issa, 2005; Mante and Carandini, 2005; Zhang et al., 2007), the lack of SF representation and poor orientation selectivity around pinwheels (Ohki et al., 2006) could reflect a selectivity for more complex features. Further investigations using electrophysiology or two-photon imaging would be necessary to finely evaluate neuronal properties at these cortical locations.
Another interpretation is that SF is represented around pinwheel centers, but the signal-to-noise ratio is too weak to accurately determine SF preference. Neurons located close to pinwheels have a weak response strength to drifting, oriented gratings, and many of them are unresponsive (Ohki et al., 2006). This indicates that intrinsic signal strength should also be low at pinwheels. Noise might thus dominate, rendering determination of the preferred SF difficult. As shown in Figure 7, this low intrinsic signal strength at pinwheel centers also has consequences for the determination of a preferred SF in previous optical imaging experiments (Shoham et al., 1997; Issa et al., 2000).
A functional dichotomy of X and Y geniculate afferents
To understand which afferent pathways may give rise to these SF maps, we developed a model based on the PCA results. This supports the view that intrinsic signals in response to several SFs can be largely explained as the linear summation of three orthogonal SF filters representing altogether 90.4% of the total variability of the data. To directly compare our model to the one proposed by Sirovich and Uglesich (2004), the two SF filters with the highest contribution were first rearranged to obtain the two basis vectors |H〉 and |L〉, representing higher and lower SF components. The peak values of these vectors were consistent with representations of average inputs from X and Y geniculate cells. We show that the |H〉 and |L〉 channels exhibit a functional dichotomy in A17 and A18, respectively.
Historically, the issue of whether both X and Y cell channels converge onto A17 or are segregated to A17 and A18 has been a subject of intense debate. In particular, physiological data are controversial (for review, see Ferster and Jagadeesh, 1991, introduction). Previous optical imaging studies have interpreted the existence of an organized distribution of SF in A17 (Shoham et al., 1997; Issa et al., 2000) or its nonexistence (Sirovich and Uglesich, 2004) as the result of tangential distributions of X and Y excitatory inputs from the dLGN. Instead, our results support the view that these inputs are segregated to A17 and A18, respectively. The X-type input from the |H〉 channel largely dominates the Y-type input from the |L〉 channel in this area. This model thus argues for a poor innervation of A17 by the Y pathway, and this is reflected by the poor activation of A17 by low SFs.
What is the role of Y pathway afferents to area 17?
However, anatomical data present a consensus that A17 is equally innervated by both X and Y geniculate cells (Ferster and LeVay, 1978; Freund et al., 1985; Humphrey et al., 1985). But our version of the two-channel model fails to find a role for Y cell inputs to this area. To resolve this, a third SF filter resulting from the PCA was added to the model. Although this SF filter represents only 3.4% of the total variability of the data, it was essential to allow SF representations >0.43 cpd in A17 and <0.12 cpd in A18, that is, beyond the limits imposed by the identified afferent inputs X and Y to A17 and A18.
We show that this SF filter could simply be transformed into a third SF-dependent channel |M〉 with a profile similar to |H〉 and |L〉, but with intermediate preferred SFs. Assuming this channel arises from a subtype of Y cells resolves the problem of the role of Y cell inputs to A17. Indeed, the Y-type representation in A17 would then amount to 14.4% from the |L〉 channel and 31.8% from the |M〉 channel (Table 1, C), i.e., a total of 46.2%. This value is more consistent with the equal innervation from X and Y geniculate cells. But the model predicts that the nature of this Y-type input is mainly suppressive (30.2% of 46.2%), which would explain why some physiological studies have failed to observe any Y-type properties in A17 cells. On the other hand, A18 would still receive dominant Y-type inputs (88.5%), mostly excitatory (70.2%), which agrees with both anatomical and physiological findings.
This view that a subtype of Y cells is responsible for the |M〉 channel is supported by recent experiments in macaque monkey showing that the Y pathway arises from two types of ganglion cells, the parasol cells and the smooth mono-stratified cells, which display distinctive properties (Crook et al., 2008). Future studies should investigate whether these different subtypes of geniculate Y cells have different functional properties and patterns of projections to the visual cortex.
Feedforward versus recurrent models
Two main classes of models currently explain how neural properties emerge in primary visual cortex (for review, see Ferster and Miller, 2000). The feedforward models suggest that cortical tuning arises from the arrangement of thalamic inputs. In contrast, recurrent models give only a minor role to thalamic afferents and focus on intracortical interactions. The view that preferred SF is largely explained as the linear combination of three geniculate streams supports the feedforward models, although suppression from the |M〉 channel would likely be relayed through cortical interneurons (Hirsch et al., 2003).
This model also explains SF representation in the TZ. This view might seem to conflict with the observation that the corpus callosum, a corticocortical connection, also contributes to SF representation in this area. But the present results show that the SF gradient imposed by the corpus callosum simply matches the one observed through GC activation. As such, CC inputs might not be essential for the emergence of SF selectivity and may simply reinforce the selectivity imposed by GC activation.
Still, we cannot exclude the fact that other intracortical connections, either intra-areal or from different visual cortical areas, might refine SF selectivity. For instance, feedback connections from area 21a have been shown to modulate SF-dependent signals in cat A17 and A18 (Huang et al., 2004). Therefore, despite the apparent simplicity of this model, the contributions of the three channels are unlikely to solely reflect direct feedforward input from the dLGN. Furthermore, it remains possible that the |M〉 channel could simply reflect SF refinement through recurrent connections. However, in that case, the role of Y geniculate cells input to A17 would remain unexplained.
Implication for the generation of spatial frequency preference
Previous studies in cat and monkey based on reverse correlation techniques have revealed that the preferred SF of neurons in A17 is rapidly shifted toward the highest SFs over the duration of the response (Bredfeldt and Ringach, 2002; Nishimoto et al., 2005; Ninomiya et al., 2012). Several models have been proposed to explain this, including suppressive effects at low SFs through intracortical inhibition (Bredfeldt and Ringach, 2002; Ninomiya et al., 2012). Our data are consistent with this, through suppression by the |M〉 channel for SF representation >0.43 cpd in A17. Interestingly, the same would hold true for the representation of low SFs <0.12 cpd in A18, achieved though the suppression of high SFs by the |M〉 channel. One consequence is that this model could be easily tested by studying SF dynamics for neurons preferring low SFs.
Our model shows the importance of a third SF-dependent channel for explaining SF representation in the cat visual cortex. The principle of a third channel may hold true for higher visual areas. It may also be profitably applicable in other species, including humans, for which more than two SF channels has been proposed for the process of visual recognition in psychophysics experiments (Watson and Robson, 1981).
Footnotes
This research was supported by the Fondation Louis D. (to C.M. and J.R.), Rétina France (to C.M.), the European Community (Marie Curie International Reintegration Grant), the Fondation Berthe Fouassier (to J.R.), and the Fondation des Aveugles de France (to Y.A.). We thank Chloé Chenêt for animal care, and Drs. Sidney Wiener and Shigeru Tanaka for constructive comments on this manuscript.
The authors declare no competing financial interest.
References
- Baker TI, Issa NP. Cortical maps of separable tuning properties predict population responses to complex visual stimuli. J Neurophysiol. 2005;94:775–787. doi: 10.1152/jn.01093.2004. [DOI] [PubMed] [Google Scholar]
- Basole A, White LE, Fitzpatrick D. Mapping multiple features in the population response of visual cortex. Nature. 2003;423:986–990. doi: 10.1038/nature01721. [DOI] [PubMed] [Google Scholar]
- Berlucchi G, Rizzolatti G. Binocularly driven neurons in visual cortex of split-chiasm cats. Science. 1968;159:308–310. doi: 10.1126/science.159.3812.308. [DOI] [PubMed] [Google Scholar]
- Bishop PO, Kozak W, Vakkur GJ. Some quantitative aspects of the cat's eye: axis and plane of reference, visual field co-ordinates and optics. J Physiol. 1962;163:466–502. doi: 10.1113/jphysiol.1962.sp006990. [DOI] [PMC free article] [PubMed] [Google Scholar]
- Blasdel GG, Salama G. Voltage-sensitive dyes reveal a modular organization in monkey striate cortex. Nature. 1986;321:579–585. doi: 10.1038/321579a0. [DOI] [PubMed] [Google Scholar]
- Bonhoeffer T, Grinvald A. Iso-orientation domains in cat visual cortex are arranged in pinwheel-like patterns. Nature. 1991;353:429–431. doi: 10.1038/353429a0. [DOI] [PubMed] [Google Scholar]
- Bonhoeffer T, Kim DS, Malonek D, Shoham D, Grinvald A. Optical imaging of the layout of functional domains in area 17 and across the area 17/18 border in cat visual cortex. Eur J Neurosci. 1995;7:1973–1988. doi: 10.1111/j.1460-9568.1995.tb00720.x. [DOI] [PubMed] [Google Scholar]
- Bredfeldt CE, Ringach DL. Dynamics of spatial frequency tuning in macaque V1. J Neurosci. 2002;22:1976–1984. doi: 10.1523/JNEUROSCI.22-05-01976.2002. [DOI] [PMC free article] [PubMed] [Google Scholar]
- Bui Quoc E, Ribot J, Quenech'du N, Doutremer S, Lebas N, Grantyn A, Aushana Y, Milleret C. Asymmetrical interhemispheric connections develop in cat visual cortex after early unilateral convergent strabismus: anatomy, physiology, and mechanisms. Front Neuroanat. 2011;5:68. doi: 10.3389/fnana.2011.00068. [DOI] [PMC free article] [PubMed] [Google Scholar]
- Coppola DM, White LE, Fitzpatrick D, Purves D. Unequal representation of cardinal and oblique contours in ferret visual cortex. Proc Natl Acad Sci U S A. 1998;95:2621–2623. doi: 10.1073/pnas.95.5.2621. [DOI] [PMC free article] [PubMed] [Google Scholar]
- Crook JD, Peterson BB, Packer OS, Robinson FR, Gamlin PD, Troy JB, Dacey DM. The smooth monostratified ganglion cell: evidence for spatial diversity in the Y-cell pathway to the lateral geniculate nucleus and superior colliculus in the macaque monkey. J Neurosci. 2008;28:12654–12671. doi: 10.1523/JNEUROSCI.2986-08.2008. [DOI] [PMC free article] [PubMed] [Google Scholar]
- Dadvand L, Stryker MP, Frank MG. Sleep does not enhance the recovery of deprived eye responses in developing visual cortex. Neuroscience. 2006;143:815–826. doi: 10.1016/j.neuroscience.2006.08.029. [DOI] [PMC free article] [PubMed] [Google Scholar]
- Dawis S, Shapley R, Kaplan E, Tranchina D. The receptive field organization of X-cells in the cat: spatiotemporal coupling and asymmetry. Vision Res. 1984;24:549–564. doi: 10.1016/0042-6989(84)90109-3. [DOI] [PubMed] [Google Scholar]
- DeAngelis GC, Ohzawa I, Freeman RD. Spatiotemporal organization of simple-cell receptive fields in the cat's striate cortex. I. General characteristics and postnatal development. J Neurophysiol. 1993;69:1091–1117. doi: 10.1152/jn.1993.69.4.1091. [DOI] [PubMed] [Google Scholar]
- DeAngelis GC, Ghose GM, Ohzawa I, Freeman RD. Functional micro-organization of primary visual cortex: receptive field analysis of nearby neurons. J Neurosci. 1999;19:4046–4064. doi: 10.1523/JNEUROSCI.19-10-04046.1999. [DOI] [PMC free article] [PubMed] [Google Scholar]
- Derrington AM, Fuchs AF. Spatial and temporal properties of X and Y cells in the cat lateral geniculate nucleus. J Physiol. 1979;293:347–364. doi: 10.1113/jphysiol.1979.sp012893. [DOI] [PMC free article] [PubMed] [Google Scholar]
- Everson RM, Prashanth AK, Gabbay M, Knight BW, Sirovich L, Kaplan E. Representation of spatial frequency and orientation in the visual cortex. Proc Natl Acad Sci U S A. 1998;95:8334–8338. doi: 10.1073/pnas.95.14.8334. [DOI] [PMC free article] [PubMed] [Google Scholar]
- Farley BJ, Yu H, Jin DZ, Sur M. Alteration of visual input results in a coordinated reorganization of multiple visual cortex maps. J Neurosci. 2007;27:10299–10310. doi: 10.1523/JNEUROSCI.2257-07.2007. [DOI] [PMC free article] [PubMed] [Google Scholar]
- Ferster D, Jagadeesh B. Nonlinearity of spatial summation in simple cells of areas 17 and 18 of cat visual cortex. J Neurophysiol. 1991;66:1667–1679. doi: 10.1152/jn.1991.66.5.1667. [DOI] [PubMed] [Google Scholar]
- Ferster D, LeVay S. The axonal arborizations of lateral geniculate neurons in the striate cortex of the cat. J Comp Neurol. 1978;182:923–944. doi: 10.1002/cne.901820510. [DOI] [PubMed] [Google Scholar]
- Ferster D, Miller KD. Neural mechanisms of orientation selectivity in the visual cortex. Annu Rev Neurosci. 2000;23:441–471. doi: 10.1146/annurev.neuro.23.1.441. [DOI] [PubMed] [Google Scholar]
- Freund TF, Martin KA, Whitteridge D. Innervation of cat visual areas 17 and 18 by physiologically identified X- and Y- type thalamic afferents. I. Arborization patterns and quantitative distribution of postsynaptic elements. J Comp Neurol. 1985;242:263–274. doi: 10.1002/cne.902420208. [DOI] [PubMed] [Google Scholar]
- Hirsch JA, Martinez LM, Pillai C, Alonso JM, Wang Q, Sommer FT. Functionally distinct inhibitory neurons at the first stage of visual cortical processing. Nat Neurosci. 2003;6:1300–1308. doi: 10.1038/nn1152. [DOI] [PubMed] [Google Scholar]
- Houzel JC, Milleret C, Innocenti G. Morphology of callosal axons interconnecting areas 17 and 18 of the cat. Eur J Neurosci. 1994;6:898–917. doi: 10.1111/j.1460-9568.1994.tb00585.x. [DOI] [PubMed] [Google Scholar]
- Huang L, Chen X, Shou T. Spatial frequency-dependent feedback of visual cortical area 21a modulating functional orientation column maps in areas 17 and 18 of the cat. Brain Res. 2004;998:194–201. doi: 10.1016/j.brainres.2003.11.024. [DOI] [PubMed] [Google Scholar]
- Hubel DH, Wiesel TN. Receptive fields, binocular interaction and functional architecture in the cat's visual cortex. J Physiol. 1962;160:106–154. doi: 10.1113/jphysiol.1962.sp006837. [DOI] [PMC free article] [PubMed] [Google Scholar]
- Hubel DH, Wiesel TN. Shape and arrangement of columns in cat's striate cortex. J Physiol. 1963;165:559–568. doi: 10.1113/jphysiol.1963.sp007079. [DOI] [PMC free article] [PubMed] [Google Scholar]
- Hübener M, Shoham D, Grinvald A, Bonhoeffer T. Spatial relationships among three columnar systems in cat area 17. J Neurosci. 1997;17:9270–9284. doi: 10.1523/JNEUROSCI.17-23-09270.1997. [DOI] [PMC free article] [PubMed] [Google Scholar]
- Humphrey AL, Sur M, Uhlrich DJ, Sherman SM. Termination patterns of individual X- and Y-cell axons in the visual cortex of the cat: projections to area 18, to the 17/18 border region, and to both areas 17 and 18. J Comp Neurol. 1985;233:190–212. doi: 10.1002/cne.902330204. [DOI] [PubMed] [Google Scholar]
- Imamura K, Tanaka S, Ribot J, Kobayashi M, Yamamoto M, Nakadate K, Watanabe Y. Preservation of functional architecture in visual cortex of cats with experimentally induced hydrocephalus. Eur J Neurosci. 2006;23:2087–2098. doi: 10.1111/j.1460-9568.2006.04729.x. [DOI] [PubMed] [Google Scholar]
- Issa NP, Trepel C, Stryker MP. Spatial frequency maps in cat visual cortex. J Neurosci. 2000;20:8504–8514. doi: 10.1523/JNEUROSCI.20-22-08504.2000. [DOI] [PMC free article] [PubMed] [Google Scholar]
- Issa NP, Rosenberg A, Husson TR. Models and measurements of functional maps in V1. J Neurophysiol. 2008;99:2745–2754. doi: 10.1152/jn.90211.2008. [DOI] [PubMed] [Google Scholar]
- Kalatsky VA, Stryker MP. New paradigm for optical imaging: temporally encoded maps of intrinsic signal. Neuron. 2003;38:529–545. doi: 10.1016/S0896-6273(03)00286-1. [DOI] [PubMed] [Google Scholar]
- Lehmkuhle S, Kratz KE, Mangel SC, Sherman SM. Spatial and temporal sensitivity of X- and Y-cells in dorsal lateral geniculate nucleus of the cat. J Neurophysiol. 1980;43:520–541. doi: 10.1152/jn.1980.43.2.520. [DOI] [PubMed] [Google Scholar]
- Lepore F, Guillemot JP. Visual receptive field properties of cells innervated through the corpus callosum in the cat. Exp Brain Res. 1982;46:413–424. doi: 10.1007/BF00238636. [DOI] [PubMed] [Google Scholar]
- Mallik AK, Husson TR, Zhang JX, Rosenberg A, Issa NP. The organization of spatial frequency maps measured by cortical flavoprotein autofluorescence. Vision Res. 2008;48:1545–1553. doi: 10.1016/j.visres.2008.04.014. [DOI] [PMC free article] [PubMed] [Google Scholar]
- Mante V, Carandini M. Mapping of stimulus energy in primary visual cortex. J Neurophysiol. 2005;94:788–798. doi: 10.1152/jn.01094.2004. [DOI] [PubMed] [Google Scholar]
- Milleret C, Houzel JC. Visual interhemispheric transfer to areas 17 and 18 in cats with convergent strabismus. Eur J Neurosci. 2001;13:137–152. doi: 10.1046/j.1460-9568.2001.01360.x. [DOI] [PubMed] [Google Scholar]
- Milleret C, Houzel JC, Buser P. Pattern of development of the callosal transfer of visual information to cortical areas 17 and 18 in the cat. Eur J Neurosci. 1994;6:193–202. doi: 10.1111/j.1460-9568.1994.tb00261.x. [DOI] [PubMed] [Google Scholar]
- Milleret C, Buser P, Watroba L. Unilateral paralytic strabismus in the adult cat induces plastic changes in interocular disparity along the visual midline: contribution of the corpus callosum. Vis Neurosci. 2005;22:325–343. doi: 10.1017/S0952523805223088. [DOI] [PubMed] [Google Scholar]
- Movshon JA, Thompson ID, Tolhurst DJ. Spatial and temporal contrast sensitivity of neurones in areas 17 and 18 of the cat's visual cortex. J Physiol. 1978;283:101–120. doi: 10.1113/jphysiol.1978.sp012490. [DOI] [PMC free article] [PubMed] [Google Scholar]
- Ninomiya T, Sanada TM, Ohzawa I. Contributions of excitation and suppression in shaping spatial frequency selectivity of V1 neurons as revealed by binocular measurements. J Neurophysiol. 2012;107:2220–2231. doi: 10.1152/jn.00832.2010. [DOI] [PubMed] [Google Scholar]
- Nishimoto S, Arai M, Ohzawa I. Accuracy of subspace mapping of spatiotemporal frequency domain visual receptive fields. J Neurophysiol. 2005;93:3524–3536. doi: 10.1152/jn.01169.2004. [DOI] [PubMed] [Google Scholar]
- Ohki K, Matsuda Y, Ajima A, Kim DS, Tanaka S. Arrangement of orientation pinwheel centers around area 17/18 transition zone in cat visual cortex. Cereb Cortex. 2000;10:593–601. doi: 10.1093/cercor/10.6.593. [DOI] [PubMed] [Google Scholar]
- Ohki K, Chung S, Kara P, Hübener M, Bonhoeffer T, Reid RC. Highly ordered arrangement of single neurons in orientation pinwheels. Nature. 2006;442:925–928. doi: 10.1038/nature05019. [DOI] [PubMed] [Google Scholar]
- Paik SB, Ringach DL. Retinal origin of orientation maps in visual cortex. Nat Neurosci. 2011;14:919–925. doi: 10.1038/nn.2824. [DOI] [PMC free article] [PubMed] [Google Scholar]
- Payne BR, Siwek DF. Visual-field map in the callosal recipient zone at the border between areas 17 and 18 in the cat. Vis Neurosci. 1991;7:221–236. doi: 10.1017/S0952523800004041. [DOI] [PubMed] [Google Scholar]
- Ribot J, Tanaka S, Tanaka H, Ajima A. Online analysis method for intrinsic signal optical imaging. J Neurosci Methods. 2006;153:8–20. doi: 10.1016/j.jneumeth.2005.09.016. [DOI] [PubMed] [Google Scholar]
- Ribot J, Tanaka S, O'Hashi K, Ajima A. Anisotropy in the representation of direction preferences in cat area 18. Eur J Neurosci. 2008a;27:2773–2780. doi: 10.1111/j.1460-9568.2008.06219.x. [DOI] [PubMed] [Google Scholar]
- Ribot J, Ozawa K, Tani T, Milleret C, Tanaka S. Spatio-temporal frequency preference map in cat primary visual cortex. Soc Neurosci Abstr. 2008b;34:366.1. [Google Scholar]
- Rochefort NL, Buzás P, Kisvárday ZF, Eysel UT, Milleret C. Layout of transcallosal activity in cat visual cortex revealed by optical imaging. Neuroimage. 2007;36:804–821. doi: 10.1016/j.neuroimage.2007.03.006. [DOI] [PubMed] [Google Scholar]
- Rochefort NL, Buzás P, Quenech'du N, Koza A, Eysel UT, Milleret C, Kisvárday ZF. Functional selectivity of interhemispheric connections in cat visual cortex. Cereb Cortex. 2009;19:2451–2465. doi: 10.1093/cercor/bhp001. [DOI] [PubMed] [Google Scholar]
- Schmued LC. A rapid, sensitive histochemical stain for myelin in frozen brain sections. J Histochem Cytochem. 1990;38:717–720. doi: 10.1177/38.5.1692056. [DOI] [PubMed] [Google Scholar]
- Shapley R, Lennie P. Spatial frequency analysis in the visual system. Annu Rev Neurosci. 1985;8:547–583. doi: 10.1146/annurev.ne.08.030185.002555. [DOI] [PubMed] [Google Scholar]
- Shoham D, Hübener M, Schulze S, Grinvald A, Bonhoeffer T. Spatio-temporal frequency domains and their relation to cytochrome oxidase staining in cat visual cortex. Nature. 1997;385:529–533. doi: 10.1038/385529a0. [DOI] [PubMed] [Google Scholar]
- Sirovich L, Uglesich R. The organization of orientation and spatial frequency in primary visual cortex. Proc Natl Acad Sci U S A. 2004;101:16941–16946. doi: 10.1073/pnas.0407450101. [DOI] [PMC free article] [PubMed] [Google Scholar]
- Swindale NV, Shoham D, Grinvald A, Bonhoeffer T, Hübener M. Visual cortex maps are optimized for uniform coverage. Nat Neurosci. 2000;3:822–826. doi: 10.1038/77731. [DOI] [PubMed] [Google Scholar]
- Tanaka S, Tani T, Ribot J, Yamazaki T. Chronically mountable goggles for persistent exposure to single orientation. J Neurosci Methods. 2007;160:206–214. doi: 10.1016/j.jneumeth.2006.09.004. [DOI] [PubMed] [Google Scholar]
- Tanaka S, Tani T, Ribot J, O'Hashi K, Imamura K. A postnatal critical period for orientation plasticity in the cat visual cortex. PLoS One. 2009;4:e5380. doi: 10.1371/journal.pone.0005380. [DOI] [PMC free article] [PubMed] [Google Scholar]
- Tani T, Ribot J, O'Hashi K, Tanaka S. Parallel development of orientation maps and spatial frequency selectivity in cat visual cortex. Eur J Neurosci. 2012;35:44–55. doi: 10.1111/j.1460-9568.2011.07954.x. [DOI] [PubMed] [Google Scholar]
- Tolhurst DJ, Thompson ID. Organization of neurones preferring similar spatial frequencies in cat striate cortex. Exp Brain Res. 1982;48:217–227. doi: 10.1007/BF00237217. [DOI] [PubMed] [Google Scholar]
- Troy JB. Spatial contrast sensitivities of X and Y type neurones in the cat's dorsal lateral geniculate nucleus. J Physiol. 1983;344:399–417. doi: 10.1113/jphysiol.1983.sp014948. [DOI] [PMC free article] [PubMed] [Google Scholar]
- Vanni MP, Provost J, Casanova C, Lesage F. Bimodal modulation and continuous stimulation in optical imaging to map direction selectivity. Neuroimage. 2010;49:1416–1431. doi: 10.1016/j.neuroimage.2009.09.044. [DOI] [PMC free article] [PubMed] [Google Scholar]
- Watson AB, Robson JG. Discrimination at threshold: labelled detectors in human vision. Vision Res. 1981;21:1115–1122. doi: 10.1016/0042-6989(81)90014-6. [DOI] [PubMed] [Google Scholar]
- Webster MA, De Valois RL. Relationship between spatial-frequency and orientation tuning of striate-cortex cells. J Opt Soc Am A. 1985;2:1124–1132. doi: 10.1364/JOSAA.2.001124. [DOI] [PubMed] [Google Scholar]
- Xu X, Anderson TJ, Casagrande VA. How do functional maps in primary visual cortex vary with eccentricity? J Comp Neurol. 2007;501(5):741–755. doi: 10.1002/cne.21277. [DOI] [PubMed] [Google Scholar]
- Yokoo T, Knight BW, Sirovich L. An optimization approach to signal extraction from noisy multivariate data. Neuroimage. 2001;14:1309–1326. doi: 10.1006/nimg.2001.0950. [DOI] [PubMed] [Google Scholar]
- Yu H, Farley BJ, Jin DZ, Sur M. The coordinated mapping of visual space and response features in visual cortex. Neuron. 2005;47:267–280. doi: 10.1016/j.neuron.2005.06.011. [DOI] [PubMed] [Google Scholar]
- Zhang JX, Rosenberg A, Mallik AK, Husson TR, Issa NP. The representation of complex images in spatial frequency domains of primary visual cortex. J Neurosci. 2007;27:9310–9318. doi: 10.1523/JNEUROSCI.0500-07.2007. [DOI] [PMC free article] [PubMed] [Google Scholar]


