

Abstract
Sickness behaviors, such as fatigue, mood alterations, and cognitive dysfunction, which result from changes in central neurotransmission, are prevalent in systemic inflammatory diseases and greatly impact patient quality of life. Although, microglia (resident cerebral immune cells) and cytokines (e.g., TNFα) are associated with changes in central neurotransmission, the link between peripheral organ inflammation, circulating cytokine signaling, and microglial activation remains poorly understood. Here we demonstrate, using cerebral intravital microscopy, that in response to liver inflammation, there is increased monocyte specific rolling and adhesion along cerebral endothelial cells (CECs). Peripheral TNFα-TNFR1 signaling and the adhesion molecule P-selectin are central mediators of these monocyte–CEC adhesive interactions which were found to be closely associated with microglial activation, decreased central neural excitability and sickness behavior development. Similar monocyte-CEC adhesive interactions were also observed in another mouse model of peripheral organ inflammation (i.e., 2,4-dinitrobenzene sulfonic acid-induced colitis). Our observations provide a clear link between peripheral organ inflammation and cerebral changes that impact behavior, which can potentially allow for novel therapeutic interventions in patients with systemic inflammatory diseases.
Introduction
Sickness behaviors, such as fatigue, mood disorders, and cognitive dysfunction are prevalent in patients with inflammatory diseases (e.g., inflammatory bowel disease, rheumatoid arthritis, inflammatory liver disease) and greatly impact quality of life (Lorton et al., 2008; D'Mello and Swain, 2011; Graff et al., 2011). Neural and humoral pathways have been postulated to mediate periphery-to-brain communication in systemic inflammation (Capuron and Miller, 2011). Previously, using a murine model of hepatic inflammation, we identified an immune mediated periphery-to-brain communication pathway whereby circulating monocytes enter brain parenchyma; an event linked to expression of liver inflammation-associated sickness behaviors (D'Mello et al., 2009). However, cerebral monocyte recruitment did not occur until >5 d after induction of liver inflammation (D'Mello et al., 2009); yet sickness behaviors and activation of microglia are evident well before monocyte infiltration is detectable (Nguyen et al., 2012). This suggests that monocyte entry into the brain is not obligatory for initiation of central changes accompanying peripheral inflammation.
Microglial activation has been linked with behavioral alterations and with regulation of central neural excitability (Henry et al., 2008; Riazi et al., 2008). In mice with liver inflammation, we have previously shown that at a time when cerebral monocyte recruitment is not evident, circulating monocytes express TNFα. At this time point, blocking peripheral TNFα signaling markedly reduced microglial activation (D'Mello et al., 2009). However, the cellular mechanisms that link peripheral TNFα signaling to microglial activation during peripheral organ inflammation have not previously been examined. Elucidation of this pathway could have broad implications for management of detrimental behavior alterations in patients with systemic inflammatory diseases.
TNFα is a potent activator of endothelial cells and can promote rolling/adhesion of leukocytes along cerebral endothelial cells (CECs) (Carvalho-Tavares et al., 2000). Importantly, both anti-TNFα and anti-leukocyte adhesion therapies (specifically anti-α4 integrin therapy) are associated with improvements in quality of life, (Feagan et al., 2007; Rudick et al., 2007). Furthermore, in a mouse model of pilocarpine-induced seizures, rolling/adhesion of neutrophils along CECs was found to alter central neural excitability (Fabene et al., 2008). We hypothesized that during hepatic inflammation, circulating monocytes may interact with, and subsequently activate CECs. A signaling molecule(s) could in turn be released from stimulated CECs to activate cells within the brain, which could contribute to altered central neurotransmission. In our present study we examined sickness behaviors, and central neural excitability, as indicators of changes in neurotransmission within the brain. We find that at a time when cerebral monocyte recruitment is not evident, mice with hepatic inflammation exhibit sickness behaviors, as well as reduced central neural excitability in vitro and increases in seizure threshold (a robust and reproducible neural excitability readout) in vivo. We show that hepatic inflammation causes increased monocyte–endothelium adhesive interactions, specifically in the cerebral vasculature. P-selectin driven monocyte–CEC adhesive interactions subsequently lead to microglial activation, changes in central neural excitability, and sickness behaviors. Importantly, we also demonstrate that leukocyte–CEC adhesive interactions occur in a model of inflammatory bowel disease; findings suggesting this periphery-to-brain communication pathway may be generalizable to a number of different diseases.
Materials and Methods
Mice.
Mice (all on C57BL/6 genetic background; male 6–8-weeks-old) were purchased from The Jackson Laboratory and maintained in a pathogen free facility. Lysozyme (LysM) mice were obtained from Dr. Paul Kubes (University of Calgary, Calgary, Alberta, Canada). All procedures conformed to guidelines established by Canadian Council on Animal Care.
Model of hepatic inflammation.
We used a well characterized model of relatively acute hepatic inflammation due to bile duct ligation (BDL; sham-ligated mice served as controls) (Kerfoot et al., 2006; D'Mello et al., 2009; Nguyen et al., 2012). In general, this model likely reflects periphery-to-brain signaling pathways, which occur early in the clinical course of acute liver or gastrointestinal inflammatory diseases (e.g., acute hepatitis or gastroenteritis). This model is associated with elevated circulating cytokines (e.g.: TNFα, IL-6) and development of sickness behaviors (Burak et al., 2002; Nguyen et al., 2008, 2012; D'Mello and Swain, 2011). All experiments were performed 5 d post-BDL, a time point when the liver is significantly inflamed and cerebral monocyte infiltration is not evident (D'Mello et al., 2009). Biochemical evidence of liver injury was demonstrated by an increase in serum alanine aminotransferase (enzyme released by damaged hepatocytes) and total bilirubin levels. None of the interventions described herein altered the magnitude of liver inflammation in BDL mice (Table 1).
Table 1.
Biochemical analysis
| Mice | Alanine aminotransferase (U/L) | Bilirubin (μmol/L) |
|---|---|---|
| Sham | 21 ± 1.04 | 2.2 ± 0.2 |
| BDL | 531.2 ± 82.2 | 198.2 ± 22 |
| Control IgG-treated BDL | 546.5 ± 60.7 | 184 ± 28.6 |
| Anti-Gr-1-treated BDL | 706 ± 174.5 | 169.0 ± 30.6 |
| Control IgG-treated BDL | 592.29 ± 54.4 | 283.14 ± 38.6 |
| Anti-P-selectin-treated BDL | 622.86 ± 74.7 | 209.71 ± 16.1 |
| PSGL-1 KO BDL | 835 ± 164.2 | 243.3 ± 71.0 |
| WT BDL | 648.3 ± 41.6 | 183 ± 29.7 |
| Anti-TNFα-treated BDL | 592.6 ± 76.4 | 206 ± 25.2 |
| NRS-treated BDL | 576.3 ± 83.6 | 233.5 ± 26.8 |
| TNFR1 KO BDL | 343.0 ± 80.1 | 238.2 ± 32.3 |
| WT BDL | 449.8 ± 93.5 | 167 ± 39.8 |
| TNFR2 KO BDL | 575.7 ± 59.5 | 230 ± 18.9 |
| WT BDL | 571 ± 14.1 | 168 ± 58.3 |
| iNOS KO BDL | 475 ± 64.2 | 327.2 ± 21.6 |
| WT BDL | 447 ± 64.9 | 297.8 ± 25.5 |
| Minocycline-treated BDL | 456.7 ± 158.03 | 127.7 ± 25.1 |
| Control BDL | 518 ± 75.6 | 125.2 ± 18.9 |
| DNBS-treated mice | 23.3 ± 4.1 | <2 |
| Control mice | 21.3 ± 1.3 | <2 |
Alanine aminotransferase and bilirubin levels in sham, BDL, and mice administered different treatments as described. Results expressed as mean ± SEM of data from 5–6 mice per group. BDL, Bile duct ligation; WT, wild-type; NRS, normal rabbit serum; iNOS, inducible nitric oxide synthase; PSGL-1, P-selectin glycoprotein ligand-1; DNBS, dinitrobenzene sulfonic acid.
p < 0.05 versus sham controls. Each treatment group was compared to its own control group. ALT and Bilirubin values for all BDL mice are significantly different from Sham mice.
Biochemical analysis.
Alanine aminotransferase and bilirubin levels were measured in a commercial lab (Calgary Laboratory Services).
Induction of colitis.
Colitis was induced in anesthetized mice via the intrarectal delivery of 3 mg of 2, 4-dinitrobenzene sulfonic acid (DNBS) in 100 μl of 1:1 PBS/ethanol via a 3 cm catheter as described previously (Hunter et al., 2010). Control mice received vehicle. Cerebral intravital microscopy was performed 3 d post-DNBS when colitis is maximal.
Examination of hippocampal excitability in vitro.
We measured alterations in hippocampal excitability in vitro in brain slices from sham and BDL mice using methods previously described by our group (Riazi et al., 2008). We chose the hippocampal region because of its well-studied structure, role in seizure generation, and established methods of neural excitability evaluation. Epileptiform events can be induced in hippocampal slices with a variety of chemical convulsants, and data from these types of experiments demonstrate the intrinsic excitability of the tissue and bypass any possibility of altered convulsive drug accessibility to the brain in a disease model.
Mice were anesthetized with isoflurane, decapitated, and brains immediately removed and kept in 0–4°C high magnesium high sucrose slicing solution (87 mm NaCl, 2.5 mm KCl, 25 mm NaHCO3, 1.25 mm NaH2PO4, 25 mm d-glucose, 7 mm MgCl2, 0.48 mm CaCl2, and 142 mm sucrose) that was bubbled with 5% CO2/95% O2. Horizontal hippocampal slices of 400 μm were cut and maintained for 1 h in artificial CSF (aCSF; 126 mm NaCl, 2.5 mm KCl, 1.2 mm NaH2PO4, 1.2 mm MgCl2, 2.4 mm CaCl2, 18 mm NaHCO3, 11 mm d-glucose, and 1.5 mm kynurenic acid) at 32°C and continuously bubbled with 5% CO2/95% O2. Slices were then transferred to another chamber containing only aCSF without kynurenic acid and bubbled with 5% CO2/95% O2 at room temperature for at least 2 h before recording. For recording, slices were transferred to a submerged recording chamber and perfused with aCSF at 31 ± 1°C. Signals were acquired using an Axopatch 200A amplifier (Molecular Devices; low-pass filter, 5 kHz; high-pass filter, 1 Hz; acquisition frequency, 10 kHz; gain, 500×). An aCSF-filled glass micropipette recording electrode (4–6 mΩ) was used for recording. Spontaneous interictal activity was induced by bath perfusion with aCSF containing 75 μm 4-aminopyridine for 30 min and was recorded from CA1 stratum pyramidale. The average frequency of the interictal events in the last 10 min of 4-aminopyridine application was counted and analyzed.
Central neural excitability measurements.
In freely moving mice, 1% pentylenetetrazole solution (Sigma-Aldrich) was infused at 0.58 ml/min via a lateral tail vein cannula. The infusion was halted as soon as the mouse developed clonic seizures (four limb clonus and loss of balance) and amount of pentylenetetrazole/body weight (mg/kg) required to induce seizures was calculated as an index of brain neural excitability (Mandhane et al., 2007; Galic et al., 2008).
Administration of minocycline, anti-TNFα serum, and anti-P-selectin antibody.
To inhibit microglial activation, we administered minocycline on days 2 and 4 post-BDL (45 mg/kg, i.p.; Wu et al., 2002; Yenari et al., 2006) dissolved in intralipid (20%; Baxter) to reduce injection pain. Although minocycline has pleitropic effects, it has been extensively used in murine models to examine the effects of inhibiting microglial activation (Yenari et al., 2006; Riazi et al., 2008; Biscaro et al., 2012). For peripheral TNFα inhibition studies, mice were injected with normal rabbit serum (NRS) or anti-TNFα serum (0.5 ml i.p., kindly provided by Dr C. Hogaboam, University of Michigan) on days 2 and 4 post-BDL. For anti-P-selectin inhibition studies, mice received rat IgG1 antibody or anti-P-selectin antibody (RB40–34, 1 mg/kg; BD Biosciences) on days 2 and 4 post-BDL (Kerfoot et al., 2006; D'Mello et al., 2009).
Sickness behavior assessment.
Social investigative behavior and duration of immobility as measures of sickness behavior were assessed as previously described (D'Mello et al., 2009).
Leukocyte isolation and flow cytometry analysis.
Isolation of leukocytes from peripheral blood and cerebral cortices was done using previously described protocols (Kerfoot et al., 2006; D'Mello et al., 2009). Previously, we examined cerebral microglial activation in terms of MCP-1/CCL2 expression because we were interested in examining the role of microglial activation in mediating recruitment of CCR2+ monocytes into the brain in BDL mice (D'Mello et al., 2009). In our current study, we used an additional method to examine microglial activation whereby expression of CD11b coupled with the differential expression of CD45 antigen, as determined by flow cytometry, was used to distinguish between resting/activated microglia and infiltrating monocytes (Sedgwick et al., 1991; Getts et al., 2008). Based on these criteria, resting and activated microglia are defined as CD45low CD11b+ and CD45intermediate CD11b+ cells, respectively.
For depletion of circulating neutrophils, mice were treated with anti-Gr-1 antibody (4 mg/kg, i.p., eBioscience) for 20 h; controls received rat IgG2b antibody (Kim et al., 2009; Stirling et al., 2009). Neutrophils were identified by surface expression of GFP and PE-labeled Ly6G (eBioscience).
Isolation of CECs.
CECs were isolated from brain using previously described methods (Tontsch and Bauer, 1989). Brains were removed and homogenized in ice-cold sucrose buffer. Homogenates were then centrifuged at 1000 × g (10 min, 4°C). The supernatant was discarded and the pellet resuspended in cold sucrose buffer, followed by centrifugation at 1000 × g. This was repeated one more time. The microvessels in the resulting pellet were then incubated in 0.075% collagenase (Sigma-Aldrich) for 15 min at 37°C. Cells were then centrifuged at 200 × g (10 min, 4°C) and further purified by incubation with CD31 microbeads (1 μg/106 cells; Miltenyi Biotec) followed by positive selection sorting using an AutoMacs (Miltenyi Biotec). To determine TNFR expression, cells were labeled simultaneously with a FITC-labeled anti-CD31 antibody (BD Biosciences) and PE-labeled anti-TNFR1 (AbD Serotec) or anti-TNFR2 (BD Biosciences) antibodies and analyzed by flow cytometry.
Immunohistochemistry for iba-1, iNOS, and CD34.
For detection of ionized calcium binding adapter molecule (Iba)-1+ microglia, paraffin-embedded brain sections (6 μm) were deparaffinized and then underwent heat-induced antigen retrieval in citrate buffer for 45 min. Following PBS wash, 10% normal goat serum (VWR) was applied for 1 h (25°C). Primary anti-mouse Iba-1 antibody (1:1000, Wako) was applied overnight (25°C). Following two PBS washes, biotinylated anti-rabbit IgG (Vecto) antibody was applied for 1 h (25°C). Bound antibody was detected using an ABC kit (Vector) followed by application of diaminobenzidine (Vector) as a substrate for color development. Resting microglia were identified as “ramified” microglia with long processes, whereas primed/activated microglia were identified as microglial cells that were more ameboid, with retracted and shorter processes (Ahmed et al., 2007).
For detection of inducible nitric oxide synthase (iNOS) and CD34 (endothelial cell marker), the same deparaffinization and antigen retrieval steps as described above were followed. Primary rabbit anti-mouse iNOS (1:250, Santa Cruz Biotechnology) and rat anti-mouse CD34 (1:50, Abcam) antibodies were then applied for 20 h at 4°C. This was followed by application of goat anti-rabbit AlexaFlour 555 (1:300) and goat anti-rat AlexaFlour 488 (1:400, 1 h, 25°C; Invitrogen) antibodies. To quench autofluorescence, brain sections were incubated with Sudan black (3%, 10 min; Sigma-Aldrich) and then mounted with Prolong Gold (Invitrogen).
Cerebral intravital microscopy.
Intravital microscopy of cerebral vasculature was conducted as previously described (Carvalho-Tavares et al., 2000; Kerfoot et al., 2006). Briefly, under ketamine (100 mg/kg)/xylazine (10 mg/kg) anesthetic, a craniotomy was performed and the dura mater removed to expose the underlying pial vasculature. The mouse was maintained at 37°C and the tail vein was cannulated for administration of dyes and antibodies.
Rhodamine-6G dye (0.3 mg/kg, Sigma-Aldrich) was used to label all circulating leukocytes (Carvalho-Tavares et al., 2000; Kerfoot et al., 2006); CECs were labeled with a FITC/APC-labeled anti-CD31 antibody (2 μg/mouse, i.v., eBioscience; Stirling et al., 2009; Lee et al., 2010). For identification of rolling/adherent monocytes, mice were injected with PE-labeled F4/80 antibody (1 μg/mouse, i.v., eBioscience; Lee et al., 2010). Five vessels of 30–70-μm-diameter were recorded for 1 min and data averaged. Rolling leukocytes were defined as cells that moved at a velocity less than that of an erythrocyte, past a given point within a 100 μm vessel segment. Adherent leukocytes were defined as cells that remained stationary for 30 s or longer within a 100 μm vessel segment (Kerfoot et al., 2006).
Leukocyte-endothelial interactions were imaged using Quorum WaveFX spinning disk confocal microscope driven by Volocity 6.1 acquisition software (PerkinElmer). Labeled cells were imaged using 491, 561, or 635 nm laser excitation and visualized with the appropriate long-pass filters using a 10×/0.33 NA air objective. A 512 × 512 pixel back-thinned EMCCD camera (Model C9100-13; Hamamatsu) was used for fluorescence detection.
Intravital microscopy of cremaster vasculature.
Intravital microscopy of cremaster vasculature was performed as previously described (Liu et al., 2005). Transmitted bright field microscopy was used to visualize the microcirculation in the cremaster muscle on a custom microscope using a 20×/0.4 NA air objective lens (LD Plan-Neofluar, Zeiss). Images were recorded with a Sony DXC-190 CCD color video camera, and real-time images were recorded using a DVD recorder.
Statistical analysis.
Data were analyzed using GraphPad Instat and SPSS software. For comparison between two means, Student's unpaired t test was used. For multiple-comparisons, one-way ANOVA followed by Tukey's post hoc tests or Kruskal–Wallis test followed by Dunnett's post hoc tests were used. p < 0.05 was considered significant.
Results
Microglia are activated and associated with decreased central neural excitability and sickness behaviors
Changes in behavior, cognition, and mood which commonly complicate peripheral inflammatory diseases, are by definition due to altered central neurotransmission. The hippocampus has important roles in regulation of mood and behavior (Hu et al., 2012). Therefore, we performed in vitro recordings in freshly prepared hippocampal slices and demonstrated decreased neural excitability in BDL mice (Fig. 1A). To examine whether central neural excitability was altered in BDL mice in vivo, we determined the threshold for clonic seizures induced by timed intravenous infusion of pentylenetetrazole to enable calculation of seizure threshold (Mandhane et al., 2007; Galic et al., 2008). There was a significant increase in seizure threshold in BDL mice (Fig. 1B). In addition, we assessed social investigative behavior and duration of immobility, as measures of sickness (D'Mello et al., 2009). We found that BDL mice demonstrated significantly greater sickness behaviors (Fig. 1C).
Figure 1.
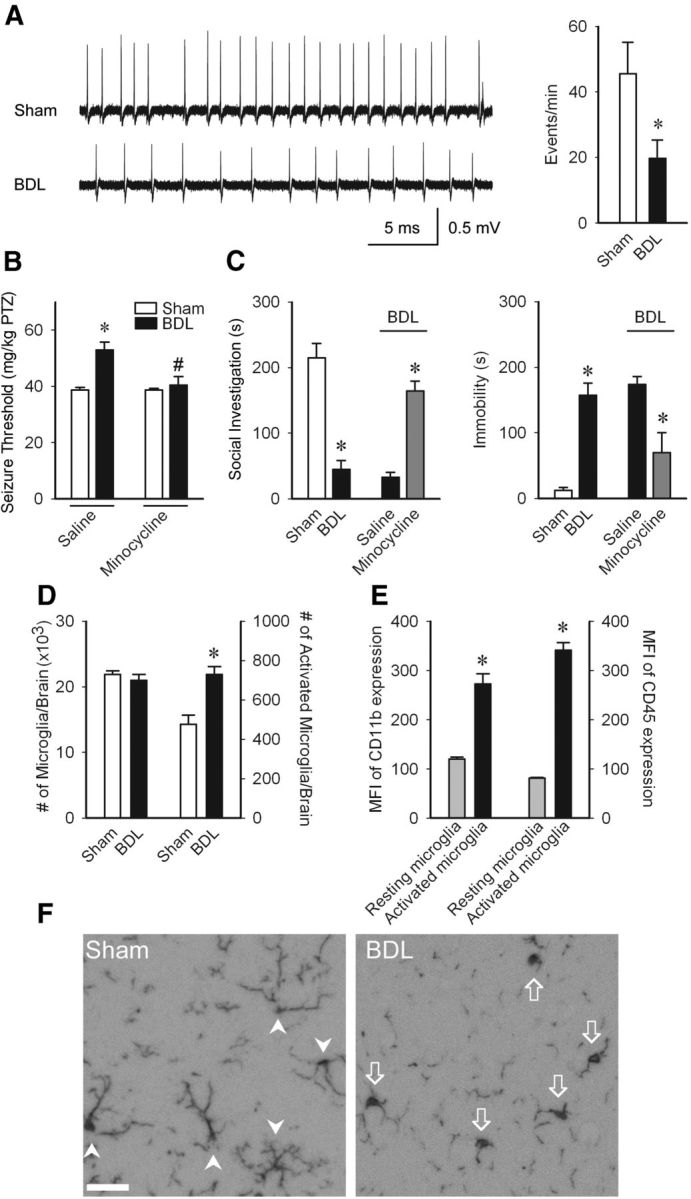
Microglial activation mediates changes in neural excitability and sickness behaviors in BDL mice. A, Representative traces of 4 aminopyridine-initiated epileptiform events recorded from CA1 stratum pyramidale in hippocampal slices. Bar graph demonstrates significant decrease of epileptiform events in BDL mice; n = 6/group, *p < 0.05. B, PTZ seizure thresholds (amount of PTZ in mg/kg required to induce clonic seizures) in D5 sham and BDL mice treated with saline or minocycline on days 2 and 4 postsurgery; n = 6–9/group; *p < 0.01 versus sham-saline group, #p < 0.05 versus BDL-saline group. C, Total time in seconds adult test mouse spent in social exploration or remained immobile during a 5 min observation period; n = 3–5/group, *p < 0.05. D, Total number of microglia (i.e., CD11b+ CD45low and CD11b+ CD45intermediate cells) and number of activated microglia (CD11b+ CD45intermediate cells) as isolated from cerebral cortices of sham and BDL mice and characterized using flow cytometry; n = 5/group, *p < 0.05. E, Mean fluorescence intensity of CD11b and CD45 levels on resting and activated microglia isolated from cerebral cortices of BDL mice, and characterized using flow cytometry; n = 5/group, *p < 0.05. F, Representative images from brain sections of sham and BDL mice depicting Iba-1+ microglia in hippocampal region. Arrowheads indicate resting microglia; arrows indicate activated microglia. Scale bar, 50 μm. All data expressed as mean ± SEM.BDL, Bile duct ligation; PTZ, pentylenetetrazole.
We next wanted to determine whether microglial activation is associated with the observed changes in seizure threshold and sickness behaviors. We found a significant increase in the number of activated microglia in BDL mice (Fig. 1D). As we found no difference in the total number of microglial cells (i.e., resting and activated cells) isolated from sham and BDL mice, this suggests that a proportion of resting microglia are activated to increase their CD45 expression in BDL mice. In addition, activated microglia expressed higher levels of CD11b (Fig. 1E). Furthermore, immunohistochemistry for Iba-1+ microglia indicated that microglia in the hippocampal region in BDL mice predominantly exhibit a morphology typical of activated microglia (Ahmed et al., 2007), whereas microglia in sham mice had a “resting” morphology (Fig. 1F).
To determine whether microglial activation contributed to the observed changes in seizure threshold and sickness behaviors, these variables were assessed in BDL mice treated with minocycline. BDL mice administered minocycline exhibited seizure thresholds similar to those in controls, as well as significant improvements in sickness behaviors (Fig. 1B,C). Furthermore, minocycline treatment did not alter level of liver inflammation (Table 1).
TNFα-TNFR1 signaling drives microglial activation, neural excitability, and sickness behaviors
There was a marked reduction in the number of activated microglia in BDL mice administered anti-TNFα serum systemically (Fig. 2A,B). As TNFα can mediate its effects via TNFR1 and/or TNFR2 (Cabal-Hierro and Lazo, 2012), we conducted studies in TNFR1 or TNFR2 deficient BDL mice to determine which receptor mediates TNFα effects upon microglial activation. The number of activated microglia was significantly reduced in TNFR1, but not TNFR2, deficient BDL mice (Fig. 2B).
Figure 2.

Peripheral TNFα signaling via TNFR1 drives microglial activation, neural excitability and sickness behaviors in BDL mice. A, Representative images from brain sections depicting Iba-1+ microglia in hippocampal region of D5 BDL mice that received NRS or anti-TNFα serum intraperitoneally on days 2 and 4 post-BDL, TNFR1 KO and TNFR2 KO BDL mice. Arrows indicate activated microglia; arrowheads indicate resting microglia. Scale bar, 50 μm. B, Number of activated microglia (i.e., CD11b+ CD45intermediate cells) isolated from cerebral cortices and characterized by flow cytometry; n = 5–7/group; *p < 0.05 versus respective controls. C, PTZ seizure thresholds (amount of PTZ in mg/kg required to induce clonic seizures) in sham, BDL mice administered NRS or anti-TNFα serum, WT BDL, TNFR1 KO, or TNFR2 KO BDL mice; n = 6–9/group; *p < 0.001 versus respective control BDL mice. D, Total time in seconds the adult test mouse spent in social exploration or remained immobile during a 5 min observation period; n = 4/group, *p < 0.05, #p < 0.001 versus respective controls. All data expressed as mean ± SEM; all control BDL are significantly different from sham mice. NRS, Normal rabbit serum.
To examine whether peripheral TNFα signaling also contributed to alterations in neural excitability and sickness behaviors in BDL mice, we examined these variables in anti-TNFα treated BDL mice (as above). Increased seizure thresholds were not seen in anti-TNFα treated or in TNFR1 KO BDL mice, but were still present in TNFR2 KO BDL mice (Fig. 2C). In addition, anti-TNFα treated BDL mice showed decreased sickness behaviors compared with controls (Fig. 2D).
iNOS is upregulated in CECs and associated with microglial activation
TNFα can stimulate nitric oxide production in CECs (Shafer and Murphy, 1997), which in turn can signal cells within the brain. Therefore, as a readout for nitric oxide involvement, we determined whether upregulated iNOS was linked to microglial activation. BDL mice demonstrated clear iNOS expression in CECs in the cortical region, which was not evident in sham controls (Fig. 3A). Importantly, induction of CEC iNOS expression was strikingly attenuated in anti-TNFα-treated and TNFR1 KO BDL mice. In addition, BDL mice deficient in iNOS had reduced numbers of activated microglia (Fig. 3B,C).
Figure 3.
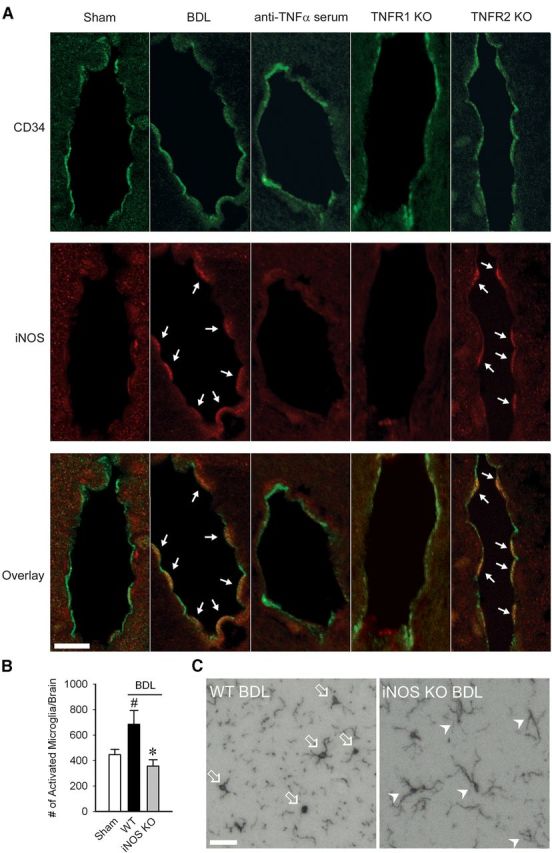
TNFα signaling via TNFR1 induces iNOS in CECs in BDL mice. A, Representative images from brain sections of sham, BDL, anti-TNFα treated, TNFR1 KO, and TNFR2 KO BDL mice depicting iNOS+ endothelial cells in the cortical area. CD34 positivity demonstrated in green; iNOS positivity indicated by red fluorescence. Overlay of red and green fluorescence indicated in bottom panel. Arrows indicate iNOS+ cells. Scale bar, 10 μm. B, Number of activated microglia (i.e., CD11b+ CD45intermediate cells) as isolated from cerebral cortices of sham, WT BDL, and iNOS KO BDL mice and characterized by flow cytometry. Data expressed as mean ± SEM; n = 5/group, *p < 0.05 versus WT BDL, #p < 0.05 versus sham. C, Representative images from brain sections of WT and iNOS KO BDL mice depicting Iba-1+ microglia in the hippocampal region. Arrows indicate activated microglia; arrowheads indicate resting microglia. Scale bar, 50 μm.
Monocytes interact with CECs in BDL mice
As iNOS in CECs was upregulated by TNFα, we next examined how peripheral TNFα activates CECs. We hypothesized that TNFα upregulates adhesion molecule expression on CECs, thereby promoting rolling and adhesion of leukocytes along CECs. We used intravital microscopy to examine leukocyte-endothelial interactions within the cerebral vasculature. Cortical blood vessels were visualized through a small cranial window using a spinning disk confocal microscope as previously described (Kerfoot et al., 2006). We observed a striking increase in rolling and adherent leukocytes along CECs in BDL mice (Fig. 4A). To determine whether these leukocytes were a specific cell type, we conducted cerebral intravital microscopy studies in LysM mice (Faust et al., 2000) in which myeloid cells (i.e., monocytes and neutrophils) are GFP+. The number of GFP+ cells that rolled/adhered along CECs in LysM BDL mice was similar to numbers documented in wild-type BDL mice (Fig. 4B). To further demonstrate that only myeloid cells were interacting with CECs, we performed intravital microscopy in LysM mice administered rhodamine-6G which labels all circulating leukocytes. No GFP− rhodamine+ cells were observed rolling/adherent along CECs in LysM BDL mice, indicating that only monocytes and/or neutrophils were interacting with CECs (Fig. 4C). To determine whether GFP+ cells interacting with CECs were monocytes, we treated LysM BDL mice with low-dose anti-Gr-1 antibody to deplete circulating neutrophils (Kim et al., 2009; Stirling et al., 2009). Although Gr-1 is a differentiation marker expressed on neutrophils and at low levels on monocytes, low-dose anti-Gr-1 antibody has been shown to effectively deplete neutrophils without affecting circulating monocytes (Stirling et al., 2009). This treatment resulted in ∼90% depletion of circulating neutrophils (Fig. 4D); however, we found no difference in the number of GFP+ cells that rolled or were adherent along CECs in anti-Gr-1 vs IgG treated BDL mice (Fig. 4E). To confirm that cells interacting with CECs were F4/80+ monocytes, LysM BDL mice were administered an anti-F4/80 antibody (Lee et al., 2010) which indicated that cells interacting with CECs were specifically monocytes (Fig. 4F). These data collectively demonstrate that in BDL mice, there is a specific increase in the number of monocytes interacting with CECs. We also confirmed that no monocytes infiltrated the brain of LysM BDL mice at this time point (as isolated from cerebral cortices and characterized by flow cytometry; no. of GFP+, CD11b+, CD45high cells in D5 LysM sham: 1139 ± 43 vs LysM BDL mice: 1240 ± 57, n = 6/group, p > 0.05).
Figure 4.
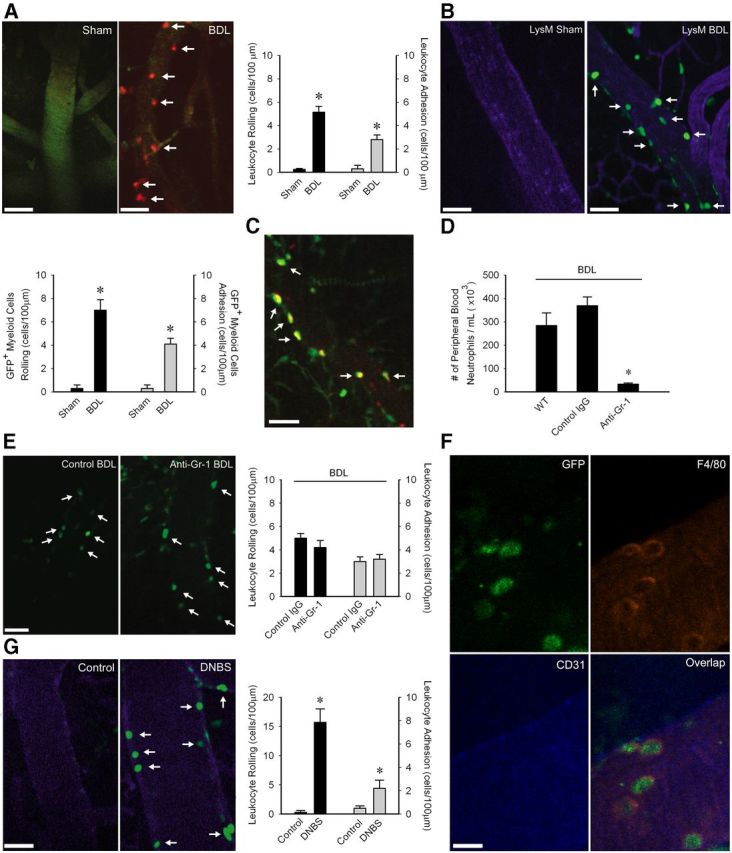
Monocytes roll and adhere along CECs in BDL mice. A, Representative images of cerebral vasculature in Sham and BDL mice. Circulating leukocytes were labeled with rhodamine (red); CECs labeled with FITC anti-CD31 (green). Bar graph indicates number of rolling leukocytes (cells/min/100 μm) and adherent leukocytes (cells/100 μm) along CECs in sham and BDL mice; n = 6/group; *p < 0.005. B, Representative images of cerebral vasculature in LysM sham and BDL mice. CECs labeled with APC anti-CD31 (blue). Bar graph indicates number of GFP+ cells that rolled (cells/min/100 μm) or were adherent (cells/100 μm) along CECs in LysM sham and BDL mice; n = 4/group, *p < 0.05. C, Representative image of cerebral vasculature in LysM BDL mice administered rhodamine dye (red) demonstrating only GFP+, rhodamine+ cells (i.e., overlap between green and red channels seen as yellow) interact with CECs in LysM BDL mice. D, Number of peripheral blood neutrophils isolated from WT, IgG-treated, and low-dose anti-Gr-1-treated LysM BDL mice; n = 5/group, *p < 0.05. E, Representative images of GFP+ cells rolling/adherent along CECs in isotype treated and low dose anti-Gr-1-treated LysM BDL mice. Bar graph indicates number of GFP+ cells that rolled (cells/min/100 μm) or were adherent (cells/100 μm) along CECs; n = 6/group, p > 0.05. F, Representative image of cerebral vasculature in a LysM BDL mouse depicting GFP+, F4/80+ cells interacting with CD31+ CECs. Image on bottom right shows overlap between green, red, and blue channels. G, Representative images of cerebral vasculature in control and DNBS treated LysM mice. CECs labeled with APC-anti-CD31 (blue). Bar graph indicates number of rolling leukocytes (cells/min/100 μm) and adherent leukocytes (cells/100 μm) along CECs; n = 5/group; *p < 0.05. A–C, E, G, Arrows indicate cells rolling/adherent along CECs. Scale bar: F, 10 μm; A–C, E, G, 45 μm. All data expressed as mean ± SEM. For leukocyte rolling and adhesion, data from five vessels of 30- to 70-μm-diameter was averaged for each mouse.
To determine whether the observed monocyte rolling and adhesion was specific to the cerebral vasculature, we conducted intravital studies of the cremaster vasculature (a vascular site commonly used for studying the effects of systemic endothelial activating stimuli on leukocyte rolling/adhesion; Liu et al., 2005) in sham and BDL mice. We found no significant difference in the number of adherent leukocytes (sham: 3.2 ± 0.6 and BDL: 4.8 ± 0.7, n = 5/group, p > 0.05) along the cremaster vascular endothelium. Furthermore, to determine whether leukocyte–CEC adhesive interactions were generalizable to another model of peripheral organ inflammation, we induced colitis in mice using DNBS (a widely used model of inflammatory bowel disease; Hunter et al., 2010). We observed a striking increase in leukocyte–CEC adhesive interactions in mice with experimental colitis (Fig. 4G).
TNFα-TNFR1 signaling drives monocyte rolling and adhesion along CECs
To examine whether peripheral TNFα signaling drives these observed monocyte–CEC interactions, we treated BDL mice systemically with anti-TNFα serum (as above), and examined monocyte–CEC adhesive interactions. We found a marked reduction in the number of monocyte–CEC adhesive interactions in anti-TNFα treated BDL mice (Fig. 5A,B). To determine which receptor mediated these TNFα effects, we first isolated CECs from sham and BDL mice and examined TNFR expression by flow cytometry. The percentage of CECs that expressed detectable levels of TNFR1 or TNFR2 was similar in sham and BDL mice; however, the mean cell expression of TNFR1 compared with TNFR2 was >3-fold higher in CECs from sham and BDL mice (by FACs; mean fluorescence intensity of TNFR1 expression; sham: 1436 ± 53 vs BDL: 1418 ± 89, n = 5 mice/group, p > 0.05; mean fluorescence intensity of TNFR2 expression; sham: 428 ± 18 vs BDL: 390 ± 23, n = 5 mice/group, p > 0.05). To determine whether TNFα signaled via TNFR1 and/or TNFR2 to drive activation of CECs, and subsequent rolling/adhesion of monocytes, intravital microscopy was conducted in BDL mice deficient in TNFR1 or TNFR2. We found a significant decrease in rolling/adherent leukocytes along CECs in TNFR1 KO but not TNFR2 KO BDL mice (Fig. 5C–F).
Figure 5.
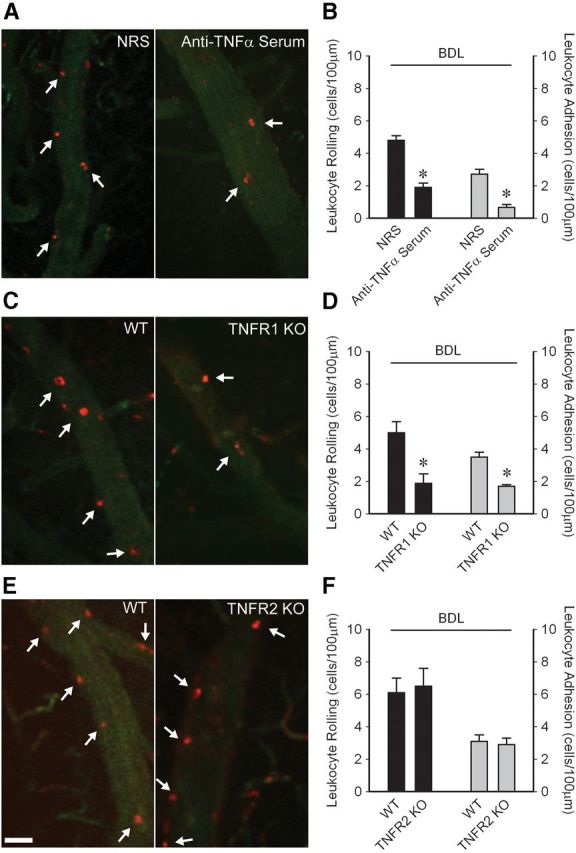
Peripheral TNFα acting via TNFR1 drives increased monocyte–CEC adhesive interactions in BDL mice. Representative images of cerebral vasculature in (A) NRS versus anti-TNFα treated, (C) WT versus TNFR1 KO, and (E) WT versus TNFR2 KO BDL mice. Circulating leukocytes were labeled with rhodamine (red); CECs labeled with FITC anti-CD31 (green). Scale bar, 40 μm. Arrows indicate leukocytes rolling/adherent along CECs. Quantification of number of leukocytes that rolled (cells/min/100 μm) or were adherent (cells/100 μm) along CECs in (B) NRS versus anti-TNFα BDL, (D) WT versus TNFR1 KO BDL, and (F) WT versus TNFR2 KO BDL mice. All data expressed as mean ± SEM, n = 5–6/group, *p < 0.005, #p < 0.01. For leukocyte rolling and adhesion, data from five vessels of 30- to 70-μm-diameter was averaged for each mouse.
P-selectin mediates monocyte–CEC adhesive interactions which are associated with microglial activation, decreased neural excitability, and sickness behaviors
We next asked whether there was a link between monocyte–CEC adhesive interactions, microglial activation, and changes in neural excitability and sickness behaviors in BDL mice. TNFα is known to upregulate expression of adhesion molecules, such as P-selectin on CECs (Carvalho-Tavares et al., 2000). Furthermore, monocytes express adhesion molecules, such as P-selectin glycoprotein ligand (PSGL)-1, which is a ligand for P-selectin (Shi and Pamer, 2011). To determine whether P-selectin mediated the observed monocyte–CEC interactions, BDL mice were treated systemically with an anti-P-selectin antibody. Blocking of P-selectin prevented rolling and adhesion of monocytes along CECs in BDL mice (Fig. 6A). Similar findings were also made in PSGL-1 KO BDL mice (Fig. 6B). Furthermore, inhibition of monocyte rolling and adhesion with an anti-P-selectin antibody resulted in a significant reduction in the number of activated microglia, as well as normalization of seizure thresholds and improvement in sickness behaviors (Fig. 6C–E).
Figure 6.
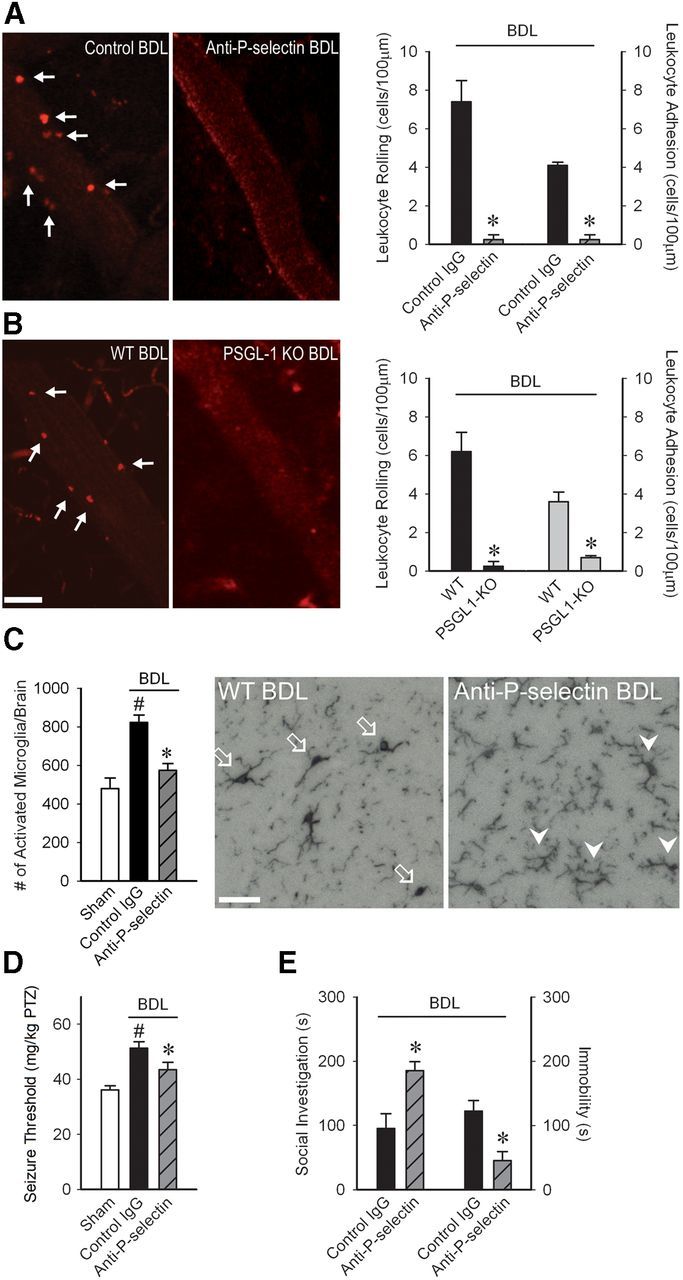
P-selectin driven monocyte–CEC adhesive interactions mediate microglial activation, central neural excitability and sickness behaviors in BDL mice. Representative images of cerebral vasculature in (A) control versus anti-P-selectin treated BDL mice and (B) WT versus PSGL-1 KO BDL mice. Circulating leukocytes were labeled with rhodamine (red). Scale bars: A, B, 40 μm. Arrows indicate leukocytes rolling/adherent along CECs. Quantification of number of leukocytes that rolled (cells/min/100 μm) or were adherent (cells/100 μm) along CECs in (A) control versus anti-P-selectin and (B) WT versus PSGL-1 KO BDL mice; n = 5/group, *p < 0.001. C, Bar graph indicates number of activated microglia (i.e., CD11b+ CD45intermediate cells) as isolated from cerebral cortices of sham, IgG-treated, and anti-P-selectin-treated BDL mice and characterized by flow cytometry; n = 5/group; *p < 0.01 versus IgG BDL, #p < 0.05 versus sham. Representative images from brain sections depicting Iba-1+ microglia in hippocampal region of WT BDL and anti-P-selectin-treated BDL mice. Arrows indicate activated microglia; arrowheads indicate resting microglia. Scale bar, 50 μm. D, PTZ seizure thresholds (amount of PTZ in mg/kg required to induce clonic seizures) in D5 sham and control IgG or anti-P-selectin-treated BDL mice; n = 6–9/group; *p < 0.001 versus BDL controls, #p < 0.05 versus sham. E, Total time in seconds adult test mouse spent in social exploration or remained immobile during a 5 min observation period; n = 4/group, *p < 0.01, #p < 0.05. All data expressed as mean ± SEM. For leukocyte rolling and adhesion, data from five vessels of 30- to 70-μm-diameter was averaged for each mouse.
Discussion
Our current investigations reveal a novel mechanism whereby in the setting of an inflammatory process occurring outside the brain, a TNFα-TNFR1 and P-selectin driven rolling and adhesion specifically of monocytes occurs along CECs. Monocyte-mediated signaling events at the level of the cerebral vasculature have a key role in inducing signals into the brain, ultimately leading to activation of microglia, changes in neural excitability, and sickness behavior development. These studies may help explain why patients with peripheral inflammatory diseases treated with anti-TNFα or anti-leukocyte adhesion therapy report marked improvements in quality of life (Feagan et al., 2007; Revicki et al., 2007; Rudick et al., 2007; Loftus et al., 2008; Putzki et al., 2009; Strand and Khanna, 2010; Dougados et al., 2012).
Systemic inflammatory diseases are commonly associated with activation of circulating leukocytes and elevated circulating cytokine levels (e.g., TNFα; Neuman et al., 2002) which in turn can mediate activation of vascular endothelium. In addition, stimulation of neural pathways of communication involving vagal afferents can lead to microglial activation, which in turn can impact CEC phenotype. Activation of CECs is an important step in relaying signals from the periphery to the brain (Gosselin and Rivest, 2008). We now show that in mice with hepatic inflammation, at a time when changes in neural excitability and development of sickness behaviors are evident, circulating monocytes interact with CECs. Despite the presence of monocyte rolling and adhesion along CECs, we could not detect any increase in cerebral monocyte infiltration in inflamed mice at this time. This is an important observation because monocytes that infiltrate the brain could produce mediators, such as TNFα, that can promote microglial activation and changes in neurotransmission (Kuno et al., 2005). Although, we previously documented cerebral monocyte recruitment after more prolonged liver inflammation (day 10 post-BDL; D'Mello et al., 2009), our current studies demonstrate that monocyte–CEC adhesive interactions play a key role in mediating sickness behaviors, without a need for monocyte infiltration into the brain. Furthermore, our observations in day 5 BDL mice suggest an inability of monocytes to transmigrate across CECs despite overt ongoing monocyte–CEC adhesive interactions. Similar observations of delayed cerebral monocyte infiltration have also been made by Audoy-Rémus et al. (2008), who documented a rapid increase in the number of monocytes adherent to CECs (as observed immunohistochemically) in response to peripheral LPS administration. However, significantly increased numbers of monocytes were not evident in the cerebral perivascular space until 3 d post-LPS treatment.
Our current studies identify P-selectin and PSGL-1 as critical mediators of monocyte–CEC adhesive interactions in BDL mice. This observation was somewhat surprising as P-selectin also supports neutrophil rolling along vascular endothelium (Carvalho-Tavares et al., 2000; Månsson et al., 2000). In addition, acute systemic injection of TNFα in mice has been shown to promote neutrophil predominant rolling/adhesion along CECs (Carvalho-Tavares et al., 2000). These findings suggest that more prolonged exposure, to what are likely a wider range of circulating inflammatory stimuli, may drive recruitment of leukocytes along the cerebral vasculature from an earlier neutrophil to a later monocyte predominant process. Interestingly, this type of shift has been suggested to occur in models of atherosclerosis (Hristov and Weber, 2011). Another possibility includes the generation by CECs of a mediator that inhibits neutrophil adherence. Consistent with this hypothesis, iNOS expression was increased in CECs in BDL mice, and nitric oxide has been reported to prevent neutrophil adhesive interactions with vascular endothelium (Hickey et al., 1997). These suggestions warrant further investigation.
For the first time, we demonstrate that microglial activation is intimately linked to TNFα-driven monocyte adhesive interactions with CECs during peripheral organ inflammation. Specifically, inhibition of peripheral TNFα signaling prevented monocyte–CEC adhesive interactions, activation of microglia and sickness behavior development; an effect mirrored by directly preventing monocyte–CEC adhesive interactions by blocking P-selectin. Anti-P-selectin therapy has not previously been associated with improvement in inflammation associated altered behavior and symptoms. Our observations parallel findings in the clinical setting where patients with multiple sclerosis or Crohn's disease, treated systemically with anti-α4-integrin therapy, report marked improvements in symptoms and quality of life (Feagan et al., 2007; Rudick et al., 2007; Targan et al., 2007; Putzki et al., 2009). Furthermore, ours are the first data demonstrating that peripheral organ inflammation can drive endothelial–immune cell interactions at sites remote from the inflamed tissue, and that these adhesive interactions can subsequently drive activation of cells deeper within a tissue, which are removed from the general circulation (microglia in this case). These findings may also have implications for understanding how inflammation at one site can lead to diseases at sites remote from the inflammation (e.g., gingivitis associated with coronary artery disease and atherosclerosis (Cairo et al., 2009), which are also monocyte driven disorders. Furthermore, we present evidence that iNOS induction in CECs links peripheral TNFα signaling to microglial activation. Although, increased iNOS expression in the brain has been demonstrated in models of systemic LPS-induced inflammation (Wong et al., 1996), to our knowledge our findings are the first to link peripheral organ inflammation, iNOS, and microglial activation.
The link between peripheral cytokines, microglia, and neural excitability is poorly understood, but is of obvious potential clinical relevance. Previously Riazi et al. (2008) showed that colitic mice have enhanced seizure susceptibility which was associated with microglial activation and increased hippocampal TNFα levels. Moreover, blocking central TNFα resulted in normalization of seizure thresholds in colitic mice. We demonstrate that hepatic inflammation is linked to depressed central neural excitability, a process that could be reversed by blocking peripheral TNFα signaling and/or monocyte–CEC adhesive interactions. These findings would suggest that central and peripheral TNFα may be acting via different mechanisms in altering central neurotransmission. Furthermore, these exciting observations are consistent with clinical data from patients with a number of peripheral inflammatory diseases who demonstrate marked improvements in sickness behaviors upon receiving systemic anti-TNFα therapy (Revicki et al., 2007; Loftus et al., 2008; Strand and Khanna, 2010).
Our novel observations highlight a new signaling pathway between an inflamed organ and the brain, which plays a key role in microglial activation, alterations in neural excitability and sickness behavior development. These findings have significant implications for our understanding of mechanisms leading to changes within the brain which are commonly associated with peripheral inflammatory diseases, and which often lead to marked reductions in patient quality of life. Moreover, this pathway offers a number of potential targets for therapeutic intervention.
Footnotes
This work was supported by operating grants from Canadian Institutes of Health Research (CIHR) to M.G.S. and Q.J.P., Alberta Innovates Health Solutions to Q.J.P. and Crohn's and Colitis Foundation of Canada to D.M.M., as well as by the Live Cell Imaging Facility funded by an equipment and infrastructure grant from Canadian. Foundation Innovation and Alberta Science and Research Authority. C.D. was a PhD candidate supported by a CIHR Frederick Banting doctoral award. K.R. was supported by postdoctoral fellowships from Alberta Heritage Foundation for Medical Research (AHFMR) and Savoy Foundation. We thank the following individuals: Drs Keith Sharkey and Jaideep Bains for comments on the paper; Dr. Donna-Marie McCafferty, Dr. Pina Colarusso, and Jen Amon, University of Calgary Live Cell Imaging Facility, for microscope training and technical advice related to imaging; Mio Tsutsui for performing the Iba-1 immunohistochemistry; Carol Gwozd, for technical advice with immunohistochemistry; and Laurie Kennedy and Yiping Liu, University of Calgary Flow Cytometry Core Facility, for assistance with flow cytometry.
The authors declare no competing financial interests.
References
- Ahmed Z, Shaw G, Sharma VP, Yang C, McGowan E, Dickson DW. Actin-binding proteins coronin-1a and IBA-1 are effective microglial markers for immunohistochemistry. J Histochem Cytochem. 2007;55:687–700. doi: 10.1369/jhc.6A7156.2007. [DOI] [PubMed] [Google Scholar]
- Audoy-Rémus J, Richard JF, Soulet D, Zhou H, Kubes P, Vallières L. Rod-shaped monocytes patrol the brain vasculature and give rise to perivascular macrophages under the influence of proinflammatory cytokines and angiopoietin-2. J Neurosci. 2008;28:10187–10199. doi: 10.1523/JNEUROSCI.3510-08.2008. [DOI] [PMC free article] [PubMed] [Google Scholar]
- Biscaro B, Lindvall O, Tesco G, Ekdahl CT, Nitsch RM. Inhibition of microglial activation protects hippocampal neurogenesis and improves cognitive deficits in a transgenic mouse model for Alzheimer's disease. Neurodegener Dis. 2012;9:187–198. doi: 10.1159/000330363. [DOI] [PMC free article] [PubMed] [Google Scholar]
- Burak KW, Le T, Swain MG. Increased sensitivity to the locomotor-activating effects of corticotropin-releasing hormone in cholestatic rats. Gastroenterology. 2002;122:681–688. doi: 10.1053/gast.2002.31878. [DOI] [PubMed] [Google Scholar]
- Cabal-Hierro L, Lazo PS. Signal transduction by tumor necrosis factor receptors. Cell Signal. 2012;24:1297–1305. doi: 10.1016/j.cellsig.2012.02.006. [DOI] [PubMed] [Google Scholar]
- Cairo F, Nieri M, Gori AM, Rotundo R, Castellani S, Abbate R, Pini-Prato GP. Periodontal variables may predict sub-clinical atherosclerosis and systemic inflammation in young adults: a cross-sectional study. Eur J Oral Implantol. 2009;2:125–133. [PubMed] [Google Scholar]
- Capuron L, Miller AH. Immune system to brain signaling: neuropsychopharmacological implications. Pharmacol Ther. 2011;130:226–238. doi: 10.1016/j.pharmthera.2011.01.014. [DOI] [PMC free article] [PubMed] [Google Scholar]
- Carvalho-Tavares J, Hickey MJ, Hutchison J, Michaud J, Sutcliffe IT, Kubes P. A role for platelets and endothelial selectins in tumor necrosis factor-α induced leukocyte recruitment in the brain microvasculature. Circ Res. 2000;87:1141–1148. doi: 10.1161/01.RES.87.12.1141. [DOI] [PubMed] [Google Scholar]
- D'Mello C, Swain MG. Liver-brain inflammation axis. Am J Physiol Gastrointest Liver Physiol. 2011;301:G749–G761. doi: 10.1152/ajpgi.00184.2011. [DOI] [PubMed] [Google Scholar]
- D'Mello C, Le T, Swain MG. Cerebral microglia recruit monocytes into the brain in response to tumor necrosis factorα signaling during peripheral organ inflammation. J Neurosci. 2009;29:2089–2102. doi: 10.1523/JNEUROSCI.3567-08.2009. [DOI] [PMC free article] [PubMed] [Google Scholar]
- Dougados M, Ripert M, Hilliquin P, Brocq O, Brault Y, Logeart I. Onset of action of etanercept in rheumatoid arthritis based on patient-reported outcomes. Clin Exp Rheumatol. 2012;30:266–268. [PubMed] [Google Scholar]
- Fabene PF, et al. A role for leukocyte-endothelial adhesion mechanisms in epilepsy. Nat Med. 2008;14:1377–1383. doi: 10.1038/nm.1878. [DOI] [PMC free article] [PubMed] [Google Scholar]
- Faust N, Varas F, Kelly LM, Heck S, Graf T. Insertion of enhanced green fluorescent protein into the lysozyme gene creates mice with green fluorescent granulocytes and macrophages. Blood. 2000;96:719–726. [PubMed] [Google Scholar]
- Feagan BG, Sandborn WJ, Hass S, Niecko T, White J. Health-related quality of life during natalizumab maintenance therapy for Crohn's disease. Am J Gastroenterol. 2007;102:2737–2746. doi: 10.1111/j.1572-0241.2007.01508.x. [DOI] [PubMed] [Google Scholar]
- Galic MA, Riazi K, Heida JG, Mouihate A, Fournier NM, Spencer SJ, Kalynchuk LE, Teskey GC, Pittman QJ. Postnatal inflammation increases seizure susceptibility in adult rats. J Neurosci. 2008;28:6904–6913. doi: 10.1523/JNEUROSCI.1901-08.2008. [DOI] [PMC free article] [PubMed] [Google Scholar]
- Getts DR, Terry RL, Getts MT, Müller M, Rana S, Shrestha B, Radford J, van Rooijen N, Campbell IL, King NJ. Ly6C+ “inflammatory monocytes” are microglial precursors recruited in a pathogenic manner in West Nile virus encephalitis. J Exp Med. 2008;205:2319–2337. doi: 10.1084/jem.20080421. [DOI] [PMC free article] [PubMed] [Google Scholar]
- Gosselin D, Rivest S. MyD88 signaling in brain endothelial cells is essential for the neuronal activity and glucocorticoid release during systemic inflammation. Mol Psychiatry. 2008;13:480–497. doi: 10.1038/sj.mp.4002122. [DOI] [PubMed] [Google Scholar]
- Graff LA, Vincent N, Walker JR, Clara I, Carr R, Ediger J, Miller N, Rogala L, Rawsthorne P, Lix L, Bernstein CN. A population-based study of fatigue and sleep difficulties in inflammatory bowel disease. Inflamm Bowel Dis. 2011;17:1882–1889. doi: 10.1002/ibd.21580. [DOI] [PubMed] [Google Scholar]
- Henry CJ, Huang Y, Wynne A, Hanke M, Himler J, Bailey MT, Sheridan JF, Godbout JP. Minocycline attenuates lipopolysaccharide (LPS)-induced neuroinflammation, sickness behavior and anhedonia. J Neuroinflammation. 2008;5:15. doi: 10.1186/1742-2094-5-15. [DOI] [PMC free article] [PubMed] [Google Scholar]
- Hickey MJ, Sharkey KA, Sihota EG, Reinhardt PH, Macmicking JD, Nathan C, Kubes P. Inducible nitric oxide synthase-deficient mice have enhanced leukocyte-endothelium interactions in endotoxemia. FASEB J. 1997;11:955–964. doi: 10.1096/fasebj.11.12.9337148. [DOI] [PubMed] [Google Scholar]
- Hristov M, Weber C. Differential role of monocyte subsets in atherosclerosis. Throm Haemost. 2011;106:757–762. doi: 10.1160/TH11-07-0500. [DOI] [PubMed] [Google Scholar]
- Hu Y, Wu DL, Luo CX, Zhu LJ, Zhang J, Wu HY, Zhu DY. Hippocampal nitric oxide contributes to sex difference in affective behaviors. Proc Natl Acad Sci U S A. 2012;109:14224–14229. doi: 10.1073/pnas.1207461109. [DOI] [PMC free article] [PubMed] [Google Scholar]
- Hunter MM, Wang A, Parhar KS, Johnston MJ, Van Rooijen N, Beck PL, McKay DM. In vitro-derived alternatively activated macrophages reduce colonic inflammation in mice. Gastroenterology. 2010;138:1395–1405. doi: 10.1053/j.gastro.2009.12.041. [DOI] [PubMed] [Google Scholar]
- Kerfoot SM, D'Mello C, Nguyen H, Ajuebor MN, Kubes P, Le T, Swain MG. TNF-α secreting monocytes are recruited into the brains of cholestatic mice. Hepatology. 2006;43:154–162. doi: 10.1002/hep.21003. [DOI] [PubMed] [Google Scholar]
- Kim JV, Kang SS, Dustin ML, McGavern DB. Myelomonocytic cell recruitment causes fatal CNS vascular injury during acute viral meningitis. Nature. 2009;457:191–195. doi: 10.1038/nature07591. [DOI] [PMC free article] [PubMed] [Google Scholar]
- Kuno R, Wang J, Kawanokuchi J, Takeuchi H, Mizuno T, Suzumura A. Autocrine activation of microglia by tumor necrosis factor-α. J Neuroimmunol. 2005;162:89–96. doi: 10.1016/j.jneuroim.2005.01.015. [DOI] [PubMed] [Google Scholar]
- Lee WY, Moriarty TJ, Wong CH, Zhou H, Strieter RM, van Rooijen N, Chaconas G, Kubes P. An intravascular immune response to Borrelia burgdorferi involves Kupffer cells and iNKT cells. Nat Immunol. 2010;11:295–302. doi: 10.1038/ni.1855. [DOI] [PMC free article] [PubMed] [Google Scholar]
- Liu L, Cara DC, Kaur J, Raharjo E, Mullaly SC, Jongstra-Bilen J, Jongstra J, Kubes P. LPS1 is an endothelial gatekeeper of leukocyte transendothelial migration. J Exp Med. 2005;201:409–418. doi: 10.1084/jem.20040830. [DOI] [PMC free article] [PubMed] [Google Scholar]
- Loftus EV, Feagan BG, Colombel JF, Rubin DT, Wu EQ, Yu AP, Pollack PF, Chao J, Mulani P. Effects of adalimumab maintenance therapy on health-related quality of life of patients with Crohn's disease: patient-reported outcomes of the CHARM trial. Am J Gastroenterol. 2008;103:3132–3141. doi: 10.1111/j.1572-0241.2008.02175.x. [DOI] [PubMed] [Google Scholar]
- Lorton D, Lubahn CL, Zautra AJ, Bellinger DL. Proinflammatory cytokines and sickness behavior in rheumatic diseases. Curr Pharm Des. 2008;14:1242–1260. doi: 10.2174/138161208799316375. [DOI] [PubMed] [Google Scholar]
- Mandhane SN, Aavula K, Rajamannar T. Timed pentylenetetrazol infusion test: a comparative analysis with s.c.PTZ and MES models of anticonvulsant screening in mice. Seizure. 2007;16:636–644. doi: 10.1016/j.seizure.2007.05.005. [DOI] [PubMed] [Google Scholar]
- Månsson P, Zhang XW, Jeppsson B, Johnell O, Thorlacius H. Critical role of P-selectin dependent rolling in tumor necrosis factor-α induced leukocyte adhesion and extravascular recruitment in vivo. Naunyn Schmiedebergs Arch Pharmacol. 2000;362:190–196. doi: 10.1007/s002100000268. [DOI] [PubMed] [Google Scholar]
- Neuman M, Angulo P, Malkiewicz I, Jorgensen R, Shear N, Dickson ER, Haber J, Katz G, Lindor K. Tumor necrosis factor-alpha and transforming growth factor-beta reflect severity of liver damage in primary biliary cirrhosis. J Gastroenterol Hepatol. 2002;17:196–202. doi: 10.1046/j.1440-1746.2002.02672.x. [DOI] [PubMed] [Google Scholar]
- Nguyen H, Wang H, Le T, Ho W, Sharkey KA, Swain MG. Downregulated hypothalamic 5-HT3 receptor expression and enhanced 5HT3 receptor antagonist mediated improvement in fatigue like behavior in cholestatic rats. Neurogastroenterol Motil. 2008;20:228–235. doi: 10.1111/j.1365-2982.2007.01016.x. [DOI] [PubMed] [Google Scholar]
- Nguyen K, D'Mello C, Le T, Urbanski S, Swain MG. Regulatory T cells suppress sickness behaviour development without altering liver injury in cholestatic mice. J Hepatol. 2012;56:626–631. doi: 10.1016/j.jhep.2011.09.014. [DOI] [PubMed] [Google Scholar]
- Putzki N, Yaldizli O, Tettenborn B, Diener HC. Multiple sclerosis associated fatigue during natalizumab treatment. J Neurol Sci. 2009;285:109–113. doi: 10.1016/j.jns.2009.06.004. [DOI] [PubMed] [Google Scholar]
- Revicki DA, Willian MK, Menter A, Gordon KB, Kimball AB, Leonardi CL, Langley RG, Kimel M, Okun M. Impact of adalimumab treatment on patient-reported outcomes: results from a phase III clinical trial in patients with moderate to severe plaque psoriasis. J Dermatolog Treat. 2007;18:341–350. doi: 10.1080/09546630701646172. [DOI] [PubMed] [Google Scholar]
- Riazi K, Galic MA, Kuzmiski JB, Ho W, Sharkey KA, Pittman QJ. Microglial activation and TNFα production mediate altered CNS excitability following peripheral inflammation. Proc Natl Acad Sci U S A. 2008;105:17151–17156. doi: 10.1073/pnas.0806682105. [DOI] [PMC free article] [PubMed] [Google Scholar]
- Rudick RA, et al. Health-related quality of life in multiple sclerosis: effects of natalizumab. Ann Neurol. 2007;62:335–346. doi: 10.1002/ana.21163. [DOI] [PubMed] [Google Scholar]
- Sedgwick JD, Schwender S, Imrich H, Dörries R, Butcher GW, ter Meulen V. Isolation and direct characterization of resident microglial cells from the normal and inflamed central nervous system. Proc Natl Acad Sci U S A. 1991;88:7438–7442. doi: 10.1073/pnas.88.16.7438. [DOI] [PMC free article] [PubMed] [Google Scholar]
- Shafer RA, Murphy S. Activated astrocytes induce nitric oxide synthase-2 in cerebral endothelium via tumor necrosis factor α. Glia. 1997;21:370–379. doi: 10.1002/(SICI)1098-1136(199712)21:4<370::AID-GLIA4>3.0.CO;2-7. [DOI] [PubMed] [Google Scholar]
- Shi C, Pamer EG. Monocyte recruitment during infection and inflammation. Nat Rev Immunol. 2011;11:762–774. doi: 10.1038/nri3070. [DOI] [PMC free article] [PubMed] [Google Scholar]
- Stirling DP, Liu S, Kubes P, Yong VW. Depletion of Ly6G/GR-1 leukocytes after spinal cord injury in mice alters wound healing and worsens neurological outcome. J Neurosci. 2009;29:753–764. doi: 10.1523/JNEUROSCI.4918-08.2009. [DOI] [PMC free article] [PubMed] [Google Scholar]
- Strand V, Khanna D. The impact of rheumatoid arthritis and treatment on patients' lives. Clin Exp Rheumatol. 2010;28:S32–S40. [PubMed] [Google Scholar]
- Targan SR, Feagan BG, Fedorak RN, Lashner BA, Pannaccione R, Present DH, Spehlmann ME, Rutgeerts PJ, Tulassay Z, Volfova M, Wolf DC, Hernandez C, Bornstein J, Sandborn WJ. Natalizumab for the treatment of active Crohn's disease: results of the ENCORE trial. Gastroenterology. 2007;132:1672–1683. doi: 10.1053/j.gastro.2007.03.024. [DOI] [PubMed] [Google Scholar]
- Tontsch U, Bauer HC. Isolation, characterization and long term cultivation of porcine and murine cerebral capillary endothelial cells. Microvasc Res. 1989;37:148–161. doi: 10.1016/0026-2862(89)90034-4. [DOI] [PubMed] [Google Scholar]
- Wong ML, Rettori V, al-Shekhlee A, Bongiorno PB, Canteros G, McCann SM, Gold PW, Licinio J. Inducible nitric oxide synthase gene expression in the brain during systemic inflammation. Nat Med. 1996;2:581–584. doi: 10.1038/nm0596-581. [DOI] [PubMed] [Google Scholar]
- Wu DC, Jackson-Lewis V, Vila M, Tieu K, Teismann P, Vadseth C, Choi DK, Ischiropoulos H, Przedborski S. Blockade of microglial activation is neuroprotective in the 1-methyl-4-phenyl-1,2,3,6-tetrahydropyridine mouse model of Parkinson disease. J Neurosci. 2002;22:1763–1771. doi: 10.1523/JNEUROSCI.22-05-01763.2002. [DOI] [PMC free article] [PubMed] [Google Scholar]
- Yenari MA, Xu L, Tang XN, Qiao Y, Giffard RG. Microglia potentiate damage to blood–brain barrier constituents. Stroke. 2006;37:1087–1093. doi: 10.1161/01.STR.0000206281.77178.ac. [DOI] [PubMed] [Google Scholar]