Abstract
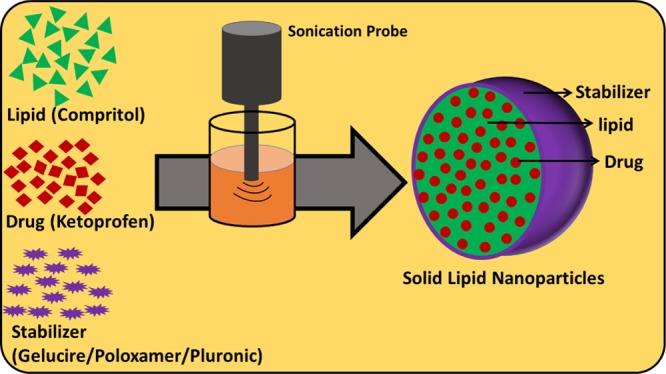
Because of excellent bioavailability and high biocompatibility, solid lipid nanoparticles (SLNs) have gained attention in recent years, especially in drug delivery systems. SLNs are composed of a drug that is loaded in a lipid matrix and stabilized by surfactants. In this work, we have investigated the feasibility of the acoustic cavitation-assisted hot melt mixing method for the formulation of SLNs using different stabilizers. A lipid Compritol 888 ATO (CPT) and a poorly water-soluble drug ketoprofen (KP) were used as a model lipid and drug, respectively. Gelucire 50/13 (GEL), poloxamer 407 (POL), and Pluronic F-127 (PLU) were used as the stabilizers. The effect of the stabilizers on the physico-chemical properties of SLNs was thoroughly studied in this work. The particle size and stability in water at different temperatures were measured using a dynamic light scattering method. The spherical shape (below 250 nm) and core–shell morphology were confirmed by field-emission scanning electron microscopy and transmission electron microscopy. The chemical, crystal, and thermal properties of SLNs were studied by FTIR, XRD analysis, and DSC, respectively. SLNs prepared using different stabilizers showed an encapsulation efficiency of nearly 90% and a drug loading efficiency of 12%. SLNs showed more than 90% of drug released in 72 h and increased with pH was confirmed using in vitro drug release studies. SLNs were nontoxic to raw 264.7 cells. All stabilizers were found suitable for acoustic cavitation-assisted SLN formulation with high encapsulation efficiency and drug loading and good biocompatibility.
1. Introduction
The synthesis of new drug molecules has become progressive with the advancement of computer-aided design tools.1 The poor solubility of nearly 40% of drug molecules is the major reason for the failure in the main stream.2,3 Based on the biopharmaceutical classification system (BCS), poorly water-soluble drugs have either class II or IV active pharmaceutical ingredients (APIs).4 There are several approaches such as particle size reduction,5,6 crystal engineering,7 traditional colloidal carrier system formulations,8 polymeric nanoparticles,9 and lipid-based nanoparticles to improve the bioavailability of BCS class II and IV drugs.10 Among the several nanocarriers, polymeric/lipid nanoparticles are the classic nanocarriers. However, polymeric nanoparticles have cytotoxicity compared to lipids. Various lipid-based formulations are commercialized or are at various phases of clinical studies.11,12
Lipid-based nanoparticles for drug delivery are a promising approach among many nanotechnology-based drug carrier systems.13 Briefly, lipid-based nanocarriers are classified as liposomes, self-emulsifying drug delivery systems, solid lipid nanoparticles (SLNs), and nanostructured lipid carriers.14 Liposomes have a short shelf-life, poor colloidal stability, and high cost. In 1991, a new nanocarrier system, namely, SLNs, was introduced to overcome the disadvantages associated with liposomes.15 The major advantages of SLNs are high biocompatibility, stability, nontoxicity, and feasibility of controlled release of drug for targeted delivery, and these properties make them a promising candidate over other nanocarrier systems.16 Speiser and coworkers formulated SLNs through a spray-drying technique in the 80’s.17 Quick progress has been made and many formulations are commercialized and available in the market now.15,18 SLNs are composed of a solid lipid matrix loaded with drugs and stabilized with nontoxic surfactants. SLNs are able to carry lipophilic as well as hydrophilic drugs. In the last 30 years, various approaches have been developed for the preparation of SLNs such as micro/nanoemulsions, high pressure homogenization, and carbon dioxide as a supercritical solvent.19 The micro/nanoemulsion method is one of the facile methods for the preparation of SLNs. The hydrophobic drug containing oil droplets that are stabilized by using isotopically and kinetically stable emulsifier thin layers make nanoemulsions.20 Nanoemulsions are widely used for several applications, including drug delivery, and it is important to control their physicochemical properties.20 The in vitro performance of nanoemulsions depends on the droplet size. Nanoemulsions can be prepared using ultrasound waves. This method is quite efficient and provides energy locally through cavitation.21,22 This energy helps in processing nanomaterials and in the preparation of SLNs.
The combination of lipids and stabilizers play a crucial role in the formation of SLNs. These also affect the size/shape of the particles, entrapment efficiency, drug loading, stability, and the drug release profile.23 In the present study, we have prepared the nanoemulsions using ultrasonication. The acoustic cavitation-assisted hot melt mixing method is used to prepare SLNs with a high entrapment and drug loading efficiency. We have selected Compritol as a model lipid for encapsulating ketoprofen (KP) based on the solubility or miscibility of KP in molten lipid. KP was used as the model drug in this investigation. Stabilizers also play a crucial role in SLN formulations. In the process of SLN preparation, the stabilizer is typically dispersed in molten lipid. Stabilizers are broadly classified as three types—ionic, nonionic, and amphoteric. The advantages of nonionic stabilizers over ionic stabilizers are low toxicity, less irritation to the gastrointestinal track, and prevention of lipid degradation in vivo.24 Nonionic stabilizers Gelucire (GEL), Poloxamer 407 (POL), and Pluronic F-127 (PLU) are used in this study.25 Gelucire is a water-dispersible stabilizer for lipid-based formulations which is used to enhance the oral bioavailability of poor water-soluble APIs.26 Gelucire forms microemulsions in aqueous media by self-emulsification. Poloxamer and pluronic are tri-block copolymers with the same chain length and contains polypropylene oxide and polyethylene oxide, with trade names of CAS (9003-11-6) and MDL number (MFCD00082049), respectively.27
The main objective of this study is to investigate the feasibility of the acoustic cavitation-assisted hot melt mixing method for the formulation of SLNs with high encapsulation efficiency and drug loading using different stabilizers but not limited to KP-loaded Compritol nanoparticles. The effect of experimental parameters such as concentrations of lipid, stabilizers, and drug, and the effect of different stabilizers on the physicochemical properties and performance of SLNs such as cytotoxicity against raw 264.7 cell line, drug-release behavior of the formulated drug-loaded SLNs were studied in the present work.
2. Results and Discussion
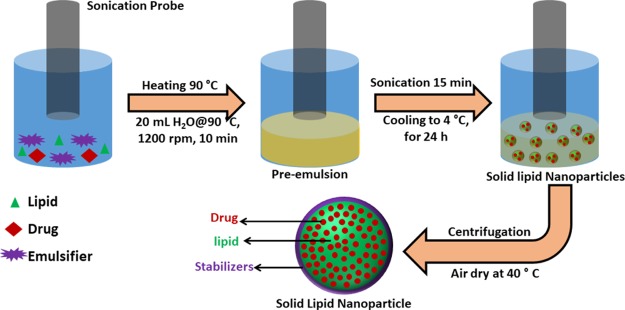
This work focuses on the formulation of SLNs through the acoustic cavitation-assisted hot melt mixing method using different stabilizers, and the investigation of the effect of different stabilizers and other experimental parameters on the physicochemical properties of SLNs. The choice of lipid as a drug-delivery carrier depends on drug solubility or miscibility in the lipid.17,19 Based on the solubility studies of KP in different lipids, we chose Compritol as the lipid carrier and KP as a model drug. To the hot melt mixture of Compritol, KP, and stabilizers, quick addition of water under stirring led to pre-emulsion formation. Stabilizers stabilize the lipid droplets. After probe sonication for 15 min at 90 °C, the lipid droplets were broken down, resulting in the formation of nanoemulsions. Cooling the nanoemulsion below the melting point of lipid led to the precipitation of the lipid droplets and thereby forming SLNs.
2.1. Effect of the Lipid to Stabilizer Ratio
It is interesting to understand the effect of experimental parameters to prepare the SLNs with excellent encapsulation efficiency, drug loading, and a smaller particle size. Hence, we investigated the effect of parameters such as the ratio of lipid to stabilizers and the effect of different stabilizers and concentration of the drug on SLNs. The other experimental conditions affecting the particle size and shape of SLNs such as sonication, water volume, and temperature were optimized in our previous study and the same were used here.28 We initially investigated the effect of the lipid to stabilizer ratio on SLNs, and Table 1 depicts the corresponding results—particle size, polydispersity index, and zeta potential. To study the effect of the lipid to stabilizer ratio, we prepared SLNs by varying the lipid to stabilizer ratio from 4:1 to 1:1. A fixed amount of lipid, 400 mg, was used. The stabilizer amount was increased by 50 mg per increment, which ranged from 100 to 400 mg. It is clear from Table 1 that the prepared SLN particle size decreased with the increase of the stabilizer concentration. The similar trend was observed for all the SLNs prepared using stabilizers—GEL, POL, and PLU. The SLN particle size decreased from 765 ± 61, 811 ± 45, and 856 ± 65 to 452 ± 33, 369 ± 31, and 421 ± 39 nm, respectively, for CPT–GEL, CPT–POL, and CPT–PLU, when the lipid to stabilizer ratio was changed from 4:1 to 1:1. Due to the decrease in the particle size, the surface area was enhanced in a short time during sonication. Therefore, the kinetic aspects must be considered.23 The number of stabilizer molecules increased as the ratio of lipid to stabilizer decreased and hence, the new surface generated during sonication by the reduction in particle size can be stabilized by a greater number of stabilizer molecules. However, it is widely suggested to use the minimum concentration of stabilizers in drug-delivery formulations, because cytotoxicity increases with increasing stabilizer concentration.29 So, an optimum lipid to stabilizer ratio has been used for further experiments. The ratios 8:5, 2:1, and 2:1 were optimum for lipid to stabilizer combinations for GEL, POL, and PLU, respectively. Above the optimum ratios, the further decrease in the particle size was not observed even after increasing the stabilizer concentration to 400 mg. The particle size of SLNs at optimum lipid to stabilizer ratios were 489 ± 39, 424 ± 41, and 461 ± 58 nm, respectively, for CPT–GEL, CPT–POL, and CPT–PLU. CPT–GEL, CPT–POL, and CPT–PLU are used throughout for bare SLNs. CPT–GEL denotes the bare SLNs of Compritol prepared using the stabilizer Gelucire.
Table 1. Effect of the Lipid to Stabilizer Ratio on the Particle Size, Polydispersity Index, and Zeta Potentials of the Formulated Bare SLNs.
| particle size/(d/nm) |
PDI |
zeta potential/(ζ/mV) |
||||||||||
|---|---|---|---|---|---|---|---|---|---|---|---|---|
| s. no. | lipid/mg | stabilizer/mg | ratio | CPT–GEL | CPT–POL | CPT–PLU | CPT–GEL | CPT–POL | CPT–PLU | CPT–GEL | CPT–POL | CPT–PLU |
| 1 | 400 | 100 | 4:1 | 765 ± 61 | 811 ± 45 | 856 ± 65 | 0.521 ± 0.07 | 0.534 ± 0.04 | 0.573 ± 0.06 | –36.6 ± 9.2 | –33.9 ± 6.2 | –28.4 ± 10.3 |
| 2 | 400 | 150 | 8:3 | 752 ± 50 | 583 ± 47 | 678 ± 69 | 0.523 ± 0.06 | 0.576 ± 0.04 | 0.611 ± 0.08 | –32.7 ± 9.7 | –28.1 ± 4.9 | –31.3 ± 8.1 |
| 3 | 400 | 200 | 2:1 | 684 ± 53 | 424 ± 41 | 461 ± 58 | 0.499 ± 0.06 | 0.510 ± 007 | 0.598 ± 0.07 | –25.1 ± 7.4 | –23.5 ± 4.4 | –25.2 ± 5.9 |
| 4 | 400 | 250 | 8:5 | 489 ± 39 | 416 ± 53 | 459 ± 45 | 0.513 ± 0.08 | 0.509 ± 0.05 | 0.541 ± 0.07 | –22.8 ± 6.1 | –22.9 ± 4.5 | –24.9 ± 6.1 |
| 5 | 400 | 300 | 4:3 | 472 ± 36 | 397 ± 29 | 452 ± 52 | 0.415 ± 007 | 0.532 ± 0.05 | 0.546 ± 0.05 | –21.0 ± 6.3 | –22.3 ± 4.7 | –23.2 ± 7.2 |
| 6 | 400 | 350 | 8:7 | 459 ± 42 | 373 ± 37 | 438 ± 44 | 0.447 ± 0.06 | 0.501 ± 0.03 | 0.578 ± 0.06 | –18.6 ± 5.2 | –21.9 ± 3.8 | –22.2 ± 5.8 |
| 7 | 400 | 400 | 1:1 | 452 ± 33 | 369 ± 31 | 421 ± 39 | 0489 ± 0.05 | 0.475 ± 0.04 | 0.538 ± 0.04 | –19.4 ± 7.1 | –18.9 ± 4.2 | –19.4 ± 4.9 |
2.2. Effect of Drug Concentration
To understand the effect of drug concentration on the particle size, SLNs loaded with different concentrations of the drug KP were prepared using different stabilizers—GEL, POL, and PLU at their optimum concentrations. The corresponding results are presented in Table 2. For all the formulations, an increase in the particle size with the increase of the drug concentration was observed. The maximum drug concentration was limited by the solubility or miscibility of KP in CPT. KP solubility or miscibility concentration in CPT was 25% (w/w). The drug loaded SLNs were further characterized to investigate the physicochemical properties, entrapment efficiency, drug loading, in vitro drug-release behavior, and cytotoxicity.
Table 2. Variation in the Particle Size, Polydispersity Index, and Zeta Potential of the Formulated SLNs Prepared Using the Optimum Concentration of Different Stabilizers.
| particle size/(d/nm) |
PDI |
zeta Potential/(ζ/mV) |
|||||||||
|---|---|---|---|---|---|---|---|---|---|---|---|
| s. no. | drug weight/mg | % (w/w) | KP@CPT–GEL | KP@CPT–POL | KP@CPT–PLU | KP@CPT–GEL | KP@CPT–POL | KP@CPT–PLU | KP@CPT–GEL | KP@CPT–POL | KP@CPT–PLU |
| 1 | 8 | 2 | 535 ± 56 | 485 ± 39 | 498 ± 42 | 0.51 ± 0.06 | 0.43 ± 0.05 | 0.51 ± 0.04 | –23.5 ± 2.4 | –22.6 ± 4.1 | –24.5 ± 3.8 |
| 2 | 20 | 5 | 542 ± 48 | 505 ± 58 | 511 ± 43 | 0.48 ± 0.05 | 0.45 ± 0.06 | 0.56 ± 0.03 | –23.9 ± 3.2 | –23.7 ± 3.9 | –24.2 ± 4.1 |
| 3 | 40 | 10 | 591 ± 50 | 518 ± 47 | 523 ± 37 | 0.56 ± 0.07 | 0.51 ± 0.05 | 0.61 ± 0.04 | –24.1 ± 2.9 | –22.9 ± 3.1 | –24.1 ± 3.9 |
| 4 | 60 | 15 | 624 ± 43 | 553 ± 48 | 589 ± 39 | 0.53 ± 0.06 | 0.58 ± 0.04 | 0.58 ± 0.06 | –22.4 ± 3.1 | –24.3 ± 4.1 | –23.6 ± 4.4 |
| 5 | 80 | 20 | 683 ± 52 | 589 ± 57 | 634 ± 64 | 0.59 ± 0.06 | 0.53 ± 0.07 | 0.57 ± 0.06 | –23.2 ± 2.6 | –22.3 ± 3.5 | –22.4 ± 3.6 |
| 6 | 100 | 25 | 742 ± 69 | 676 ± 52 | 699 ± 58 | 0.61 ± 0.08 | 0.59 ± 0.09 | 0.59 ± 0.05 | –23.6 ± 2.8 | –21.7 ± 3.3 | –22.7 ± 3.2 |
2.3. Zeta Potential
The electrical charge on the surface of the prepared SLNs was studied using zeta potential measurements. The corresponding zeta potential results are presented in Tables 1 and 2 for all prepared samples—drug-loaded and bare SLNs. From Table 1, it was observed that the zeta potential of SLNs without the drug was correlated with the particle size. The zeta potential tends to be in the negative range for larger particle sizes. The zeta potential of bare SLNs varied from −36.6 ± 9.2 to −19.4 ± 7.1, −33.9 ± 6.2 to −18.9 ± 4.2, and −31.3 ± 8.1 to −19.4 ± 4.9 mV for CPT–GEL, CPT–POL, and CPT–PLU, respectively, at different stabilizer concentrations. This can be due to several reasons and have been widely reported.30,31 This can be explained by the absorption of enough number of stabilizer molecules on the surface of the lipid matrix. The zeta potential also depends on the types of stabilizers, interaction between stabilizers, and the lipid matrix, which also depends on the available functional group, concentration of stabilizers, and physicochemical properties of stabilizers in water or aqueous colloidal dispersion. Above the optimum concentration of the stabilizer, change in the zeta potential was negligible. The zeta potential also reflects the stability of nanoparticles. In the case of drug-loaded SLNs (−20 to −25 mV), there was almost no variation in the zeta potential compared to the respective bare SLNs, indicating that no drug molecules were present on the SLN surface and there was no change in the surface composition of the SLNs even when the drug was loaded. All the prepared SLNs at optimum conditions, without drug and with drug, fall in the acceptable range and indicated the good stability of the prepared SLNs.32−34
2.4. Stability in Water at Different Temperatures
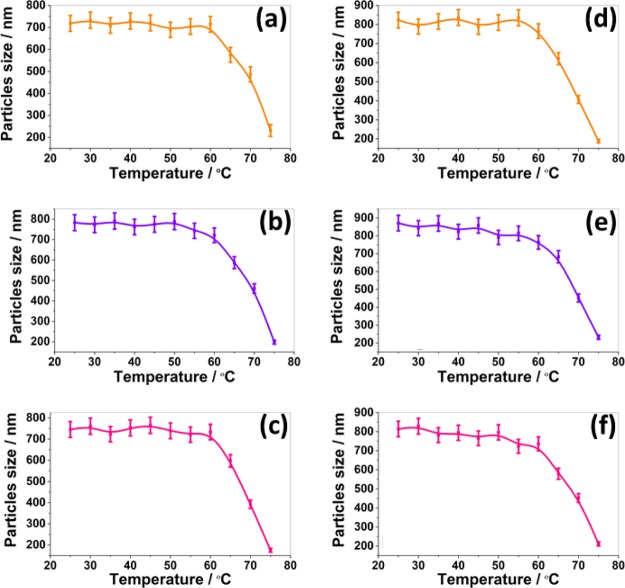
Sample stability in water at different temperature was measured using the DLS technique. The temperature of the sample chamber was tuned from 20° to 80 °C with 5 °C increment and the particle size of SLNs was monitored. The corresponding particle size at different temperatures are presented in Figure 1. There was no change in the size of the particles upto 50 °C for bare and drug-loaded SLNs prepared using the stabilizers GEL, POL, and PLU. The slight decrease in the particle size at 55 °C resulted from the melting of stabilizers from the surface of the lipid matrix. The stabilizers GEL, POL, and PLU has melting points at 46°–51°, 55°, and 53°–57 °C, respectively. Due to very close melting temperature of stabilizers, all SLNs showed similar stability in water at different temperatures. However, above 55 °C, a significant decrease in the particle size was observed. The significant decrease in the particle size beyond 55 °C was due to the melting of the Compritol matrix. At 80 °C, a complete disappearance of the particles was observed. Hence, it is concluded that SLNs are therefore stable up to 50 °C in water. The change in the stability of SLNs in water may be due to the change in microviscosity of dispersion with temperature. It is well known that microviscosity of colloidal dispersion is temperature-dependent. Microviscosity decreases with the increase in temperature and hence leads to destabilization.35
Figure 1.
Stability of the formulated bare SLNs [(a) CPT–GEL; (b) CPT–POL, and (c) GEL–PLU and drug-loaded SLNs (d) KP@CPT–GEL; (e) KP@CPT–POL; and (f) KP@CPT–PLU] in water against temperature as measured using DLS.
2.5. Morphology
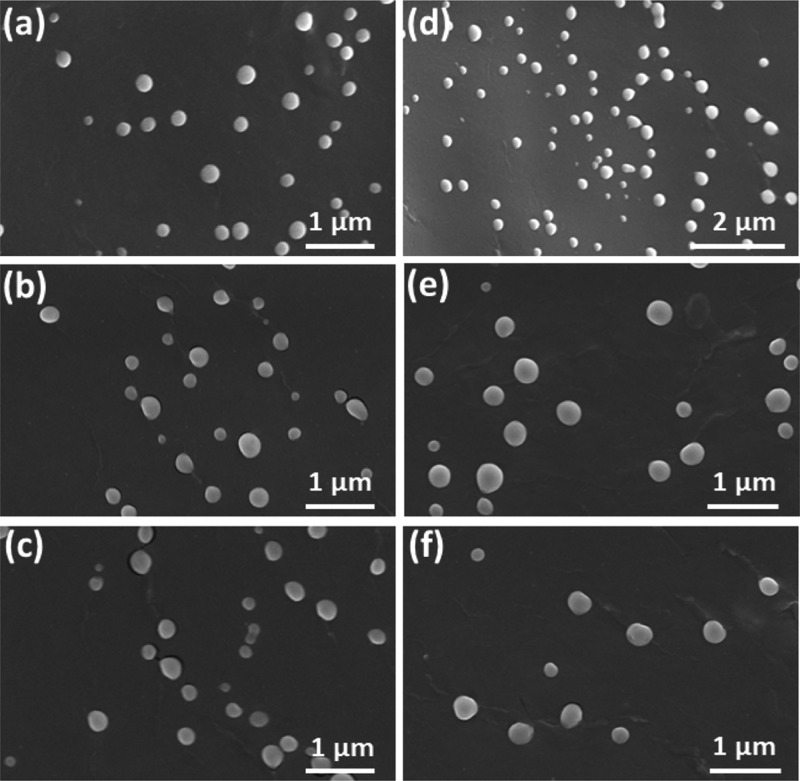
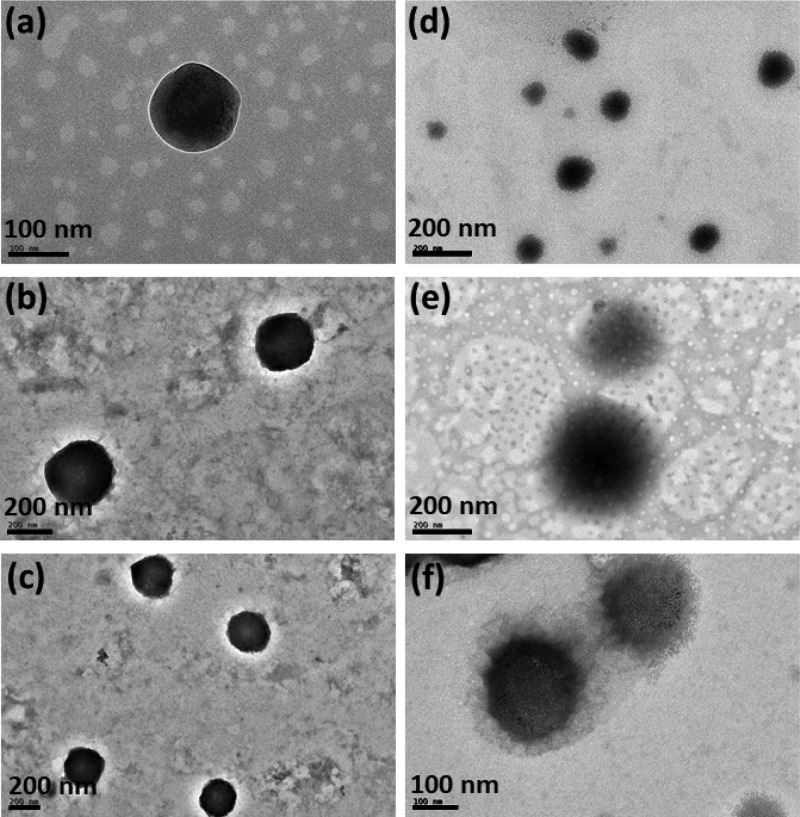
Imaging techniques such as field-emission scanning electron microscopy (FESEM) and transmission electron microscopy (TEM) were utilized to study the particle size and shape of SLNs (Figures 2 and 3). From Figure 2, it is evident that the formulated SLNs were spherical in shape. The average particle size measured from the FESEM images were 189 ± 41, 171 ± 36, 194 ± 51, 243 ± 46, 215 ± 32, and 231 ± 53 nm, respectively, for CPT–GEL, CPT–POL, CPT–PLU, KP@CPT–GEL, KP@CPT–POL, and KP@CPT–PLU. In the absence of drug, the particle size of SLNs was lower than the drug-loaded SLNs. A similar trend was observed for all SLNs prepared in presence of different stabilizers. The core–shell morphology of SLNs was confirmed by the TEM images (Figure 3). The dark core of the lipid and light corona of the stabilizer were observed in the TEM images of SLNs. The particle size (z-average, d/nm) measured using DLS was found to be higher than the particle size calculated from the FESEM images. This is may be due to several reasons. First, DLS gives the hydrodynamic diameter of particles. The hydrodynamic diameter is always larger than the accurate particle size. Second, DLS gives a larger z-average value in the presence of a small fraction of larger particle sizes. DLS cannot differentiate between individual and aggregated particles. Hence, the z-average particle size in DLS is higher.36 FESEM is a more reliable method for direct viewing and to estimate the particle size. Using several FESEM images of samples, we have estimated the average particle size.37 The sample preparation method of FESEM and TEM are also different; on a TEM grid, the particle population remains low as compared to that in FESEM. In FESEM, all particles of the dropped aqueous suspension of the sample normally settle down on a silica wafer. In TEM, the relatively bigger particles settle on the grid due to the washing cycle after phosphotungstic acid (PTA) deposition. A similar trend of result has been reported in the literature.38,39Figure 4 represents the particle sizes measured using the DLS and FESEM images of SLNs under different experimental conditions.
Figure 2.
FESEM images of the formulated bare SLNs [(a) CPT–GEL; (b) CPT–POL; and (c) GEL–PLU] and drug-loaded SLNs [(d) KP@CPT–GEL; (e) KP@CPT–POL; and (f) KP@CPT-PLU].
Figure 3.
TEM images of the formulated bare SLNs [(a) CPT–GEL; (b) CPT–POL; and (c) GEL–PLU] and drug-loaded SLNs [(d) KP@CPT–GEL; (e) KP@CPT–POL; and (f) KP@CPT–PLU].
Figure 4.
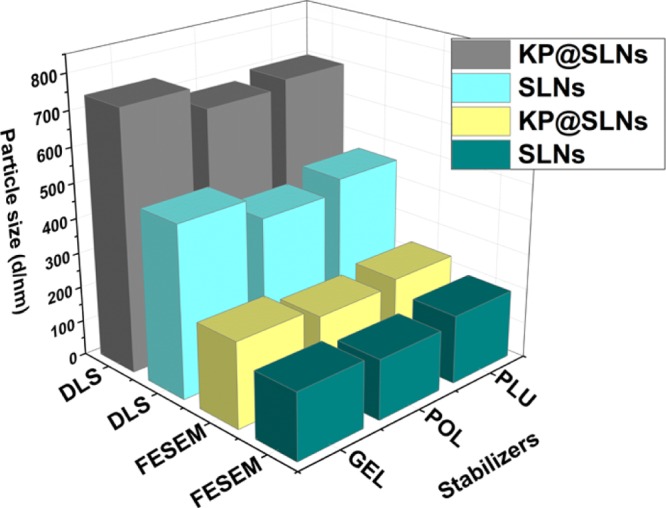
Variation in the particle sizes measured using the DLS and FESEM images of the formulated bare SLNs (SLNs) and the drug-loaded SLNs (KP@SLNs).
2.6. Crystal Nature by XRD Analysis
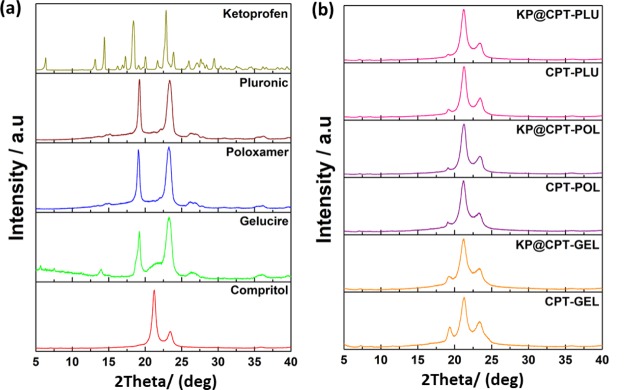
To study the crystal nature of the samples, powder X-ray diffraction (XRD) technique was used. XRD analysis was performed for all the prepared SLNs along with all the raw materials such as lipid, drug, and stabilizers. XRD patterns of all samples are presented in Figure 5. The characteristic peaks of all the materials such as CPT, KP, GEL, POL, and PLU were matched well with the literature reports.28,40−42 Major characteristic peaks of the lipid were at 2θ—21.2° and 23.3°. All the stabilizers showed two characteristic diffraction peaks. The stabilizer GEL showed peaks at 2θ(degree), 19.2° and 23.3°; POL showed peaks at 2θ(degree), 19.1° and 23.2°; and PLU showed peaks at 2θ(degree), 19.2° and 23.3°. The all bare SLNs prepared using different stabilizers showed three characteristic XRD peaks at 2θ(degree)—19.1°, 21.2°, and 23.3°, respectively. XRD patterns of drug-loaded SLNs were similar to the corresponding bare SLNs. In drug-loaded SLN diffraction patterns, the XRD peaks at 2θ(degree) 23.3° correspond to lipid, peaks at 2θ(degree) 19.1° correspond to stabilizers, and peaks at 2θ(degree) 21.2° are overlapped characteristic peaks of stabilizers and pure lipid. The XRD pattern of all formulated SLNs showed prominent peaks of the pure lipid and corresponding stabilizers. Interestingly, the peaks corresponding to the pure drug were completely absent in all the drug-loaded SLNs, Hence, it was further confirmed that the drug was present in its molecular form in the lipid matrix.
Figure 5.
XRD patterns of (a) all the raw ingredients and (b) the formulated bare and drug-loaded SLNs.
2.7. FTIR Spectroscopy
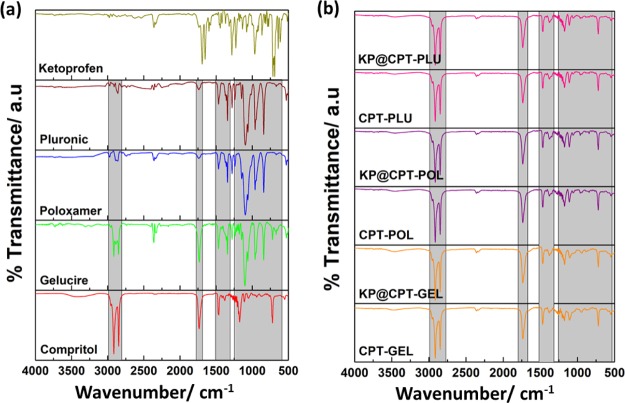
The Fourier transform infrared (FTIR) spectroscopy was used to investigate the chemical nature of the lipid, drug, and stabilizers before and after SLN formulations. The characteristic peak of the pure lipid, stabilizers and formulated SLNs are shown in Figure 6. The characteristic peaks of the lipid, drug, and all the three stabilizers matched well with the literature reports.28,40−42 The peaks at 2958, 2913, and 2958 cm–1 correspond to the pure lipid. These characteristic peaks of the pure lipid were also observed in bare SLNs as well as in drug-loaded SLNs. Interestingly, the characteristic peaks corresponding to the drug was absent in all drug-loaded SLNs, further confirming the absence of the drug on the surface of SLNs. Thus, it was clear that the drug was molecularly dispersed in the lipid matrix.
Figure 6.
FTIR spectra of (a) all the raw ingredients and (b) the formulated bare and drug-loaded SLNs.
2.8. Thermal Characterization
Thermal response of the prepared SLNs was investigated using differential scanning calorimetry (DSC) analysis. The corresponding thermal curves and data are presented in Figure 7 and Table 3 respectively. The melting points of the lipid CPT, drug KP, and stabilizers GEL, POL, and PLU were observed as endothermic peaks at 73.8°, 96.0°, 50.6°, 59.5°, and 59.8 °C, respectively. The melting points of all the raw excipients were found to be similar as reported in the literature.28,40−42 All the stabilizers’ melting points were lower than CPT and KP. SLNs were showed two endothermic peaks, the major peak corresponding to melting of the lipid and the minor peak corresponding to melting of stabilizers. The thermal response of SLNs showed the initial melting of the stabilizer and complete melting of the lipid matrix. The minor peak of the stabilizer is due to the presence of the stabilizer with an optimum concentration, which is much lower compared to that of the lipid and drug in the prepared SLNs. The major peak of the bare and drug-loaded SLNs prepared using different stabilizers were observed as endothermic peaks between 73° and 77 °C. The bare SLNs melting point was higher than the corresponding SLNs loaded with KP. The CPT–GEL and KP@CPT–GEL showed a melting point at 74.3 and 73.7 °C, respectively. Similarly, CPT–POL, KP@CPT–POL, CPT–PLU, and KP@CPT–PLU showed melting points at 76.8°, 73.9°, 75.8°, and 74.5 °C. This was due to the change in the entropy of the mixture. The decrease in the melting point of SLNs after drug loading may be due to the decrease in the crystallinity of samples. The lipid melting point decreased due to change in the particle size to a nanoscale upon SLN formulation. Similar observations were reported in the literature including our previous study.39,43 The absence of melting points corresponding to the drug in drug-loaded SLNs further confirmed the molecular dispersion of the drug in the lipid matrix. Moreover, the drug retained good solubility in the molten lipid.
Figure 7.
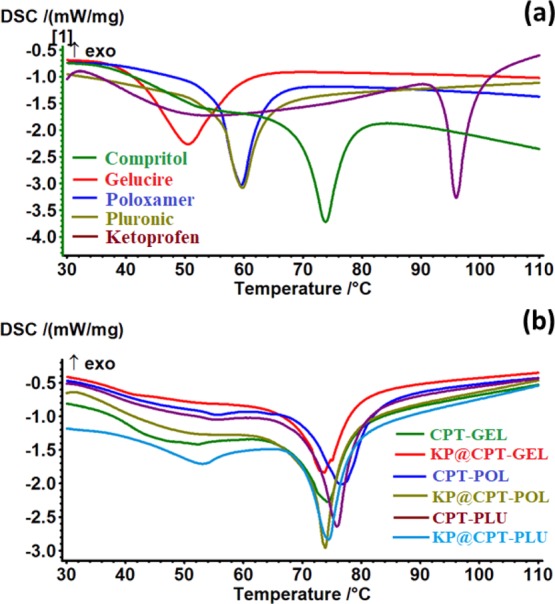
Thermal curves (DSC) of (a) all the raw ingredients and (b) the formulated bare and drug-loaded SLNs.
Table 3. Summary of the Thermal Curve (DSC) data Of all the Raw Ingredients and the Formulated Bare and Drug-Loaded SLNs.
| s. no. | composition | T (peak)/°C | T (onset)/°C | ΔH (J/g) |
|---|---|---|---|---|
| 1 | Compritol | 73.8 | 70.3 | 70.06 |
| 2 | ketoprofen | 96.0 | 94.2 | 79.3 |
| 3 | Gelucire | 50.6 | 42.6 | 98.29 |
| 4 | Poloxamer | 59.5 | 56.0 | 64.87 |
| 5 | Pluronic | 59.8 | 56.7 | 56.68 |
| 6 | CPT–GEL | 74.3 | 69.7 | 51.99 |
| 7 | KP@CPT–GEL | 73.7 | 70.6 | 49.04 |
| 8 | CPT–POL | 76.8 | 70.9 | 62.07 |
| 9 | KP@CPT–POL | 73.9 | 72.3 | 58.98 |
| 10 | CPT–PLU | 75.8 | 72.7 | 74.36 |
| 11 | KP@CPT–PLU | 74.5 | 70.6 | 64.9 |
2.9. Percentage of Encapsulation Efficiency (% EE) and Drug Loading (%DL)
Through serial dilution of the drug solution in ethanol, the absorbance was measured using a UV–visible spectrophotometer. The calibration curve was registered using concentration versus absorbance data. The drug-loaded SLNs were selectively dissolved in ethanol and based on the absorbance of the drug molecules in ethanol, %EE and %DL were calculated. The %EE of KP was observed to be 91, 87, and 89% in the drug-loaded SLNs prepared using GEL, POL, and PLU, respectively. The %DL for the KP-loaded SLNs prepared using stabilizers GEL, POL, and PLU was 12.13, 12.42 and 12.71%, respectively. It was concluded that all the three stabilizers were suitable for the preparation of Compritol nanoparticles with high drug entrapment efficiency and drug loading. The %EE and %DL were further compared with the literature reports. The SLNs composed of CPT and/or KP reported in the literature are summarized in Table S1 (Supporting Information). From Table S1, it is clear that most of the formulations (entry 1 to 12) were with %EE lower than 90%. The entries 13, 17, and 18 showed 92, 98, and 99% of %EE. However, the particle size of SLNs were in the micron range (∼2 to 790 μm). The entries 14 to 16 were having a smaller particle size with good %EE and %DL. It was confirmed that the CPT and KP combination using different stabilizers and the acoustic cavitation-assisted hot melt mixing process would be suitable for the formation of SLNs with good %EE and %DL.
2.10. In Vitro Drug Release Profile
The KP release profile from the drug-loaded SLNs was studied using the dissolution method under perfect sink conditions for 72 h in a phosphate buffered saline (pH 4.0, 7.4, and 10.0) medium at 37 ± 1 °C as shown in Figure 8. The release of drug up to 72 h is due to the molecular dispersion of the drug into the lipid matrix. This can be due to uniform distribution efficiency of acoustic cavitation, which may favor the formation of SLNs with the drug dispersed homogeneously throughout the lipid matrix. It is also widely reported that such types of SLNs take a longer time for delivery of the drug. The drug release percentage also depends on several other parameters, which cannot be ignored such as physicochemical properties of lipids, stabilizers, drugs, and their concentration, experimental parameters, and drug-release conditions. Almost 100% of the drug was released at the end of 72 h at pH 7.4 and 10.0. The drug release % increased with pH of the release media. The drug release percentage for the formulations of the drug-loaded SLNs prepared using stabilizers GEL, POL, and PLU were 92, 94, and 95%, respectively. CPT and all the three stabilizers were suitable combination for the delivery of KP under optimum conditions. It could be a good system for the drug delivery of poorly water-soluble drugs. From the in vitro drug release behavior, it was clear that the acoustic cavitation-assisted formulated SLNs are suitable for drug delivery. There was no effect of the stabilizers used in the formulation on the drug release profile. Hence, this technique could be a feasible method for the formulation of SLNs for drug delivery application.
Figure 8.
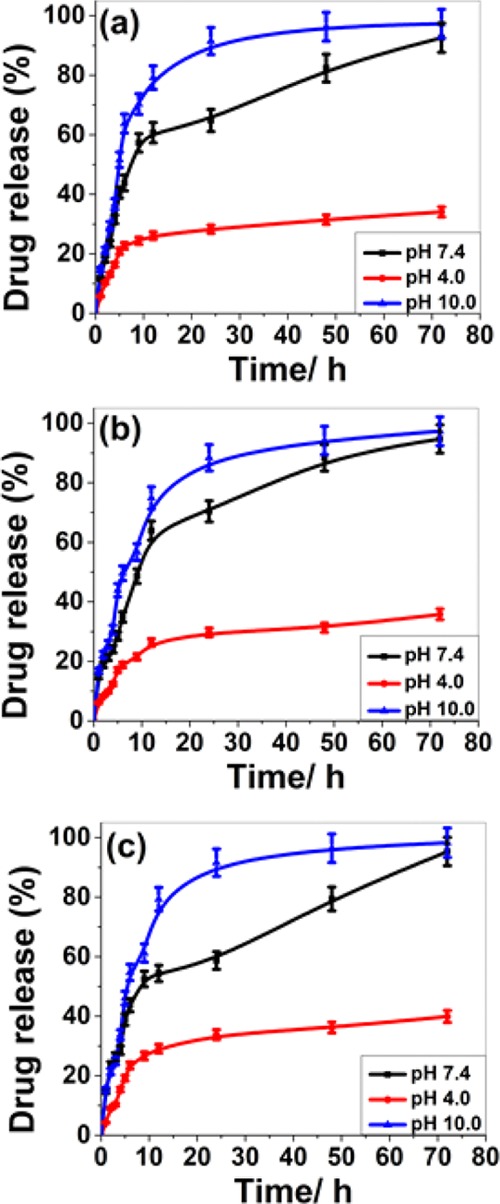
In vitro drug release profile of the formulated KP-loaded SLNs [(a) KP@CPT–GEL; (b) KP@CPT–POL, and (c) KPT@CPT-PLU] at different pH.
In the matrix system such as SLNs, the drug could be present in dissolved or dispersed form, thereby modulating the drug-release profile. The nonlinearity of the drug-release profile is shown in Figure 8. Drug-release kinetics was studied by fitting in vitro drug release data into the zero order and first order kinetics, Higuchi model, Korsmeyer-Peppas kinetic model, and Hixson–Crowell model. The linear correlation coefficient (R2) for drug-loaded SLNs at different pH are reported in Table S2 (Supporting Information). From Table S2, it is clear that the drug-release kinetics depends on pH. On increasing the pH value the drug-release kinetics follows zero and first order kinetics. At pH 10.0, KP@CPT–GEL and KP@CPT–PLU follow zero order kinetics whereas KP@CPT–POL follows the Hixson–Crowell kinetics. The drug release behavior of the formulated SLNs is closely similar at pH 7.4. However, very poor drug release was observed at pH 4.0. The linear correlation coefficient (R2) was close to 1.0 indicating that the release followed the respective kinetic model.
2.11. In Vitro Cytotoxicity
The PrestoBlue cell viability assay was used to investigate the cytotoxicity. The cytotoxicity in raw 264.7 cells was tested for all SLNs along with CPT, KP, GEL, POL, and PLU. The cells were treated for 72 h with a concentration range of SLNs from 30 to 120 μg/mL. The corresponding results are represented in Figure 9. CPT and KP were nontoxic even at a concentration of 120 μg/mL, proving excellent biocompatibility of the lipid and drug against the raw 264.7 cells. However, some toxicity has been observed for stabilizers. The order of cell viability of stabilizers after 72 h treatment (120 μg/mL) was GEL (∼40%) > POL (∼80%) ≈ PLU (∼80%). The toxic behavior of GEL has been previously reported by Sachs-Barrable et al.,44 and our result was in concordance with their report. POL, PLU, and CPT showed approximately 20, 20 and 10% cell death, respectively, at the higher concentration studied. KP showed cell proliferation activity which was evident by an increase in the cell viability to approximately 140%. On the other hand, among the formulated SLNs, only GEL-based formulation showed nearly 40% cytotoxicity at the higher concentration studied. The reason being the concentration of GEL (250 mg) is comparatively higher than that of POL (200 mg) and PLU (200 mg) in the respective SLN formulation. The stabilizers are usually toxic and hence, an optimum concentration is preferred to use in the formulations. Interestingly, the drug-loaded GEL-based formulation showed lesser toxicity when compared to pure GEL and bare SLNs. This can be explained on the basis of the surface behavior of pure GEL, bare SLNs, and drug-loaded GEL-based formulation. The toxicity of pure GEL and bare SLNs indicated the influence of the surface behavior of stabilizers, which was probably suppressed in drug-loaded GEL-based formulation due to the presence of drug. The exciting cytotoxicity results suggest that the use of nontoxic stabilizers with an optimum lipid to stabilizer ratio would be suitable for SLN formulation without toxicity.44 Further in vivo studies need to be carried out to investigate clinical application for effective therapy.
Figure 9.
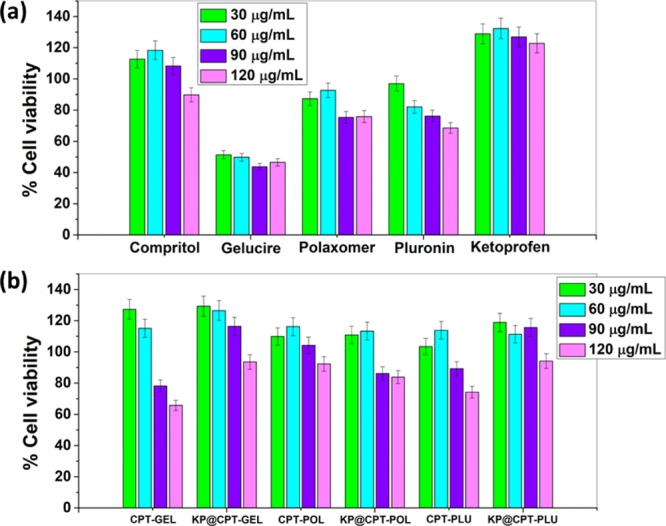
Cytotoxicity of (a) all the raw ingredients and (b) the formulated bare and drug-loaded SLNs at different concentrations against raw 264.7 cell lines after 72 h of treatment.
3. Conclusions
KP-loaded SLNs stabilized with Gelucire, Poloxamer, and Pluronic were prepared successfully using acoustic cavitation-assisted hot melt mixing method. The formulated SLNs had a particle size below 250 nm and core–shell type morphology. A decrease in particle size with the increase of stabilizer concentration was observed. The ratios 8:5, 2:1, and 2:1 were found optimum lipid to stabilizers GEL, POL, and PLU, respectively. As the concentration of drug increased, particle size of drug-loaded SLNs increased. The prepared SLNs showed good stability in water upto 50 °C. The drug was molecularly dispersed in the core of the lipid matrix and stabilized by a monolayer of the stabilizer as a shell. The prepared drug-loaded SLNs showed high encapsulation efficiency (91, 87, and 89%) and drug loading (12.13, 12.42, and 12.71%) percentage; the stabilizers GEL, POL, and PLU were used in formulations. The formulated SLNs showed good biocompatibility against raw 264.7 cells even after 72 h of treatment and 100% drug was released at end of 72 h. The developed acoustic cavitation-assisted hot melt mixing method is a feasible technique for the formulation of SLNs with high encapsulation efficiency, drug loading, and excellent biocompatibility using different stabilizers with optimum concentration.
4. Materials and Methods
4.1. Materials
Lipid (Compritol 888 ATO) (Compritol or CPT) and Poloxamer 407 (Poloxamer or POL) (product no. 16758), Pluronic 127 (Pluronic or PLU) (product no. P2443), KP, and PTA were purchased from Tokyo Chemical Industries, Japan and Sigma Aldrich, India, respectively. Gattefosse, France gifted Gelucire 50/13 (Gelucire or GEL). All solvents and silica wafers were obtained from Merck and ICON analytical, respectively. Elga PURELAB option-R7 purified water was used throughout. Sonication was performed using a Horn Probe Sonicator Sonics VCX-750 Vibra Cell Ultrasonic processor, 750 Watt and 20 KHz, Sonics and Materials, Inc., USA. All filters used were obtained from Millipore. The abbreviations of all the chemicals mentioned in parenthesis are used throughout.
4.2. Preparation of SLNs
A hot melt homogenization followed by sonication method was employed to prepare SLNs.28 The simple experimental setup of the process is presented in Scheme 1. Briefly, Compritol and stabilizer, in the ratio 8:5 was taken in a round bottom flask. The flask was heated in a water bath to 90 °C to form a homogenous clear solution. Then 20 mL of hot water (90 °C) was slowly added to the hot homogenous mixture. Stirring was continued for few minutes to obtain pre-emulsion. The pre-emulsion solution was sonicated to obtain a nanoemulsion. The hot nanoemulsion was slowly cooled to 4 °C and stored for 24 h at the same temperature (4 °C). The SLNs was collected by centrifuge then washed with water and dried at 40 °C. SLNs of Compritol were prepared using three different stabilizers, namely—Gelucire, poloxamer, and pluronic. Along with lipid and stabilizers, at an optimum ratio, the drug was added during the preparation of the hot homogenous mixture to obtain drug-loaded SLNs. By varying the concentrations of stabilizers and drug, a series of samples were prepared. Repeating all the experiments at least three times checked the reproducibility. Throughout the article, bare SLNs are abbreviated as CPT–GEL, CPT–POL, and CPT–PLU and drug-loaded SLNs are abbreviated as KP@CPT–GEL, KP@CPT–POL, and KP@CPT–PLU.
Scheme 1. Schematic Experimental Set Up of the Acoustic Cavitation-Assisted Hot Melt Mixing Method for Preparation of SLNs.
4.3. Hydrodynamic Diameter, Polydispersity Index, Zeta Potential and Stability in Water
The dynamic light scattering (DLS) (Zetasizer Nano ZS, Malvern instrument Ltd., UK) instrument containing 633 nm 4 mW He–Ne laser, incorporated noninvasive backscatter optics with a detection angle of 173° and a temperature tunable sample chamber ranging from 20 to 90 °C was used for primary characterization—particle size (d/nm), polydispersity index, zeta potential and thermal stability—of the prepared SLNs.45 A dilute aqueous suspension was prepared to measure the particle size, zeta potential, PDI, and thermal stability through dispersing 20 μL of the as-formulated SLN suspension into 3 mL of ultrapure double-distilled water. By tuning the sample chamber temperature from 20 to 80 °C, particle sizes were measured to study the stability of SLNs in water at different temperatures.
4.4. Particle Size and Shape
The analytical techniques such as FESEM (FEI, Nova NanoSEM 450 model) and TEM (HR-TEM, FEI, Tecnai G2, S-Twin, at 200 KV) were used to confirm the exact particle size and shape of the prepared SLNs. The similar dilute suspension prepared for DLS measurements was used for FESEM and TEM sample preparation. The sample was drop-coated on a clean silica wafer, after drying for 48 h the silica wafers were subjected to gold sputter coating at 20 mA for 2 nm thickness and thereafter FESEM imaging was performed.46 Carbon-coated copper TEM grids were used for TEM imaging. The prepared dilute suspension of the sample was drop-coated on the TEM grid. PTA 2% (w/v) aqueous suspension was used for staining.28 The particle size from FESEM images was measured using ImageJ software.46
4.5. XRD, FTIR and DSC
Powder XRD [Smart Lab X-ray Diffractometer (Rigaku, Japan), X-ray source: Cu Kα radiation (λ = 0.15418 nm)] patterns, Fourier-transform infrared (FTIR) [PerkinElmer FTIR emission spectrometer (Spectrum Two)] spectroscopy and thermal analysis (DSC Netzsch STA 449 F1 Jupiter instrument) techniques were employed, respectively, to study the crystal, chemical, and thermal properties of the prepared SLNs along with all the ingredients. Samples were placed in a glass sample holder, suitable voltage (45 kV) and current (100 mA) were applied, and XRD scanning was performed at the 2θ(Degree) range of 10° to 70° with a 2° per min scan rate and 0.02° per second step size. FTIR spectroscopy ranging from a frequency of 4000 to 600 cm –1 was recorded for all samples with 4 cm –1 resolution and 8 scans. Background correction was done using pure KBr pellets. Thermal analysis of all samples (using 2–3 mg sample in a pin-hole alumina crucible) was done under nitrogen flow (60 mL/min) by heating to 300 °C from room temperature with a 5 °C/min heating rate. The crucible without any sample was used as reference.47,48
4.6. Drug Encapsulation Efficiency, Drug Loading, and in vitro Drug Release
Above formulae were used to calculate the percentage of drug encapsulation efficiency (%EE) and drug loading (%DL) of the prepared SLNs. The free drug-containing supernatant was collected through dispersing the prepared SLNs in ethanol and centrifugation. Through measuring the absorbance of the free drug using a UV–vis spectrophotometer, %EE and %DL was calculated.49
Dissolution studies were conducted under perfect sink conditions using a USP microprocessor dissolution test apparatus (model 1912, Electronics India, India). The prepared drug-loaded SLNs were placed in 900 mL PBS buffer (pH 4.0, 7.4 and 10.0) for 72 h at 37 ± 1 °C with 100 rpm. The absorbance of the released drug was measured to calculate the drug release percentage by centrifugation of the collected sample at different time points using a UV–vis spectrophotometer.50 At each time point equal amounts of the fresh medium was added. To study the drug release kinetics, the in vitro drug release data was fitted to the zero order and first order kinetics, Higuchi model, Korsmeyer-Peppas model, and Hixson–Crowell model. The coefficient of determination (R2) and release exponents (n) were calculated from the plots.
4.7. Cell Culture and Cytotoxicity Assay
RAW-264.7 macrophage cells purchased from the National Centre for Cell Sciences, Pune was used to study cytotoxicity. The cells were grown in DMEM (Gibco) supplemented with 10% fetal bovine serum (FBS) and 1% penicillin–streptomycin (Gibco) and maintained at 37 °C in a CO2 (5%) incubator. The fresh medium was added every two days and the cells were split once they reached 80% confluency. The cytotoxicity of the sample was studied using the PrestoBlue assay. A suspension of 1000 cells per well (in 1% FBS, 150 μL) were seeded into a 96 well plate and after 24 h, and the adhered cells were incubated with a concentration range of 30 to 120 μg/mL of sample dispersion in PBS. The cells treated with samples were incubated for 72 h at 37 °C in a CO2 incubator. Only cells and only media were used as the positive and negative control, respectively. After 72 h, 20 μL of the PrestoBlue cell viability reagent (Invitrogen, Life technologies) was added to each well and further incubation was carried out for 2 h in an incubator and thereafter fluorescence was recorded (excitation 535 nm; emission 615 nm) using a Tecan Infinite M200 PRO plate reader.
Acknowledgments
The authors thank IIT Mandi for providing laboratory facilities. Financial assistance from the Ramanujan grant [(SB/S2/RJN-072/2015) to N.G. and UGC for the research fellowship to R.K. and A.S. are gratefully acknowledged. All authors are thankful to Dr. Prem Felix Siril for guidance and support in performing the experiments and analyzing the results. R.K. thanks Dr. Sacheen Kumar for his kind assistance during the formulation.
Supporting Information Available
The Supporting Information is available free of charge on the ACS Publications website at DOI: 10.1021/acsomega.9b01532.
Comparison (Table S1) of encapsulation efficiency (%EE) and drug loading (%DL) percentage of SLNs containing Compritol 888 ATO (CPT) and/or KP from the reported literature; and the linear correlation coefficient (R2) (Table S2) of the in vitro drug release data of the formulated KP-loaded solid lipid (CPT) nanoparticles prepared using different stabilizers (GEL, POL, and PLU) at different pH (4.0, 7.4, and 10.0) in different drug release kinetic models (zero order, first order, Higuchi, Korsmeyer-Peppas, and Hixson–Crowell models) (PDF)
Author Present Address
∥ Department of Pharmaceutical Sciences, University of Michigan, 2800 Plymouth Road, Ann Arbor 48109-2800, Michigan, United States.
The authors declare no competing financial interest.
Supplementary Material
References
- Schneider G.; Fechner U. Computer-Based de Novo Design of Drug-like Molecules. Nat. Rev. Drug Discovery 2005, 4, 649–663. 10.1038/nrd1799. [DOI] [PubMed] [Google Scholar]
- Peer D.; Karp J. M.; Hong S.; Farokhzad O. C.; Margalit R.; Langer R. Nanocarriers as an Emerging Platform for Cancer Therapy. Nat. Nanotechnol. 2007, 2, 751–760. 10.1038/nnano.2007.387. [DOI] [PubMed] [Google Scholar]
- Lipinski C. A.; Lombardo F.; Dominy B. W.; Feeney P. J. Experimental and Computational Approaches to Estimate Solubility and Permeability in Drug Discovery and Development Settings. Adv. Drug Deliv. Rev. 1997, 23, 3–25. 10.1016/s0169-409x(96)00423-1. [DOI] [PubMed] [Google Scholar]
- Ahmed S.; Gull A.; Alam M.; Aqil M.; Sultana Y. Ultrasonically Tailored, Chemically Engineered and QbD Enabled Fabrication of Agomelatine Nanoemulsion; Optimization, Characterization, Ex-Vivo Permeation and Stability Study. Ultrason. Sonochem. 2018, 41, 213–226. 10.1016/j.ultsonch.2017.09.042. [DOI] [PubMed] [Google Scholar]
- Kaur K.; Kaur J.; Kumar R.; Mehta S. K. Formulation and Physiochemical Study of α-Tocopherol Based Oil in Water Nanoemulsion Stabilized with Non Toxic, Biodegradable Surfactant: Sodium Stearoyl Lactate. Ultrason. Sonochem. 2017, 38, 570–578. 10.1016/j.ultsonch.2016.08.026. [DOI] [PubMed] [Google Scholar]
- Kumar R. Repositioning of Non-Steroidal Anti Inflammatory Drug (NSAIDs) for Cancer Treatment: Promises and Challenges. J. Nanomed. Nanotechnol. 2016, 7, e140 10.4172/2157-7439.1000e140. [DOI] [Google Scholar]
- Pawar J. N.; Fule R. A.; Maniruzzaman M.; Amin P. D. Solid Crystal Suspension of Efavirenz Using Hot Melt Extrusion: Exploring the Role of Crystalline Polyols in Improving Solubility and Dissolution Rate. Mater. Sci. Eng. C 2017, 78, 1023–1034. 10.1016/j.msec.2017.04.055. [DOI] [PubMed] [Google Scholar]
- Pujara N.; Jambhrunkar S.; Wong K. Y.; McGuckin M.; Popat A. Enhanced Colloidal Stability, Solubility and Rapid Dissolution of Resveratrol by Nanocomplexation with Soy Protein Isolate. J. Colloid Interface Sci. 2017, 488, 303–308. 10.1016/j.jcis.2016.11.015. [DOI] [PubMed] [Google Scholar]
- Kirtane A. R.; Narayan P.; Liu G.; Panyam J. Polymer-Surfactant Nanoparticles for Improving Oral Bioavailability of Doxorubicin. J. Pharm. Invest. 2017, 47, 65–73. 10.1007/s40005-016-0293-5. [DOI] [Google Scholar]
- Teixeira M. C.; Carbone C.; Souto E. B. Beyond Liposomes: Recent Advances on Lipid Based Nanostructures for Poorly Soluble/Poorly Permeable Drug Delivery. Prog. Lipid Res. 2017, 68, 1–11. 10.1016/j.plipres.2017.07.001. [DOI] [PubMed] [Google Scholar]
- Weissig V.; Guzman-Villanueva D. Nanopharmaceuticals (Part 2): Products in The Pipeline. Int. J. Nanomed. 2015, 10, 1245–1257. 10.2147/ijn.s65526. [DOI] [PMC free article] [PubMed] [Google Scholar]
- Weissig V.; Pettinger T.; Murdock N. Nanopharmaceuticals (Part 1): Products on the Market. Int. J. Nanomed. 2014, 9, 4357–4373. 10.2147/ijn.s46900. [DOI] [PMC free article] [PubMed] [Google Scholar]
- Badilli U.; Gumustas M.; Uslu B.; Ozkan S. A.. Lipid-Based Nanoparticles for Dermal Drug Delivery Organic Materials as Smart Nanocarriers for Drug Delivery; Elsevier, 2018; pp 369–413. [Google Scholar]
- Kumar R.Lipid-Based Nanoparticles for Drug-Delivery Systems Nanocarriers for Drug Delivery; Elsevier, 2019; pp 249–284. [Google Scholar]
- Eldem T.; Speiser P.; Hincal A. Optimization of Spray-Dried and -Congealed Lipid Micropellets and Characterization of Their Surface Morphology by Scanning Electron Microscopy. Pharm. Res. 1991, 08, 47–54. 10.1023/a:1015874121860. [DOI] [PubMed] [Google Scholar]
- Schwarz C.; Mehnert W.; Lucks J. S.; Müller R. H. Solid Lipid Nanoparticles (SLN) for Controlled Drug Delivery. I. Production, Characterization and Sterilization. J. Control. Release 1994, 30, 83–96. 10.1016/0168-3659(94)90047-7. [DOI] [Google Scholar]
- Müller R. H.; Mäder K.; Gohla S. Solid Lipid Nanoparticles (SLN) for Controlled Drug Delivery – a Review of the State of the Art. Eur. J. Pharm. Biopharm. 2000, 50, 161–177. 10.1016/s0939-6411(00)00087-4. [DOI] [PubMed] [Google Scholar]
- Speiser P.Lipid nano-pellets as excipient system for perorally administered drugs. U.S. Patent 4,880,634, 1985.
- Kumar S.; Randhawa J. K. High Melting Lipid Based Approach for Drug Delivery: Solid Lipid Nanoparticles. Mater. Sci. Eng. C 2013, 33, 1842–1852. 10.1016/j.msec.2013.01.037. [DOI] [PubMed] [Google Scholar]
- Kotta S.; Khan A. W.; Pramod K.; Ansari S. H.; Sharma R. K.; Ali J. Exploring Oral Nanoemulsions for Bioavailability Enhancement of Poorly Water-Soluble Drugs. Expert Opin. Drug Deliv. 2012, 9, 585–598. 10.1517/17425247.2012.668523. [DOI] [PubMed] [Google Scholar]
- Li W.; Ashokkumar M. Introduction to Ultrasound and Sonochemistry. Electrochem. Soc. Interface 2018, 27, 43–46. 10.1149/2.f04183if. [DOI] [Google Scholar]
- Kumar R.; Kumar V. B.; Marcus M.; Gedanken A.; Shefi O.. Element (B, N, P) Doped Carbon Dots Interaction with Neural Cells: Promising Results and Future Prospective. Proc. SPIE 10892 Colloidal Nanoparticles for Biomedical Applications XIV 1089214, 2019.
- Mehnert W.; Mäder K. Solid Lipid Nanoparticles: Production, Characterization and Applications. Adv. Drug Deliv. Rev. 2012, 64, 83–101. 10.1016/j.addr.2012.09.021. [DOI] [PubMed] [Google Scholar]
- Shah R.; Eldridge D.; Palombo E.; Harding I.. Composition and Structure. Lipid Nanoparticles: Production, Characterization and Stability; Springer, 2015; pp 11–22. [Google Scholar]
- Farn R. J.Chemistry and Technology of Surfactants; Wiley. 2006. [Google Scholar]
- Potluri R. H. K.; Bandari S.; Jukanti R.; Veerareddy P. R. Solubility Enhancement and Physicochemical Characterization of Carvedilol Solid Dispersion with Gelucire 50/13. Arch Pharm. Res. 2011, 34, 51–57. 10.1007/s12272-011-0106-3. [DOI] [PubMed] [Google Scholar]
- Jindal N.; Mehta S. K. Nevirapine Loaded Poloxamer 407/Pluronic P123 Mixed Micelles: Optimization of Formulation and in Vitro Evaluation. Colloids Surf., B 2015, 129, 100–106. 10.1016/j.colsurfb.2015.03.030. [DOI] [PubMed] [Google Scholar]
- Kumar R.; Singh A.; Garg N.; Siril P. F. Solid Lipid Nanoparticles for the Controlled Delivery of Poorly Water Soluble Non-Steroidal Anti-Inflammatory Drugs. Ultrason. Sonochem. 2018, 40, 686–696. 10.1016/j.ultsonch.2017.08.018. [DOI] [PubMed] [Google Scholar]
- Kumar S.; Kaur J.. Effect of Surfactant on Temperature Stability of Solid Lipid Nanoparticles Studied by Dynamic Light Scattering. AIP Conference Proceedings; American Institute of Physics, 2013; Vol. 1536, pp 163–164.
- El-Say K. M.; Hosny K. M. Optimization of Carvedilol Solid Lipid Nanoparticles: An Approach to Control the Release and Enhance the Oral Bioavailability on Rabbits. PLoS One 2018, 13, e0203405 10.1371/journal.pone.0203405. [DOI] [PMC free article] [PubMed] [Google Scholar]
- Radomskasoukharev A. Stability of Lipid Excipients in Solid Lipid Nanoparticles. Adv. Drug Deliv. Rev. 2007, 59, 411–418. 10.1016/j.addr.2007.04.004. [DOI] [PubMed] [Google Scholar]
- Nguyen V. S.; Rouxel D.; Hadji R.; Vincent B.; Fort Y. Effect of Ultrasonication and Dispersion Stability on the Cluster Size of Alumina Nanoscale Particles in Aqueous Solutions. Ultrason. Sonochem. 2011, 18, 382–388. 10.1016/j.ultsonch.2010.07.003. [DOI] [PubMed] [Google Scholar]
- Freitas C.; Müller R. H. Effect of Light and Temperature on Zeta Potential and Physical Stability in Solid Lipid Nanoparticle (SLNTM) Dispersions. Int. J. Pharm. 1998, 168, 221–229. 10.1016/s0378-5173(98)00092-1. [DOI] [Google Scholar]
- Kumar V. B.; Kumar R.; Gedanken A.; Shefi O. Fluorescent Metal-Doped Carbon Dots for Neuronal Manipulations. Ultrason Sonochem 2019, 52, 205–213. 10.1016/j.ultsonch.2018.11.017. [DOI] [PubMed] [Google Scholar]
- Freitas C.; Müller R. H. Effect of Light and Temperature on Zeta Potential and Physical Stability in Solid Lipid Nanoparticle (SLNTM) Dispersions. Int. J. Pharm. 1998, 168, 221–229. 10.1016/s0378-5173(98)00092-1. [DOI] [Google Scholar]
- Kumar R.; Siril P. F. Ultrafine Carbamazepine Nanoparticles with Enhanced Water Solubility and Rate of Dissolution. RSC Adv. 2014, 4, 48101–48108. 10.1039/c4ra08495k. [DOI] [PMC free article] [PubMed] [Google Scholar]
- Kumar R.; Siril P. F. Controlling the Size and Morphology of Griseofulvin Nanoparticles Using Polymeric Stabilizers by Evaporation-Assisted Solvent–Antisolvent Interaction Method. J. Nanoparticle Res. 2015, 17, 256. 10.1007/s11051-015-3066-6. [DOI] [Google Scholar]
- Kumar R.; Soni P.; Siril P. F. Engineering the Morphology and Particle Size of High Energetic Compounds Using Drop-by-Drop and Drop-to-Drop Solvent–Antisolvent Interaction Methods. ACS Omega 2019, 4, 5424–5433. 10.1021/acsomega.8b03214. [DOI] [PMC free article] [PubMed] [Google Scholar]
- Kumar R.; Siril P. F. Enhancing the Solubility of Fenofibrate by Nanocrystal Formation and Encapsulation. AAPS PharmSciTech 2018, 19, 284–292. 10.1208/s12249-017-0840-z. [DOI] [PubMed] [Google Scholar]
- Hamdani J.; Moës A. J.; Amighi K. Physical and Thermal Characterisation of Precirol® and Compritol® as Lipophilic Glycerides Used for the Preparation of Controlled-Release Matrix Pellets. Int. J. Pharm. 2003, 260, 47–57. 10.1016/s0378-5173(03)00229-1. [DOI] [PubMed] [Google Scholar]
- Shin S.-C.; Cho C.-W. Physicochemical Characterizations of Piroxicam-Poloxamer Solid Dispersion. Pharm. Dev. Technol. 1997, 2, 403–407. 10.3109/10837459709022639. [DOI] [PubMed] [Google Scholar]
- Sahu A.; Kasoju N.; Goswami P.; Bora U. Encapsulation of Curcumin in Pluronic Block Copolymer Micelles for Drug Delivery Applications. J. Biomater. Appl. 2011, 25, 619–639. 10.1177/0885328209357110. [DOI] [PubMed] [Google Scholar]
- Kumar R.; Siril P. F. Preparation and Characterization of Polyvinyl Alcohol Stabilized Griseofulvin Nanoparticles. Mater. Today: Proc. 2016, 3, 2261–2267. 10.1016/j.matpr.2016.04.135. [DOI] [Google Scholar]
- Sachs-Barrable K.; Thamboo A.; Lee SD; Wasan KM Lipid Excipients Peceol and Gelucire 44/14 Decrease P-Glycoprotein Mediated Efflux of Rhodamine 123 Partially Due to Modifying P-Glycoprotein Protein Expression within Caco-2 Cells. J Pharm Pharm Sci 2007, 10, 319–31. [PubMed] [Google Scholar]
- Vats T.; Dutt S.; Kumar R.; Siril P. F. Facile Synthesis of Pristine Graphene-Palladium Nanocomposites with Extraordinary Catalytic Activities Using Swollen Liquid Crystals. Sci. Rep. 2016, 6, 33053. 10.1038/srep33053. [DOI] [PMC free article] [PubMed] [Google Scholar]
- Kumar V. B.; Kumar R.; Friedman O.; Golan Y.; Gedanken A.; Shefi O. One-Pot Hydrothermal Synthesis of Elements (B, N, P)-Doped Fluorescent Carbon Dots for Cell Labelling, Differentiation and Outgrowth of Neuronal Cells. ChemistrySelect 2019, 4, 4222–4232. 10.1002/slct.201900581. [DOI] [Google Scholar]
- Dutt S.; Kumar R.; Siril P. F. Green Synthesis of a Palladium–Polyaniline Nanocomposite for Green Suzuki–Miyaura Coupling Reactions. RSC Adv. 2015, 5, 33786–33791. 10.1039/c5ra05007c. [DOI] [Google Scholar]
- Chawla M.; Kumar R.; Siril P. F. High Catalytic Activities of Palladium Nanowires Synthesized Using Liquid Crystal Templating Approach. J. Mol. Catal. A Chem. 2016, 423, 126–134. 10.1016/j.molcata.2016.06.014. [DOI] [Google Scholar]
- Kumar R.; Siril P. F. Controlling the Size and Morphology of Griseofulvin Nanoparticles Using Polymeric Stabilizers by Evaporation-Assisted Solvent–Antisolvent Interaction Method. J. Nanoparticle Res. 2015, 17, 256. 10.1007/s11051-015-3066-6. [DOI] [Google Scholar]
- Kumar R.; Siril P. F.; Javid F. Unusual Anti-Leukemia Activity of Nanoformulated Naproxen and Other Non-Steroidal Anti-Inflammatory Drugs. Mater. Sci. Eng. C 2016, 69, 1335–1344. 10.1016/j.msec.2016.08.024. [DOI] [PubMed] [Google Scholar]
Associated Data
This section collects any data citations, data availability statements, or supplementary materials included in this article.


