Abstract
Dendritic NMDA spike/plateau potentials, first discovered in cortical pyramidal neurons, provide supralinear integration of synaptic inputs on thin and distal dendrites, thereby increasing the impact of these inputs on the soma. The more specific functional role of these potentials has been difficult to clarify, partly due to the complex circuitry of cortical neurons. Thalamocortical (TC) neurons in the dorsal lateral geniculate nucleus participate in simpler circuits. They receive their primary afferent input from retina and send their output to visual cortex. Cortex, in turn, regulates this output through massive feedback to distal dendrites of the TC neurons. The TC neurons can operate in two modes related to behavioral states: burst mode prevailing during sleep, when T-type calcium bursts largely disrupt the transfer of signals from retina to cortex, and tonic mode, which provides reliable transfer of retinal signals to cortex during wakefulness. We studied dendritic potentials in TC neurons with combined two-photon calcium imaging and whole-cell recording of responses to local dendritic glutamate iontophoresis in acute brain slices from mice. We found that NMDA spike/plateaus can be elicited locally at distal dendrites of TC neurons. We suggest that these dendritic potentials have important functions in the cortical regulation of thalamocortical transmission. NMDA spike/plateaus can induce shifts in the functional mode from burst to tonic by blockade of T-type calcium conductances. Moreover, in tonic mode, they can facilitate the transfer of retinal signals to cortex by depolarization of TC neurons.
Keywords: dendritic integration, LGN, NMDA spike, NMDA spike/plateau potential, thalamocortical, cortical feedback
Introduction
Dendritic NMDA receptor-dependent spikes elicited by local dendritic glutamate application were first discovered in basal dendrites of cortical layer 5 pyramidal neurons in somatosensory cortex in vitro (Schiller et al., 2000). NMDA spikes appear as step-like depolarizing potentials that by sufficient stimulation strength can be broadened into plateaus (Schiller and Schiller, 2001; Nevian et al., 2007), and can therefore be termed NMDA spike/plateau potentials (Major et al., 2008). Similar potentials have also been demonstrated in terminal dendrites of hippocampal pyramidal neurons (Wei et al., 2001), in layer 5 pyramidal neurons of the frontal cortex (Milojkovic et al., 2004, 2005), and in apical tuft dendrites of layer 5 pyramidal neurons in somatosensory cortex (Larkum et al., 2009). Moreover, Palmer et al. (2014) demonstrated NMDA spikes in vivo in dendritic tufts of cortical layer 2/3 pyramidal neurons, spikes that could occur spontaneously or be evoked by sensory input. Several important functions of these potentials have been suggested, for instance, detection and amplification of input to a given dendritic branch, parallel or pathway-specific processing in different integrating dendritic subunits (Schiller and Schiller, 2001; Nevian et al., 2007; Larkum et al., 2009; Behabadi et al., 2012; Major et al., 2013; Palmer et al., 2014), and shifts to a long-lasting somatic depolarization (UP state) from a somatic DOWN state (Milojkovic et al., 2004, 2005; Antic et al., 2010).
Little is known about dendritic processing in subcortical neurons. Such neurons participate in less complex local circuits than cortical neurons, therefore, they may be well suited for studies of functional roles of dendritic mechanisms in signal processing. We investigated dendritic signals in thalamocortical (TC) neurons in the dorsal lateral geniculate nucleus (dLGN). These neurons receive two types of glutamatergic input: primary afferent input from retina, ending on proximal dendrites, and modulatory feedback from visual cortex, ending on distal dendrites (Wilson et al., 1984). An important feature of the TC neurons is that they can operate in distinct state-dependent functional modes (McCormick and Pape, 1990; Leresche et al., 1991; Llinás and Steriade, 2006). At hyperpolarized membrane potentials, prevailing during slow-wave sleep, slow oscillations of the membrane potential involving T-type Ca2+ conductances are generated. This can elicit an intrinsic rhythmic burst of action potentials that largely blocks the signal transmission from retina to cortex (burst mode). At depolarized membrane potentials, prevailing during wakefulness, this rhythm generation is inactivated, such that the retinal input is reliably transmitted to cortex (tonic mode). It is assumed that the glutamatergic corticothalamic feedback can switch the mode from burst to tonic, and regulate the degree of retinocortical transmission during the tonic mode (McCormick and von Krosigk, 1992; Godwin et al., 1996).
In this study we investigated dendritic potentials elicited by local dendritic glutamate iontophoresis using two-photon calcium imaging combined with somatic whole-cell recording in vitro. We found that TC neurons have dendritic NMDA spike/plateau potentials, and propose that these potentials have an important function for the cortical regulation of both the type and degree of geniculate transmission of retinal signals to visual cortex.
Materials and Methods
In vitro experiments were performed according to the guidelines and approval of the Animal Care Committee in Norway.
Slice preparation.
Female and male C57BL/6 mice, 28- to 39-d-old (n = 54), were deeply anesthetized with halothane and killed by rapid decapitation. Coronal (Zhu and Lo, 1999; Zhu and Heggelund, 2001) or parasagittal (Turner and Salt, 1998) slices (250–300 μm thick) from dLGN were cut in a heated (32−34°C; Huang and Uusisaari, 2013) and oxygenated (5% CO2/95% O2) solution containing the following (in mm): 87 NaCl, 75 glycerol, 25 NaHCO3, 16 d-glucose, 7 MgCl2, 2.5 KCl, 1.25 NaH2PO4, and 0.5 CaCl2. Afterward, the slices were kept in 34°C oxygenated (5% CO2/95% O2) artificial CSF (ACSF) containing the following (in mm): 125 NaCl, 25 NaHCO3,10 d-glucose, 2.5 KCl, 2 CaCl2, 1.25 NaH2PO4, and 1 MgCl2 for at least 30 min before starting the recording.
Whole-cell recording.
During the experiments, the slices were kept in a recording chamber (volume ∼1.5 ml) at room temperature (∼24°C) and perfused with ACSF at 5 ml min−1. TC neurons in dLGN were visualized using infrared DIC video microscopy (Dodt and Zieglgänsberger, 1990). Current-clamp recordings were made with borosilicate glass electrodes (4–6 MΩ) containing the following (in mm): 150 KMeSO4, 10 HEPES, 1 MgCl2, 2 MgATP, 0.4 Na2GTP, and 10 Na2-phosphocreatine; the pH values were adjusted to 7.3 with KOH. Alexa Fluor 594 (50 μm; Invitrogen) and Fluo-5F pentapotassium salt (100 μm; Invitrogen; Kd ∼ 0.8 μm; Errington et al., 2010) were added to the intracellular solution for visualizing neuronal processes and for imaging of [Ca2+] signals by means of two-photon microscopy.
The voltage of the responses was recorded at 20 kHz sampling rate and filtered at 3 kHz with a Multiclamp 700A amplifier and pClamp software (Molecular Devices). The resting membrane potential of the TC neurons (−65.2 ± 2.1 mV, n = 66) was adjusted to different steady-state values ranging between −70 and −50 mV by constant-current injection via the recording electrode.
Two-photon calcium imaging.
We used a two-photon imaging system consisting of an upright microscope (BX51WI with FV300 scanning unit; Olympus) with a 25×/1.05 water-immersion objective (XLPLN 25× WMP; Olympus) or a 40×/0.8 water-immersion objective (LUMPlanFL N 40×; Olympus), and an ultrafast Ti:sapphire laser (Mai Tai DeepSee; Newport-Spectra Physics). The laser was set to 810 nm for simultaneous excitation of Alexa Fluor 594 (red fluorescence) and Fluo-5F (green fluorescence). The red fluorescence was collected in transmission via an oil-immersion condenser (1.4 NA; Olympus) and filtered by a 630/75 nm bandpass filter (ET630/75M; Chroma Technology). The green fluorescence was collected via the objective and filtered by a 525/50 nm bandpass filter (ET525/50M; Chroma Technology). The photomultiplier tubes (R7683) were cooled to −30°C to minimize background noise (Peltier cooling box with Cockcroft Walton type HV source, C9145 and C9143; Hamamatsu). The laser power, controlled by an achromatic λ/2 plate combined with a polarizing beam splitter cube (RAC5.2.10L and MTW10; Bernhard Halle Nachfl.) and an electro-optic modulator (EOM; LM0202 P 5W IR driven by a LIV20 pulse amplifier; Qioptiq), was kept below 4 mW in the focal region of the objective during the functional imaging. The laser beam was blanked by means of the EOM and the line active signal provided by the scanner electronics during the stop and fly-back sequences of the scanning mirrors to minimize photo damage. The data acquisition was done by FluoView software (Version 5.0; Olympus).
After achieving whole-cell configuration, the neurons were loaded with dyes for 25–30 min before imaging. The fluorescence changes were measured across the selected dendrite for 2 s in line-scan mode at 0.5 kHz. To attain a sufficiently large signal-to-noise ratio, 9 or 16 line scans were collected at each location for averaging. The scans were separated by at least 10 s pauses. The ratio of the Ca2+-sensitive Fluo-5F fluorescence intensity (green; G) and the Ca2+ insensitive Alexa Fluor 594 intensity (red; R) was used to calculate the Ca2+ signal:
where Rdendrite(t) is the time course of the intensity at a dendritic region, Rnoise(t) the time course of the intensity at an area without dendritic processes, and Gdendrite(t) and Gnoise(t) the corresponding traces of the green channel. To calculate the baseline-corrected signal ΔG/R(t), the average ratio of G/R(t) during a 200 ms interval preceding the stimulation onset was subtracted from G/R(t).
Distances (d), e.g., between a glutamate application site and the soma, were calculated using the 3D Pythagoras theorem, and the xi, yi, and zi coordinates were extracted in steps while following the dendrite in the image stack taken from the neuron after the physiological recordings:
 |
The z step size of the stacks was 1 μm, while the x and the y pixel spacing were 0.6 μm in most cases.
Stimulation.
Dendrites of TC neurons were stimulated by local glutamate application through a 500–600 MΩ theta borosilicate glass pipette, in which one chamber was filled with sodium glutamate (300 mm, pH 7) and the other with Alexa Fluor 594 (100 μm in 0.9% NaCl). The stimulation pipette was positioned close to the selected dendrite under visual control via the two-photon microscope. Glutamate was applied by iontophoretic current injection (two 100 μs duration negative current pulses, minimal current 0.25 μA, interpulse interval 10 ms) through an isolator unit (HG203/100; Hi-Med). The glutamate-evoked response was recorded simultaneously by Ca2+ imaging from the stimulated dendrite, and by voltage recordings from the soma, where indicated. No stimulation-caused movement of the dendrite or leakage of Alexa Fluor 594 from the pipette tip was observed during the experiments.
Optic tract fibers were stimulated electrically (HG300G stimulator; Hi-Med) with bipolar electrodes, using up to 200 μA current pulses of 100 μs duration. During successive train stimulation of the retinal afferents (40 Hz, 500 ms duration), the intertrial intervals were 30 s.
Pharmacology.
In all experiments GABAA synaptic inputs were blocked with 6-imino-3-(4-methoxyphenyl)-1(6H)-pyridazinebutanoic acid hydrobromide (gabazine; 10 μm), while 3-[[(3,4 dichlorophenyl) methyl]amino]propyl] diethoxymethyl phosphinic acid (CGP52432; 10 μm) or (2S)-3-[[(1S)-1-(3,4-dichlorophenyl)ethyl]amino-2-hydroxypropyl] (phenylmethyl) phosphinic acid hydrochloride (CGP55845; 2.5 μm) was used to block GABAB synaptic inputs. NMDA receptors were blocked with (RS)-3-(2-carboxypiperazin-4-yl)-propyl-1-phosphonic acid (CPP; 15 μm) where indicated. In a subset of experiments, Na+ channels were blocked with tetrodotoxin (TTX; 1 μm). Involvement of voltage-sensitive Ca2+ channels was tested with the nonspecific Ca2+ blocker Cd2+ (100 μm), the nonspecific T-type Ca2+ channel blocker Ni2+ (0.4 mm), or the L-type Ca2+ blocker nimodipine (50 μm; dissolved in DMSO, 1:1000 in ACSF). TTX and glutamate were obtained from Sigma-Aldrich. The other pharmacological agents were obtained from Tocris Bioscience.
Analysis.
The off-line data analyses were performed with Igor Pro (WaveMetrics) and ImageJ (NIH). Statistical analyses were performed with Igor Pro and IBM SPSS Statistics (IBM). The results are given as mean ± SD. Statistical differences were tested with paired-sample t tests unless otherwise indicated.
Results
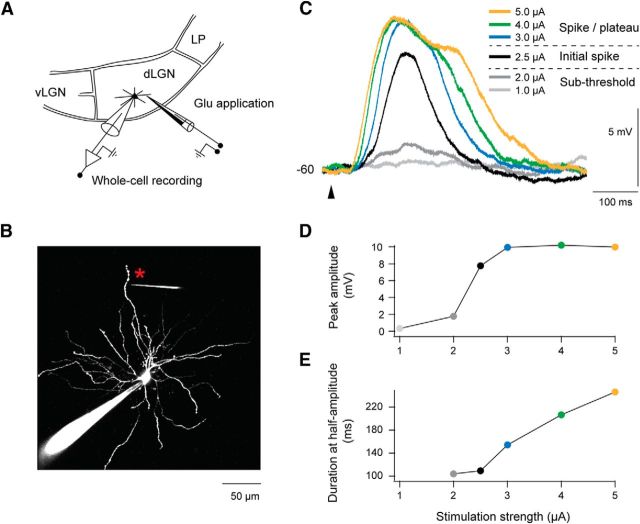
Two-photon imaging combined with somatic whole-cell current-clamp recordings were made from TC neurons in dLGN (n = 66) in acute brain slices prepared from P28–P39 C57BL/6 mice. Single dendrites of the TC neurons were stimulated locally by iontophoretic application of 300 mm glutamate (two negative current pulses, 100 μs duration, and 100 Hz) from a 400–600 MΩ theta electrode (Fig. 1A,B). Selection of a dendrite and the positioning of the tip of the iontophoresis pipette (8 ± 3 μm; minimum 3 μm, maximum 19 μm away from the dendrite) were made under visual control through the two-photon microscope while testing the glutamate-evoked somatic response. To verify that only a single dendrite was stimulated, we made line scans through nearby dendrites. Events where the glutamate stimulation elicited simultaneous response in a neighboring dendrite were excluded. Thus, only cases in which the stimulation evoked response in a single dendrite (e.g., the glutamate application site in Fig. 1B) were used for further analyses. The membrane potential was kept at or slightly more positive than −60 mV to block the T-type calcium conductance and keep the neuron in tonic mode, unless otherwise indicated.
Figure 1.
Local dendritic glutamate application elicited spike/plateau potentials in TC neurons. A, Scheme of experiment: simultaneous two-photon imaging of dendritic activity and somatic whole-cell recording was made from TC neurons in dLGN in vitro. Responses were elicited by local dendritic glutamate application. vLGN, ventral lateral geniculate nucleus; LP, lateral posterior nucleus. B, Image of a TC neuron. The neuron was filled with Alexa Fluor 594 (50 μm in pipette) via the recording electrode. Glutamate stimulation was applied at a dendritic site (marked by an asterisk) via a high-resistance (0.5–0.6 GΩ) theta electrode with glutamate (300 mm) in one chamber and Alexa Fluor 594 (100 μm) in the other. In this example the glutamate application site was 126 μm from the soma and 5 μm from the selected dendrite. Notice the lack of prominent spines. C, Somatically recorded potentials elicited by the local glutamate stimulation. The strength of the stimulation current, indicated by the color code, reflects the amount of the released glutamate. The responses, elicited by a particular current strength, were quite stable (amplitudes varied only by 0.4 ± 0.6 mV). Here, and in all the other figures, each trace in color is an average of three trials obtained with at least 10 s intertrial intervals. The start of the glutamate application is indicated by an arrowhead below the traces. In all experiments GABAergic synaptic inputs were blocked by gabazine and CGP52432 or CGP55845. D, The peak response amplitude of this neuron plotted against stimulation strength. Color of the dots corresponds to the color scale in C. E, The duration of the potential, measured at half-maximum amplitude, plotted against stimulation strength. Dots colored according to color scale in C.
Local dendritic glutamate stimulation can elicit dendritic spike/plateau potentials in TC neurons
Application of a weak glutamate pulse (minimal stimulation current was 0.5 μA) elicited a small-amplitude EPSP-like depolarization at the soma of the TC neurons, as illustrated in Figure 1C (traces elicited at 1.0 and 2.0 μA). With increasing stimulation current, the potential grew in amplitude up to a threshold, where a pronounced, step-like increase in amplitude occurred (Fig. 1C, 2.5 μA, black trace), similar to dendritic NMDA spikes in cortical pyramidal neurons (Schiller et al., 2000; Gordon et al., 2006; Nevian et al., 2007; Major et al., 2008; Larkum et al., 2009; Polsky et al., 2009; Behabadi et al., 2012). For the case in Figure 1C, the increase by 0.5 μA at the threshold caused a 6 mV increase of the response amplitude compared with only 1.4 mV by the preceding subthreshold increase of stimulation from 1 to 2 μA (Fig. 1C, 2.0 μA, dark gray trace). By increase of the stimulation current beyond this spike threshold, there was a slower and moderate increase of the peak amplitude toward a rather stable level (Fig. 1C,D), while the duration gradually increased (Fig. 1C,E) and the potential attained a plateau-like shape (Fig. 1C). The duration of the plateau increased with the increasing current strength (Fig. 1C, traces elicited by >2.5 μA), like the plateau potentials in cortical pyramidal neurons (Milojkovic et al., 2004, 2005; Nevian et al., 2007; Major et al., 2008).
The magnitude of the responses varied from cell to cell depending on the specific properties of the individual neuron, stimulation site, and pipette position, as well as stimulation strength. Nevertheless, the growth and appearance of these spike/plateau potentials (Fig. 1C–E) was a consistent phenomenon present in all neurons and at all tested stimulation sites (n = 34; Figs. 2A, 3A). The variation between the neurons with respect to magnitude of the step-like increase at threshold is illustrated by intensity-response curves for all neurons in Figure 2A, and by the mean results for all neurons in Figure 2B. On average, the amplitude at the last subthreshold response was ∼70% smaller than the amplitude of the initial spike (4.4 ± 2.3 vs 13.3 ± 4.3 mV; Fig. 2B; n = 34; p < 0.001). The deviation from the linear amplitude growth prediction (regression line fitted to the subthreshold points; Fig. 2B) clearly demonstrates the superlinear change that is generated by the spike/plateau potential.
Figure 2.
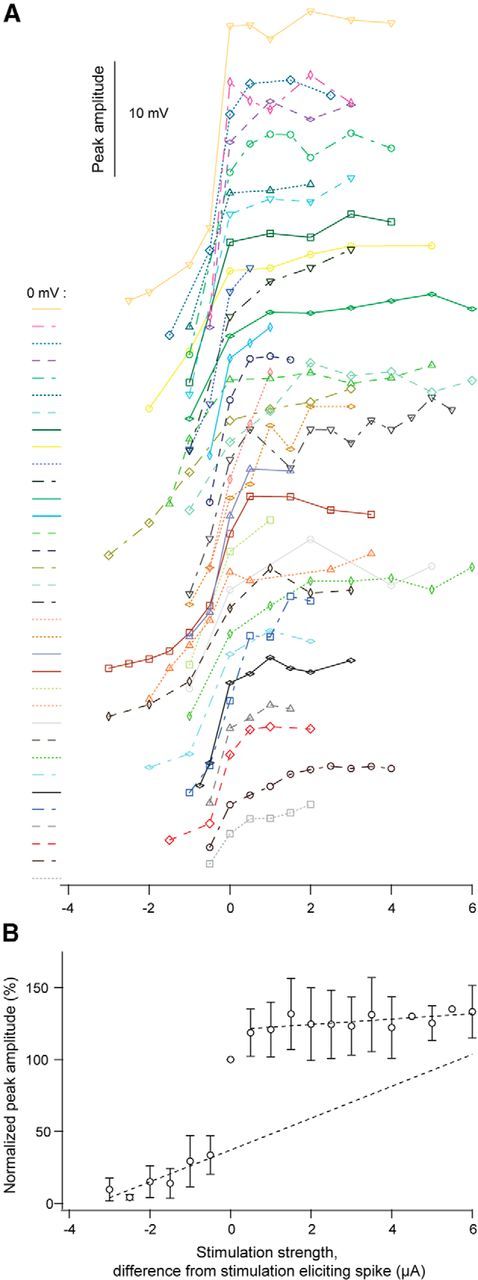
Changes of the amplitude of the potential by increasing strength of glutamate stimulation. A, Individual curves showing the peak amplitude with increasing strength of glutamate stimulation for all neurons. To the left of each curve the baseline (0 mV) is indicated together with a curve identifier (color and line type) for the specific curve. B, Normalized response amplitudes plotted against the glutamate stimulation strength for all neurons (mean ± SD; n = 34). Dotted lines: linear regression line fitted to the mean values below the spike threshold and to the mean values above the spike threshold.
Figure 3.
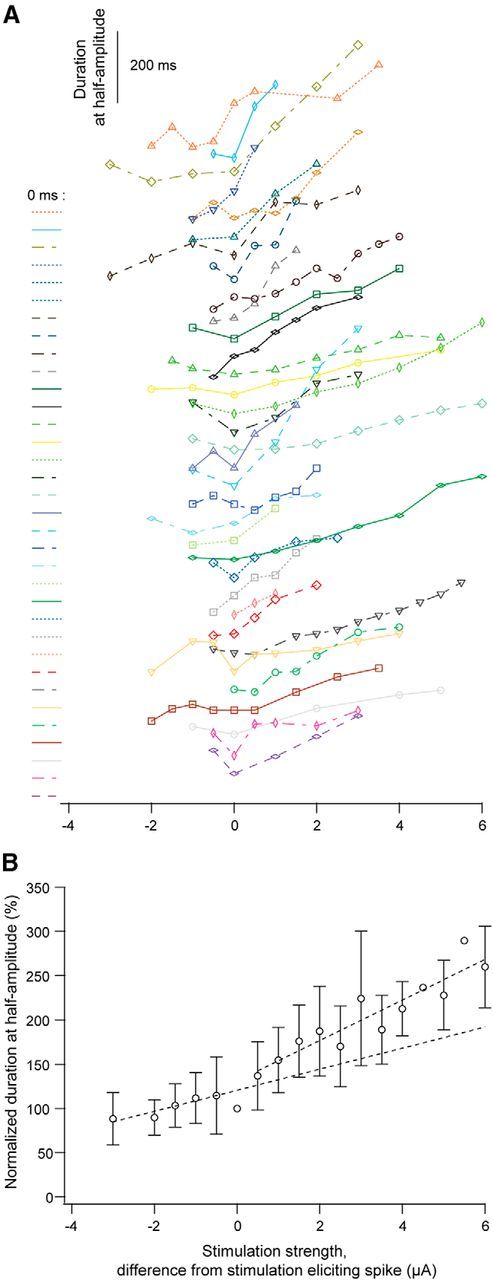
Changes of the duration of the potential by increasing intensity of glutamate stimulation. A, The duration of the potential at the half-maximum amplitude plotted against stimulus strength for each of the studied neurons. To the left of each curve the baseline (0 ms) is indicated together with a curve identifier (color and line type). For a given neuron the color and line style is the same as in Figure 2A. B, Values of normalized half-amplitude duration plotted against stimulus strength for all neurons (mean ± SD; n = 34). Dotted lines: linear regression line fitted to the values below spike threshold and to the values above the threshold.
By increasing the stimulation strength above the spike threshold, as the potential grew into a plateau (compare Fig. 1C), the degree of increasing response amplitude also varied considerably between neurons (Fig. 2A). However, the magnitude of this increase, estimated by the ratio between the amplitude of the second suprathreshold response, and the amplitude of the initial spike, was always smaller than the step of the initial spike (Fig. 2). On average, the amplitude of the second suprathreshold response was ∼15% larger than the amplitude of the initial spike (15.3 ± 4.3 vs 13.3 ± 4.3 mV; Fig. 2B; n = 34; p < 0.001). Further increase of stimulation strength had only minor effects on the peak amplitude, indicating amplitude saturation of the suprathreshold responses (Fig. 2B). Thus, the superlinear change of peak amplitude at threshold was followed by sublinear change above threshold as indicated by the two regression lines in Figure 2B.
Unlike the amplitude, the duration of the subthreshold potential, measured at 50% of the peak amplitude (i.e., duration at half-amplitude), showed only moderate growth with increasing stimulation strength (Figs. 1C,E, 3). Often, the subthreshold half-amplitude duration could be about the same or even wider than the half-amplitude duration of the initial spike (Fig. 3). Above the spike threshold, the half-amplitude duration increased gradually with increasing stimulation strength (Figs. 1C,E, 3) reflecting the elongation of the plateau.
Since the experiments were done at room temperature (∼24°C), we checked how the characteristics of the NMDA spike/plateau potentials in the TC neurons might differ at physiological temperatures, and recorded such potentials at 35°C in three neurons (six stimulation sites). The step-like increase in spike amplitude and the long (100–300 ms) suprathreshold plateaus were observed in all cases, although, as expected, the temporal characteristics were faster at the higher temperature. For example, the initial spikes were narrower at 35°C than at 24°C (half-amplitude duration: 83.8 ± 26.2 vs 138.3 ± 42.4 ms; p = 0.008, independent sample t test).
NMDA receptors are necessary for generation of spike/plateau potentials in TC neurons
To investigate whether NMDA receptors (NMDA-Rs) are necessary for generation of spike/plateau potentials in TC neurons, we tested effects of the NMDA-R antagonist CPP (15 μm) on the glutamate-evoked dendritic potentials. In addition to recording somatic voltage, we also recorded dendritic Ca2+ signals at the glutamate application site before and after wash-in of CPP (Fig. 4). The degree of response reduction was estimated by the integral of the depolarization over the half-amplitude duration of the potentials. CPP markedly reduced the spike/plateau potentials (Fig. 4B). Similar results were obtained in all neurons (n = 5): only 24.6 ± 8.9% of the control response remained after the wash-in of CPP. Moreover, the dendritic Ca2+ signal was almost completely blocked by CPP. Only 1 ± 0.8% of the control signal was left (n = 4; Fig. 4C). Like in the case of cortical NMDA spike/plateaus (Schiller et al., 2000; Major et al., 2008), the spike/plateau potential in TC neurons could not be re-initiated by stronger glutamate stimulation after the application of CPP (n = 2; Fig. 4D). This indicates that NMDA-Rs are necessary for generation of dendritic spike/plateau potentials in TC neurons.
Figure 4.
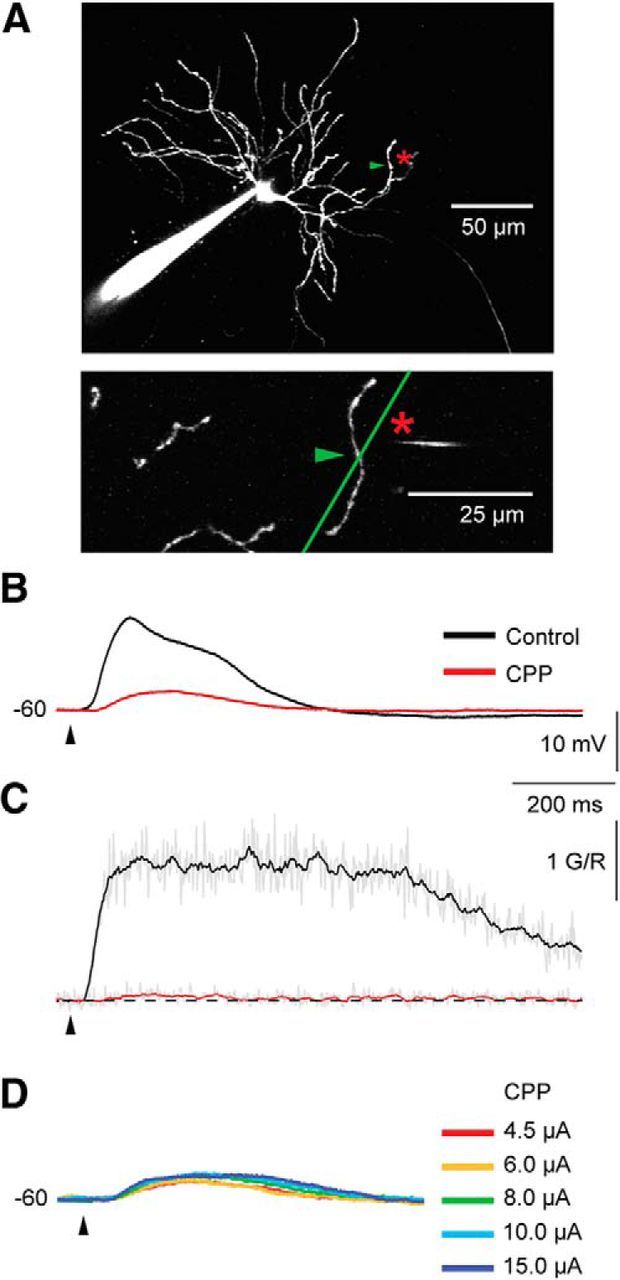
CPP eliminated the calcium signal as well as the somatic spike/plateau potential. A, Image of the recorded TC neuron. The glutamate application site (indicated by asterisk) was 106 μm from the soma and 8 μm from the selected dendrite. The green arrowhead marks the dendritic site where the calcium signal was recorded during the line scans. B, The somatically recorded spike/plateau potential. Notice the marked reduction of the response during CPP. C, The corresponding Ca2+ transient. Notice that the Ca2+ transient was nearly eliminated by CPP (15 μm). D, In the presence of CPP, the response could not be recovered by stronger stimulation current.
Another important experiment for testing a possible critical involvement of NMDA-R-mediated currents in spike/plateau-potentials is to reduce this potential by voltage-dependent Ca2+ and Na+ channel blockers, then re-initiate the potential through stronger stimulation, and finally, demonstrate that this potential can be blocked by NMDA-R antagonists (Schiller et al., 2000). The spike/plateau potentials in TC neurons passed this test like the NMDA spike/plateau potentials in cortical neurons (Schiller et al., 2000; Gordon et al., 2006; Major et al., 2008; Larkum et al., 2009). As shown by the example traces in Figure 5B, wash-in of the Ca2+ channel blocker Cd2+ (100 μm) and the Na+ channel blocker TTX (1 μm; for 10 min) had only moderate effects on the somatic depolarization; 72.9 ± 8.5% (n = 5) of the somatic control response remained. The effect of these blockers consisted mainly of an attenuation of the rise of the spike/plateau potential. The slope of a line fitted to the onset of the response decreased by 39.5 ± 17.8% after wash-in of Cd2+ and TTX (n = 5; p = 0.01). As expected, by increasing the stimulation strength, the strong and long-lasting plateau could be re-initiated during the presence of Cd2+ and TTX (Fig. 5C). It was enough to increase the stimulation strength by 2 ± 1 μA (40.4 ± 20.7%, n = 3) to elicit a plateau potential that was equal to, or stronger (111.1 ± 16.9%) than, the control response (100%).
Figure 5.
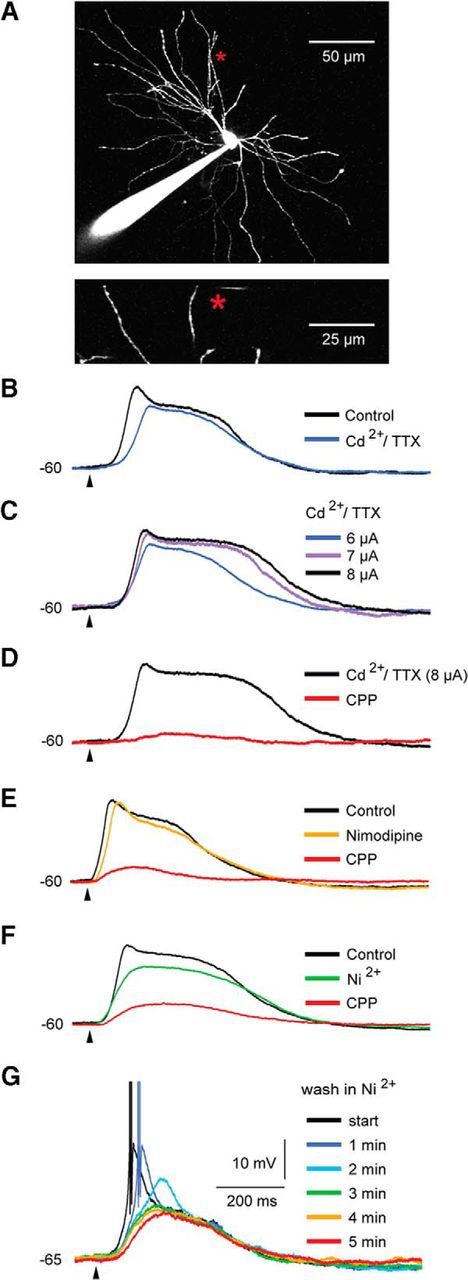
Conductances mediated by NMDA receptors are necessary for the generation of the spike/plateau potentials, whereas Ca2+ and Na+ conductances have only minor contributions. A, Image of the recorded TC neuron in B–D. The glutamate application site (indicated by asterisk) was 79 μm from the soma and 13 μm from the selected dendrite. B, Application of Cd2+ (100 μm) and TTX (1 μm) reduced the glutamate elicited spike/plateau potential by about 20%. C, The spike/plateau potential could be re-initiated by means of stronger glutamate stimulation in the presence of Cd2+ and TTX. D, The re-initiated spike/plateau was almost eliminated by 15 μm CPP. E, The application of nimodipine (50 μm) reduced the potential by about 9%, while the addition of CPP removed about 80% of the response obtained in the control condition. F, The application of Ni2+ (0.4 mm) reduced the response by about 16%, while the addition of CPP removed about 74% of the response obtained in the control condition. G, At −65 mV, the application of Ni2+ (0.4 mm) removed the T-type Ca2+ burst without affecting the plateau part of the glutamate elicited response. The data in A–D and in E–G are from different neurons.
We further checked for a possible contribution to the spike/plateau potentials by voltage-dependent L- and T-type Ca2+ channels, which play important roles in the functions of TC neurons (Budde et al., 1998; Pape et al., 2004; Errington et al., 2010, 2012). Application of nimodipine (50 μm) reduced the somatic voltage response by only 10.4 ± 9.2% (n = 4; cf. Fig. 5E), indicating that voltage-gated, L-type Ca2+ channels had only a minor effect on the generation of spike/plateaus in TC neurons. The T-type Ca2+ channel blocker Ni2+ (0.4 mm) reduced the plateau by 18.1 ± 6.2% (n = 6; cf. Fig. 5F). As for Cd2+ and TTX, application of Ni2+ mainly caused an attenuation of the initial rising part of the potential. The slope of a line fitted to the onset of the response decreased by 54.1 ± 17.3% after wash-in of Ni2+ (p = 0.01; n = 6). Interestingly, even at a hyperpolarized membrane potential (−65 mV; Fig. 5G), where the dendritic glutamate stimulation elicited the typical strong T-type Ca2+ burst, this initial response component was removed by the Ni2+ application without noticeable effects on the amplitude or the duration of the spike/plateau potential. This indicates that T-type Ca2+ channels can contribute to the onset of the spike/plateau potential, but they are not necessary for the generation of spike/plateau potentials, not even at a hyperpolarized membrane potential. In contrast to the minor reductions of the glutamate-evoked response by calcium and sodium channel blockers, the addition of 15 μm CPP removed most of the response. CPP removed 79.9 ± 16.3% of the residual response after wash-in of Cd2+ and TTX (n = 4; Fig. 5D), 80.9 ± 14.5% of the response after wash-in of nimodipine (n = 3; Fig. 5E), and 72.1 ± 9.4% of the response after wash-in of Ni2+ (n = 4; Fig. 5F).
The spread of the local potentials through the dendrites to soma
The two-photon measurements of the Ca2+ transients related to the spike/plateau potentials at different dendritic sites showed that the Ca2+ signal was attenuating rapidly with increasing distance from the stimulation site. As illustrated by the individual response traces from a single TC neuron (Fig. 6C), this distance (only the Ca2+ signal spread toward soma was investigated) depended on the stimulation strength. Stronger stimulation elicited stronger and longer lasting, but still local Ca2+ transients. This increase was also reflected in stronger somatic depolarization. The marked attenuation of the Ca2+ transients with increasing distance from the stimulation site, and thus the limited spread along the dendrite, was observed in all neurons where plateau-elicited Ca2+ transients were measured at two (n = 9) or three (n = 6) different sites along the dendrite (Fig. 6D).
Figure 6.
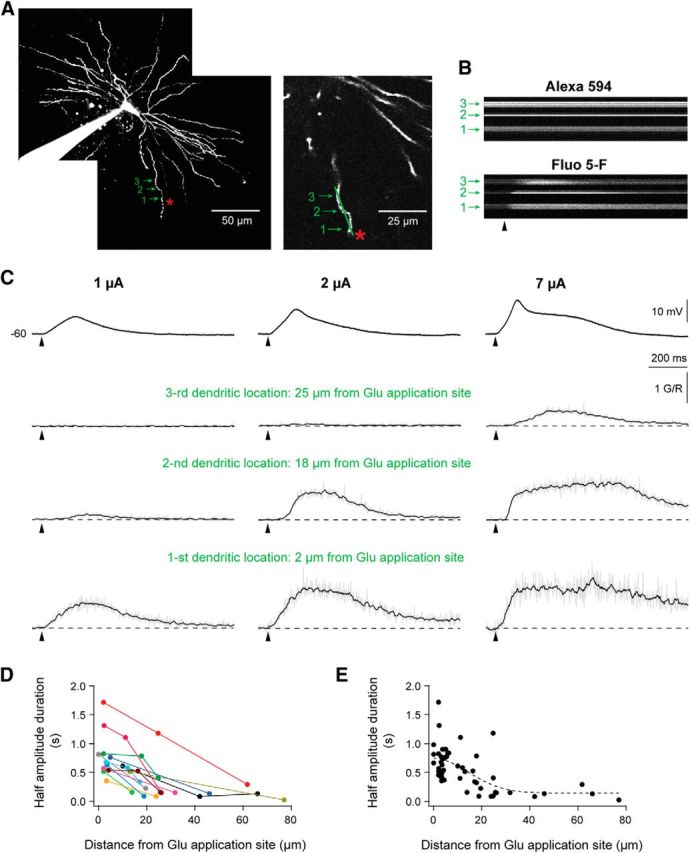
Glutamate-elicited Ca2+ transients were restricted to a small dendritic region near the stimulation site. A, Image of the recorded TC neuron in B and C. Glutamate was applied at 110 μm from the soma and 7 μm from the dendrite. The green arrowheads mark the dendritic sites where the line scans of the Ca2+ transients were recorded. B, Single line scans, which demonstrate that the signal of the Ca2-insensitive Alexa 594 was constant, while the fluorescence intensity of the calcium indicator Fluo-5F, changed after the stimulation. In this case, calcium signals were recorded by line scans with identical scanning parameters at three dendritic locations. C, The uppermost row of traces shows somatically recorded potentials elicited at three different glutamate stimulation strengths. The remaining three rows of traces show the corresponding Ca2+ transients (ΔG/R), measured at three different positions indicated in A. D, Half-amplitude duration of the Ca2+ signals plotted as a function of distance from the glutamate application site. These data were collected from the neurons (n = 15) where the Ca2+ transients were recorded at different sites along the same dendritic arbor. Points from the same dendrite have the same color. The calcium signals were elicited by the plateau potentials. E, Population data (n = 28) showing the decay of the Ca2+ signal duration as a function of increasing distance from the glutamate application site. Dataset in D included. The dashed line shows a Gaussian function fitted to the data.
The data from the individual neurons, as well as the pooled data from all neurons, indicated that the calcium signal decayed rapidly with increasing distance from the glutamate application site, and disappeared within a distance of 20–30 μm. A Gaussian profile, f(x) = , fitted to the pooled data, indicated a rendered width of 20.3 ± 5.8 μm (Fig. 6E; n = 28).
The degree of attenuation of the potential due to the conduction along the dendrite was estimated by comparing the amplitude of the NMDA spikes elicited at two different distances from soma along a single dendrite. For the neuron illustrated in Figure 7, A and B, the spike amplitude decreased from 12.8 mV, when elicited 76 μm from soma, to 10.6 mV, when elicited 102 μm from soma, indicating an attenuation of 0.8 mV/10 μm. The average attenuation for all cases was 0.5 mV/10 μm (p = 0.001, n = 7).
Figure 7.
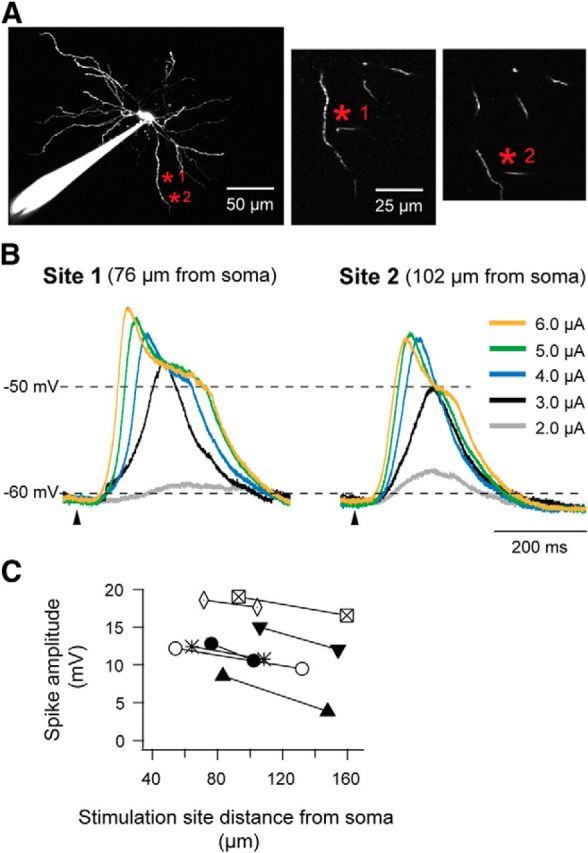
Attenuation of the potential along the dendrite. Comparisons of response amplitudes at the soma elicited by glutamate stimulation at two different distances from soma along the same dendrite. A, Image of the TC neuron recorded in B. Two stimulation sites along the same dendrite are marked by asterisks in red. Glutamate application Site 1 was 76 μm from the soma and 7 μm from the dendrite; Site 2 was 102 μm from the soma and 9 μm from the dendrite. B, Traces recorded by different stimulus strength at two distances from soma. Stimulation strength is indicated by the color scale. C, Amplitudes of initial spikes elicited at two glutamate stimulation sites (n = 7).
The dependence of spike/plateaus on the membrane potential
Since TC neurons can operate in different modes depending on the prevailing membrane potential, we investigated the relationship between NMDA spike/plateau potentials and the membrane potential.
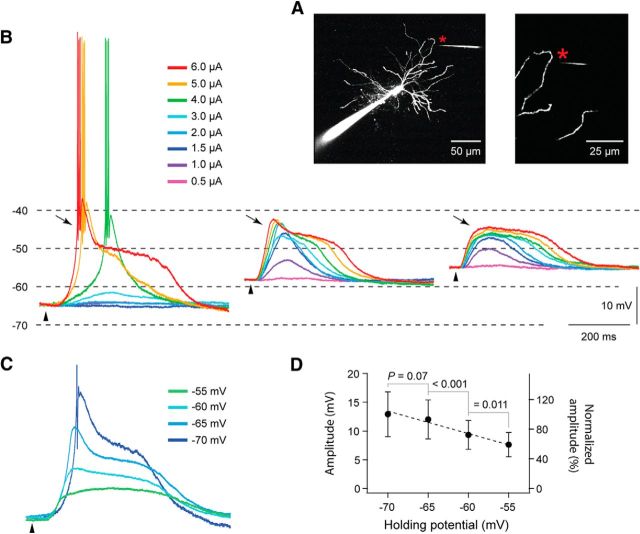
The spike/plateau potentials could be elicited at both hyperpolarized and depolarized membrane potentials (Fig. 8). As expected from the properties of voltage-gated T-type Ca2+ channels (Llinás and Steriade, 2006), and from our experiments with Ni2+ (Fig. 5G), a moderate glutamate pulse evoked an initial T-type Ca2+ burst at hyperpolarized membrane potentials (−65 mV; Fig. 8B; 4 μA, green trace). At stronger stimulation, the initial Ca2+ burst was followed by a long-lasting depolarization plateau (∼15 mV; Fig. 8B, 5 μA, yellow trace; 6 μA, red trace). At depolarized membrane potentials, the voltage-dependent T-type Ca2+ conductance was strongly attenuated (−58 mV) or absent (−55 mV). However, the long-lasting plateau potentials were reliably evoked and even by weaker stimulation currents presumably due to reduced Mg2+ blockade and increased NMDA-R conductance. Similar results were found in the other tested neurons (n = 11). The level of the plateau amplitude decreased with increasing membrane depolarization as expected from the reduced driving potential. This change is shown by the superimposed traces from an individual neuron in Figure 8C, and by the population data in Figure 8D. The average plateau amplitude decreased by about 40% when the holding potential was changed from −70 to −55 mV (Fig. 8D).
Figure 8.
Spike/plateaus at different membrane potentials. A, Image of the recorded TC neuron in B. The glutamate application site (indicated by an asterisk) was 99 μm from the soma and 7 μm from the dendrite. B, Somatically recorded potentials elicited by local dendritic application of glutamate at different membrane potentials: −65 (left), −58 (middle), and −55 mV (right). The color code indicates the strength of the stimulation current. Notice that the T-type Ca2+ potential (indicated by an arrow) was reduced or disappeared at more depolarized membrane potentials. C, Superimposed spike/plateau potentials recorded at different membrane potentials. The stimulation strength (3 μA) was the same in all cases. The action potentials are truncated. The color code indicates the holding membrane potential. The neuron in C is different from the one in A and B. D, The average amplitude of the spike/plateau potential plotted as a function of the membrane potential (n = 8).
NMDA spike/plateau potentials elicited in a single distal dendrite can shift the firing mode from burst to tonic
At hyperpolarized membrane potentials, which in vivo are prevalent during slow-wave sleep, the T-type Ca2+ spikes in TC neurons generate intrinsic rhythmic burst firing of action potentials that largely blocks the transmission of signals from retina to visual cortex (McCormick and Pape, 1990; McCormick and Bal, 1997). After a T-type Ca2+ spike, the T-channels inactivate, and a relative long-lasting (>50 ms) hyperpolarization is required for their de-inactivation (cf. Llinás and Steriade, 2006). Accordingly, a proper depolarization that interferes with the de-inactivation period will block the burst generation and induce a switch of the firing mode from burst to tonic.
To study whether the depolarization elicited by NMDA spike/plateaus can prevent generation of T-type Ca2+ bursts by blocking de-inactivation of the T-type Ca2+ conductance, we did experiments (n = 6) where two T-type Ca2+ bursts were induced by two brief soma-depolarizing current pulses (10 ms, 120–150 pA; 600 ms interpulse interval; Fig. 9C) to a hyperpolarized (in the range of −70 to−-65 mV) TC neuron, and combined this with local dendritic glutamate stimulation (Figs. 9A,B). The strengths of the glutamate stimulations were adjusted such that they would elicit NMDA spike/plateaus (Fig. 9D). We then studied the effects of the plateau on the response to the second somatic pulse when the glutamate stimulus was delivered at different intervals after the first depolarizing current pulse (Fig. 9E). The effects of the spike/plateau potential on the response to the second somatic pulse depended on the strength of the glutamate stimulation and thereby on the duration of the plateau and on the timing of the spike/plateau between the two somatic pulses. The strong and long-lasting depolarization provided by the plateaus could inactivate the T-type Ca2+ conductance such that the second soma-injected pulse did not elicit a T-type calcium burst, but only an EPSP-like potential (Fig. 9E, upper trace) or an EPSP-like potential eliciting a single regular Na+/K+ action potential (bottom traces). This demonstrates that a dendritic spike/plateau potential elicited at a single distal dendrite can be sufficient to inactivate the T-type Ca2+ conductance for several hundred milliseconds, such that a brief, somatic depolarization in this period will elicit a single spike or a subthreshold EPSC instead of a T-type Ca2+ burst.
Figure 9.
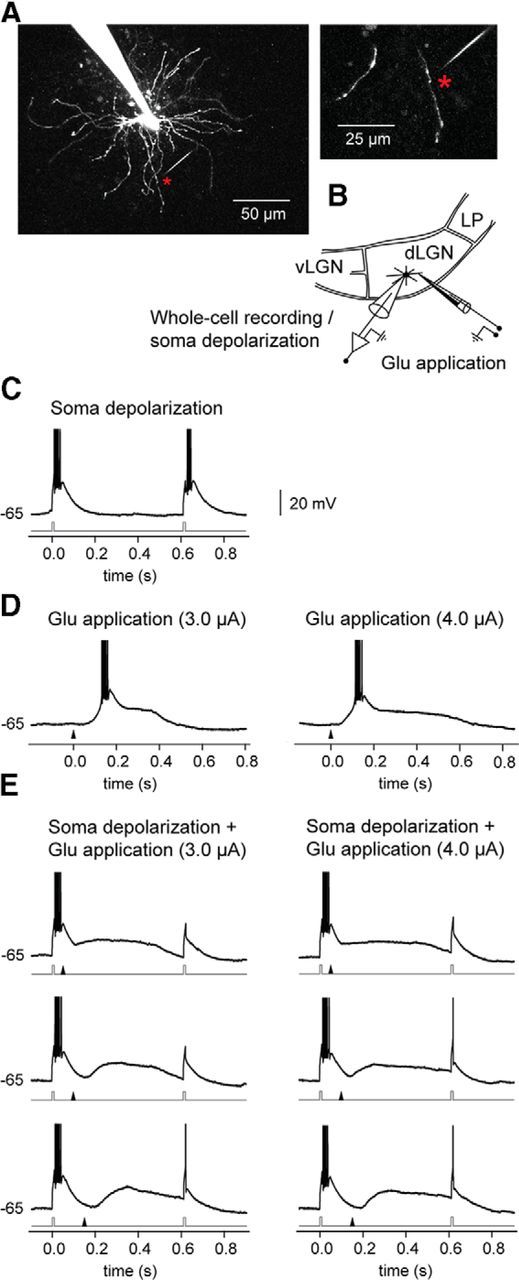
A spike/plateau potential elicited at a single distal dendrite can inactivate T-type Ca2+ conductance in TC neurons thereby preventing burst firing. A, Image of the recorded TC neuron. The glutamate application site (indicated by an asterisk) was 67 μm from the soma and 5 μm from the dendrite. B, Scheme of experiment: simultaneous two-photon imaging and somatic whole-cell recording. vLGN, ventral lateral geniculate nucleus; LP, lateral posterior nucleus. C, T-type Ca2+ bursts were elicited by two depolarizing pulses (each 10 ms, 150 pA) to the soma of a hyperpolarized (−65 mV) TC neuron. The timing of the pulses is indicated by the current trace (gray) below the trace of the response. D, Responses, elicited by local dendritic glutamate stimulation (left, 3 μA; right, 4 μA). The time of the application of the glutamate pulse is indicated by the arrowhead below each trace. E, Responses elicited by combined somatic depolarizing pulses and dendritic glutamate stimulation. Due to the NMDA spike/plateau, a T-type calcium burst in response to the second somatic pulse was not elicited. The glutamate stimulation started 50 ms (top), 100 ms (middle), or 150 ms (bottom) after the first depolarizing pulse. Action potentials are truncated at 0 mV.
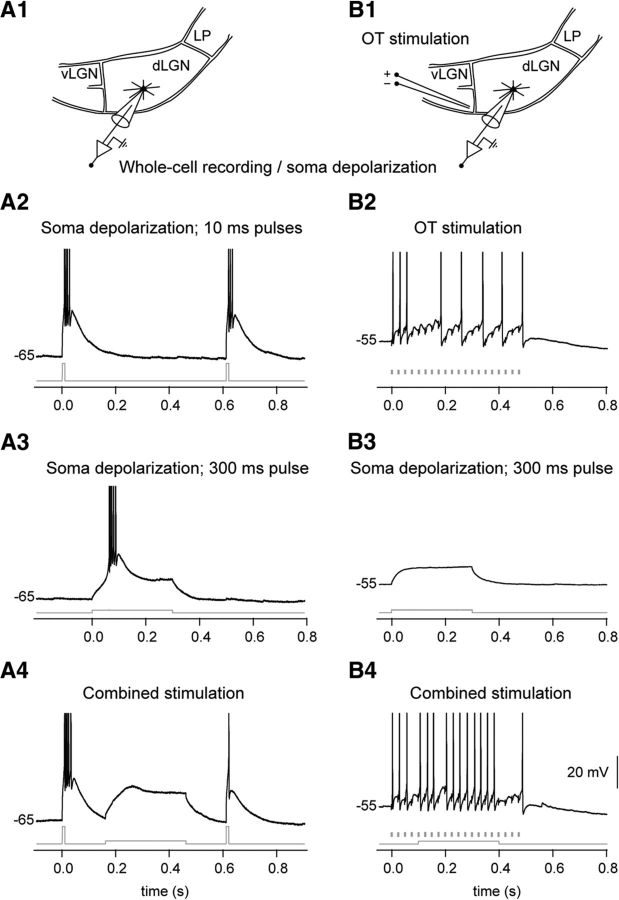
It was the sustained somatic depolarization by the NMDA spike/plateau that was critical for preventing a T-type calcium burst, since a direct depolarizing current injection to the soma through the recording electrode had a similar effect (Fig. 10A). The results suggest that a dendritic NMDA spike/plateau potential can have an important function in inducing a quick shift of firing mode in TC neurons from burst to tonic.
Figure 10.
A depolarizing current injection to the soma of a TC neuron can inactivate T-type Ca2+ conductance (A) and facilitate the retinogeniculate signal transmission (B). A1, Scheme of experiment: somatic whole-cell recording and depolarizing current injection through the recording electrode. A2, T-type Ca2+ bursts were elicited by two depolarizing pulses (each 10 ms, 200 pA) to the soma of a hyperpolarized (−65 mV) TC neuron. The timing of the pulses is indicated by the current trace (gray) below the response trace. A3, Response elicited by a 300 ms depolarizing current injection (50 pA). A4, Responses elicited by combined somatic depolarizing current injection and somatic depolarizing pulses. Due to the long somatic depolarization step, the second somatic pulse did not elicit a T-type calcium burst. The current injection (300 ms) started 150 ms after the first 10 ms pulse. B1, Scheme of experiment: somatic whole-cell recording and depolarizing current injection through the recording electrode; optic tract (OT) fibers were stimulated electrically. B2, Response to OT stimulation (20 pulses at 40 Hz) elicited at −55 mV membrane potential. The timing of each pulse is indicated by a marker below the trace. B3, Response elicited by a depolarizing current injection (300 ms, 25 pA). B4, Response to the combined OT stimulation and a 300 ms somatic depolarizing current injection. Due to the long somatic depolarization step, more action potentials were generated by the EPSPs, which were elicited through the retinal input. The depolarizing current injection started 100 ms after the beginning of the electrical train stimulation.
Dendritic NMDA spike/plateau potentials can facilitate the retinogeniculate transmission
The response of a TC neuron in vivo to a proper visual stimulus flashed on its receptive field consists of a strong, initial transient high-frequency firing followed by a sustained, lower frequency response (Cleland and Lee, 1985). This is similar to the response of the retinal ganglion neurons that provide their specific visual input except that not all afferent spikes elicit a spike in the TC neuron (Cleland and Lee, 1985; Hartveit and Heggelund, 1995). The transmission of the sustained retinal input can be facilitated by other excitatory input, for example, modulatory cholinergic input from the brainstem (Hartveit and Heggelund, 1995). Like depolarizing current injection to soma (Fig. 10B), such depolarization does not induce firing per se, but enhances the NMDA-R-mediated retinal input component (Augustinaite and Heggelund, 2007).
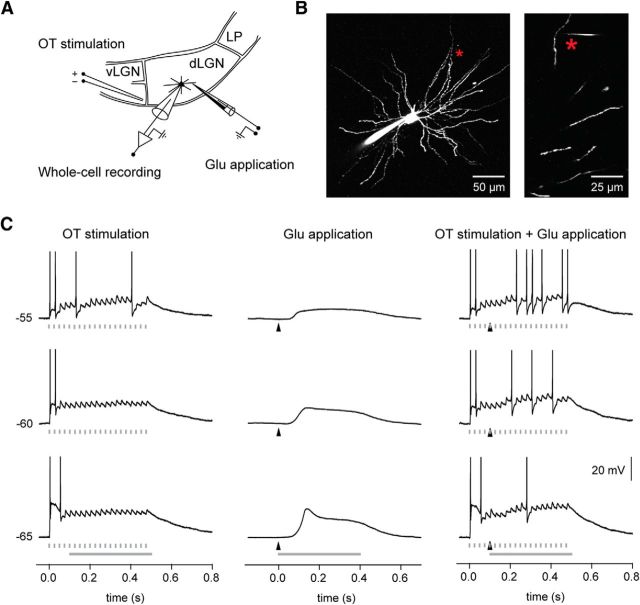
We studied whether an NMDA spike/plateau potential, elicited at a relatively distant location of a single dendrite, can give a sufficient depolarization to increase the transfer ratio of the retinal input (electrical optic tract stimulation; 20 pulses at 40 Hz). The train stimulation was combined with local dendritic application of glutamate (experimental scheme shown in Fig. 11A; n = 7).
Figure 11.
NMDA spike/plateaus potentials facilitate the retinogeniculate signal transmission. A, Scheme of experiment: simultaneous two-photon imaging and somatic whole-cell recording from a TC neuron in vitro. Responses were elicited by electric stimulation of optic tract (OT) fibers, combined with local dendritic glutamate application. vLGN, ventral lateral geniculate nucleus; LP, lateral posterior nucleus. B, Image of the recorded neuron. The glutamate application site (indicated by an asterisk) was 123 μm from the soma and 7 μm from the dendrite. C, Responses elicited at three different membrane potentials. Left column, Responses to OT stimulation (20 pulses at 40 Hz). The timing of each pulse is indicated by a marker below each trace. Center column, NMDA spike/plateau potentials elicited by local dendritic glutamate stimulation (stimulation site marked by the asterisk in B). The timing of the glutamate pulse is indicated by the arrowhead below each trace. Right column, Responses to the combined OT and dendritic glutamate stimulation. Due to the long-lasting NMDA spike/plateau, more action potentials were elicited by the EPSPs generated through the retinal input. Notice that the electrical train stimulation started 100 ms before the glutamate application. Response period used for comparison of the transfer ratio (see Results) is indicated by the thick gray line.
In the control condition without dendritic glutamate application, the first few stimuli in the train elicited a transient firing in the TC neuron at all three membrane potentials tested, while subsequent pulses resulted only in EPSPs at the lower levels of membrane potential (−65 and −60 mV; Fig. 11C), or a low-frequency firing at higher depolarization (−55 mV; Fig. 11C), consistent with the short-term synaptic depression at retinogeniculate synapses (Chen et al., 2002; Kielland and Heggelund, 2002). However, after glutamate stimulation, which elicited a long-lasting plateau potential (about 350 ms half-amplitude duration in Fig. 11C), the number of stimulus pulses that elicited spikes increased, particularly at membrane potentials of −60 and −55 mV (−65 mV: increase by 1.3 ± 0.7 spikes/s; p = 0.015; −60 mV: increase by 9.8 ± 6.4 spikes/s, p = 0.002; −55 mV: increase by 9.4 ± 6.7 spikes/s, p = 0.003; only the response period after the beginning of the combined stimulation was used for comparison; Fig. 11C). This demonstrated that input to distal dendrites, where the cortical afferents are terminating, can regulate the number of action potentials from retina that are transmitted to cortex. The relatively long-lasting somatic depolarization caused by the long NMDA spike/plateau potentials (280.7 ± 42.1 ms half-amplitude duration) was the critical factor for the facilitation of the retinogeniculate transmission. A similar effect could be elicited by direct somatic current injection through the recording electrode (compare Fig. 10B). This also indicates that the increased retinogeniculate transfer ratio was caused by the prolonged somatic depolarization by the NMDA plateau. In experiments, where the optic tract stimulation was combined with glutamate stimulation that only elicited the initial NMDA spike (133.8 ± 26.3 ms half-amplitude duration; n = 4), the firing rate was not significantly affected (−55 mV, increase by 1.1 ± 3.1 spikes/s; p = 0.531).
Discussion
The results demonstrate that dendritic NMDA spike/plateau potentials can be evoked in TC neurons by local glutamate stimulation on a single dendritic arbor. The potentials had similar electrophysiological and pharmacological properties as NMDA spike/plateau potentials in cortical pyramidal neurons (Schiller et al., 2000; Nevian et al., 2007; Major et al., 2008; Larkum et al., 2009). Weak stimulation elicited a small-amplitude, EPSP-like potential at soma that gradually grew in amplitude with increasing stimulus intensity to a threshold where a marked increase of amplitude was elicited indicating a spike-like potential. Further increase caused an elongation of the potential into a plateau that could last up to several hundred milliseconds. The spike/plateau potentials were selectively blocked by the NMDA-R antagonist CPP. The Ca2+ channel blockers Cd2+, Ni2+ and nimodipine, and the Na+ channel blocker TTX had only minor effects. Even at hyperpolarized membrane potentials (−70 mV or −65 mV), where the depolarization elicited a strong T-type Ca2+ potential, the T-type Ca2+ blocker Ni2+ removed the Ca2+ spike with only minor effects on the NMDA spike/plateau potential.
The amplitude of the NMDA spike was smaller when elicited at increasing distance from soma. However, this attenuation was weaker than in cortical pyramidal neurons (Nevian et al., 2007; Major et al., 2008), probably because the dendrites of TC neurons are relatively thick throughout most of their extent, with constant diameter, especially at higher order branches (Ohara and Havton, 1994; Ohara et al., 1995), making them electrotonically compact (Sherman and Guillery, 2006). We were particularly interested in distal dendrites, because they receive the excitatory feedback from visual cortex (Wilson et al., 1984). To prevent activation of proximally located retinal synapses (Van Horn et al., 2000), as well as avoid simultaneous stimulation of several dendritic branches (most branching in TC neurons occurs proximally to soma; Ohara and Havton, 1994; Ohara et al., 1995; Krahe et al., 2011), the data were obtained at intermediate or distal sites of the terminal dendrites. When NMDA spike/plateaus were elicited by local glutamate stimulation on a single dendritic branch, the Ca2+ imaging showed transients along a distance up to about 20 μm from the application site. This corresponds to previous findings in basal dendrites of cortical pyramidal neurons (Major et al., 2008). Moreover, this is consistent with the hypothesis that the NMDA spike/plateaus can be elicited by clustered synaptic input that activates NMDA receptor channels, and remove the Mg2+ block of these channels over a sub-branch of the dendrite (Schiller and Schiller, 2001).
The NMDA spike/plateau potentials in the TC neurons tended to not elicit somatic action potentials. Exceptions are those on top of the T-type Ca2+ spike at the start of the NMDA spike/plateaus at hyperpolarized membrane potentials, Na+ spikes that in the intact brain are mainly elicited by intrinsic thalamic mechanisms rather than by action potentials from the retina. In fact, we never observed action potentials on the plateau itself when the glutamate was applied to a dendrite, possibly partly due to the slow rise time of these potentials compared with fast EPSPs. Moreover, the plateau level was reduced at more depolarized membrane potential (Fig. 8), and this too would contribute to keeping the membrane potential below the threshold for Na+ spike generation. This property is interesting because action potentials directly elicited by the cortical input could distort the transmission of the retinal signals to the visual cortex.
The AMPA-R and NMDA-R-mediated response pattern of TC neurons to a train of action potentials in the retinal afferents varies with increasing membrane potential from a transient response with just a few AMPA-R-initiated spikes at the start of the train, which are reinforced by a T-type Ca2+ spike at sufficient hyperpolarized membrane potential, to a sustained firing at more depolarized membrane potentials, where single spikes in the afferent input may elicit single spikes. The intensity of the sustained firing mainly depends on the NMDA-R-mediated component of the EPSPs that can temporally summate and thus lift the membrane potential (Augustinaite and Heggelund, 2007). Due to strong, short-term synaptic depression at synapses between retinal afferents and TC neurons (Chen et al., 2002; Kielland and Heggelund, 2002), the AMPA-R component is insufficient to elicit sustained firing. Together with the NMDA-R-mediated component, however, the AMPA-R component can contribute significantly to the generation of action potentials that are temporally synchronized to the retinal input (Blitz and Regehr, 2003; Augustinaite and Heggelund, 2007). Other simultaneous depolarizing inputs have a facilitatory effect such that more of the EPSPs reach threshold. Well known mechanisms for such depolarization are state-related brainstem inputs (cholinergic, noradrenergic, and histaminergic; for review, see McCormick and Bal, 1997), which play an important role in switching the mode of firing to retinal input from burst to tonic and in regulating the amount of sustained firing elicited by the retinal input in the tonic mode. The cortical input to TC neurons can perform a similar function. The cortical input represents a retinotopic feedback that matches the thalamocortical projection (Bourassa and Deschênes, 1995), although more scattered than the input from retina (Murphy and Sillito, 1996, Murphy et al., 2000). Thus, while the depolarizing inputs from the brainstem give a more general increase of retinocortical transmission, the cortical feedback can provide selective facilitation of input from a specific part of the retina. It is well established that mechanisms for synaptic short-term plasticity, like synaptic facilitation, which presumably mainly depends on presynaptic mechanisms, have an important role in this cortical regulation (cf. Turner and Salt, 1998; Granseth et al., 2002, 2004; Kielland et al., 2006; Augustinaite et al., 2011). Moreover, there is evidence that also group I and group II metabotropic glutamate receptors are involved in the regulation of corticothalamic transmission (McCormick and von Krosigk, 1992; Godwin et al., 1996).
Our discovery of dendritic NMDA spike/plateau potentials in TC neurons reveals a new powerful mechanism by which cortical feedback can enhance the retinocortical transmission by lifting the membrane potential toward the threshold for action potential generation, and thereby increasing the probability for spike generation by the synaptic input from the retinal afferents. The NMDA spike/plateau potentials are particularly well suited for this purpose, especially when relative fast and straightforward onset of depolarization is required for precise transmission of inputs from a distinct retinal region. In this context, these potentials may have two important functions. First, in a prevailing burst mode of TC neurons, the depolarizing plateau may induce a quick shift from burst to tonic mode, as supported by our results in Figure 9. Second, in a tonic mode, the plateau potentials will further depolarize the TC neuron and facilitate the NMDA-R-mediated response component elicited by the retinal input and thereby increase the retinocortical transmission (Augustinaite and Heggelund, 2007), as illustrated by the data in Figure 11. The degree of increased firing in Figure 11C may appear rather weak, but since this effect was caused by only brief stimulation at one site of a single dendrite, the effect may, in fact, be substantial considering that the cortical feedback presumably excites a TC neuron through numerous terminals on several dendrites even from a single afferent.
In addition to reciprocal connections with TC neurons in dLGN, lamina 6 pyramidal neurons in primary visual cortex receive input from other laminae of the primary visual cortex (Sillito et al., 2006) and other visual areas in cortex (Murphy et al., 2000; De Pasquale and Sherman, 2013). For instance, in the primate brain, lamina 6 neurons get direct signals from neurons in area MT (Rockland and Knutson, 2000) about stimuli moving across a part of the visual field, signals that can activate lamina 6 neurons and facilitate a series of TC neurons with receptive fields along the trajectory of a stimulus even before the stimulus reach their receptive field (Sillito et al., 2006; Jones et al., 2013). It is not known whether there is a similar priming mechanism in rodents, but also in these animals the lamina 6 neurons provide feedback to TC neurons based on the superior visual processing in cortex. Moreover, the lamina 6 pyramidal neurons in primary visual cortex are virtually silent in anesthetized animals (Tsumoto and Suda, 1980) indicating that their functions are linked to awake states. Interestingly, these neurons also receive input from claustrum (Carey and Neal, 1985), assumed to be implicated in processes like focused attention (Crick and Koch, 2005). In this connection, the dendritic NMDA spike/plateaus in TC neurons, elicited by cortical afferents, may be regarded as a powerful mechanism for providing a fast and strong impact on the operation of TC neurons as required for rapid shifts to tonic mode, and for opening a time window for optimal transmission of retinal signals, for instance, during fixation periods of the eyes or in conditions like focused attention.
Footnotes
This project was financially supported by the Norwegian Research Council (FRIBIO) and the Letten Foundation.
The authors declare no competing financial interests.
References
- Antic SD, Zhou WL, Moore AR, Short SM, Ikonomu KD. The decade of the dendritic NMDA spike. J Neurosci Res. 2010;88:2991–3001. doi: 10.1002/jnr.22444. [DOI] [PMC free article] [PubMed] [Google Scholar]
- Augustinaite S, Heggelund P. Changes in firing pattern of lateral geniculate neurons caused by membrane potential dependent modulation of retinal input through NMDA receptors. J Physiol. 2007;582:297–315. doi: 10.1113/jphysiol.2007.131540. [DOI] [PMC free article] [PubMed] [Google Scholar]
- Augustinaite S, Yanagawa Y, Heggelund P. Cortical feedback regulation of input to visual cortex: role of intrageniculate interneurons. J Physiol. 2011;589:2963–2977. doi: 10.1113/jphysiol.2011.205542. [DOI] [PMC free article] [PubMed] [Google Scholar]
- Behabadi BF, Polsky A, Jadi M, Schiller J, Mel BW. Location-dependent excitatory synaptic interactions in pyramidal neuron dendrites. PLoS Comput Biol. 2012;8:e1002599. doi: 10.1371/journal.pcbi.1002599. [DOI] [PMC free article] [PubMed] [Google Scholar]
- Blitz DM, Regehr WG. Retinogeniculate synaptic properties controlling spike number and timing in relay neurons. J Neurophysiol. 2003;90:2438–2450. doi: 10.1152/jn.00562.2003. [DOI] [PubMed] [Google Scholar]
- Bourassa J, Deschênes M. Corticothalamic projections from the primary visual cortex in rats: a single fiber study using biocytin as an anterograde tracer. Neuroscience. 1995;66:253–263. doi: 10.1016/0306-4522(95)00009-8. [DOI] [PubMed] [Google Scholar]
- Budde T, Munsch T, Pape HC. Distribution of L-type calcium channels in rat thalamic neurons. Eur J Neurosci. 1998;10:586–597. doi: 10.1046/j.1460-9568.1998.00067.x. [DOI] [PubMed] [Google Scholar]
- Carey RG, Neal TL. The rat claustrum: afferent and efferent connections with visual cortex. Brain Res. 1985;329:185–193. doi: 10.1016/0006-8993(85)90524-4. [DOI] [PubMed] [Google Scholar]
- Chen C, Blitz DM, Regehr WG. Contributions of receptor desensitization and saturation to plasticity at the retinogeniculate synapse. Neuron. 2002;33:779–788. doi: 10.1016/S0896-6273(02)00611-6. [DOI] [PubMed] [Google Scholar]
- Cleland BG, Lee BB. A comparison of visual response of cat lateral geniculate nucleus neurones with those of ganglion cells afferent to them. J Physiol. 1985;369:249–268. doi: 10.1113/jphysiol.1985.sp015899. [DOI] [PMC free article] [PubMed] [Google Scholar]
- Crick FC, Koch C. What is the function of the claustrum? Philos Trans R Soc Lond B Biol Sci. 2005;360:1271–1279. doi: 10.1098/rstb.2005.1661. [DOI] [PMC free article] [PubMed] [Google Scholar]
- De Pasquale R, Sherman SM. A modulatory feedback from higher visual areas to V1 in the mouse. J Neurophysiol. 2013;109:2618–2631. doi: 10.1152/jn.01083.2012. [DOI] [PMC free article] [PubMed] [Google Scholar]
- Dodt HU, Zieglgänsberger W. Visualizing unstained neurons in living brain slices by infrared DIC-videomicroscopy. Brain Res. 1990;537:333–336. doi: 10.1016/0006-8993(90)90380-T. [DOI] [PubMed] [Google Scholar]
- Errington AC, Renger JJ, Uebele VN, Crunelli V. State-dependent firing determines intrinsic dendritic Ca2+ signalling in thalamocortical neurons. J Neurosci. 2010;30:14843–14853. doi: 10.1523/JNEUROSCI.2968-10.2010. [DOI] [PMC free article] [PubMed] [Google Scholar]
- Errington AC, Hughes SW, Crunelli V. Rhythmic dendritic Ca2+ oscillations in thalamocortical neurons during slow non-REM sleep-related activity in vitro. J Physiol. 2012;590:3691–3700. doi: 10.1113/jphysiol.2012.232132. [DOI] [PMC free article] [PubMed] [Google Scholar]
- Godwin DW, Vaughan JW, Sherman SM. Metabotropic glutamate receptors switch visual response mode of lateral geniculate nucleus cells from burst to tonic. J Neurophysiol. 1996;76:1800–1816. doi: 10.1152/jn.1996.76.3.1800. [DOI] [PubMed] [Google Scholar]
- Gordon U, Polsky A, Schiller J. Plasticity compartments in basal dendrites of neocortical pyramidal neurons. J Neurosci. 2006;26:12717–12726. doi: 10.1523/JNEUROSCI.3502-06.2006. [DOI] [PMC free article] [PubMed] [Google Scholar]
- Granseth B. Dynamic properties of corticogeniculate excitatory transmission in the rat dorsal lateral geniculate nucleus in vitro. J Physiol. 2004;556:135–146. doi: 10.1113/jphysiol.2003.052720. [DOI] [PMC free article] [PubMed] [Google Scholar]
- Granseth B, Ahlstrand E, Lindström S. Paired pulse facilitation of corticogeniculate EPSCs in the dorsal lateral geniculate nucleus of the rat investigated in vitro. J Physiol. 2002;544:477–486. doi: 10.1113/jphysiol.2002.024703. [DOI] [PMC free article] [PubMed] [Google Scholar]
- Hartveit E, Heggelund P. Brainstem modulation of signal transmission through the cat dorsal lateral geniculate nucleus. Exp Brain Res. 1995;103:372–384. doi: 10.1007/BF00241496. [DOI] [PubMed] [Google Scholar]
- Huang S, Uusisaari MY. Physiological temperature during brain slicing enhances the quality of the acute slice preparations. Front Cell Neurosci. 2013;7:48. doi: 10.3389/fncel.2013.00048. [DOI] [PMC free article] [PubMed] [Google Scholar]
- Jones HE, Andolina IM, Grieve KL, Wang W, Salt TE, Cudeiro J, Sillito AM. Responses of primate LGN cells to moving stimuli involve a constant background modulation by feedback from area MT. Neuroscience. 2013;246:254–264. doi: 10.1016/j.neuroscience.2013.04.055. [DOI] [PMC free article] [PubMed] [Google Scholar]
- Kielland A, Heggelund P. AMPA and NMDA currents show different short-term depression in the dorsal lateral geniculate nucleus of the rat. J Physiol. 2002;542:99–106. doi: 10.1113/jphysiol.2002.019240. [DOI] [PMC free article] [PubMed] [Google Scholar]
- Kielland A, Erisir A, Walaas SI, Heggelund P. Synapsin utilization differs among functional classes of synapses on thalamocortical cells. J Neurosci. 2006;26:5786–5793. doi: 10.1523/JNEUROSCI.4631-05.2006. [DOI] [PMC free article] [PubMed] [Google Scholar]
- Krahe TE, El-Danaf RN, Dilger EK, Henderson SC, Guido W. Morphologically distinct classes of relay cells exhibit regional preferences in the dorsal lateral geniculate nucleus of the mouse. J Neurosci. 2011;31:17437–17448. doi: 10.1523/JNEUROSCI.4370-11.2011. [DOI] [PMC free article] [PubMed] [Google Scholar]
- Larkum ME, Nevian T, Sandler M, Polsky A, Schiller J. Synaptic integration in tuft dendrites of layer 5 pyramidal neurons: a new unifying principle. Science. 2009;325:756–760. doi: 10.1126/science.1171958. [DOI] [PubMed] [Google Scholar]
- Leresche N, Lightowler S, Soltesz I, Jassik-Gerschenfeld D, Crunelli V. Low-frequency oscillatory activities intrinsic to rat and cat thalamocortical cells. J Physiol. 1991;441:155–174. doi: 10.1113/jphysiol.1991.sp018744. [DOI] [PMC free article] [PubMed] [Google Scholar]
- Llinás RR, Steriade M. Bursting of thalamic neurons and states of vigilance. J Neurophysiol. 2006;95:3297–3308. doi: 10.1152/jn.00166.2006. [DOI] [PubMed] [Google Scholar]
- Major G, Polsky A, Denk W, Sciller J, Tank DW. Spatiotemporal graded NMDA spike/plateau potentials in basal dendrites of neocortical pyramidal neurons. J Neurophysiol. 2008;99:2584–2601. doi: 10.1152/jn.00011.2008. [DOI] [PubMed] [Google Scholar]
- Major G, Larkum ME, Schiller J. Active properties of neocortical pyramidal neuron dendrites. Annu Rev Neurosci. 2013;36:1–24. doi: 10.1146/annurev-neuro-062111-150343. [DOI] [PubMed] [Google Scholar]
- McCormick DA, Bal T. Sleep and arousal: thalamocortical mechanisms. Annu Rev Neurosci. 1997;20:185–215. doi: 10.1146/annurev.neuro.20.1.185. [DOI] [PubMed] [Google Scholar]
- McCormick DA, Pape HC. Properties of a hyperpolarisation-activated cation current and its role in rhythmic oscillation in thalamic relay neurons. J Physiol. 1990;431:291–318. doi: 10.1113/jphysiol.1990.sp018331. [DOI] [PMC free article] [PubMed] [Google Scholar]
- McCormick DA, von Krosigk M. Corticothalamic activation modulates thalamic firing through glutamate “metabotropic” receptors. Proc Natl Acad Sci U S A. 1992;89:2774–2778. doi: 10.1073/pnas.89.7.2774. [DOI] [PMC free article] [PubMed] [Google Scholar]
- Milojkovic BA, Radojicic MS, Goldman-Rakic PS, Antic SD. Burst generation in rat pyramidal neurons by regenerative potentials elicited in restricted part of the basilar dendritic tree. J Physiol. 2004;558:193–211. doi: 10.1113/jphysiol.2004.061416. [DOI] [PMC free article] [PubMed] [Google Scholar]
- Milojkovic BA, Radojicic MS, Antic SD. A strict correlation between dendritic and somatic plateau depolarizations in the rat prefrontal cortex pyramidal neurons. J Neurosci. 2005;25:3940–3951. doi: 10.1523/JNEUROSCI.5314-04.2005. [DOI] [PMC free article] [PubMed] [Google Scholar]
- Murphy PC, Sillito AM. Functional morphology of the feedback pathway from area 17 of the cat visual cortex to the lateral geniculate nucleus. J Neurosci. 1996;16:1180–1192. doi: 10.1523/JNEUROSCI.16-03-01180.1996. [DOI] [PMC free article] [PubMed] [Google Scholar]
- Murphy PC, Duckett SG, Sillito AM. Comparison of the laminar distribution of input from Areas 17 and 18 of the visual cortex to the lateral geniculate nucleus of the cat. J Neurosci. 2000;20:845–853. doi: 10.1523/JNEUROSCI.20-02-00845.2000. [DOI] [PMC free article] [PubMed] [Google Scholar]
- Nevian T, Larkum ME, Polsky A, Schiller J. Properties of basal dendrites of layer 5 pyramidal neurons: a direct patch-clamp recording study. Nat Neurosci. 2007;10:206–214. doi: 10.1038/nn1826. [DOI] [PubMed] [Google Scholar]
- Ohara PT, Havton LA. Dendritic architecture of rat somatosensory thalamocortical projection neurons. J Comp Neurol. 1994;341:159–171. doi: 10.1002/cne.903410203. [DOI] [PubMed] [Google Scholar]
- Ohara PT, Ralston HJ, 3rd, Havton LA. Architecture of individual dendrites from intracellularly labeled thalamocortical projection neurons in the ventral posterolateral and ventral posteromedial nuclei of cat. J Comp Neurol. 1995;358:563–572. doi: 10.1002/cne.903580409. [DOI] [PubMed] [Google Scholar]
- Palmer LM, Shai AS, Reeve JE, Anderson HL, Paulsen O, Larkum ME. NMDA spikes enhance action potential generation during sensory input. Nat Neurosci. 2014;17:383–390. doi: 10.1038/nn.3646. [DOI] [PubMed] [Google Scholar]
- Pape HC, Munsch T, Budde T. Novel vista of calcium-mediated signaling in the thalamus. Pflügers Arch. 2004;448:131–138. doi: 10.1007/s00424-003-1234-5. [DOI] [PubMed] [Google Scholar]
- Polsky A, Mel B, Schiller J. Encoding and decoding bursts by NMDA spikes in basal dendrites of layer 5 pyramidal neurons. J Neurosci. 2009;29:11891–11903. doi: 10.1523/JNEUROSCI.5250-08.2009. [DOI] [PMC free article] [PubMed] [Google Scholar]
- Rockland KS, Knutson T. Feedback connections from area MT of the squirrel monkey to areas V1 and V2. J Comp Neurol. 2000;425:345–368. doi: 10.1002/1096-9861(20000925)425:3<345::AID-CNE2>3.3.CO;2-F. [DOI] [PubMed] [Google Scholar]
- Schiller J, Schiller Y. NMDA receptor-mediated dendritic spikes and coincident signal amplification. Curr Opin Neurobiol. 2001;11:343–348. doi: 10.1016/S0959-4388(00)00217-8. [DOI] [PubMed] [Google Scholar]
- Schiller J, Major G, Koester HJ, Schiller Y. NMDA spikes in basal dendrites of cortical pyramidal neurons. Nature. 2000;404:285–289. doi: 10.1038/35005094. [DOI] [PubMed] [Google Scholar]
- Sherman SM, Guillery RW. Exploring the thalamus and its role in the cortical function. Ed 2. Cambridge, MA: MIT; 2006. Cable properties of relay cells; pp. 140–143. [Google Scholar]
- Sillito AM, Cudeiro J, Jones HE. Always returning: feedback and sensory processing in visual cortex and thalamus. Trends Neurosci. 2006;29:307–316. doi: 10.1016/j.tins.2006.05.001. [DOI] [PubMed] [Google Scholar]
- Tsumoto T, Suda K. Three groups of cortico-geniculate neurons and their distribution in binocular and monocular segments of cat striate cortex. J Comp Neurol. 1980;193:223–236. doi: 10.1002/cne.901930115. [DOI] [PubMed] [Google Scholar]
- Turner JP, Salt TE. Characterization of sensory and corticothalamic excitatory inputs to rat thalamocortical neurones in vitro. J Physiol. 1998;510:829–843. doi: 10.1111/j.1469-7793.1998.829bj.x. [DOI] [PMC free article] [PubMed] [Google Scholar]
- Van Horn SC, Eri[ceduk]sir A, Sherman SM. Relative distribution of synapses in the A-laminae of the lateral geniculate nucleus of the cat. J Comp Neurol. 2000;416:509–520. doi: 10.1002/(SICI)1096-9861(20000124)416:4<509::AID-CNE7>3.0.CO;2-H. [DOI] [PubMed] [Google Scholar]
- Wei DS, Mei YA, Bagal A, Kao JP, Thompson SM, Tang CM. Compartmentalized and binary behavior of terminal dendrites in hippocampal pyramidal neurons. Science. 2001;293:2272–2275. doi: 10.1126/science.1061198. [DOI] [PubMed] [Google Scholar]
- Wilson JR, Friedlander MJ, Sherman SM. Fine structural morphology of identified X- and Y-cells in the cat's lateral geniculate nucleus. Proc R Soc Lond B Biol Sci. 1984;221:411–436. doi: 10.1098/rspb.1984.0042. [DOI] [PubMed] [Google Scholar]
- Zhu J, Heggelund P. Muscarinic regulation of dendritic and axonal outputs of rat thalamic interneurons: a new cellular mechanism for uncoupling distal dendrites. J Neurosci. 2001;21:1148–1159. doi: 10.1523/JNEUROSCI.21-04-01148.2001. [DOI] [PMC free article] [PubMed] [Google Scholar]
- Zhu JJ, Lo FS. Three GABA receptor-mediated postsynaptic potentials in interneurons in the rat lateral geniculate nucleus. J Neurosci. 1999;19:5721–5730. doi: 10.1523/JNEUROSCI.19-14-05721.1999. [DOI] [PMC free article] [PubMed] [Google Scholar]


