

Abstract
Self-generated neuronal activity originating from subcortical regions drives early spontaneous motor activity, which is a hallmark of the developing sensorimotor system. However, the neural activity patterns and role of primary motor cortex (M1) in these early movements are still unknown. Combining voltage-sensitive dye imaging (VSDI) with simultaneous extracellular multielectrode recordings in postnatal day 3 (P3)–P5 rat primary somatosensory cortex (S1) and M1 in vivo, we observed that tactile forepaw stimulation induced spindle bursts in S1 and gamma and spindle bursts in M1. Approximately 40% of the spontaneous gamma and spindle bursts in M1 were driven by early motor activity, whereas 23.7% of the M1 bursts triggered forepaw movements. Approximately 35% of the M1 bursts were uncorrelated to movements and these bursts had significantly fewer spikes and shorter burst duration. Focal electrical stimulation of layer V neurons in M1 mimicking physiologically relevant 40 Hz gamma or 10 Hz spindle burst activity reliably elicited forepaw movements. We conclude that M1 is already involved in somatosensory information processing during early development. M1 is mainly activated by tactile stimuli triggered by preceding spontaneous movements, which reach M1 via S1. Only a fraction of M1 activity transients trigger motor responses directly. We suggest that both spontaneously occurring and sensory-evoked gamma and spindle bursts in M1 contribute to the maturation of corticospinal and sensorimotor networks required for the refinement of sensorimotor coordination.
Keywords: development, in vivo, motor, neocortex, rat, somatosensory
Introduction
The primary motor cortex (M1) is a central element in the planning, control, and execution of voluntary movements (for review, see Roland and Zilles, 1996; Sanes and Truccolo, 2003). A variety of studies demonstrated that M1 also responds directly to tactile and proprioceptive stimuli (Lemon, 1981; Fromm et al., 1984; Farkas et al., 1999). In the M1 forepaw representation of adult rats, the tactile sensory inputs converge on motor neurons (Chapin and Woodward, 1986), indicating the close interaction of sensory and motor functions even on the basis of single neurons. Such a strong somatosensory input to M1 is considered to be required for coordinated movements (Hikosaka et al., 1985; Xerri et al., 1996; Hiraba et al., 2000; Faraji et al., 2013), motor learning (Ridding et al., 2000; Luft et al., 2002), and sensory processing during active movements (Ferezou et al., 2007; Petreanu et al., 2012; Zagha et al., 2013).
Early motor activity has been observed in humans before birth (de Vries et al., 1982; Cioni and Prechtl, 1990) and in rodents during early postnatal development (Gramsbergen et al., 1970; Clarac et al., 2004). Neuronal activity in different subcortical regions, such as the spinal cord or brainstem (Clarac et al., 2004; Blumberg, 2010; Tiriac et al., 2012), trigger these early motor behaviors, although recent studies provide evidence that, in preterm human babies, activity in the motor cortex contribute to limb movements (Kanazawa et al., 2014). In turn, these spontaneous movements elicit a sensory stimulus that evokes typical activity patterns in the primary somatosensory cortex (S1) of immature rodents and humans (Khazipov et al., 2004; Milh et al., 2007). Such neuronal activity may generate the correlated activity patterns essential for the development of adequate afferent connections to sensory neocortical areas (Penn and Shatz, 1999; Khazipov and Luhmann, 2006), for the development of functional topography in the somatosensory cortex (Minlebaev et al., 2011; Yang et al., 2013), and for proper connectivity of corticospinal efferences (Martin, 2005). Although the development of somatosensory maps during early development (Yang et al., 2013) and the functional implications of evoked and spontaneous activity patterns on the development of S1 have been addressed in the past by a number of studies (for review, see Kilb et al., 2011), the role of M1 during early developmental stages is unknown.
To address the question of whether already in the neonatal cerebral cortex sensory stimulation elicits a response in M1 and to understand the functional properties and underlying mechanisms of these responses, we performed voltage-sensitive dye imaging (VSDI) in combination with multichannel extracellular electrophysiological recordings in both S1 and M1 of postnatal day 3 (P3)–P5 rats in vivo and simultaneously recorded movements of the paws. Our study demonstrates that gamma and spindle bursts enable immature M1 to operate as both sensory and motor stations, which may play crucial roles in the early maturation of sensorimotor and corticospinal networks.
Materials and Methods
Animals and surgical preparation.
All experiments were performed on neonatal Wistar rats of either sex at the age of P3–P5 consistent with the national laws for the use of animals in research and approved by the local ethical committee (#23177-07/G10-1-010). Surgical preparation was similar to that described previously (An et al., 2012; Yang et al., 2013). Briefly, anesthesia was induced by initial hypothermia and intraperitoneal urethane injection (0.2 g/kg; Sigma-Aldrich). The head of the pup was fixed into the stereotaxic apparatus. A 3 × 3 mm2 craniotomy was made over the left hemisphere by removing the skull and leaving the dura mater intact (see Fig. 1A). The craniotomy included the forepaw representations in S1 and M1 cortex. During recordings, the body was kept at a constant temperature of 37°C by a heating blanket and cotton.
Figure 1.
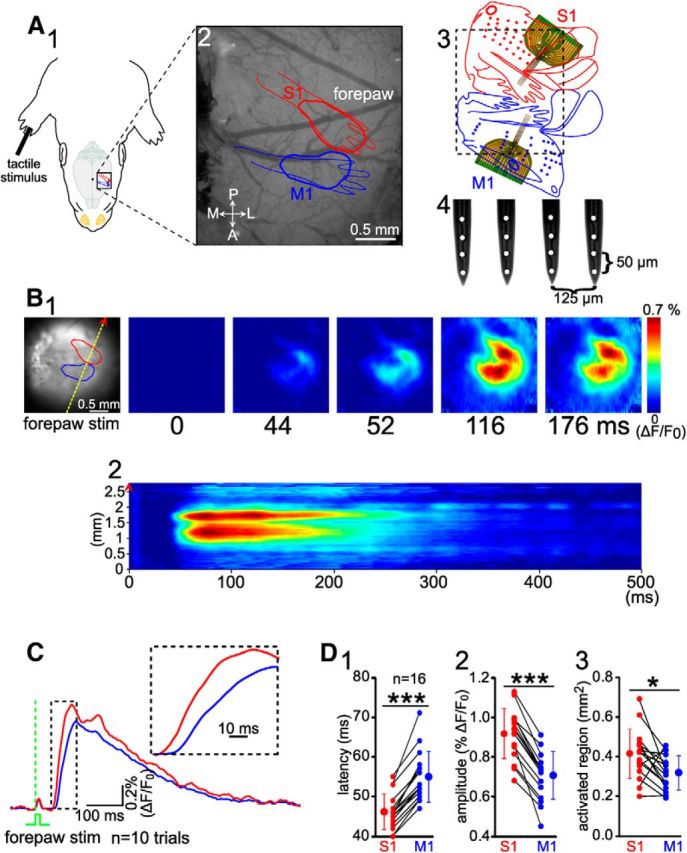
A single mechanical stimulus of the forepaw induces in the newborn rat a VSDI response in both S1 and M1. A, Schematic diagram of the experimental setup illustrating selective mechanical stimulation of the forepaw (A1) and simultaneous VSDI recordings in S1 and M1 (A2). The exposed cortex includes the forepaw representation in S1 (red) and M1 (blue) as identified by the VSDI response after mechanical stimulation of the forepaw in a P5 rat. The red and blue diagrams are superimposed on the cortex based on previously published data (Brecht et al., 2004a; Brecht et al., 2004b). A, Anterior; L, lateral; P, posterior; M, medial. A3, Flattened maps of S1 and M1 cortex (Brecht et al., 2004b; modified from Brecht et al., 2004a). Schematic illustration marked by dashed black square indicates the same cortical region as shown in A2. Two 4-shank/16-channel electrodes were inserted into the area of VSDI evoked responses in S1 (red) and M1 (blue), respectively. A4, Schematic illustration of a 4-shank/16-channel Michigan electrode array. B1, Left, Same cortex as in A2 stained with the voltage-sensitive dye RH1691. Shown are VSDI responses in S1 and M1 from 0 to 176 ms poststimulation of the right forepaw. B2, Line scan of the VSDI response along the yellow dashed line (indicated on the left image of B1) from 0 to 500 ms after stimulation from the same recording as B1. Note two clear separate responses in S1 and M1. C, Average of 10 VSDI responses in S1 (red trace) and M1 (blue trace) to single forepaw stimulation. Green dashed line indicates the time point of mechanical stimulation. Same experiment as in B. Inset shows a representative response at an expanded time scale. Note that VSDI response appears first in S1 and several milliseconds later in M1. D, Statistical analyses of onset latency (D1) and maximal amplitude (D2) of forepaw evoked VSDI responses and size of activated regions (D3) obtained in 16 P3–P5 rats. Note that sensory-evoked responses in M1 have a larger latency and smaller amplitude than responses in S1. The averaged data (bigger symbols) are expressed as mean ± SD. Small symbols connected by black lines represent individual animals. Significant differences between S1 and M1 were tested with Mann–Whitney–Wilcoxon test. ***p < 0.001; *p < 0.05.
Forepaw sensory stimulation and movement detection.
The forepaw was stimulated ∼1 mm proximal to the dorsal aspect of a toe using a miniature solenoid actuator (modified from Krupa et al., 2001) that generated for 30 ms orthogonal touch to the skin. The interstimulus interval was 1 min. Movements of the forepaw were recorded using a piezoelectric transducer attached to them.
VSDI.
The forepaw representations in S1 and M1 were identified by VSDI as described previously for the whisker system (Yang et al., 2013). The voltage-sensitive dye RH1691 (Optical Imaging) was dissolved in Ringer's solution containing the following (in mm): 125 NaCl, 2.5 KCl, and 10 HEPES, pH 7.3 with NaOH, and was applied topically to the exposed cortical surface for 20 min. Excitation light from a red LED (MRLED 625 nm; Thorlabs) was band-pass filtered (630/30 nm), reflected toward the sample by a 650 nm dichroic mirror, and focused by a 25 mm Navitar video lens (Stemmer Imaging). Emitted fluorescence was collected via the same optical pathway, long0pass filtered (660 nm), and focused via another 25 mm Navitar lens and a C-mount extension tube onto the chip of a MiCam Ultima L high speed camera (Scimedia). Every pixel of this camera collected light from a cortical region of 26 × 26 μm2. Signals were recorded at a rate of 500 frames/s.
To analyze sensory-evoked VSDI signals, 10 trials of forepaw stimulations were averaged, subsequently binned with 5 × 5 pixel width, and low-pass filtered at 60 Hz. Bleaching of the fluorescence signal was corrected by subtraction of a best-fit fifth-degree polynomial using the curve-fitting tool in MATLAB (The MathWorks). The normalized change of fluorescence intensity (ΔF/F0) was calculated as the change of fluorescence intensity (ΔF) in each pixel divided by the initial fluorescence intensity (F0) from the same pixel.
Fluorescence changes of >0.3% were considered as evoked responses. The onset time of the cortical response was defined as the time point when the averaged VSDI signal was 5× higher than the baseline SD. The spatial representation of the VSDI responses was defined at half-maximal ΔF/F0 amplitude. The size of the evoked response was calculated according to the area of the spatial representation with reference to the half-maximal ΔF/F0 amplitude. Maximal amplitudes were defined as the maximal ΔF/F0.
Multielectrode recordings.
Local field potentials (FPs) and multiple-unit activity (MUA) were recorded with 2 4-shank/16-channel or 1 8-shank/128-channel Michigan electrodes (1–2 MΩ; NeuroNexus Technologies) as described previously (Yang et al., 2013). Recording sites were separated by 125 μm in the horizontal direction and 50 μm in the vertical direction in the 4-shank/16-channel electrode (see Fig. 1A4). In the 8-shank/128-channel electrode, recording sites were separated by 200 μm in the horizontal direction and 75 μm in the vertical direction (see Fig. 4). A silver wire was placed on the surface of the cerebellum as ground electrode. The recording electrodes in S1 and M1 were positioned perpendicular to the cortical layers. At least one shank of each electrode was inserted into the center of the forepaw representations in M1 and/or S1 as identified by VSDI (see Fig. 1A,B). FPs and MUA were recorded for at least 2 h at a sampling rate of 20 kHz using a multichannel extracellular amplifier and MC_RACK software (Multi Channel Systems). If not stated otherwise, the FP and MUA were analyzed from the electrode located in layer II/III of S1 and M1.
Figure 4.
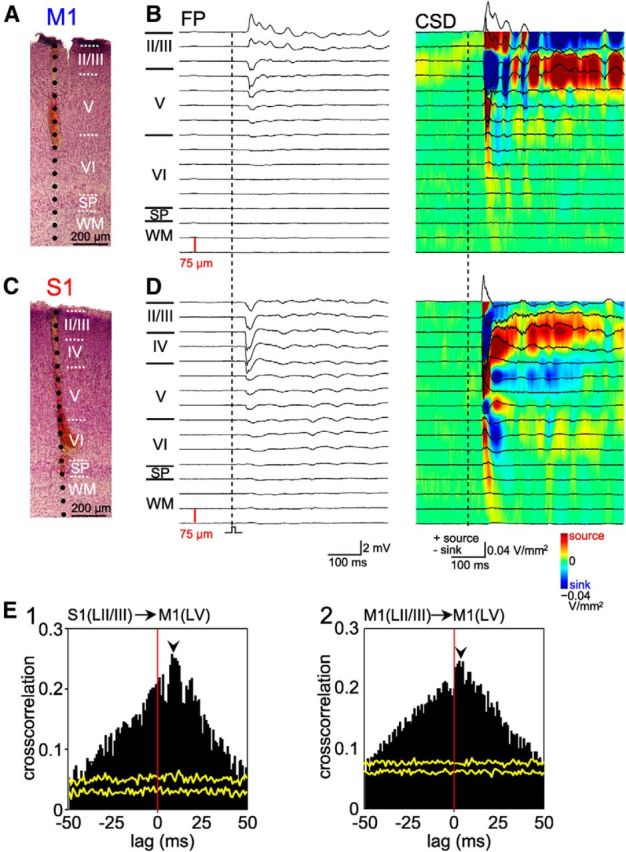
Representative FP response depth profile with corresponding CSD and cross-correlation analyses in a P5 rat. A, Digital photomontage reconstructing the location of the electrode (one shank of 8 × 128-channel Michigan electrode array) in coronal Nissl-stained M1 section. WM, White matter; SP, subplate. B, Depth profiles of FP responses in M1 after a single mechanical stimulus of the forepaw and corresponding CSD analyses (right). Note the appearance of current sources in superficial layers during early response. C, Digital photomontage reconstructing the location of the electrode in coronal Nissl-stained S1 section. D, Evoked FP responses in S1 and corresponding CSD. Note the appearance of current sinks in layer IV and Vb during initial responses. E1, In the early component, MUA in S1 layer II/III precedes MUA in M1 layer V (indicated by black arrowhead). E2, In the early component, MUA in M1 layer II/III precedes MUA in layer V (indicated by black arrowhead). Yellow traces indicate results of the shuffled dataset.
Analysis of multielectrode recordings.
As described previously (Yang et al., 2013), the FP signals from each channel were analyzed using unfiltered data. MUA was detected using 200 Hz high-pass-filtered signals with a threshold at 5× the baseline SD and a bin of 1 ms. The prestimulus or poststimulus time histograms (PSTH) were calculated from all trials using a 1 ms bin and were normalized to the number of spikes per second per trial.
Gamma bursts were identified by the following criteria. We only considered events with at least three periods in the FP and an average duration of each period of <40 ms, corresponding to an average frequency of >25 Hz. Furthermore, the time–frequency spectrogram and the wavelet of Fourier transform of the FP showed a dominant frequency between 25 and 80 Hz. For spindle bursts, we also considered the events with at least three periods in the FP and an average duration of each period of ∼100 ms. In addition, the dominant frequency of the time–frequency spectrogram and the wavelet of Fourier transform of FP is ∼10 Hz.
The time–frequency spectrogram, power spectra, and coherence were analyzed using unfiltered raw data. The Chronux toolbox (www.chronux.org) was used for spectrum and coherence analyses. MATLAB spectrogram function with a time window of 100 ms and an overlapping of 99 ms (MATLAB 7.7; The MathWorks) was used for the time–frequency spectrogram analyses. The jackknife method provided in the Chronux toolbox was used to calculate 95% confidence intervals. Both spectrum and coherence analyses were performed using a time–bandwidth product of 1 with a taper of 1 and the padding factor for the fast Fourier transformation was 2.
Analysis of the latencies between forepaw movements and activity in M1.
Onset times of forepaw movements and M1 activities were detected by visual inspection. The latency distributions between movements and activity in M1 were analyzed within a time frame of ±200 ms upon movement initiation and were tested in a shuffled dataset. The shuffled dataset consisted of 20 shuffled traces in which the M1 activity onset was moved using a Gaussian distribution with μ = 0 and σ = mean interevent interval.
Local blockade of M1.
A pharmacological inactivation of the forepaw representation in M1 was performed by local application of lidocaine via a glass pipette (tip diameter of 30–40 μm) filled with lidocaine hydrochloride monohydrate (1% in Ringer's solution; Sigma-Aldrich) and attached to a syringe. The tip of the glass pipette was positioned on the M1 surface close to the multichannel recording electrode. After a 30 min baseline recording, 2–4 μl of lidocaine was applied. Blockade of M1 lasted for ∼30 min.
Intracortical microstimulation in M1.
After identification of the forepaw representation in M1 by VSDI, we inserted 1 4-shank/16-channel Michigan electrode perpendicular to the cortical layers with at least 1 shank into the center of the M1 representation. On this 4-shank stimulation array, the electrodes were separated by 200 μm in both the horizontal and vertical directions. Electrodes were labeled with DiI (1,1′-dioctadecyl-3,3,3′,3′-tetramethyl indocarbocyanine; Invitrogen) for subsequent histological reconstruction of the electrode tracks in Nissl-stained coronal sections through M1 (see Figs. 4A,C, 6A2). After current source density (CSD) analysis of forepaw sensory-evoked responses, two channels located in layer V at a depth of 700–800 μm were selected for bipolar electrical stimulation. A single pulse (150 μA, 100 μs) and 10 biphasic current pulses at 10 or 40 Hz were delivered separately through the two channels by a modified MEA1060-Inv-BC preamplifier (Multi Channel Systems) and a stimulus generator (STG 2004; Multi Channel Systems).
Figure 6.
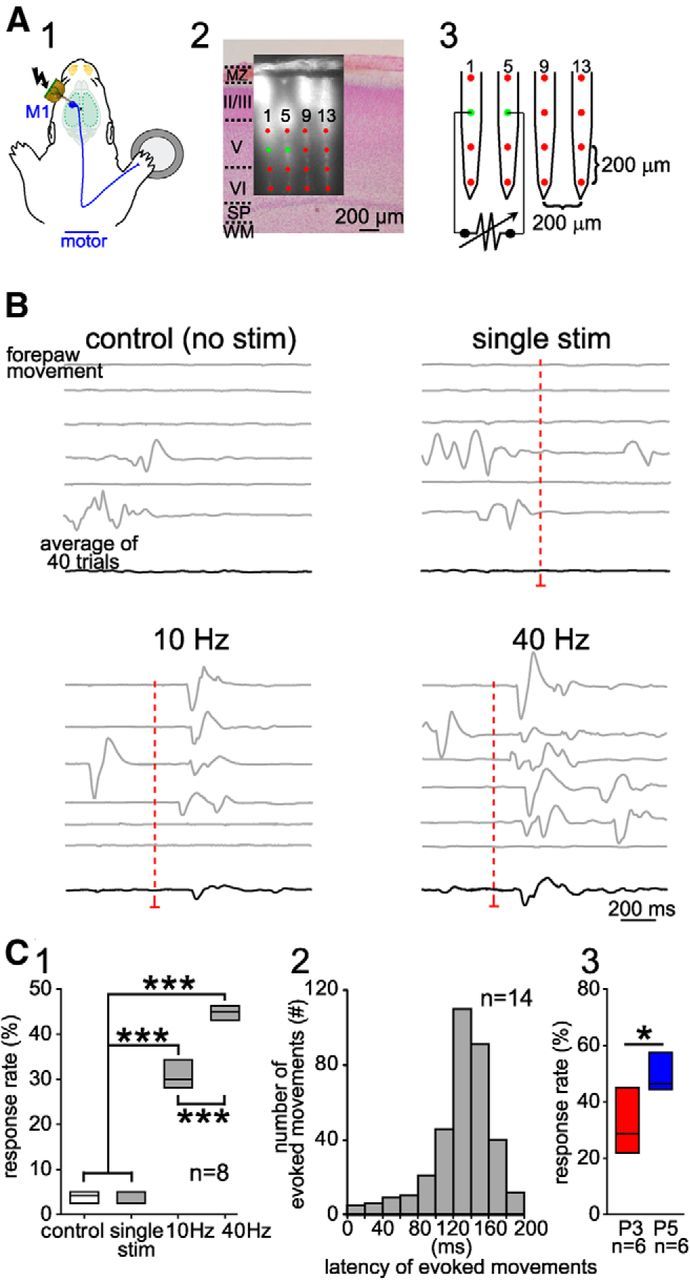
Microstimulation of layer V in M1 evokes movements in newborn rats. A1, Schematic diagram of the experimental setup illustrating local stimulation of the forepaw representation in M1 using a Michigan electrode. A2, Digital photomontage reconstructing the location of the DiI-covered electrode in coronal Nissl-stained section from a P5 rat. MZ, Marginal zone; WM, white matter; SP, subplate. A3, Schematic illustration of the 4-shank/16-channel Michigan electrode array with interelectrode distance of 200 μm. Points indicate the 16 channels as in A2. Bipolar electrical stimulation of layer V was applied between channel 2 and 6 (green dots). B, Spontaneous and stimulus-evoked forepaw movements in newborn rat. A single biphasic current pulse (150 μA, 100 μs duration) did not elicit a response. Stimulation with 10 or 40 Hz (10 pulses) evoked a forepaw movement. Red dashed lines indicate the time point of stimulation. Gray traces are single trials and the lower black ones are averaged traces of 40 trials. C1, Box plots of response rate to different stimulations recorded in eight P3–P5 rats. Note that the highest response rate was observed with 40 Hz burst stimulation. C2, Bar diagram illustrating the response rate at different latencies using a 40 Hz stimulation (n = 325 responses in eight P3–P5 rats). Significant differences among different parameters, stimulations, and control conditions were tested with one-way ANOVA, followed by multiple-comparisons with Bonferroni's correction. C3, Box plots of response rate to a 40 Hz stimulation recorded in six P3 and six P5 rats. Significant differences between P3 and P5 were tested with the Mann–Whitney–Wilcoxon test. ***p < 0.001; *p < 0.05.
Local blockade of the forepaw.
Local inactivation of neuronal activity in the forepaw was achieved by application of 40 μl of lidocaine hydrochloride monohydrate (3% in saline; Sigma-Aldrich) into the forepaw (see Fig. 9). Blockade of the forepaw lasted for ∼1 h.
Figure 9.
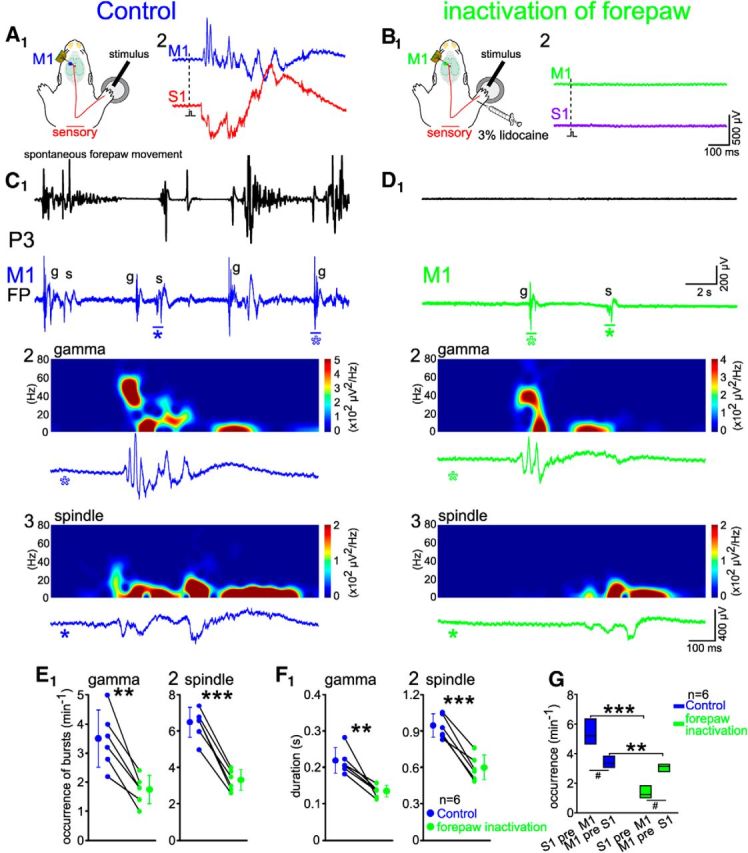
Effect of blocking peripheral sensory input on spontaneous activity in M1. A1, Schematic illustration of the experimental setup with mechanical stimulation of the controlateral forepaw. A2, Gamma and spindle bursts could be induced in M1 and S1 of a P3 rat under control conditions. B, Same experiment as in A, but 20 min after 3% lidocaine injection in the forepaw. C, D, Twenty-second-long recordings in the M1 forepaw representation before (C1, blue) and 20 min after (D1, green) lidocaine injection. C2, C3, D2, D3, Examples of gamma bursts (C2, D2) and spindle bursts (C3, D3) displayed at an expanded time scale and marked by asterisks in C1 and D1. Note decrease in the occurrence and duration of gamma (g) and spindle bursts (s) in M1 after inactivation of the forepaw. E, F, Forepaw inactivation reduced the occurrence (E) and duration (F) of spindle and gamma bursts in M1 of six P3–P5 rats. Significant differences were tested with paired t test from six P3–P5 rats. G, Forepaw inactivation changed the relationship between spontaneous activity in M1 and S1 in the S1-preceding M1 activities (S1 pre M1) and M1-preceding S1 activities (M1 pre S1) patterns. Significant differences between before and after forepaw inactivation were tested with paired t test. Significant differences between S1 pre M1 and M1 pre S1 were tested with the Mann–Whitney–Wilcoxon test. ***p < 0.001, *p < 0.01 by paired t test; #p < 0.05 by Mann–Whitney–Wilcoxon test.
CSD analyses.
CSD profiles were calculated from the FP profiles according to methods described previously (Freeman and Nicholson, 1975). To obtain the same number of CSD profiles and LFP signals, we first duplicated the uppermost and lowermost channels in each shank. Then, the LFPs were smoothed to reduce high spatial-frequency noise as follows:
 |
where ϕ(r) is the LFP at depth r, and h is the sampling interval (75 μm) (Sakata and Harris, 2009). Next, the second derivative was computed as follows:
 |
Data were interpolated and plotted as pseudocolor images, with current sources and sinks represented by red (positive) and blue (negative) colors, respectively.
Statistical tests.
Data are presented as mean ± SD. A paired t test was used for comparing subsequent measurements in the same group of animals. One-way ANOVA was applied for comparing more than two different groups, followed by multiple comparisons with Bonferroni's correction using SPSS software version 13.0. A Mann–Whitney–Wilcoxon test was performed with the datasets recordings at two sites in the same animal using Prism software (GraphPad).
Results
VSDI and extracellular multielectrode recordings of sensory processing in the immature rat sensorimotor cortex
The forepaw representations in S1 and M1 were identified in newborn (P3–P5) rats in vivo by VSDI after single mechanical stimulation of the forepaw (Fig. 1). In all animals (n = 16), stimulation of the forepaw evoked a reliable and local response in contralateral S1, with a latency of 46.2 ± 4.4 ms, an amplitude of 0.91 ± 0.12% ΔF/F0, and an activated region of 0.42 ± 0.13 mm2 (Fig. 1C,D). In addition, a local response in contralateral M1 could be observed 8.7 ± 3.1 ms after this initial response in S1 (Fig. 1C). The evoked responses in M1 had a significantly (p < 0.001) longer onset latency of 54.9 ± 6.3 ms (Fig. 1D1), significantly (p < 0.001) smaller amplitude of 0.71 ± 0.12% ΔF/F0 (Fig. 1D2) and a significantly (p < 0.05) smaller activated region of 0.32 ± 0.09 mm2 (Fig. 1D3) than the responses in S1. The initial origins of the VSDI responses in S1 and M1 were spatially separated and the activity spread radially from these sites (Fig. 1B), indicating that both areas were directly activated and excluding that VSDI signals in M1 represent unspecific lateral spread of evoked activity. Our results demonstrate that sensory stimulation reliably induces two spatially distinct local responses in S1 and M1 in newborn animals, comparable to previous results obtained in adult rodents (Brown et al., 2009; Ghosh et al., 2010).
VSDI has limited temporal resolution and does not allow recordings of high-frequency activity patterns (Berger et al., 2007; Ferezou et al., 2007; Mcvea et al., 2012; Yang et al., 2013). Therefore, we inserted one Michigan electrode into the forepaw representation of cortical S1 and another electrode into the forepaw representation of M1 as identified by preceding identification of these areas with VSDI (Fig. 1A). A single mechanical stimulus of the forepaw elicited FP responses in contralateral S1 and M1 (Fig. 2A). In S1, FP responses occurred at a latency of 43.6 ± 4.7 ms (n = 12), whereas in contralateral M1, FP responses with a significantly longer latency of 52.1 ± 3.3 ms were recorded (Fig. 2B1). Compared with the responses recorded in S1, the activity in M1 had a significantly (p < 0.001) smaller amplitude (1.92 ± 0.73 mV vs 2.76 ± 1 mV, n = 12; Fig. 2B2) and shorter duration (1.03 ± 0.55 s vs 1.39 ± 0.58 s, n = 12; Fig. 2B3). These results demonstrate that the sensory-evoked responses in S1 precede the responses in M1.
Figure 2.

Sensory-evoked response in S1 and M1 by mechanical forepaw stimulation. A1, Forepaw stimulation evoked spindle bursts in contralateral S1 (red) and gamma/spindle bursts in contralateral M1 of a P4 rat. The wavelet analyses above the FP traces are calculated from the unfiltered raw data. The FPs are from unfiltered raw data and MUA traces are high-pass filtered (>200 Hz). Green dashed line indicates the time point of mechanical stimulation. A2, Initial response in S1 and M1 as marked in A1 by dashed box. B, Statistical analyses of the onset latency (B1), maximal amplitude (B2), and duration (B3) of forepaw evoked FPs obtained from 12 P3–P5 rats. Note that sensory-evoked responses in M1 have a longer latency, smaller amplitude, and shorter duration than responses in S1. The averaged data (larger symbols) are expressed as mean ± SD. Small symbols connected by black lines represent individual animals. Significant differences between S1 and M1 were tested with Mann–Whitney–Wilcoxon test. ***p < 0.001.
The FP and MUA responses to single stimulation of the forepaw consisted of an early and late component in both S1 and M1 (Fig. 3A), as described previously for sensory responses in the visual cortex (Colonnese et al., 2010) and barrel cortex (Yang et al., 2013) of newborn rodents. The onset of evoked MUA in S1 preceded the MUA in M1 by ∼8 ms (see PSTH in Fig. 3A), which is also visible as a peak in the cross-correlogram between S1 and M1 (Fig. 3B3), in agreement with our previous observations. In the early component, the autocorrelation of MUA recorded in M1 showed a peak at ∼25 ms (∼40 Hz), which was absent in S1 (Fig. 3B2). In the late component, the auto-correlation and cross-correlation of MUA in both S1 and M1 showed a broad peak at ∼100 ms, revealing spindle burst activity at ∼10 Hz (Fig. 3B4–B6). These results were substantiated by power spectra of FP and MUA responses (187 evoked events in seven animals), which also showed for the early component a peak at ∼10 Hz for S1 (Fig. 3C1,C2) and a peak at ∼40 Hz for M1 (Fig. 3D1,D2). For this component, the coherence between FP and MUA was for M1 maximal ∼40 Hz (Fig. 3D3), whereas no obvious coherence peak was observed for S1 (Fig. 3C3). For the late component, the peaks in the power spectra of FP and MUA responses and the coherence between both signals was highest at ∼10 Hz in both S1 (Fig. 3C4–C6) and M1 (Fig. 3D4–D6). These data demonstrate that the early phase of sensory-evoked activity in S1 is lacking an oscillatory component, whereas the early phase in M1 consisted of gamma oscillations. Additional recordings with 8-shank/128-channel electrodes, performed to improve the spatial resolution, revealed for gamma bursts in M1 (n = 6) a clear current sink in lower layer II/III with extension into upper layer V (Fig. 4A,B). In contrast, in S1 (n = 6), the CSD profile was characterized by a prominent current sink in layer IV that extended into the lower part of layer II/III (Fig. 4B,C). Moreover, another localized sink could be observed in the lower part of layer V. The late phases of sensory-evoked responses in both regions represent spindle bursts, which showed a comparable CSD profile in S1 and M1. Consistent with the sink in layer V, MUA activity was observed in layer V of both M1 and S1. Cross-correlograms revealed that MUA in S1 layer II/III preceded MUA in M1 layer V (Fig. 4E1) and MUA in M1 layer II/III preceded MUA in layer V (Fig. 4E2), indicating that layer II/III of S1 and M1 may drive spikes in layer V of M1.
Figure 3.
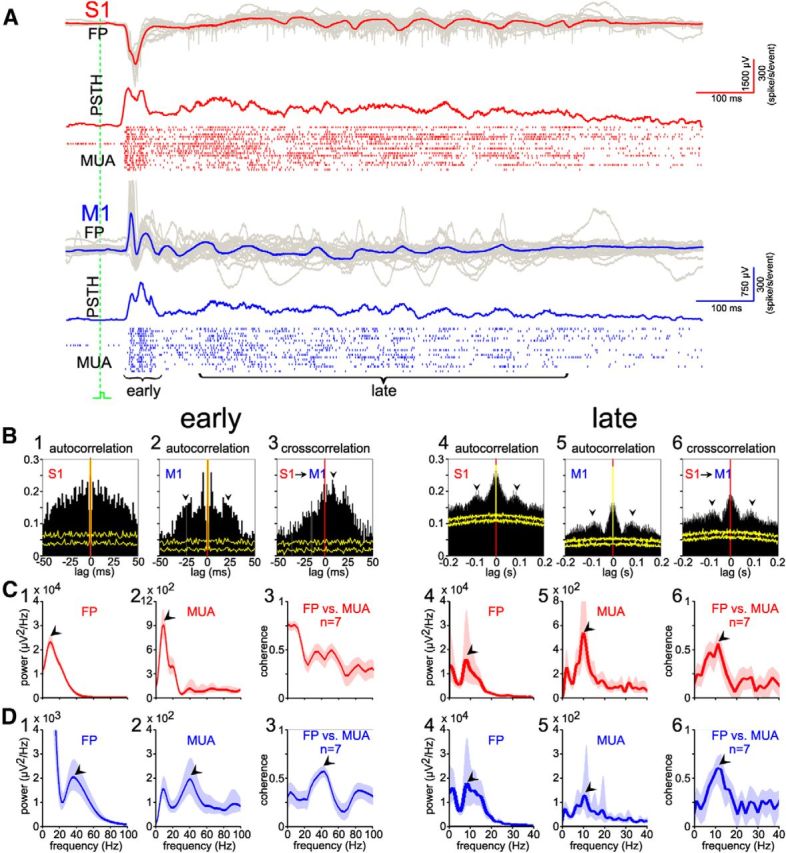
Properties of sensory-evoked gamma and spindle bursts in immature S1 and M1. A, FP recordings (top), multiunit activity (bottom), and corresponding PSTH (middle) in contralateral S1 and M1 upon mechanical forepaw stimulation in a P4 rat. Shown are averaged (red and blue traces) and superimposed 20 single (gray traces) cortical FP responses to forepaw stimulation. Note that gamma bursts are induced in the early component of the M1 responses and spindle bursts are present in the late components of the S1 and M1 responses. B, Auto- and cross-correlation analyses of early (B1–B3) and late (B4–B6) MUA in S1 and M1 from the data marked in A. In the early component, obvious peaks (black arrowheads) occurred in the autocorrelation of M1 MUA at ∼25 ms (B2), but not in S1 MUA (B1), and S1 MUA precedes M1 MUA (black arrowhead) in the cross-correlation (B3). In the late response, peaks (black arrowheads) are evident at ∼100 ms in both autocorrelation (B4–B5) and cross-correlation (B6) of S1 and M1 MUA. Yellow traces indicate results of shuffled dataset. C, Average FP and MUA spectrum analyses of the early (C1–C2) and late (C4–C5) components recorded in S1. Average coherence of FP versus MUA in the early (C3) and late (C6) component of 187 forepaw stimulation evoked responses recorded in seven P3–P5 rats. Red traces show averages; shaded area, 95% confidence interval. Note the ∼10 Hz peaks (black arrowheads) in the spectra of FP, MUA in both early and late evoked responses, and that coherence of FP versus MUA shows a peak only for the late component. D, Similar analyses as in C, but from simultaneous recordings in M1 (blue). Note that spectrum and coherences of FP and MUA show ∼40 Hz peaks (black arrowheads) in the early component (D1–D3) and ∼10 Hz peak (black arrowheads) in the late component (D4–D6) of evoked responses in M1.
Spontaneous gamma and spindle bursts in M1 are well correlated with burst activity in S1
Having demonstrated that forepaw stimulation evoked responses in S1 and M1, we next investigated the relationship between spontaneous activity in S1 and M1. Both S1 and M1 showed ongoing spontaneous activity transients (Fig. 5A), which were further classified in their spectral properties. Whereas in S1 only spindle bursts were observed, both gamma and spindle bursts occurred spontaneously in M1 (Fig. 5A–C). The majority of neural activity transients in S1 (66.7%, total n = 1000 events from nine pups) and in M1 (67.4%, total n = 990 events from nine pups) occurred synchronized between both regions within a narrow time window of <100 ms. The minority of events was restricted only to M1 (32.6%) or to S1 (33.3%). Similar to the evoked responses, the FP and MUA spectra and the coherence analysis of FP versus MUA in M1 showed a prominent peak at ∼40 Hz (Fig. 5D1–D3), which was absent in S1 (Fig. 5E1–E3). In addition, the power spectrum and coherence analyses of the spontaneous spindle bursts exhibited a peak at ∼10 Hz in M1 and in S1 (Fig. 5D4–D6, E4–E6). These results suggest that spontaneous gamma and spindle bursts in M1 are, in most cases, temporally correlated with burst activity in S1.
Figure 5.
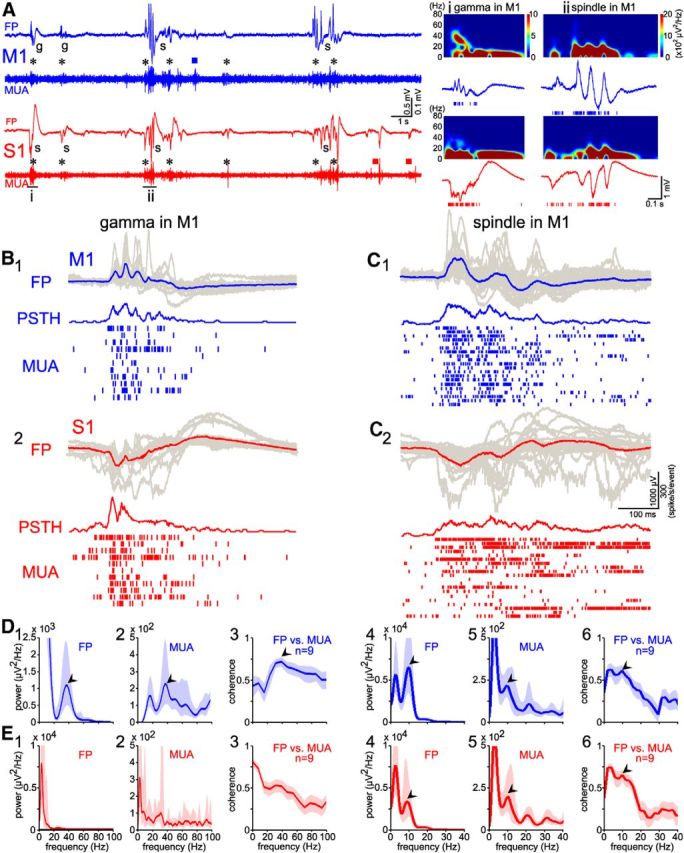
Coupling of spontaneous activity between S1 and M1. A, A 20 s simultaneous recording of spontaneous activity in M1 (blue) and S1 (red) from a P3 rat. Note the high incidence of simultaneously occurring (black asterisks) gamma and spindle bursts in M1 and S1, as well as the presence of a few events restricted to M1 (blue square) or to S1 (red squares). The events marked by i–ii are shown at higher resolution with corresponding spectrograms on the right. B, Summarized FP recordings (top), MUA (bottom), and corresponding PSTH (middle) of spontaneous gamma activity in M1 and corresponding S1 activity from the experiment shown in A. Averaged (blue trace) FP from 11 superimposed single (gray traces) spontaneous gamma bursts in M1 (B1) and simultaneous recording activity in S1 (B2). The recordings from M1 and S1 were aligned to the onset of the M1 FP events. Note gamma bursts in M1 FP and PSTH, but not in S1. C, Same display as in B, showing spontaneous spindle bursts in M1 and corresponding activity in S1. Note spindle bursts in both M1 and S1. D, Average spectrum of FP and MUA analyses of gamma (D1,D2) and spindle bursts (D4,D5) recorded in M1 (blue) from events shown in B1–C1. An averaged coherence analyses of 195 spontaneous gamma (D3) and 253 spindle (D6) bursts (FP events vs MUA) recorded in M1 from nine P3–P5 rats. Blue traces show averages and the shaded area represents the 95% confidence interval. Note ∼40 Hz peak (black arrowheads) in the averaged gamma bursts and the ∼10 Hz peak (black arrowheads) in the averaged spindle burst response. E, Similar analyses as in D, but from simultaneous recording in S1 (red). Note the ∼10 Hz peak (black arrowheads) in the averaged spindle burst response.
Microstimulation of layer V neurons in immature M1 evokes motor activity
Previous anatomical studies in neonatal rats have shown that axonal projections from layer V corticospinal motor neurons extend into the dorsal columns of the lower cervical/upper thoracic spinal cord as early as P2/3 (Schreyer and Jones, 1982; Bates and Killackey, 1984). To address the question of whether this early projection is functional and if the burst activity in M1 is capable to elicit movements, we inserted Michigan electrodes into functionally identified M1 cortex (Fig. 6A) and performed intracortical bipolar microstimulation of layer V neurons (n = 8 pups). Single pulse electrical stimulation (150 μA, 100 μs) and bursts of 10 pulses at 10 Hz or 40 Hz were used for intracortical stimulation and subsequent forepaw movements were monitored (Fig. 6B). Single pulse electrical stimulation of M1 failed to evoke any response (Fig. 6B,C1). However, stimulation at 10 Hz caused a significant (p < 0.001) increase in the response rate to 30.9 ± 3% (n = 8) compared with control conditions (unstimulated) and single pulse stimulation (Fig. 6B,C1). Stimulation at 40 Hz further increased the response rate to 44.9 ± 1.8% (Fig. 6C1). Furthermore, the majority of evoked forepaw movements (88%, total 350 responses from 14 pups) were induced by 40 Hz stimulation at a latency between 80 and 180 ms (Fig. 6C2). To study the functional development of the corticospinal projections (Schreyer and Jones, 1982; Bates and Killackey, 1984), we analyzed the responses to 40 Hz M1 stimulation in P3 and P5 animals separately. These experiments revealed that the response rate at P5 (49.2 ± 6.6%, n = 6) was significantly higher (p < 0.05) than at P3 (31.7 ± 11.1%, n = 6; Fig. 6C3). In contrast, no significant difference in the latency was observed between these two age groups (data not shown). In summary, these results indicate that physiologically relevant 40 Hz gamma and 10 Hz spindle burst stimulations of layer V neurons in M1 can elicit movements in immature rats, demonstrating a functional connection between M1 and forepaw muscles.
Immature M1 operates in both motor and somatosensory mode
To study the relationship between movements and neocortical activity patterns in more detail, we simultaneously recorded cortical activity in S1 and M1 and the movements of the forepaw (Fig. 7A). Using this approach and independent analysis of the onset times of each event, we observed three distinct patterns (Fig. 7B,C) during 10 min recordings of 1708 events in 16 rats.
Figure 7.

Spontaneous activity in S1 and M1 correlates with forepaw movement. A, Schematic illustration of the experimental setup with 2 4-shank/16-channel electrodes as in Figure 1, A3–A4, located in S1 (red), M1 (blue), and a movement detector attached to the contralateral forepaw. Blue line indicates the motor pathway, red line the sensory pathway. B, Relationship between forepaw movements and cortical activity in S1 and M1 in a P4 rat. B1, Gamma burst in M1 (black) elicited forepaw movement and preceded spindle burst in S1 (red). Black dashed line indicates time point of forepaw movement. Top black trace shows forepaw movement. B2, Spontaneous forepaw movement preceded gamma burst in M1 (green) and spindle burst in S1 (red). B3, Spontaneous activity in M1 (blue) and S1 (red) unrelated to forepaw movement. C1, Bar diagram illustrating the occurrence of FP activity, which preceded forepaw movements (blank box), followed forepaw movements (green) and were unrelated to movement (blue) in 16 P3–P5 rats. Red bars represent results from the shuffled dataset. C2, Pie diagram showing the percentages of the three patterns (n = 1708 events from 16 P3–P5 rats during 10 min unstimulated recordings). C3, Cross-correlation of MUA between S1 and M1 from the same rat as in B. Note that S1 MUA precedes M1 MUA (green arrowhead) and M1 MUA precedes S1 MUA (blank arrowhead). Yellow traces represent results from the shuffled dataset. C4, Statistical analysis of the occurrence of the three patterns of activity. Significant differences were tested with one-way ANOVA. ***p < 0.001. D, Box plots of the occurrence of the three patterns of activity between six P5 and 7 P3 rats. Note the absence of significant differences between them.
The latency between onset of M1 activity and forepaw movements showed an obvious bimodal distribution, with peaks either before or after movement initiation (Fig. 7C1). This bimodal distribution could not be observed in time-shuffled datasets and thus did not represent arbitrary correlations between independent events. Based on the experimental results obtained with mechanical forepaw stimulation or microstimulation of M1, we considered only events in which the latency between the onset of M1 activity and forepaw movement was between 80 and 180 ms as “M1 preceed forepaw movements” and only events with a latency between 20 and 100 ms as “movement precedes M1” events.
Approximately one-fourth (23.7%) of the activity transients in M1 preceded forepaw movements and network activity in S1 (Fig. 7C), with both gamma (41.4 ± 0.9 Hz; 26.7%, total n = 405 events) and spindle (9.3 ± 0.6 Hz; 73.3%) bursts in M1-preceding forepaw movements at a latency of 80–180 ms (mean 129.2 ± 23.5 ms; Fig. 7C1). This latency is comparable to the latency evoked by electrical stimulation of layer V neurons (mean 130 ± 8.4 ms; Fig. 6C2). M1 activity preceded spindle bursts in S1 with a delay of 100–200 ms (mean 173.8 ± 21.4 ms), which is also visible as a peak (open arrowhead) in the MUA cross-correlation between S1 and M1 (Fig. 7C3). In contrast, 40.7% of the activity transients in M1 were preceded by forepaw movements. Both gamma (40.5 ± 0.7 Hz; 60.8%, total n = 695 events) and spindle (9.8 ± 0.8 Hz; 39.2%) bursts in M1 were preceded by forepaw movements at a delay between 20 and 100 ms (mean 46.6 ± 15.3 ms; Fig. 7C1) and by spindle bursts in S1 at a delay between 5 and 20 ms (mean 15.3 ± 1.7 ms), which is also visible as a peak (green arrowhead) in the MUA cross-correlogram between S1 and M1 (Fig. 7C3). The occurrence of activity transients in M1-preceding movement (2.5 ± 0.3 min−1) was significantly (p < 0.001) lower than the occurrence of that preceded by forepaw movements (4.3 ± 1.5 min−1) and the occurrence of M1 activity transients not correlated with any movements (3.8 ± 0.9 min−1) (Fig. 7C4). The remaining 35.6% of the cortical activity transients in M1 were not correlated with any paw movement. These unrelated events in M1 uncorrelated to movements consisted of gamma (40.2 ± 3.1 Hz; 50%, total n = 608 events) and spindle (9.8 ± 0.7 Hz; 50%) bursts. Some of these events in M1 were synchronized with activity in S1, whereas other events were restricted to M1. In summary, these results indicate that, for the most part, spontaneous activity in immature M1 does not activate a motor response directly, but that M1 is secondarily activated by spontaneous movements.
We also compared the occurrence of the different patterns between P3 and P5 animals (Fig. 7D), but could not detect any significant difference (p > 0.05) between P3 and P5 in the occurrence of M1 activity preceding forepaw movements (P3, 2.6 ± 0.3 min−1; P5, 2.8 ± 0.4 min−1), preceded by forepaw movements (P3, 4.4 ± 0.9 min−1; P5, 4.9 ± 0.98 min−1), or uncorrelated with forepaw movements (P3, 4.2 ± 0.96 min−1; P5, 3.7 ± 0.8 min−1). This result suggests that the maturation of corticospinal projections cannot account for the three distinct activity patterns.
To further elucidate differences among these three patterns, the average number of spikes in MUA; duration, frequency, peak-to-peak amplitude, and spectral power of FP; and CSD profiles were analyzed for gamma and spindle bursts in layer II/III and layer V (Fig. 8, Tables 1, 2). In layer II/III of M1, both gamma and spindle bursts preceding forepaw movement events had a significantly smaller (p < 0.01 for gamma, p < 0.05 for spindle, respectively) number of spikes in MUA than that of the M1 activity preceded by movement events. Moreover, M1 events uncorrelated to movements had significantly less (p < 0.05) spikes in MUA and a shorter (p < 0.001) duration of gamma and spindle bursts than the other two patterns. The CSD profile from 8-shank/128-channel electrode recordings revealed no obvious difference between these 3 patterns (Fig. 8A–C). Frequency, amplitude, and spectral power of gamma and spindle bursts did not show any significant differences among the three patterns (Tables 1, 2). The most obvious difference between M1 activity preceded by movements and M1 activity uncorrelated to movements was the significantly (p < 0.001) lower number of MUA in layer V (54.7 ± 6.5 and 21.6 ± 4.1 for gamma bursts; 63.3 ± 6.7 and 27.2 ± 3.9 for spindle bursts, respectively; Table 2), suggesting that a sufficiently strong output from M1 is required to initiate a movement. To identify the presynaptic source that drives the spikes in layer V of M1, we analyzed the cross-correlations between layer II/III from S1 or M1 and layer V of M1. For the M1-preceding movement events, the cross-correlograms (Fig. 8D) revealed a substantial fraction of MUA in M1 layer V, which led activity in S1 by 150–250 ms, most probably reflecting M1-induced movements that were sensed and conveyed to S1. Spikes in M1 layer II/III preceded M1 layer V by a few milliseconds, suggesting that M1 layer II/III is upstream to layer V. In contrast, for M1 activity preceded by movements, spikes in layer V of M1 followed activity in layer II/IIII of both S1 and M1 (Fig. 8E), indicating that MUA activity in upper layers of M1 and S1 is triggered by sensory inputs and later conveyed to layer V of M1.
Figure 8.

Depth profiles and CSD analyses of the three spontaneous response patterns in a P5 rat. A, Gamma burst in M1 (black) preceded forepaw movement. Black dashed line indicates onset of forepaw movement. Top black trace shows forepaw movement. B, FP registration and CSD for M1 activity preceded by movement events (green). C, FP registration and CSD for M1 activity uncorrelated to forepaw movement (dark blue). D, Cross-correlograms of M1 MUA activity preceding forepaw movements between S1 layer II/III and M1 layer V (D1) and between M1 layer II/III and layer V (D2). Yellow traces indicate results of the shuffled dataset. E, Cross-correlograms of M1 MUA activity preceded by movements between layer II/III in S1 (E1) or M1 (E2) and layer V in M1.
Table 1.
Properties of gamma and spindle bursts of three different patterns in layer II/III of M1
| Layer II/III (n = 9 rats) | M1 precedes movement | Movement precedes M1 | Uncorrelated activity in M1 |
|---|---|---|---|
| Gamma bursts | |||
| Spike number | 25.8 ± 6.2*a,**b | 38.9 ± 8.3***a | 14.8 ± 8 |
| Duration (s) | 0.61 ± 0.1***a | 0.57 ± 0.2***a | 0.19 ± 0.06 |
| Frequency (Hz) | 40.3 ± 0.8 | 41.4 ± 0.9 | 41.8 ± 2.1 |
| Amplitude (mV) | 0.78 ± 0.2 | 0.84 ± 0.2 | 0.65 ± 0.2 |
| Power (μV2/Hz) | 1162 ± 356 | 1232 ± 394 | 1209 ± 432 |
| Spindle bursts | |||
| Spike number | 34.8 ± 7.4*a,*b | 45.5 ± 9.3***a | 23 ± 7.7 |
| Duration (s) | 0.77 ± 0.1***a | 0.85 ± 0.2***a | 0.42 ± 0.1 |
| Frequency (Hz) | 9.7 ± 0.5 | 9.97 ± 0.6 | 9.6 ± 0.5 |
| Amplitude (mV) | 0.78 ± 0.2 | 0.92 ± 0.2 | 0.71 ± 0.2 |
| Power (μV2/Hz) | 5436 ± 1415 | 5542 ± 908 | 5220 ± 541 |
Spike number, average number of spikes in MUA per event; amplitude, peak-to-peak amplitude; power, spectral power. Data are presented as mean ± SD. Significant differences among the three different patterns were tested with one-way ANOVA followed by multiple comparisons with Bonferroni correction.
aTested against the pattern: uncorrelated activity in M1 without movement.
bTested against the pattern: movement precedes M1.
***p < 0.001;
**p < 0.01;
*p < 0.05.
Table 2.
Properties of gamma and spindle bursts of three different patterns in layer V of M1
| Layer V (n = 6 rats) | M1 precedes movement | Movement precedes M1 | Uncorrelated activity in M1 |
|---|---|---|---|
| Gamma bursts | |||
| Spike number | 54.7 ± 6.5***a | 46.6 ± 2.7**a | 21.6 ± 4.1 |
| Duration (s) | 0.63 ± 0.02***a | 0.65 ± 0.04***a | 0.2 ± 0.02 |
| Frequency (Hz) | 41.4 ± 1 | 42 ± 0.6 | 42.14 ± 0.9 |
| Amplitude (mV) | 0.93 ± 0.08 | 0.89 ± 0.1 | 0.85 ± 0.09 |
| Power (μV2/Hz) | 1116 ± 136 | 1093 ± 203 | 1049 ± 117 |
| Spindle bursts | |||
| Spike number | 63.3 ± 6.7***a | 50.8 ± 4.9*a | 27.2 ± 3.9 |
| Duration (s) | 0.72 ± 0.04***a | 0.7 ± 0.03***a | 0.38 ± 0.03 |
| Frequency (Hz) | 9.9 ± 0.23 | 9.89 ± 0.4 | 9.4 ± 0.1 |
| Amplitude (mV) | 0.86 ± 0.06 | 0.97 ± 0.14 | 0.89 ± 0.08 |
| Power (μV2/Hz) | 5719 ± 1116 | 5490 ± 232 | 5651 ± 716 |
For further information and meaning of asterisks, see Table 1.
Gamma and spindle bursts occur in M1 in the absence of sensory inputs
To address the question of whether the spontaneous activity in M1 is influenced by sensory inputs from the periphery, we injected 3% lidocaine into the forepaw and recorded cortical activity in M1. After blockade of the sensory periphery, sensory stimulation of the forepaw did not induce any response in either M1 or S1 (Fig. 9A,B). In addition, spontaneous forepaw movements were completely absent in all six investigated animals (Fig. 9C,D). After blockade of the sensory inputs, the occurrence of spontaneous gamma and spindle bursts in contralateral M1 was significantly reduced by 49.1 ± 11.2% (n = 6, p < 0.01) and 48.6 ± 6.2% (p < 0.001), respectively (Fig. 9E1,E2). Moreover, the duration of gamma and spindle bursts was significantly decreased by 37 ± 11.5% (n = 6, p < 0.01) and 36.3 ± 9.6% (p < 0.001), respectively (Fig. 9F1,F2). These results are in good agreement with our observations that ∼40% of the spontaneous bursts in M1 were induced by forepaw movements (Fig. 7C2).
To investigate the question of whether the interactions between spontaneous activity in M1 and S1 is affected by blockade of the sensory periphery, the occurrence of spontaneous events in S1 and M1 were analyzed before and after forepaw inactivation (Fig. 9G). The occurrence of S1-preceding M1 events (5.4 ± 0.97 min−1) was significantly higher (n = 6, p < 0.05) than that of M1-preceding S1 events (3.4 ± 0.44 min−1) before lidocaine injection into the forepaw. In the absence of sensory inputs, the occurrence of S1-preceding M1 events was drastically (p < 0.001) reduced by ∼80%, whereas that of M1-preceding S1 events was only slightly, but significantly (p < 0.01), reduced to 3.1 ± 0.34 min−1. Together, these results demonstrate that sensory periphery inputs contribute mainly to S1-preceding M1 events, whereas M1-preceding S1 events are only marginally affected. These data support our hypothesis that sensory inputs drive both S1 and M1 (with S1 preceding M1) and that M1 can influence S1 directly.
Contribution of immature M1 to early motor activity
Our previous results demonstrated that only one-third of the forepaw movements were preceded by activity in M1 (Fig. 7C2). To prove that spontaneous neuronal activity in M1 is directly responsible for these forepaw movements, we blocked the electrical activity in M1 locally by applying 1% lidocaine to the surface of M1. After inactivation of M1, the occurrence of forepaw movements decreased significantly by 31.7% (p < 0.001, n = 7 for P3–P5) from 12 ± 1.6 min−1 to 8.2 ± 1.3 min−1 (Fig. 10A,B1). The average duration of forepaw movements was also significantly (p < 0.01) reduced, from 1.6 ± 0.29 s to 0.99 ± 0.16 s (Fig. 10B2). These results are in agreement with our previous observation that only a fraction of neuronal activity in immature M1 triggers forepaw movements directly and suggest that M1 can modify motor responses that originate from subcortical regions.
Figure 10.

Role of M1 in controlling forepaw movements. A, One-minute continuous recording of spontaneous forepaw movements in a P3 rat under control conditions (A1, black) and 20 min after lidocaine application (A2, gray). A3, Examples of forepaw movements displayed at expanded time scale (dashed boxes in A1 and A2). B, Inactivation of M1 by lidocaine reduced the occurrence (B1) and duration (B2) of spontaneous forepaw movements. Averaged data (larger symbols) show mean ± SD. Significant differences were tested with paired t test from seven P3–P5 rats. ***p < 0.001; **p < 0.01.
Discussion
In this study, we combined VSDI with extracellular multielectrode recordings to study the functional interactions between S1 and M1 in P3–P5 rats in vivo. The main results of this study can be summarized as follows: (1) mechanical forepaw stimulation evokes burst responses in S1 and M1 as early as P3; (2) burst activity in M1 is often preceded by spontaneous forepaw movements, but to a lesser extent can also trigger movements; and (3) immature M1 functions as motor and somatosensory cortex. Our data indicate that, during early development, M1 already contributes to somatosensory information processing. The interactions between M1 and S1 are comparable to the mature cortex, with a considerable amount of additional spontaneous activity occurring at this early developmental stage.
Both VSDI and electrical recordings demonstrated that sensory stimulation induced cortical burst responses in S1 and M1 of P3–P5 rat pups, indicating an interaction between S1 and M1 during early postnatal development. In adult rodents, a variety of studies have demonstrated a close interaction between S1 and cortical motor areas (Farkas et al., 1999; Rocco and Brumberg, 2007; Brown et al., 2009; Aronoff et al., 2010; Ghosh et al., 2010; Mao et al., 2011). The latency of sensory-evoked responses in S1 in our study is comparable to latencies reported previously in immature rats after forelimb stimulations (Armstrong-James, 1975; Mcvea et al., 2012) and is considerably longer than in adult S1 (Armstrong-James, 1975; Morales-Botello et al., 2012), most probably reflecting the slower conduction of somatosensory information in immature animals. A similar ontogenetic difference in onset latencies has also been observed in the whisker system of the rat (cf. Ferezou et al., 2007; Yang et al., 2013). The latency of forepaw evoked responses between S1 and M1 in the adult rat is ∼5 ms (Ghosh et al., 2010) and thus comparable to the latencies observed in our experiments (∼8 ms), suggesting that similar pathways underlie this coactivation.
Sensory information can reach M1 either by direct thalamic projections to M1 or by associative connections from S1. In the vibrissae system of the adult rat, it has been shown that somatosensory responses in the ventrolateral nucleus of the thalamus, the main area projecting to M1, appear after the responses in M1, indicating that this thalamocortical pathway does not contribute to the fast responses in M1 (Farkas et al., 1999). Consistent with this, it has been shown recently that the functional interaction between M1 and S1 in the rodent whisker system does not depend on thalamic connections (Zagha et al., 2013). Furthermore, Farkas et al. (1999) demonstrated that functional or structural deletion of S1 inhibited M1 responses to tactile stimulation. Neuroanatomical tracing studies identified reciprocal connections between S1 and M1 (Aronoff et al., 2010; Mao et al., 2011), which may underlie the functional interaction between both cortical areas. Because M1-projecting neurons in S1 show touch-related responses during active whisking (Chen et al., 2013), these anatomical connections are most probably involved in the relay of sensory information to M1. Conversely, neural activity in M1 can also influence sensory processing in S1. In adult animals, a disinhibitory circuit in M1 has been shown recently to influence sensory processing in S1 (Lee et al., 2013). In our study, both FPs and MUA in M1 can precede that in S1. Moreover, in the absence of sensory inputs, the occurrence of S1-preceding M1 events was significantly lower than that of M1-preceding S1 events. These observations indicate that M1 has considerable influence on S1 in newborns, suggesting direct connections at this age.
Consistent with previous observations in the immature visual and barrel cortex (Colonnese et al., 2010; Yang et al., 2013), we observed that the response in the forepaw-related S1 consists of an early and late component. However, in contrast to these previous studies (Colonnese et al., 2010; Yang et al., 2013), which demonstrated early gamma bursts in whisker-related barrel cortex, tactile stimulation of the forepaw failed to evoke gamma activity in forepaw-related S1. In S1, both sensory-evoked and spontaneous activity consisted only of spindle bursts, consistent with previous findings in nonbarrel somatosensory cortex (Khazipov et al., 2004). Conversely, in M1, gamma bursts could be observed in sensory-evoked responses and in spontaneous activity. Interestingly, in human cortex, gamma-band activity dominates in M1 in magnetoencephalographic recordings during a sensorimotor task, whereas alpha band spindle activity prevails in S1 (Tecchio et al., 2008). The gamma bursts observed in the present study and previously in the barrel cortex (Colonnese et al., 2010; Yang et al., 2013) are not identical to classical gamma oscillation, which appeared during later stages of development, but rather resemble transient gamma events (Buzsáki and Wang, 2012; Khazipov et al., 2013). Our CSD analyses revealed that evoked early gamma activity in M1 shows a considerable different spatial profile from the early gamma activity in S1 (Minlebaev et al., 2011), suggesting that different circuits underlie the gamma activity in M1.
Approximately 40% of the spontaneous gamma and spindle bursts in M1 were triggered by paw movements, and blockade of forepaw movement by local lidocaine injection reduced the occurrence of gamma and spindle bursts by ∼40%. These results indicate that an early motor-sensory loop contributes to gamma and spindle bursts in immature M1, as has been demonstrated previously for the somatosensory cortex (Khazipov et al., 2004). Similar results have been reported in the whisker (Yang et al., 2009; Tiriac et al., 2012), the visual system (Hanganu et al., 2006), and the auditory system (Tritsch and Bergles, 2010).
Approximately 35% of the M1 bursts are not correlated directly with forepaw movements, consistent with the results of Khazipov et al. (2004), who reported that ∼14% of the spindle bursts in S1 are not associated with movements. This result suggests that, although the majority of neocortical activity transients are generated in subcortical regions or the periphery, a considerable fraction is generated within the cortex itself. Approximately 23.7% of the forepaw movements were preceded by gamma and spindle activity in M1, indicating that these forepaw movements were triggered directly by M1 activity. In these cases, part of the S1 MUA was triggered by sensory perception of the movements, but a considerably amount of MUA in S1 was simultaneous to M1 activity, suggesting direct interactions between these areas. This assumption is supported by the observation that M1 activity uncorrelated to movements was paralleled by activity in S1, and M1 activity without periphery sensory input was still correlated with activity in S1. Furthermore, we demonstrate that microstimulation of M1 in spindle and gamma-frequency bands reliably evokes forepaw movements and local blockade of M1 attenuated forepaw movements. Therefore, spontaneous burst activity in M1 can already trigger spontaneous movements in immature rodents. This conclusion is supported by the observation that bursts in M1, which are sufficient to trigger movements, are characterized by a higher number of spikes in layer V. However, the latency between M1 microstimulation or layer V activity and forepaw movement is considerably longer than in the adult somatosensory system (Bonazzi et al., 2013), which may reflect the slower conduction of information in immature animals or may indicate that M1 does not initiate movements directly, but rather interacts with subcortical movement generators.
Early activity patterns triggered by the sensory periphery play a critical role in the development of functional topography maps. The development of the somatotopic sensory cortical map has been suggested to require spindle burst activity in S1 triggered by spontaneous twitches of the paws (Khazipov et al., 2004). Localized gamma and spindle bursts in neonatal vibrissal S1, which were induced by spontaneous whisker movements (Tiriac et al., 2012) and transferred to the developing cortex via the subplate (Tolner et al., 2012), resemble the topographic and functional columnar organization in barrel cortex already at early postnatal stages (Yang et al., 2013). In the visual system, patterned spontaneous retinal waves not only contribute to the retinotopic map refinement in the superior colliculus (McLaughlin et al., 2003; Chandrasekaran et al., 2005), but also trigger cortical spindle bursts (Hanganu et al., 2006), which may contribute to the spatial refinement in V1 (Cang et al., 2005). In the developing auditory system, spontaneous activity in auditory nerve fibers before the onset of hearing is essential for the refinement and maintenance of tonotopic maps (Rubel and Fritzsch, 2002; Leake et al., 2006; Tritsch et al., 2007). We suggest that early gamma and spindle bursts in M1 contribute to the fine-tuning of the somatotopic organization within the motor cortex. In parallel, activity- and use-dependent processes are important to establish the mature pattern of topographic specificity between corticospinal axons and their spinal targets (Martin, 2005). In addition, the topographical organization of M1 shows a substantial refinement during postnatal development (Chakrabarty and Martin, 2000). Therefore, both spontaneous and sensory-evoked gamma and spindle bursts in M1 may also be critical for the formation of functional efferent motor pathways. We propose that these spontaneous activity transients carry feedback information to the motor cortex, which may be important for the development of a body representation in the motor-sensory system.
Neonatal mice (Gramsbergen et al., 1970; Clarac et al., 2004) and fetal or premature humans (de Vries et al., 1982; Cioni and Prechtl, 1990; Milh et al., 2007) already show coordinated behavioral responses that require coordinated limb movements. Therefore, functional motor-sensory integration is probably already of central importance at this early stage to allow coordinated movements and/or adequate processing of sensory information induced by active movements.
Footnotes
This work was supported by the Deutsche Forschungsgemeinschaft (DFG FOR 1341, BaCoFun). We thank Beate Krumm for excellent technical assistance.
The authors declare no competing financial interests.
References
- An S, Yang JW, Sun H, Kilb W, Luhmann HJ. Long-term potentiation in the neonatal rat barrel cortex in vivo. J Neurosci. 2012;32:9511–9516. doi: 10.1523/JNEUROSCI.1212-12.2012. [DOI] [PMC free article] [PubMed] [Google Scholar]
- Armstrong-James M. The functional status and columnar organization of single cells responding to cutaneous stimulation in neonatal rat somatosensory cortex S1. J Physiol. 1975;246:501–538. doi: 10.1113/jphysiol.1975.sp010902. [DOI] [PMC free article] [PubMed] [Google Scholar]
- Aronoff R, Matyas F, Mateo C, Ciron C, Schneider B, Petersen CC. Long-range connectivity of mouse primary somatosensory barrel cortex. Eur J Neurosci. 2010;31:2221–2233. doi: 10.1111/j.1460-9568.2010.07264.x. [DOI] [PubMed] [Google Scholar]
- Bates CA, Killackey HP. The emergence of a discretely distributed pattern of corticospinal projection neurons. Brain Res. 1984;315:265–273. doi: 10.1016/0165-3806(84)90161-5. [DOI] [PubMed] [Google Scholar]
- Berger T, Borgdorff A, Crochet S, Neubauer FB, Lefort S, Fauvet B, Ferezou I, Carleton A, Lüscher HR, Petersen CC. Combined voltage and calcium epifluorescence Imaging in vitro and in vivo reveals subthreshold and suprathreshold dynamics of mouse barrel cortex. J Neurophysiol. 2007;97:3751–3762. doi: 10.1152/jn.01178.2006. [DOI] [PubMed] [Google Scholar]
- Blumberg MS. Beyond dreams: do sleep-related movements contribute to brain development? Front Neurol. 2010;1:140. doi: 10.3389/fneur.2010.00140. [DOI] [PMC free article] [PubMed] [Google Scholar]
- Bonazzi L, Viaro R, Lodi E, Canto R, Bonifazzi C, Franchi G. Complex movement topography and extrinsic space representation in the rat forelimb motor cortex as defined by long-duration intracortical microstimulation. J Neurosci. 2013;33:2097–2107. doi: 10.1523/JNEUROSCI.3454-12.2013. [DOI] [PMC free article] [PubMed] [Google Scholar]
- Brecht M, Krauss A, Muhammad S, Sinai-Esfahani L, Bellanca S, Margrie TW. Organization of rat vibrissa motor cortex and adjacent areas according to cytoarchitectonics, microstimulation, and intracellular stimulation of identified cells. J Comp Neurol. 2004a;479:360–373. doi: 10.1002/cne.20306. [DOI] [PubMed] [Google Scholar]
- Brecht M, Schneider M, Sakmann B, Margrie TW. Whisker movements evoked by stimulation of single pyramidal cells in rat motor cortex. Nature. 2004b;427:704–710. doi: 10.1038/nature02266. [DOI] [PubMed] [Google Scholar]
- Brown CE, Aminoltejari K, Erb H, Winship IR, Murphy TH. In vivo voltage-sensitive dye imaging in adult mice reveals that somatosensory maps lost to stroke are replaced over weeks by new structural and functional circuits with prolonged modes of activation within both the peri-infarct zone and distant sites. J Neurosci. 2009;29:1719–1734. doi: 10.1523/JNEUROSCI.4249-08.2009. [DOI] [PMC free article] [PubMed] [Google Scholar]
- Buzsáki G, Wang XJ. Mechanisms of gamma oscillations. Annu Rev Neurosci. 2012;35:203–225. doi: 10.1146/annurev-neuro-062111-150444. [DOI] [PMC free article] [PubMed] [Google Scholar]
- Cang JH, Rentería RC, Kaneko M, Liu X, Copenhagen DR, Stryker MP. Development of precise maps in visual cortex requires patterned spontaneous activity in the retina. Neuron. 2005;48:797–809. doi: 10.1016/j.neuron.2005.09.015. [DOI] [PMC free article] [PubMed] [Google Scholar]
- Chakrabarty S, Martin JH. Postnatal development of the motor representation in primary motor cortex. J Neurophysiol. 2000;84:2582–2594. doi: 10.1152/jn.2000.84.5.2582. [DOI] [PubMed] [Google Scholar]
- Chandrasekaran AR, Plas DT, Gonzalez E, Crair MC. Evidence for an instructive role of retinal activity in retinotopic map refinement in the superior colliculus of the mouse. J Neurosci. 2005;25:6929–6938. doi: 10.1523/JNEUROSCI.1470-05.2005. [DOI] [PMC free article] [PubMed] [Google Scholar]
- Chapin JK, Woodward DJ. Distribution of somatic sensory and active-movement neuronal discharge properties in the Ml-Sl cortical border area in the rat. Exp Neurol. 1986;91:502–523. doi: 10.1016/0014-4886(86)90048-8. [DOI] [PubMed] [Google Scholar]
- Chen JL, Carta S, Soldado-Magraner J, Schneider BL, Helmchen F. Behaviour-dependent recruitment of long-range projection neurons in somatosensory cortex. Nature. 2013;499:336–340. doi: 10.1038/nature12236. [DOI] [PubMed] [Google Scholar]
- Cioni G, Prechtl HF. Preterm and early postterm motor behavior in low-risk premature-infants. Early Human Development. 1990;23:159–191. doi: 10.1016/0378-3782(90)90012-8. [DOI] [PubMed] [Google Scholar]
- Clarac F, Brocard F, Vinay L. The maturation of locomotor networks. Brain Mechanisms for the Integration of Posture and Movement. 2004;143:57–66. doi: 10.1016/S0079-6123(03)43006-9. [DOI] [PubMed] [Google Scholar]
- Colonnese MT, Kaminska A, Minlebaev M, Milh M, Bloem B, Lescure S, Moriette G, Chiron C, Ben-Ari Y, Khazipov R. A conserved switch in sensory processing prepares developing neocortex for vision. Neuron. 2010;67:480–498. doi: 10.1016/j.neuron.2010.07.015. [DOI] [PMC free article] [PubMed] [Google Scholar]
- de Vries JI, Visser GH, Prechtl HF. The emergence of fetal behaviour. I. Qualitative aspects. Early Human Development. 1982;7:301–322. doi: 10.1016/0378-3782(82)90033-0. [DOI] [PubMed] [Google Scholar]
- Faraji J, Gomez-Palacio-Schjetnan A, Luczak A, Metz GA. Beyond the silence: bilateral somatosensory stimulation enhances skilled movement quality and neural density in intact behaving rats. Behav Brain Res. 2013;253:78–89. doi: 10.1016/j.bbr.2013.07.022. [DOI] [PubMed] [Google Scholar]
- Farkas T, Kis Z, Toldi J, Wolff JR. Activation of the primary motor cortex by somatosensory stimulation in adult rats is mediated mainly by associational connections from the somatosensory cortex. Neuroscience. 1999;90:353–361. doi: 10.1016/S0306-4522(98)00451-5. [DOI] [PubMed] [Google Scholar]
- Ferezou I, Haiss F, Gentet LJ, Aronoff R, Weber B, Petersen CC. Spatiotemporal dynamics of cortical sensorimotor integration in behaving mice. Neuron. 2007;56:907–923. doi: 10.1016/j.neuron.2007.10.007. [DOI] [PubMed] [Google Scholar]
- Freeman JA, Nicholson C. Experimental optimization of current source-density technique for anuran cerebellum. J Neurophysiol. 1975;38:369–382. doi: 10.1152/jn.1975.38.2.369. [DOI] [PubMed] [Google Scholar]
- Fromm C, Wise SP, Evarts EV. Sensory response properties of pyramidal tract neurons in the precentral motor cortex and postcentral gyrus of the Rhesus-monkey. Exp Brain Res. 1984;54:177–185. doi: 10.1007/BF00235829. [DOI] [PubMed] [Google Scholar]
- Ghosh A, Haiss F, Sydekum E, Schneider R, Gullo M, Wyss MT, Mueggler T, Baltes C, Rudin M, Weber B, Schwab ME. Rewiring of hindlimb corticospinal neurons after spinal cord injury. Nat Neurosci. 2010;13:97–104. doi: 10.1038/nn.2448. [DOI] [PubMed] [Google Scholar]
- Gramsbergen A, Schwartze P, Prechtl HF. The postnatal development of behavioral states in the rat. Dev Psychobiol. 1970;3:267–280. doi: 10.1002/dev.420030407. [DOI] [PubMed] [Google Scholar]
- Hanganu IL, Ben-Ari Y, Khazipov R. Retinal waves trigger spindle bursts in the neonatal rat visual cortex. J Neurosci. 2006;26:6728–6736. doi: 10.1523/JNEUROSCI.0752-06.2006. [DOI] [PMC free article] [PubMed] [Google Scholar]
- Hikosaka O, Tanaka M, Sakamoto M, Iwamura Y. Deficits in manipulative behaviors induced by local injections of muscimol in the 1st somatosensory cortex of the conscious monkey. Brain Res. 1985;325:375–380. doi: 10.1016/0006-8993(85)90344-0. [DOI] [PubMed] [Google Scholar]
- Hiraba H, Yamaguchi Y, Satoh H, Ishibashi Y, Iwamura Y. Deficits of masticatory movements caused by lesions in the orofacial somatosensory cortex of the awake cat. Somatosens Mot Res. 2000;17:361–372. doi: 10.1080/0899022002000202239. [DOI] [PubMed] [Google Scholar]
- Kanazawa H, Kawai M, Kinai T, Iwanaga K, Mima T, Heike T. Cortical muscle control of spontaneous movements in human neonates. Eur J Neurosci. 2014 doi: 10.1111/ejn.12612. doi: 10.1111/ejn.12612. Epub ahead of print. [DOI] [PubMed] [Google Scholar]
- Khazipov R, Luhmann HJ. Early patterns of electrical activity in the developing cerebral cortex of humans and rodents. Trends Neurosci. 2006;29:414–418. doi: 10.1016/j.tins.2006.05.007. [DOI] [PubMed] [Google Scholar]
- Khazipov R, Sirota A, Leinekugel X, Holmes GL, Ben-Ari Y, Buzsáki G. Early motor activity drives spindle bursts in the developing somatosensory cortex. Nature. 2004;432:758–761. doi: 10.1038/nature03132. [DOI] [PubMed] [Google Scholar]
- Khazipov R, Minlebaev M, Valeeva G. Early gamma oscillations. Neuroscience. 2013;250:240–252. doi: 10.1016/j.neuroscience.2013.07.019. [DOI] [PubMed] [Google Scholar]
- Kilb W, Kirischuk S, Luhmann HJ. Electrical activity patterns and the functional maturation of the neocortex. Eur J Neurosci. 2011;34:1677–1686. doi: 10.1111/j.1460-9568.2011.07878.x. [DOI] [PubMed] [Google Scholar]
- Krupa DJ, Brisben AJ, Nicolelis MA. A multi-channel whisker stimulator for producing spatiotemporally complex tactile stimuli. J Neurosci Methods. 2001;104:199–208. doi: 10.1016/S0165-0270(00)00345-9. [DOI] [PubMed] [Google Scholar]
- Leake PA, Hradek GT, Chair L, Snyder RL. Neonatal deafness results in degraded topographic specificity of auditory nerve projections to the cochlear nucleus in cats. J Comp Neurol. 2006;497:13–31. doi: 10.1002/cne.20968. [DOI] [PMC free article] [PubMed] [Google Scholar]
- Lee S, Kruglikov I, Huang ZJ, Fishell G, Rudy B. A disinhibitory circuit mediates motor integration in the somatosensory cortex. Nat Neurosci. 2013;16:1662–1670. doi: 10.1038/nn.3544. [DOI] [PMC free article] [PubMed] [Google Scholar]
- Lemon RN. Functional properties of monkey motor cortex neurons receiving afferent input from the hand and fingers. J Physiol. 1981;311:497–519. doi: 10.1113/jphysiol.1981.sp013601. [DOI] [PMC free article] [PubMed] [Google Scholar]
- Luft AR, Kaelin-Lang A, Hauser TK, Buitrago MM, Thakor NV, Hanley DF, Cohen LG. Modulation of rodent cortical motor excitability by somatosensory input. Exp Brain Res. 2002;142:562–569. doi: 10.1007/s00221-001-0952-1. [DOI] [PubMed] [Google Scholar]
- Mao T, Kusefoglu D, Hooks BM, Huber D, Petreanu L, Svoboda K. Long-range neuronal circuits underlying the interaction between sensory and motor cortex. Neuron. 2011;72:111–123. doi: 10.1016/j.neuron.2011.07.029. [DOI] [PMC free article] [PubMed] [Google Scholar]
- Martin JH. The corticospinal system: from development to motor control. Neuroscientist. 2005;11:161–173. doi: 10.1177/1073858404270843. [DOI] [PubMed] [Google Scholar]
- McLaughlin T, Torborg CL, Feller MB, O'Leary DD. Retinotopic map refinement requires spontaneous retinal waves during a brief critical period of development. Neuron. 2003;40:1147–1160. doi: 10.1016/S0896-6273(03)00790-6. [DOI] [PubMed] [Google Scholar]
- McVea DA, Mohajerani MH, Murphy TH. Voltage-sensitive dye imaging reveals dynamic spatiotemporal properties of cortical activity after spontaneous muscle twitches in the newborn rat. J Neurosci. 2012;32:10982–10994. doi: 10.1523/JNEUROSCI.1322-12.2012. [DOI] [PMC free article] [PubMed] [Google Scholar]
- Milh M, Kaminska A, Huon C, Lapillonne A, Ben-Ari Y, Khazipov R. Rapid cortical oscillations and early motor activity in premature human neonate. Cereb Cortex. 2007;17:1582–1594. doi: 10.1093/cercor/bhl069. [DOI] [PubMed] [Google Scholar]
- Minlebaev M, Colonnese M, Tsintsadze T, Sirota A, Khazipov R. Early gamma oscillations synchronize developing thalamus and cortex. Science. 2011;334:226–229. doi: 10.1126/science.1210574. [DOI] [PubMed] [Google Scholar]
- Morales-Botello ML, Aguilar J, Foffani G. Imaging the spatio-temporal dynamics of supragranular activity in the rat somatosensory cortex in response to stimulation of the paws. PLoS One. 2012;7:e40174. doi: 10.1371/journal.pone.0040174. [DOI] [PMC free article] [PubMed] [Google Scholar]
- Penn AA, Shatz CJ. Brain waves and brain wiring: The role of endogenous and sensory-driven neural activity in development. Pediatr Res. 1999;45:447–458. doi: 10.1203/00006450-199904010-00001. [DOI] [PubMed] [Google Scholar]
- Petreanu L, Gutnisky DA, Huber D, Xu NL, O'Connor DH, Tian L, Looger L, Svoboda K. Activity in motor-sensory projections reveals distributed coding in somatosensation. Nature. 2012;489:299–303. doi: 10.1038/nature11321. [DOI] [PMC free article] [PubMed] [Google Scholar]
- Ridding MC, Brouwer B, Miles TS, Pitcher JB, Thompson PD. Changes in muscle responses to stimulation of the motor cortex induced by peripheral nerve stimulation in human subjects. Exp Brain Res. 2000;131:135–143. doi: 10.1007/s002219900269. [DOI] [PubMed] [Google Scholar]
- Rocco MM, Brumberg JC. The sensorimotor slice. J Neurosci Methods. 2007;162:139–147. doi: 10.1016/j.jneumeth.2007.01.002. [DOI] [PubMed] [Google Scholar]
- Roland PE, Zilles K. Functions and structures of the motor cortices in humans. Curr Opin Neurobiol. 1996;6:773–781. doi: 10.1016/S0959-4388(96)80027-4. [DOI] [PubMed] [Google Scholar]
- Rubel EW, Fritzsch B. Auditory system development: Primary auditory neurons and their targets. Annu Rev Neurosci. 2002;25:51–101. doi: 10.1146/annurev.neuro.25.112701.142849. [DOI] [PubMed] [Google Scholar]
- Sakata S, Harris KD. Laminar structure of spontaneous and sensory-evoked population activity in auditory cortex. Neuron. 2009;64:404–418. doi: 10.1016/j.neuron.2009.09.020. [DOI] [PMC free article] [PubMed] [Google Scholar]
- Sanes JN, Truccolo W. Motor “binding:” do functional assemblies in primary motor cortex have a role? Neuron. 2003;38:3–5. doi: 10.1016/S0896-6273(03)00203-4. [DOI] [PubMed] [Google Scholar]
- Schreyer DJ, Jones EG. Growth and target finding by axons of the corticospinal tract in prenatal and postnatal rats. Neuroscience. 1982;7:1837–1853. doi: 10.1016/0306-4522(82)90001-X. [DOI] [PubMed] [Google Scholar]
- Tecchio F, Zappasodi F, Porcaro C, Barbati G, Assenza G, Salustri C, Rossini PM. High-gamma band activity of primary hand cortical areas: a sensorimotor feedback efficiency index. Neuroimage. 2008;40:256–264. doi: 10.1016/j.neuroimage.2007.11.038. [DOI] [PubMed] [Google Scholar]
- Tiriac A, Uitermarkt BD, Fanning AS, Sokoloff G, Blumberg MS. Rapid whisker movements in sleeping newborn rats. Curr Biol. 2012;22:2075–2080. doi: 10.1016/j.cub.2012.09.009. [DOI] [PMC free article] [PubMed] [Google Scholar]
- Tolner EA, Sheikh A, Yukin AY, Kaila K, Kanold PO. Subplate neurons promote spindle bursts and thalamocortical patterning in the neonatal rat somatosensory cortex. J Neurosci. 2012;32:692–702. doi: 10.1523/JNEUROSCI.1538-11.2012. [DOI] [PMC free article] [PubMed] [Google Scholar]
- Tritsch NX, Bergles DE. Developmental regulation of spontaneous activity in the mammalian cochlea. J Neurosci. 2010;30:1539–1550. doi: 10.1523/JNEUROSCI.3875-09.2010. [DOI] [PMC free article] [PubMed] [Google Scholar]
- Tritsch NX, Yi E, Gale JE, Glowatzki E, Bergles DE. The origin of spontaneous activity in the developing auditory system. Nature. 2007;450:50–55. doi: 10.1038/nature06233. [DOI] [PubMed] [Google Scholar]
- Xerri C, Coq JO, Merzenich MM, Jenkins WM. Experience-induced plasticity of cutaneous maps in the primary somatosensory cortex of adult monkeys and rats. J Physiol Paris. 1996;90:277–287. doi: 10.1016/S0928-4257(97)81438-6. [DOI] [PubMed] [Google Scholar]
- Yang JW, Hanganu-Opatz IL, Sun JJ, Luhmann HJ. Three patterns of oscillatory activity differentially synchronize developing neocortical networks in vivo. J Neurosci. 2009;29:9011–9025. doi: 10.1523/JNEUROSCI.5646-08.2009. [DOI] [PMC free article] [PubMed] [Google Scholar]
- Yang JW, An S, Sun JJ, Reyes-Puerta V, Kindler J, Berger T, Kilb W, Luhmann HJ. Thalamic network oscillations synchronize ontogenetic columns in the newborn rat barrel cortex. Cereb Cortex. 2013;23:1299–1316. doi: 10.1093/cercor/bhs103. [DOI] [PubMed] [Google Scholar]
- Zagha E, Casale AE, Sachdev RN, McGinley MJ, McCormick DA. Motor cortex feedback influences sensory processing by modulating network state. Neuron. 2013;79:567–578. doi: 10.1016/j.neuron.2013.06.008. [DOI] [PMC free article] [PubMed] [Google Scholar]