

Abstract
There are neurons localized in the lower bank of the superior temporal sulcus (STS) in the inferior temporal (IT) cortex of the monkey that selectively respond to specific ranges of gloss characterized by combinations of three physical reflectance parameters: specular reflectance (ρs), diffuse reflectance (ρd), and spread of specular reflection (α; Nishio et al., 2012). In the present study, we examined how the activities of these gloss-selective IT neurons are related to perceived gloss. In an earlier psychophysical study, Ferwerda et al. (2001) identified a perceptually uniform gloss space defined by two axes where the c-axis corresponds to a nonlinear combination of ρs and ρd and the d-axis corresponds to 1 − α. In the present study, we tested the responses of gloss-selective neurons to stimuli in the perceptual gloss space defined by the c- and d-axes. We found that gloss-selective neurons systematically changed their responses in the perceptual gloss space, and the distribution of the tuning directions of the population of gloss-selective neurons is biased toward directions in which perceived gloss increases. We also found that a set of perceptual gloss parameters as well as surface albedo can be well explained by the population activities of gloss-selective neurons, and that these parameters are likely encoded by the gloss-selective neurons in this area of the STS to represent various glosses. These results thus provide evidence that the IT cortex represents perceptual gloss space.
Keywords: gloss, IT cortex, lightness, monkey, perception, surface property
Introduction
The surface reflectance of an object provides information about the condition of the object's surface, such as whether it is wet or dry; it can also reveal whether food is fresh or old, or whether skin is healthy or not. This makes the ability to discriminate the surface reflectance of objects biologically important. One reflection property that has a distinct effect on surface appearance is gloss (Beck and Prazdny, 1981; Hunter and Harold, 1987; Blake and Bülthoff, 1990; Adelson, 2001; Maloney and Brainard, 2010). The physical properties related to surface gloss have been extensively studied, and a set of gloss-related physical parameters has been identified and used to generate realistic object images through computer graphics (Cook and Torrance, 1982; Ward, 1992; Matusik et al., 2003; Ngan et al., 2005).
There have been a number of psychophysical studies conducted with the aim of understanding the properties of gloss perception and exploring image features related to gloss perception (Nishida and Shinya, 1998; Fleming et al., 2003; Motoyoshi et al., 2007; Xiao and Brainard, 2008; Doerschner et al., 2010; Kim et al., 2012; Marlow et al., 2012). At present, however, little is known about the neural mechanisms underlying gloss perception. We recently conducted an electrophysiological recording experiment and found that neurons selectively responsive to particular range of gloss (gloss-selective neuron) are present in the inferior temporal (IT) cortex of the monkey (Nishio et al., 2012). In that study, we tested neural responses by presenting images of objects whose surfaces were defined by a combination of physical parameters. However, we did not determine which parameters related to gloss are represented by these neurons. The aim of the present study, therefore, was to find an answer to that question.
We assumed that these IT neurons were related to gloss perception because it is known that information about various attributes related to object recognition, such as shape, color,and texture, are also represented in the IT cortex (Desimone et al., 1984; Komatsu et al., 1992; Janssen et al., 2001; Kovács et al., 2003; Conway et al., 2007; Köteles et al., 2008; Yamane et al., 2008); moreover, neuronal activity in the IT cortex is known to be related to the perception of such attributes (Sheinberg and Logothetis, 1997; Jagadeesh et al., 2001; Afraz et al., 2006; Matsumora et al., 2008; Sripati and Olson, 2010). We therefore attempted to examine the relationship between neural responses and perceptual gloss parameters suggested by an earlier psychophysical experiment (Ferwerda et al., 2001).
When we examined the responses of gloss-selective neurons to a stimulus set that sampled combinations of perceptual gloss parameters, we found that the responses could be well represented through linear combination of perceptual gloss parameters. Furthermore, we found that each perceptual gloss parameter could be fairly precisely estimated through linear combination of the responses of the population of gloss-selective neurons. These results strongly suggest that parameters closely associated with perceived gloss are encoded by neurons in the IT cortex to represent a variety of glosses.
Materials and Methods
Surgery and recordings of neuronal activity.
We recorded neuronal activities from three hemispheres of two monkeys (1 male and 1 female; Macaca fuscata weighing 5.8–6.2 kg). Before starting the physiological experiment, a head holder and a recording chamber (rectangular in shape with an opening 10 or 15 mm × 10 mm at the edge) were surgically attached to the skull under aseptic conditions and general anesthesia. Neuronal activities were then recorded from the posterior bank of the superior temporal sulcus (STS) in the central part of the IT cortex. The center of each recording chamber was located 22 mm lateral and 8–10 mm anterior, based on the stereotaxic coordinates. Neurons were recorded extracellularly using tungsten microelectrodes (Frederick Hare) that were inserted vertically from the vertex. During the physiological recordings, we first mapped a wide region of the posterior bank of the STS and assessed the responses to visual stimuli having a variety of glosses. After the mapping, guide tubes made of MRI compatible metal (titanium or gold) were inserted into the brain, targeting the regions where gloss-selective neurons were observed. We then extensively sampled the neurons in those regions. The tips of the guide tubes were positioned approximately 1 cm above the targeted cortical regions, and while the guide tubes remained inserted in the brain, we took MRI images to confirm the recording positions. All procedures for animal care and experimentation were in accordance with the U.S. National Institutes of Health Guide for the Care and Use of Laboratory Animals (1996) and were approved by our institutional animal experimentation committee.
Experimental apparatus and the task.
During the experiments, the monkeys were seated in a primate chair and faced the screen of a CRT monitor (frame rate: 100 Hz, Totoku Electric) situated at a distance of 85 cm from the monkey. Eye position was monitored using an eye coil or an infrared eye camera system (ISCAN). Visual stimuli were generated using a graphics board (VSG, Cambridge Research Systems), then presented on the CRT monitor. Image resolution was 800 × 600 pixels (30 pixels/degree). Monkeys were required to fixate on a small white spot (visual angle: <0.1°) at the center of the display. A trial started with the presentation of the fixation spot, after which stimuli were presented five times within a trial. Each stimulus presentation lasted 300 ms. The first stimulus was presented 800 ms after the monkey started fixating and was followed by four stimuli with 300 ms interstimulus intervals. Monkeys were rewarded with a drop of juice 300 ms after turning off the last stimulus. Monkeys had to maintain eye position within a 2.6° × 2.6° window centered at the fixation point. If the eye deviated from the eye window, the trial was canceled, and an intertrial interval (ITI) started. The duration of the ITI was 1000 ms. When the stimulus was presented on the fovea, the fixation spot was turned off after the first 500 ms of presentation to avoid interference between the fixation spot and the visual stimulus.
Visual stimuli.
We used LightWave software (NewTek) to generate 10 different 3D shapes (Nishio et al., 2012, their Fig. 1C). For the illumination environment, we used one of the high dynamic range images from the Devebec dataset (http://ict.debevec.org/∼debevec/; Eucalyptus Grove), and we rendered the object images using Radiance software (http://radsite.lbl.gov/radiance/). The object images were presented on a gray background (10 cd/m2), where they subtended approximately 5° of visual angle and were usually presented on the fovea. When the response at the fovea was weak and stronger responses were evoked by presentation of stimulus at a position outside of the fovea, stimulus selectivity was tested at that position. When a single neuron was isolated, we determined the preferred shape among 10 object shapes and conducted the main experiment using object images with the preferred shape.
Figure 1.

Gloss parameters and stimuli with various combinations of c and d. A, Schematic illustration of three reflection parameters: diffuse reflectance (ρd), specular reflectance (ρs), and spread of specular reflection (α). When ρd increases, the lightness of the object increases. When ρs increases, the highlights become stronger. When α increases, the highlights become blurred. B, Example of a stimulus set with a combination of four c values, four d values, and a fixed ρd value (gray). Both c and d are perceptual gloss parameters. c corresponds to the contrast gloss parameter and is represented by a nonlinear combination of ρs and ρd. d corresponds to the distinctness-of-image gloss parameter and is represented by 1 − α. Along both axes, perceived gloss increases when the value becomes larger.
The reflection from an object's surface consists of two components, diffuse reflection and specular reflection, and the properties of the reflection can be characterized based on three physical parameters: diffuse reflectance (ρd), which indicates the strength of the diffuse reflection and will be referred to simply as albedo; specular reflectance (ρs), which indicates the strength of specular reflection; and the spread of the specular reflection (α), which is caused by fine scale unevenness or roughness of the surface (Fig. 1A). In our earlier study (Nishio et al., 2012), we examined the neural responses to a set of visual stimuli that had different combinations of the physical parameters of gloss. In the present study, by contrast, our aim was to analyze neural selectivity for perceptual parameters of gloss.
Ferwerda et al. (2001) conducted psychophysical experiments to examine the relationship between the physical parameters of gloss and the perceptual dimension of a glossy appearance. They reported that a glossy appearance could be explained using a two-dimensional space defined of two perceptual parameters, c and d. Of these, d is defined as 1 − α, which represents the sharpness of the highlights and corresponds to the distinctness-of-image gloss (Hunter and Harold, 1987). On the other hand, c corresponds to the contrast gloss, which is a nonlinear combination of ρd and ρs, and is defined as follows:
c thus represents the difference in brightness between the dark region of an object surface illuminated only by diffuse reflection and the light region illuminated by both specular and diffuse reflection. Ferwerda et al. (2001) proposed that the apparent strength of gloss varies in proportion to the change of these parameters. In the present study, we used these perceptual gloss parameters to generate visual stimuli whose parameters were defined by selected combinations of c and d. We then used those stimuli to examine the relationship between neural responses and perceptual parameters of gloss.
The set of visual stimuli prepared enabled us to sample neural responses across a wide range of c/d space (c/d stimulus set) at different levels of albedo (ρd). To test the responses of each neuron, we used 48 stimuli that consisted of combinations of four c values, four d values, and three ρd values (Fig. 1B). One plausible way to examine the sensitivity to these parameters is to use a stimulus set made of the same combination of c and d values regardless of ρd. However, such an arrangement contradicts a natural constraint: values of c tend to be larger for dark objects with a low ρd value, and the maximum value of c decreases with increasing values of ρd (Ferwerda et al., 2001). We incorporated these natural constraints by using a stimulus set in which the range of c shifts to smaller values with lighter objects. With regard to the specular reflection, the luminance of the specular reflection deviated from that expected from the nominal value of ρs in the CG model (Ward–Duer model) due to the limitation of the dynamic range of the display as well as an error in the gamma correction. In the quantitative analysis, therefore, we used estimated ρs values that were computed from the luminance of actually-presented stimuli in the following way. We first isolated the luminance component of the specular reflection by subtracting the luminance of a surface with the same ρd value but with zero ρs (matte surface). We then determined the nominal ρs value that should yield the same integral of the luminance of the specular lobe as that computed from the actual stimulus. We also determined the nominal ρd value that should yield the same integral of the luminance as that of the matte surface actually presented. Although these computed parameter values were affected by the three-dimensional shapes of objects to some degree, the difference across shapes was small, and we used the average values of the parameters obtained across the different shapes. The spread of the specular reflection (α) of an object image was immune to the problems of dynamic range or gamma correction. The actual values of the parameters used for analysis are shown in Table 1. All objects had achromatic colors (either white, gray, or black depending on ρd).
Table 1.
Values of the stimulus parameters (ρd, c, d) used for analysis
| Diffuse reflectance (ρd) | (c, d) | |||
|---|---|---|---|---|
| White ρd = 0.795 | (0.03, 1.00) | (0.06, 1.00) | (0.08, 1.00) | (0.10, 1.00) |
| (0.04, 0.93) | (0.06, 0.93) | (0.09, 0.93) | (0.11, 0.93) | |
| (0.04, 0.87) | (0.06, 0.87) | (0.09, 0.87) | (0.11, 0.87) | |
| (0.04, 0.80) | (0.06, 0.80) | (0.09, 0.80) | (0.11, 0.80) | |
| Gray ρd = 0.416 | (0.06, 1.0) | (0.10, 1.0) | (0.13, 1.0) | (0.16, 1.0) |
| (0.05, 0.93) | (0.10, 0.93) | (0.14, 0.93) | (0.17, 0.93) | |
| (0.05, 0.87) | (0.10, 0.87) | (0.14, 0.87) | (0.17, 0.87) | |
| (0.05, 0.80) | (0.10, 0.80) | (0.14, 0.80) | (0.18, 0.80) | |
| Black ρd = 0.004 | (0.10, 1.0) | (0.23, 1.0) | (0.32, 1.0) | (0.40, 1.0) |
| (0.11, 0.93) | (0.23, 0.93) | (0.34, 0.93) | (0.42, 0.93) | |
| (0.12, 0.87) | (0.24, 0.87) | (0.34, 0.87) | (0.43, 0.87) | |
| (0.12, 0.80) | (0.24, 0.80) | (0.34, 0.80) | (0.43, 0.80) | |
Data analysis.
Neural responses were analyzed only for correct trials, and the minimum number of repetitions of each stimulus accepted for analysis was five. Mean firing rates were computed for a 300 ms period beginning 50 ms after stimulus onset. Baseline activities were computed for the 300 ms immediately before the onset of the first stimulus within a trial. Only neurons that showed responses of >10 spikes/s and a significant increase in activity in response to at least one stimulus (p < 0.05, t test) were defined as visually responsive. Of the visually responsive neurons, only those that were tested for all 48 surface reflectances, including three different ρds, and that showed selectivity to the visual stimulus set (ANOVA, p < 0.05) were analyzed.
To examine response tuning in c/d space, we conducted multiple regression analysis by fitting the neural responses with Equation 2:
where R is the neural response obtained with the preferred ρd, ac and ad are the weights for the perceptual gloss parameters c and d, and e is a constant. In a multiple regression analysis, the plane best fit by the least-squares method was determined. Statistical significance of the regression model was assessed using the F test. Tuning direction (θ) in the c/d plane was determined as the direction of the maximum slope of the c/d-regression plane and was computed as follows:
Because it was previously reported that a weighting factor of 1.78 is needed for the d-axis to make the space perceptually uniform, we computed the tuning direction using this weighting factor (Ferwerda et al., 2001).
We also performed a second multiple regression analysis by fitting the perceptual parameters of gloss using the activities of the population of gloss-selective neurons, and then examined to what extent perceptual gloss parameters could be explained by the activities of the gloss-selective neurons. To distinguish this second multiple regression analysis from the first described above, from here on we will refer to the first analysis as “single-neuron analysis” and the second as “population analysis.” To avoid spurious correlation caused by overfitting in the population analysis, neural responses were compressed using principal component analysis. These principal components are composed by the linear sum of the responses of all neurons involved as follows:
 |
where PCi is i′th principal component, bij is the weight of j′th neuron for i′th PC, rj is the response of the j′th neuron, n is the number of cells and f is a constant. We used the first four dimensions of the principal components in the population analysis, where the cumulative contribution ratio exceeds 80% of the total variance. Thus, the multiple regression model is written as follows:
 |
where Pk is the k′th stimulus parameter, cki is the weight for i′th PC (i = 1–4) of the k′th parameter and g is a constant.
Finally, we analyzed the relationship between the tuning direction of each neuron in the c/d plane and the magnitude of its contribution to each perceptual gloss parameter in the multiple regression analysis (population analysis). We computed a weight coefficient (Wkj) that represents the contribution of the j′th neuron when the k′th perceptual gloss parameter was regressed by multiplying the coefficients in Equations 4 and 5 as follows:
 |
Results
Selective responses to the c/d stimulus set
Of the visually responsive neurons that we recorded from the lower bank of the STS, we analyzed 81 that showed selective responses to stimuli defined based on the perceptual parameters of gloss (c/d stimulus set). These 81 neurons exhibited significant selective responses to the gloss stimulus set used in our previous study (Nishio et al., 2012). Of these, 39 neurons were classified as gloss-selective because they satisfied the following two criteria. First, selectivity for the gloss stimulus set was maintained when a stimulus set with a different shape was used. Second, either the neuron did not show a significant response to shuffled stimuli or the stimulus selectivity significantly changed between the original test stimuli and the shuffled stimuli (Nishio et al., 2012).
We next examined how these gloss-selective neurons respond to a c/d stimulus set. Most of these cells showed selective responses in c/d space, and the magnitudes of the responses changed along specific directions within c/d space. Figure 2 shows responses of one example of a gloss-selective neuron in the c/d plane at three different ρds. This neuron strongly responded to object images with sharp highlights, but did not respond to object images with blurred highlights or with a matte surface. Correspondingly, this neuron responded strongly to stimuli with large d values, and responses were weaker for stimuli with small d values. By contrast, response change along the c-axis was relatively weak. These tendencies were largely maintained across different values of ρd.
Figure 2.

Responses of an example neuron in perceptual gloss space (c/d space). A, Responses of an example neuron (Cell 1) to the 16 stimuli also illustrated in Figure 1B. Responses are depicted as raster plots and spike density functions (σ = 10 ms). A horizontal bar under the spike density function indicates the stimulus presentation period. B, Bubble plot showing the response magnitude of Cell 1 to each stimulus as the diameter of a circle. Responses to stimuli with high ρd (white), middle ρd (gray), and low ρd (black) are shown in the left, middle, and right panels, respectively. This neuron strongly responded to stimuli with large d value regardless of the c or ρd values.
Like the example neuron in Figure 2, the responses of most gloss-selective neurons changed in a specific direction in c/d space. In addition, the response magnitudes often depended on the value of ρd. Figure 3 illustrates the responses of three additional example neurons that showed selective responses in the c/d plane. The responses of all three neurons changed in a specific direction in the c/d plane, though the response magnitudes changed to differing degrees with different values of ρd. Even when the response magnitude changed with ρd, however, the selectivity in the c/d plane tended to be similar across different ρd values. The preferred directions in the c/d plane varied across neurons. The responses of Cell 2 changed along the d-axis in a manner similar to Cell 1 depicted in Figure 2, and Cell 2 preferred stimuli with large d values. The responses of Cell 3 changed along the c axis, and this cell preferred stimuli with large c values, though clear responses were observed only when the ρd was small. Finally, Cell 4 showed strong responses to object images in which the values of both c and d were large. In addition, the response gain depended on the ρd value, and the magnitude of the responses increased with increasing values of ρd.
Figure 3.

Responses of example neurons with different selectivities. Rows show responses of Cell 2 (top), Cell 3 (middle), and Cell 4 (bottom); columns indicate, from left to right, responses to stimuli with high ρd (white), middle ρd (gray) and low ρd (black). Responses of Cell 2 changed along the d-axis, and this neuron preferred stimuli with large d value. Responses of Cell 3 changed along the c-axis, and this neuron preferred stimuli with large c values. Responses of Cell 4 changed in a direction intermediate between the c- and d-axes. Responses of all these neurons depended on the ρd value.
Tuning in the c/d plane
The linear dependence of the response magnitude in the c/d plane suggests there is a close relationship between the perceptual parameters of gloss (c and d) and the activities of gloss-selective neurons. To determine to what extent neural responses can be explained by a linear combination of the c and d values, we conducted a multiple regression analysis using c and d values as independent variables (single-neuron analysis). For this analysis, we used responses to object images with the ρd for which strongest responses were observed. Figure 4A compares the actual responses and the responses estimated using the multiple linear regression, both of which are shown in the three-dimensional space defined by the c and d values of the stimuli on the horizontal axes and the neural responses on the vertical axis for Cells 3 and 4 depicted in Figure 3. Black circles indicate the actual neural response to each stimulus, and asterisks indicate the estimated responses. The responses of these two neurons were well fit by a linear combination of the c and d values, and the correlation coefficients between the actual and estimated responses were high (insets in Fig. 4A). We then computed the correlation coefficients between the actual and estimated responses based on the single-neuron analysis of all 39 gloss-selective neurons examined. The distribution of the correlation coefficients is shown in Figure 4B. The average correlation coefficient was 0.76, and the responses of 32 neurons (32/39 = 82%, filled bar) were significantly fit by the multiple linear regression model (F test, p < 0.05). These results support the idea that there is a close relationship between the responses of gloss-selective neurons and gloss perception.
Figure 4.

Multiple regression analysis of responses of individual neurons. A, Three-dimensional plots showing the results of multiple regression analyses for two example neurons depicted in Figure 3 (Cells 3 and 4). The actual neural responses to a stimulus set (black circles) and responses estimated based on the multiple regression analysis (asterisks on the gray plane) are shown in the three-dimensional space defined by axes representing c, d, and neural response. Results obtained with the optimal ρd are shown. The correlation coefficients between the actual and estimated responses are shown in the insets. B, Distribution of correlation coefficients between the actual and estimated responses. The horizontal axis indicates the correlation coefficient; the vertical axis indicates number of cells. Filled and open bars indicate significant and non-significant fits by the multiple regression analysis (F test, p < 0.05). C, Tuning direction in c/d space of each neuron significantly fit in the multiple regression analysis. Tuning direction was defined as the direction of the maximum slope of the c/d regression plane in the multiple regression analysis after the relative weighting between the c- and d-axes was adjusted (see Materials and Methods): if the responses increased (decreased) along the c axis, tuning direction becomes 0° (180)°, and if the responses increased (decreased) along the d axis, tuning directions becomes 90° (270°). Arrows corresponding to Cells 1–4 in Figures 2 and 3 are indicated.
For the 32 neurons that exhibited a significant correlation, we calculated the tuning direction of each neuron in the c/d plane, which represents the direction to which that neuron was most sensitive. The tuning direction was determined as the direction of the maximum slope of the c/d-regression plane after the relative weighting between the c- and d-axes was adjusted (see Materials and Methods). We defined tuning directions as 0° (180°) if responses increased (decreased) along the c-axis, and 90° (270°) if the responses increased (decreased) along the d-axis. The distribution of the tuning directions is plotted in Figure 4C as the directions of arrows. We found that there was a clear bias in tuning direction toward the upper-right (−45 to 135°) in the c/d plane. Within this range, the clustering of cells in particular directions was not obvious.
Coding of gloss parameters by population responses
The results described so far indicate that the responses of gloss-selective neurons are closely related to the perceptual parameters of gloss. This suggests the possibility that these parameters may be explained by the population activities of the gloss-selective neurons. To test this possibility, we conducted a multiple regression analysis (population analysis) by fitting the perceptual parameters of gloss using the population activities of the 39 gloss-selective neurons using Equation 5 after the activities were compressed through principal component analysis (see Materials and Methods; Fig. 5). We found that both of the perceptual parameters of gloss (c and d) were well explained by the first four PCs of the population activities of gloss-selective neurons (c: r = 0.97; Fig. 5B, top; d: r = 0.93; Fig. 5A, middle). By contrast, when we attempted to apply the same procedure to fit the specular reflectance (ρs), which is a physical parameter of gloss, the population activities of gloss-selective neurons only poorly explained this parameter (ρs, r = 0.74; Fig. 5A, top). These results suggest the population activities of gloss-selective neurons represent perceptual parameters of gloss rather than the physical parameters of gloss.
Figure 5.

Regression analysis of gloss parameters using the population activities of gloss-selective neurons. A, Relationship between the actual and estimated values of each physical parameter. The horizontal axis indicates actual values; the vertical axis indicates values estimated through regression from population responses. The black line shows the linear regression. The correlation coefficients between the actual and estimated values are shown in the insets. The top, middle, and bottom panels are for the parameters ρs, d = 1 − α and ρd, respectively. B, Relationship between the actual and estimated values of perceptual parameters of gloss. Conventions are the same as in A. The top, middle, and bottom panels are for the parameters c, d′, and , respectively. C, Three-dimensional plot showing the results of a regression analysis of three physical parameters of gloss (ρd, ρs, and d = 1 − α). Actual parameter values (blue) and values estimated through regression (red) are plotted in the three-dimensional space defined by axes representing the physical parameters. D, Three-dimensional plot showing the results of a regression analysis of three perceptual parameters of gloss (, c, and d′). Conventions are the same as in C. To aid visualization, color contours were traced by connecting the points corresponding to the minimum and maximum values of c and d in each stimulus set.
We also conducted a population analysis for diffuse reflectance (ρd) because many gloss-selective neurons exhibited sensitivity not only to c and d, but also to ρd. We found that ρd was well fit by the first four PCs of neuronal activities (ρd, r = 0.94; Fig. 5A, bottom), which suggests these cells also encode information about surface albedo. The relative weights of four PCs in the fitting of each of three parameters are 0.09, 0.54, 0.24, and 0.13 for c; 0.63, 0.19, 0.10, and 0.08 for d; and 0.10, 0.41, 0.10, and 0.39 for ρd. Thus, c and d are represented in a large part by distinct PCs, but the representation of c and ρd are partly overlapping and the second PC exhibited large values for both c and ρd. This is not at odds because c is a nonlinear combination of ρs and ρd.
The results summarized above strongly suggest the activities of the population of gloss-selective neurons encode information related to the perceptual parameters of surface gloss and albedo. However, this does not necessarily imply that the parameters considered here are the optimal ones. In fact, it is noteworthy that there is some deviation in the actual values from the linear estimation for d (Fig. 5A, middle) and ρd (Fig. 5A, bottom). We therefore attempted to identify better parameters, if they existed, using a simple heuristic approach. We first considered the properties of d, which is actually 1 − α, where α corresponds to the surface roughness or the spread of specular reflection. Increasing α blurs highlights, but it is known that when α becomes larger than 0.2 its effect on gloss perception weakens (Ward, 1992). Perceptually, this means that d should take a form in which the slope decays with increasing α, so we used d′ = exp (−α/0.1) in place of d = 1 − α. When we then conducted a population analysis using this slightly modified version of d, we obtained a higher correlation coefficient (d′: r = 0.96; Fig. 5B, middle). We then tried replacing ρd with because it has been shown that lightness perception is well represented by the cube root of the surface albedo. We found that this resulted in a higher correlation in the population analysis (: r = 0.98; Fig. 5B, bottom). We made no attempt to modify c because the correlation was already quite high (r = 0.97). The relationships between the actual values of the stimulus parameters and values estimated through the multiple regression analysis (population analysis) are illustrated in Figure 5C, D. When the physical parameters (ρs, ρd, α) were regressed (Fig. 5C), the estimated values were more compressed along ρs than the actual values, especially for stimuli with high ρd values. By contrast, when the perceptual gloss parameters (c, d′, ) were regressed (Fig. 5D), the differences between the actual and estimated values were rather small over the entire range of stimulus parameters tested. The high correlation between neuronal activity and these parameters strongly suggests the activities of the population of gloss-selective neurons likely encode these three parameters (c, d′, ). These results also provide evidence that parameters closely related to gloss perception are represented in the IT cortex. We conducted the same analysis using different number of PCs (3 and 5), but the results were basically the same as shown above when the number of PCs was four.
Tuning in the c/d plane and the contribution to the representation of gloss parameters
As shown above, perceptual gloss parameters can be well regressed by the population responses of gloss-selective neurons. On the other hand, the results summarized in Figure 4 show that each neuron is tuned to a particular direction in the c/d plane. We would therefore expect the magnitude of the contribution of each neuron in the population analysis to depend on its tuning direction. For example, we would expect neurons whose tuning directions are close to the c-axis to make large contributions to c, whereas neurons whose tuning directions are close to the d-axis will make large contributions to d′. With regard to the perceptual parameter of albedo (), both groups of neurons may make contributions. To test this possibility, we analyzed the relationship between the tuning direction of each neuron in the c/d plane and the magnitude of its contribution to each perceptual parameter in the population analysis. For that analysis we computed a weight coefficient, W, which represented the contribution of each cell when a perceptual gloss parameter was regressed by the responses of the gloss-selective neurons (see Materials and Methods). To visualize the relationship between the tuning direction and the weight coefficient, we modified Figure 4C such that the lengths of the arrows representing the tuning direction of each neuron were scaled in proportion to the magnitude of W and plotted in Figure 6A–C. In Figure 6A, for example, neurons tuned to rightward directions with long vector lengths made large contributions to the representation of c. For regression of parameter d′ (Fig. 6B), neurons tuned to the upward directions with long vector lengths made large contributions to the representation of d′. For regression of parameter , neurons were tuned to various directions with modest vector lengths, suggesting that there is no clear relationship between tuning direction in the c/d plane and the magnitude of the contribution for representation of the perceptual parameter of albedo. These results are thus largely consistent with expectation. Close inspection of the vector lengths for each neuron revealed that few have modest or long vector lengths in more than one panel in Figure 6. Upon coloring the five neurons exhibiting the largest weight for each parameter (red for c, green for d′, and blue for ), it was apparent that only one neuron exhibited large weights for more than one parameter (purple for c and ). It thus appears that different perceptual gloss parameters are represented by different populations of neurons.
Figure 6.
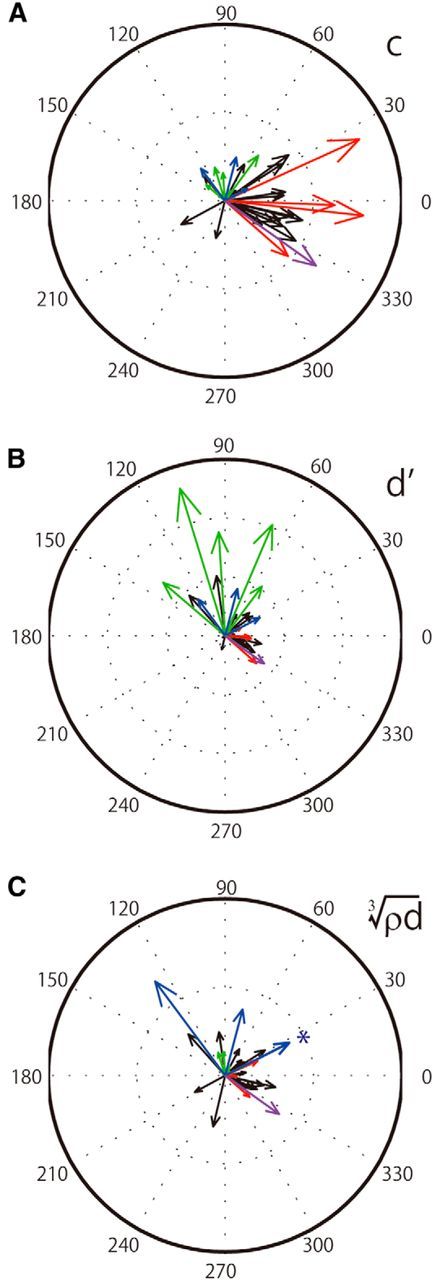
Contribution of individual neurons to the representation of perceptual parameters of gloss. A, The degree to which neurons tuned to different directions in the c/d plane contributed to the parameter c. The length of arrows representing the tuning direction in the c/d plane (Fig. 4C) were scaled in proportion to the magnitude of a weight coefficient, W, in Equation 6 when the parameter c was regressed with the responses of the population of gloss-selective neurons. B, C, The degree to which neurons tuned to different directions in the c/d plane contributed to the representation of the parameters d′ and , respectively. Conventions are the same as in A. Red, green, and blue arrows represent neurons exhibiting a large W (top five) for the regression of c, d′, and , respectively. The asterisk indicates that blue arrows representing two neurons are nearly completely overlapping. Purple represents a neuron that showed a large W for the regression of both c and (n = 1). Black represents neurons that did not exhibit large W (of the top five) for any parameters.
Discussion
Gloss is an important aspect of objects affecting their surface appearance, and has attracted the attention of many people including artists, engineers and researchers. Glossiness is perceived with various causes that are distinguished with different names such as specular gloss, sheen, contrast of gloss, absence-of-bloom gloss, distinctness-of-image gloss, or surface-uniformity gloss, and a single-dimensional scale is not enough to represent the various types of gloss (Hunter and Harold, 1987). Ferwerda et al. (2001) have conducted a psychophysical experiment to examine the perceived gloss of CG images of spherical objects illuminated on a checker-board black/white background whose reflectance properties were defined by the Ward model. They quantitatively analyzed the differences in the perceived gloss of the objects and introduced a two-dimensional scale to represent perceived gloss. The two dimensions were thought to correspond to contrast gloss (c) and distinctness-of-image gloss (d), respectively. In the present study, we tested the responses of IT neurons to visual stimuli defined based on c and d, and found that many neurons exhibit selectivity in c/d space and that their responses can be represented by the weighted sums of c and d. This suggests the activities of these neurons are related to perceptual gloss parameters.
Tuning in the c/d plane
Roughly speaking, upper-right directions in the c/d plane, between −45° through 0° to 135° are the directions to which perceived gloss increases, and the remaining lower-left directions are those to which perceived gloss decreases. Our present findings show that the distribution of tuning directions among the population of gloss-selective neurons is biased toward the upper-right. This indicates that while this population of neurons can represent a variety of glosses, glossier stimuli will evoke stronger overall responses in this brain region. In an earlier monkey fMRI experiment comparing the responses to specular and matte stimuli, we observed stronger responses to specular stimuli in a region of the lower bank of the STS in the central IT cortex (Okazawa et al., 2012) that roughly corresponded to the location of the recording sites in the present study. The bias of the tuning direction in the c/d plane observed in the present study may explain why responses to the specular stimuli were stronger in the fMRI experiment.
Perceptual parameters represented by IT neurons
We found that a set of parameters related to gloss perception (, c, d′) are well fit by linear combinations of parameters representing the population activities of gloss-selective neurons. Of these three parameters, c is one of the perceptual gloss parameters identified by Ferwerda et al. (2001).
Our parameter d′ is associated with parameter d, which is another perceptual gloss parameter proposed by Ferwerda et al. (2001). d represents 1 − α, where α, a Ward model parameter, indicates fine scale unevenness causing spread of specular reflection; d is therefore thought to correspond to distinctness-of-image gloss. α is nonlinearly related to perceived gloss, and the function exp(−α/0.1) used for d′ in our present study takes into account this characteristic such that the slope decreases with increases in α (Ward, 1992).
Finally, the third parameter, , is related to surface albedo. It is well known that surface albedo plays important roles in gloss perception. For example, if two objects have the same specular reflectance, a black object, which has low albedo, is perceived to be glossier than a white object, which has high albedo. The nonlinear form of this parameter can be understood as follows. First, the intensity of light reflected from an object surface changes in proportion to ρd, but lightness perception changes nonlinearly. Many studies have examined the relationship between light intensity and lightness perception. It has been shown, for example, that with regard to the lightness of Munsell color charts, lightness perception is well represented by the cube root of the surface albedo (Glasser et al., 1958), and this function (cube root) was employed as the lightness scale when the CIE (Commission Internationale de l'Eclairage) uniform color space was formalized. It is therefore heuristically reasonable to use as a parameter to represent surface lightness. It should be noted, however, that the cube root is a function empirically derived in past studies and should not be taken as a unique solution. Instead, other functions (e.g., logarithmic functions) can also be fit to the relationship between surface albedo and lightness perception. Presumably, the nonlinear relationship between surface albedo and lightness perception, which is approximated by cube root or log functions, but not by a specific function, is important. We would expect that the neural representation of perceived gloss in the IT cortex incorporate that relationship as an essential component. To summarize, the results of this analysis suggest that three important parameters closely associated with perceived gloss of an object surface can be recovered from the population responses of gloss-selective neurons in the IT cortex.
Relationship to perceived glossiness
The results of the present study are consistent with the idea that gloss-selective IT neurons are closely related to gloss perception, as we assumed in the Introduction. In our daily life, we often treat variation of the degree of glossiness as if it was a scalar variable changing along a one-dimensional scale, and make judgments about whether one object is glossier than another, even when the surface reflectance properties of the two objects differ in different dimensions. Such casual experience is related to the fact that in the c/d space proposed by Ferwerda et al. (2001), positional shifts in two different directions along the c- and d-axes over the same distance (taking into consideration a scaling factor) yield similar amounts of change in perceived glossiness. However, we think it is unlikely that the response magnitudes among the gloss-selective neurons examined in the present study reflect the perceived glossiness of an object in such a scalar fashion. If gloss-selective neurons represent perceived glossiness in a scalar fashion, we would expect that the response contour of these neurons would incline toward the upper-right in the c/d plane, and the tuning directions would cluster around 45°. However, the tuning directions of these neurons distributed widely in the c/d plane, and only few neurons were tuned around 45°. This suggests these neurons are not the neural correlates of perceived glossiness. Instead, we should consider them to represent perceptual gloss parameters that are transformed from physical parameters closely related to the surface gloss of objects.
Surface gloss changes depending on an object's surface reflection properties but is also affected by the illumination environment and the object's shape. It is not mathematically possible to precisely estimate surface reflection properties from a single image, and it is not yet understood how our visual system solves this inverse problem to achieve gloss perception, and broad arguments on the possible mechanism have been made (Nishida and Shinya, 1998; Dror et al., 2001; Fleming et al., 2003; Motoyoshi et al., 2007; Anderson and Kim, 2009; Wijntjes and Pont, 2010; Anderson, 2011; Olkkonen and Brainard, 2011; Kim et al., 2012; Fleming, 2014). The present study provides new evidence about how the parameters may be represented by gloss-selective neurons and also provides a clue to the neural mechanisms of gloss perception. Future detailed analysis of the response characteristics of gloss-selective neurons and the source of inputs to these neurons will be important to further our understanding of the visual information processing related to gloss perception in the visual cortex. In addition, one intriguing way to further validate our conclusion that gloss-selective neurons are closely associated with gloss perception is to use stimuli in which highlights are manipulated as was done by Anderson and Kim (2009) in their psychophysics, but this is also a subject remained for future experiment.
Footnotes
This work was supported by Grant-in-Aid for Scientific Research on Innovative Areas “Shitsukan” (22135007 and 25135737) from MEXT, Japan to T. S., N.G., and H.K. We thank M. Takagi for technical assistance.
The authors declare no competing financial interests.
References
- Adelson EH. On seeing stuff: the perception of materials by humans and machines. Proc SPIE. 2001;4299:1–12. doi: 10.1117/12.429489. [DOI] [Google Scholar]
- Afraz SR, Kiani R, Esteky H. Microstimulation of inferotemporal cortex influences face categorization. Nature. 2006;442:692–695. doi: 10.1038/nature04982. [DOI] [PubMed] [Google Scholar]
- Anderson BL. Visual perception of materials and surfaces. Curr Biol. 2011;21:R978–R983. doi: 10.1016/j.cub.2011.11.022. [DOI] [PubMed] [Google Scholar]
- Anderson BL, Kim J. Image statistics do not explain the perception of gloss and lightness. J Vis. 2009;9(11):10, 1–17. doi: 10.1167/9.11.10. [DOI] [PubMed] [Google Scholar]
- Beck J, Prazdny S. Highlights and the perception of glossiness. Percept Psychophys. 1981;30:407–410. doi: 10.3758/BF03206160. [DOI] [PubMed] [Google Scholar]
- Blake A, Bülthoff H. Does the brain know the physics of specular reflection? Nature. 1990;343:165–168. doi: 10.1038/343165a0. [DOI] [PubMed] [Google Scholar]
- Conway BR, Moeller S, Tsao DY. Specialized color modules in macaque extrastriate cortex. Neuron. 2007;56:560–573. doi: 10.1016/j.neuron.2007.10.008. [DOI] [PMC free article] [PubMed] [Google Scholar]
- Cook RL, Torrance KE. A reflectance model for computer graphics. ACM Trans Graph. 1982;1:7–24. doi: 10.1145/357290.357293. [DOI] [Google Scholar]
- Desimone R, Albright TD, Gross CG, Bruce C. Stimulus-selective properties of inferior temporal neurons in the macaque. J Neurosci. 1984;4:2051–2062. doi: 10.1523/JNEUROSCI.04-08-02051.1984. [DOI] [PMC free article] [PubMed] [Google Scholar]
- Doerschner K, Maloney LT, Boyaci H. Perceived glossiness in high dynamic range scenes. J Vis. 2010;10(9):11, 1–11. doi: 10.1167/10.9.11. [DOI] [PMC free article] [PubMed] [Google Scholar]
- Dror RO, Adelson EH, Willsky AS. Surface reflectance estimation and natural illumination statistics. Proceedings of IEEE Workshop on Statistical and Computational Theories of Vision; Vancouver, Canada. 2001. [Google Scholar]
- Ferwerda J, Pellacini F, Greenberg D. A psychophysically-based model of surface gloss perception. Proc SPIE. 2001;4299:291–301. doi: 10.1117/12.429501. [DOI] [Google Scholar]
- Fleming RW. Visual perception of materials and their properties. Vis Res. 2014;94:62–75. doi: 10.1016/j.visres.2013.11.004. [DOI] [PubMed] [Google Scholar]
- Fleming RW, Dror RO, Adelson EH. Real-world illumination and the perception of surface reflectance properties. J Vis. 2003;3(5):3, 347–368. doi: 10.1167/3.5.3. [DOI] [PubMed] [Google Scholar]
- Glasser LG, McKinney AH, Reilly CD, Schnelle PD. Cube-root color coordinate system. J Opt Soc Am A. 1958;48:736–740. doi: 10.1364/JOSA.48.000736. [DOI] [Google Scholar]
- Hunter RS, Harold RW. The measurement of appearance. Ed 2. New York: Wiley; 1987. [Google Scholar]
- Jagadeesh B, Chelazzi L, Mishkin M, Desimone R. Learning increases stimulus salience in anterior inferior temporal cortex of the macaque. J Neurophysiol. 2001;86:290–303. doi: 10.1152/jn.2001.86.1.290. [DOI] [PubMed] [Google Scholar]
- Janssen P, Vogels R, Liu Y, Orban GA. Macaque inferior temporal neurons are selective for three-dimensional boundaries and surfaces. J Neurosci. 2001;21:9419–9429. doi: 10.1523/JNEUROSCI.21-23-09419.2001. [DOI] [PMC free article] [PubMed] [Google Scholar]
- Kim J, Marlow PJ, Anderson BL. The dark side of gloss. Nat Neurosci. 2012;15:1590–1595. doi: 10.1038/nn.3221. [DOI] [PubMed] [Google Scholar]
- Komatsu H, Ideura Y, Kaji S, Yamane S. Color selectivity of neurons in the inferior temporal cortex of the awake macaque monkey. J Neurosci. 1992;12:408–424. doi: 10.1523/JNEUROSCI.12-02-00408.1992. [DOI] [PMC free article] [PubMed] [Google Scholar]
- Köteles K, De Mazière PA, Van Hulle M, Orban GA, Vogels R. Coding of images of materials by macaque inferior temporal cortical neurons. Eur J Neurosci. 2008;27:466–482. doi: 10.1111/j.1460-9568.2007.06008.x. [DOI] [PubMed] [Google Scholar]
- Kovács G, Sáry G, Köteles K, Chadaide Z, Tompa T, Vogels R, Benedek G. Effects of surface cues on macaque inferior temporal cortical responses. Cereb Cortex. 2003;13:178–188. doi: 10.1093/cercor/13.2.178. [DOI] [PubMed] [Google Scholar]
- Maloney LT, Brainard DH. Color and material perception: achievements and challenges. J Vis. 2010;10(9):19, 1–16. doi: 10.1167/10.9.19. [DOI] [PMC free article] [PubMed] [Google Scholar]
- Marlow PJ, Kim J, Anderson BL. The perception and misperception of specular surface reflectance. Curr Biol. 2012;22:1909–1913. doi: 10.1016/j.cub.2012.08.009. [DOI] [PubMed] [Google Scholar]
- Matsumora T, Koida K, Komatsu H. Relationship between color discrimination and neural responses in the inferior temporal cortex of the monkey. J Neurophysiol. 2008;100:3361–3374. doi: 10.1152/jn.90551.2008. [DOI] [PubMed] [Google Scholar]
- Matusik W, Pfister H, Brand M, McMillan L. A data-driven reflectance model. ACM Trans Graph. 2003;22:759–769. doi: 10.1145/882262.882343. [DOI] [Google Scholar]
- Motoyoshi I, Nishida S, Sharan L, Adelson EH. Image statistics and the perception of surface qualities. Nature. 2007;447:206–209. doi: 10.1038/nature05724. [DOI] [PubMed] [Google Scholar]
- Ngan A, Durand F, Matusik W. Experimental analysis of BRDF models. Proc Eurograp Symp Rendering. 2005;2:117–226. [Google Scholar]
- Nishida S, Shinya M. Use of image-based information in judgments of surface-reflectance properties. J Opt Soc Am A Opt Image Sci Vis. 1998;15:2951–2965. doi: 10.1364/JOSAA.15.002951. [DOI] [PubMed] [Google Scholar]
- Nishio A, Goda N, Komatsu H. Neural selectivity and representation of gloss in the monkey inferior temporal cortex. J Neurosci. 2012;32:10780–10793. doi: 10.1523/JNEUROSCI.1095-12.2012. [DOI] [PMC free article] [PubMed] [Google Scholar]
- Okazawa G, Goda N, Komatsu H. Selective responses to specular surfaces in the macaque visual cortex revealed by fMRI. Neuroimage. 2012;63:1321–1333. doi: 10.1016/j.neuroimage.2012.07.052. [DOI] [PubMed] [Google Scholar]
- Olkkonen M, Brainard DH. Joint effects of illumination geometry and object shape in the perception of surface reflectance. Iperception. 2011;2:1014–1034. doi: 10.1068/i0480. [DOI] [PMC free article] [PubMed] [Google Scholar]
- Sheinberg DL, Logothetis NK. The role of temporal cortical areas in perceptual organization. Proc Natl Acad Sci U S A. 1997;94:3408–3413. doi: 10.1073/pnas.94.7.3408. [DOI] [PMC free article] [PubMed] [Google Scholar]
- Sripati AP, Olson CR. Responses to compound objects in monkey inferotemporal cortex: the whole is equal to the sum of the discrete parts. J Neurosci. 2010;30:7948–7960. doi: 10.1523/JNEUROSCI.0016-10.2010. [DOI] [PMC free article] [PubMed] [Google Scholar]
- Ward G. Measuring and modeling anisotropic reflection. Proceedings of the 19th annual conference on computer graphics and interactive techniques; New York: ACM; 1992. pp. 265–272. [Google Scholar]
- Wijntjes MW, Pont SC. Illusory gloss on Lambertian surfaces. J Vis. 2010;10(9):13, 1–12. doi: 10.1167/10.9.13. [DOI] [PubMed] [Google Scholar]
- Xiao B, Brainard DH. Surface gloss and color perception of 3D objects. Vis Neurosci. 2008;25:371–385. doi: 10.1017/S0952523808080267. [DOI] [PMC free article] [PubMed] [Google Scholar]
- Yamane Y, Carlson ET, Bowman KC, Wang Z, Connor CE. A neural code for three-dimensional object shape in macaque inferotemporal cortex. Nat Neurosci. 2008;11:1352–1360. doi: 10.1038/nn.2202. [DOI] [PMC free article] [PubMed] [Google Scholar]