

Abstract
The ventromedial prefrontal cortex (vmPFC) plays a critical role in a number of evaluative processes, including risk assessment. Impaired discrimination between threat and safety is considered a hallmark of clinical anxiety. Here, we investigated the circuit-wide structural and functional mechanisms underlying vmPFC threat–safety assessment in humans. We tested patients with generalized anxiety disorder (GAD; n = 32, female) and healthy controls (n = 25, age-matched female) on a task that assessed the generalization of conditioned threat during fMRI scanning. The task consisted of seven rectangles of graded widths presented on a screen; only the midsize one was paired with mild electric shock [conditioned stimulus (CS)], while the others, safety cues, systematically varied in width by ±20, 40, and 60% [generalization stimuli (GS)] compared with the CS. We derived an index reflecting vmPFC functioning from the BOLD reactivity on a continuum of threat (CS) to safety (GS least similar to CS); patients with GAD showed less discrimination between threat and safety cues, compared with healthy controls (Greenberg et al., 2013b). Using structural, functional (i.e., resting-state), and diffusion MRI, we measured vmPFC thickness, vmPFC functional connectivity, and vmPFC structural connectivity within the corticolimbic systems. The results demonstrate that all three factors predict individual variability of vmPFC threat assessment in an independent fashion. Moreover, these neural features are also linked to GAD, most likely via an vmPFC fear generalization. Our results strongly suggest that vmPFC threat processing is closely associated with broader corticolimbic circuit anomalies, which may synergistically contribute to clinical anxiety.
Keywords: anxiety, fear conditioning, connectivity, tractography, resting-state, fear generalizaton
Introduction
Anxiety disorders are the most widespread class of psychiatric disorders, with a lifetime prevalence of 28.8% (Kessler et al., 2005). Previous research has linked various fear-learning processes to anxiety, including fear generalization (Kheirbek et al., 2012; Lissek, 2012) and impaired regulation of conditioned fear, extinction learning, and learning recall (Milad and Quirk, 2012). The ventromedial prefrontal cortex (vmPFC) is frequently implicated in impaired fear learning in anxiety disorder (Milad and Rauch, 2007). Indeed, individuals with clinical anxiety show a less discriminate vmPFC response to a continuum of threat and safety cues (Greenberg et al., 2013b).
The vmPFC integrates cognitive and affective processes, via an extensive convergence of corticolimbic afferents, in computing affective value and mediating adaptive behavior (Damasio, 1996; Roy et al., 2012). During threat processing, in particular, the vmPFC interacts with the corticolimbic system to mediate a number of coordinated responses, including the prefrontal attentional network (Bishop et al., 2004; Hare et al., 2009), the hippocampus/parahippocampal gyrus (Kalisch et al., 2006; Milad et al., 2007; Sierra-Mercado et al., 2011), the thalamus for fear learning (Mitchell and Gaffan, 2008; Cross et al., 2012; Parnaudeau et al., 2013), and the amygdala for regulating the fear response (Phelps et al., 2004; Sierra-Mercado et al., 2011). VmPFC function thus appears to depend upon the dynamics of a larger circuit.
Anatomical studies provide further support for the integrative role of the vmPFC (Price, 2007; Lehman et al., 2011). VmPFC morphometric variability, measured via thickness, appears to contribute to vmPFC function. Previous research reports that individuals with thicker vmPFCs show greater fear extinction memory as per physiological responses (Milad et al., 2005; Hartley et al., 2011); however, to our best knowledge, a direct link between vmPFC structural and functional variability has yet to be shown.
Based on this literature, we hypothesized that an individual's efficiency at vmPFC threat processing is explained by the vmPFC gray matter structure and the vmPFC connectivity pattern with the corticolimbic system. To that end, we tested patients with generalized anxiety disorder (GAD) and healthy controls on a task that assesses threat generalization in response to cues that vary in perceptual similarity to an electric shock conditioned stimulus (CS) during fMRI scanning. We derived an index of threat–safety discrimination based on the vmPFC BOLD reactivity during the threat generalization task, of which GAD patients showed less discrimination between threat and safety cues as compared to controls (Greenberg et al., 2013b). Then, using structural MRI, diffusion-weighted imaging tractography, and resting-state functional connectivity mapping, we measured vmPFC thickness and vmPFC structural and functional connectivity with corticolimbic systems. We found, first, that individual differences of vmPFC functioning during fear generation task are associated with the circuit-wide neural features and, second, that these neural factors are associated with clinical anxiety, an effect most likely to be mediated by vmPFC fear generalization. Altogether, our results support a brain connectivity-based multivariate etiological model of pathophysiology of anxiety.
Materials and Methods
Participants.
We recruited 57 participants (all female; age-matched; mean age, 22.3 ± 4.5 years). This study was approved by the Stony Brook University Institutional Review Board; all subjects provided written informed consent. To reflect the higher prevalence of anxiety disorders in females and to minimize sample heterogeneity, we included only females in the study. Psychiatric diagnoses were based on the Diagnostic and Statistical Manual of Mental Disorders, Fourth Edition (DSM-IV), through both an informal clinical interview and structured clinical interview for DSM-IV Axis I disorders. This procedure confirmed the diagnoses of GAD in the patient group (n = 32) and absence of Axis I diagnoses in the control group (n = 25). Of the 32 patients, 17 had comorbid major depressive disorder. All controls were free of any current or past psychiatric conditions. To avoid medication-related confounds, patients were free from psychiatric medication for ≥6 months before the time of the experiment. All 57 participants underwent four MR scans: fMRI during the fear generalization task, resting-state MRI, diffusion MRI (dMRI), and structural MRI.
Procedure.
The fear generalization task consisted of a prescan fear-conditioning phase and a fear generalization fMRI phase (Greenberg et al., 2013a). Before the acquisition phase, we adjusted amplitude of electric shock (in milliamperes) to a level that was “uncomfortable but not painful” for each subject. We then instructed participants that only one of the visual stimuli (i.e., a midsized red rectangle) would be paired with the shock (500 ms long; delivered 1500 ms after the cue onset). We administered the acquisition phase after the participants were positioned in a scanner. Each cue was presented for 2 s. CS was presented (five times in total) with electric shocks (100% delivery chance) and six rectangles with varying widths [generalization stimuli (GS)] were presented once each without shock in a pseudorandom order. Trials were separated by jittered fixation screens. After fear conditioning, we immediately initiated fear generalization.
Task: fear generalization.
The experimental paradigm has been previously published (Greenberg et al., 2013a). The task consisted of 120 trials (15 trials × 8 conditions; 6 GS, CS with shocks, and CS without shocks). The stimuli were seven red rectangles with identical height (56 pixels) and varying widths (112–448 pixels). The midsized rectangle (280 pixels) served as the CS. The six remaining rectangles differed by ±20, ±40, or ±60% in width from the CS and served as the GS (Fig. 1A). Each stimulus was presented pseudorandomly for 2 s with a jittered interstimulus interval ranging from 4 to 10 s, during which a white fixation cross was shown on a black background. The duration of the task was 15 min and 24 s.
Figure 1.

Fear generalization paradigm. A, Fear generalization paradigm. Red rectangle stimuli with systematic length variation of ±60, ±40, ±20% from CS were used as GS. Before MRI scanning, Participants underwent a brief conditioning session consisting of a single 2 s presentation of each of the GSs and five of the CSs paired with a pretitrated electrical shock in a pseudorandom order. A 4–10 s interstimulus interval was used. For the generalization phase, in a pseudorandom order, we presented each stimulus 30 times with a 50% chance of shock with the CS+. B, Group differences in the vmPFC activity gradient across stimuli. Patients showed less discriminating vmPFC activity revealed by a decrease in the slope of the linear fit. These data have been previously reported (Greenberg et al., 2013a) and the slope of the linear fit was used to index vmPFC functioning during the fear generalization task in this study. Shaded areas represent ± one SE.
MRI data acquisition.
Participants were scanned with a 3T Siemens Trio scanner at the Stony Brook University Social, Cognitive and Affective Neuroscience center. We acquired 440 T2*-weighted echo planar images for the fear-generalization task and 143 T2*-weighted echo planar images for the resting-state task. These were acquired with an oblique coronal angle and with the following parameters: TR, 2100 ms; TE, 23 ms; flip angle, 83°; matrix, 96 × 96; FOV, 224 × 224 mm; 37 slices; slice thickness, 3.5 mm. For structural scans, T1-weighted images were acquired with the following parameters: TR, 1900 ms; TE, 2.53 ms; flip angle, 9°; FOV, 176 × 250 × 250 mm; matrix, 176 × 256 × 256; voxel size, 1 × 0.98 × 0.98 mm. dMRIs and resting-state fMRIs were collected in separate sessions. We collected dMRIs using the following parameters: TR, 5500 ms; TE, 93 ms; FOV, 220 × 220 mm; matrix, 120 × 220 × 220; voxel size, 1.7 × 1.7 × 3.0 mm; EPI factor, 128; 40 slices; slice thickness, 3 mm; bandwidth, 1396 Hz/pixel; Generalized Autocalibrating Partially Parallel Acquisition acceleration factor, 2; the series included two initial images acquired without diffusion weighting and with diffusion weighting along 40 noncollinear directions (b = 800 s/m−2). We collected resting-state fMRIs, each over 5 min and consisting of 143 volumes, using the same scanning parameters as those for the fear generalization task.
fMRI analyses: generalization task.
We used the same fear generalization data here as in our previous report (Greenberg et al., 2013b). We also used the same measure as Greenberg et al. to index vmPFC function: the slope of linear fit of the vmPFC BOLD activity gradient across each stimulus (Fig. 1B). This provides an easily interpretable index on the generalization effect (Table 1).
Table 1.
Logistic regression results reveal linear fit of vmPFC activation gradient best predicting group status
| Model summary |
Variables in the model |
||||||||
|---|---|---|---|---|---|---|---|---|---|
| −2 Log likelihood | χ2 | Δχ2 | Significance | Variable | B | SE | df | Significance | |
| Step 1 | 70.74 | 7.41 | 0.19 | 60–40% | 14.59 | 58,526.455 | 1 | 1 | |
| — | — | 40–20% | 18.92 | 78,035.273 | 1 | 1 | |||
| 20–CS% | 14.33 | 58,526.455 | 1 | 1 | |||||
| 60%–fixation | −0.97 | 1.052 | 1 | 0.36 | |||||
| Linear fit (60 ∼ CS) | 48.54 | 195,088.183 | 1 | 1 | |||||
| Step 2 | 71.48 | 6.68 | 0.15 | 60–40% | 0.30 | 0.519 | 1 | 0.57 | |
| −0.74 | 0.39 | 20–CS% | 0.28 | 0.438 | 1 | 0.52 | |||
| 60%–baseline | −0.68 | 0.963 | 1 | 0.48 | |||||
| Linear fit (60 ∼ CS) | 1.85 | 1.732 | 1 | 0.29 | |||||
| Step 3 | 71.81 | 6.35 | 0.09 | 20%–CS% | 0.39 | 0.396 | 1 | 0.32 | |
| −0.33 | 0.56 | 60%–baseline | −0.30 | 0.698 | 1 | 0.67 | |||
| Linear fit (60 ∼ CS) | 2.23 | 1.634 | 1 | 0.17 | |||||
| Step 4 | 71.99 | 6.16 | 0.04 | 20–CS% | 0.47 | 0.355 | 1 | 0.18 | |
| −0.18 | 0.66 | Linear fit (60 ∼ CS) | 2.73 | 1.181 | 1 | 0.02 | |||
| Step 5 | 73.88 | 4.28 | 0.03 | Linear fit (60 ∼ CS) | 1.87 | 0.947 | 1 | 0.05 | |
| −1.88 | 0.17 | ||||||||
B, parameter estimates; linear fit (60∼CS), a linear fit of the all four conditions (GS 60, 40, 20, and CS), which was previously reported (Greenberg et al., 2013a).
We performed standard preprocessing procedures, including motion correction, normalization, and smoothing with a 6 mm Gaussian kernel in SPM 8 (www.fil.ion.ucl.ac.uk/spm). For the first-level model, we entered five regressors (i.e., onsets of GS ± 60%, GS ± 40%, GS ± 20%, CS with shocks, CS without shocks) and six motion parameters. Serial autocorrelations were modeled using a first-order autoregressive process and canonical HRF was used for the basis function in model estimation. For the fear generalization gradient in the vmPFC, we first tested whether the vmPFC showed significant activation across the stimuli, by conducting a region of interest (ROI) analysis for effects of interest at corrected p < 0.05. We then extracted the first eigenvariate within a 6-mm-radius sphere centered on the local maxima (p < 0.05, FWE corrected) for each of the “CS (unpaired with shock)–baseline,” “GS 20%–baseline,” “GS 40%–baseline,” and “GS 60%–baseline” contrasts across all participants. Mean values for each of the four contrasts were plotted as a four-point gradient. We calculated a slope of a linear fit of these values in each participant.
fMRI: resting-state intrinsic functional connectivity.
We collected resting-state fMRIs in a separate session. Participants were instructed to view a white fixation crosshair centrally presented on black background for 5 min. We conducted resting-state functional connectivity analyses using the Functional Connectivity Toolbox (http://www.nitrc.org/projects/conn/). This approach uses a robust correction method for non-neural noise correlations to minimize spurious negative correlations often resulting from regressing out a global signal (Behzadi et al., 2007). We applied standard preprocessing procedures in SPM 8, including realignment, smoothing with a 6 mm FWHM, and normalization. Preprocessed images were filtered between 0.01 and 0.1 Hz. After preprocessing, we conducted vmPFC-seeded connectivity mapping in each subject (i.e., first-level analysis). We derived the vmPFC mask from the fear generalization fMRI result: a 6-mm-radius sphere centered on the group maxima in effects of interest. The vmPFC-seeded correlation maps (i.e., Fisher-transformed Pearson's correlation coefficients) were entered into a second-level random-effect model. To examine the association between functional coupling and the vmPFC fear generalization gradient, we entered mean-centered (by each group) vmPFC fear generalization gradients (i.e., slopes of linear fit; Fig. 1B) as a covariate, and group as a between-subject factor.
We investigated correlational effects in several ROIs. Bilateral ROI masks were derived from the Automated Anatomical Labeling atlas (http://www.sph.sc.edu/comd/rorden/template.html). Based on the well established corticolimbic fear circuit, we chose the following subcortical ROIs: the amygdala (Phelps et al., 2004; Sierra-Mercado et al., 2011), hippocampus/parahippocampal gyrus (Kalisch et al., 2006; Milad et al., 2007; Sierra-Mercado et al., 2011), and thalamus (Mitchell and Gaffan, 2008; Cross et al., 2012; Parnaudeau et al., 2013), as well as the PFC (S. Bishop et al., 2004; Hare et al., 2009). For exploratory purposes, we examined the pallidal and striatal regions, in which no significant association with the vmPFC fear generalization gradient was found. We divided the PFC mask into two subregions: dorsal [middle frontal gyrus (MFG)] and ventral [inferior frontal gyrus (IFG)]. In each ROI, we identified significant clusters at corrected α of 0.05 using Analysis of Functional NeuroImage software's 3dClustSim (http://afni.nimh.nih.gov/pub/dist/doc/program_help/3dClustSim.html). We estimated ROI-specific minimum cluster sizes with a peak p threshold of 0.005, which correspond to an α of ≥0.05, using Monte Carlo simulations with 10,000 iterations. VmPFC-seeded amygdala connectivity failed to reach a significance of p < 0.05. Given the well established importance of the vmPFC–amygdala connectivity in fear conditioning (Phelps et al., 2004; Price, 2007; Hartley et al., 2011; Milad and Quirk, 2012; Roy et al., 2012; Sotres-Bayon et al., 2012), we also conducted an amygdala-seeded connectivity analysis. We used separate masks for the left and right amygdala, based on lateralization of amygdalar responses (Baas et al., 2004). For this analysis, we used the SPM small-volume correction with a 6-mm-radius sphere search limit centered on the a priori coordinates of the vmPFC (MNI: ±4, 40, −20), which was based on group maxima for the F contrast of effects-of-interest during the fear generalization fMRI task. For scatter plots and post hoc correlation analyses, we extracted coefficients in each ROI by applying a 6-mm-radius sphere centered on the peak coordinates.
Structural MRI analyses: cortical thickness.
We performed cortical parcellation and morphometric analyses using Freesurfer (http://surfer.nmr.mgh.harvard.edu/). This automated analysis pipeline includes segmentation, tessellation, and topological correction of the reconstructed surface. After the surface reconstruction, mean vmPFC thickness values were measured in each hemisphere according to the Desikan–Killiany cortical atlas in Freesurfer. We used an atlas for the medial orbital frontal cortex that includes the a priori coordinate of vmPFC fear generalization gradient. For a vertex-wise analysis, the individual data were smoothed with 10 mm FWHM kernel. We used a general linear model to examine the relationship between the thickness and the vmPFC fear generalization gradient, using the mean-centered (by group) vmPFC fear generalization gradients as a covariate and group as a between-subject factor.
dMRI: probabilistic tractography and Tract-Based Spatial Statistics.
We used dMRI to evaluate the structural connectivity between the vmPFC and the fear circuit, including the anterior thalamic radiation (ATR), the cingulum cingulate gyrus (CCG), and the uncinate fasciculus (UF). We first stripped the skull in the diffusion-weighted images and then performed eddy-current and head-motion correction by registering them to reference volumes, which are standard dMRI preprocessing steps as implemented in the Functional MRI of the Brain Software Library (FSL) package (www.fmrib.ox.ac.uk/fsl). Fractional anisotropy (FA) values were calculated for each voxel by fitting a tensor model in FSL.
We used a global tractography approach, Tracula (Yendiki et al., 2011), to reconstruct the entirety of our a priori white matter tracts. This approach has several advantages: (1) it eschews local uncertainty issues caused by noise or partial volume effects that may deviate tracts in step-by-step local tractography, (2) it increases sensitivity and robustness of the results by informing the tractography algorithms of surrounding anatomy of a given tract, and (3) it minimizes biases caused by the need for manual intervention, as is the case of local tractography (i.e., drawing ROIs or setting up an arbitrary threshold for angle or length). This approach was particularly suited to the current study in that it provides a useful single variable (i.e., mean FA) per subject and per tract, which could be used in a multiple-regression model with other neural indices. We performed this global tractography procedure for all participants and visually inspected the reconstructed tracts. For four participants who showed unsuccessful tracts, we ran the procedure again with new initialization points for the Markov Chain Monte Carlo algorithm for each tract. We then extracted mean FA from the estimated posterior distribution map of the tracts of interest.
To complement this tract-wise approach, we conducted voxelwise analyses on FA maps using Tract-Based Spatial Statistics as a part of the FSL package. We aligned FA images into a standard MNI space using nonlinear registration in FSL. A mean FA image was created and thinned to create an FA skeleton representing centers of all tracts common to the group. We then projected each aligned FA image onto this skeleton. We determined the effects of group, the vmPFC fear generalization gradient and the group × fear generalization gradient interaction on FA maps, while including age and total white matter volume as regressors of no interest by means of randomization method (10,000 permutations). We used a combination of threshold-free cluster enhancement and FWE method to correct for multiple comparisons (corrected p < 0.05).
Correlation and regression.
To evaluate correlations between the fear generalization gradient and the neural features, we conducted Pearson's partial correlation analyses, controlling for effects of group and age. Intracranial volume was included as an additional covariate for the vmPFC thickness analyses. We diagnosed outliers at a threshold of Cook's distance of one. Additionally, we performed robust linear regression analyses: models included fear generalization gradient as the dependent variable; group and each neural feature as the independent variables; and age, intracranial volume (in case of thickness), and whole-brain FA (in case of FA) as confounding variables. We examined the impact of clinical anxiety on FA values using a general linear model where group was entered as factor, while age and whole-brain FA were entered as covariates. We also included depressive symptom scales for confounding (Mood and Anxiety Symptom Questionnaire: general distress depression and anhedonic depression; Clark and Watson, 1991).
For the hierarchical regression model, we extracted the coupling estimates from the resting-state fMRI analyses from all the voxels within a 6-mm-radius sphere centered on group maximum in each ROI. We examined whether this statistically nonindependent approach (i.e., selecting a peak voxel in each subject based on the group results) caused a bias (Kriegeskorte et al., 2009). We first reran group correlation analyses using a leave-one-out (LOO) method and extracted peak voxel coordinates within the anatomical ROIs iteratively. We then calculated Euclidian distances in each ROI between a peak voxel of the LOO models and the all-subjects model iteratively. As a result, mean distances were <1 voxel apart: for the IFG, 2.0 ± 0.37 (SE) mm; the thalamus, 2.5 ± 0.07 mm; the parahippocampal gyrus (PHG), 1.0 ± 0.05 mm; and the amygdala, 1.7 ± 0.02 mm. Given the 6 mm FWHM for spatial smoothing applied to the fMRI data, the potential bias due to nonindependent method may be tolerable.
We tested five models with different block entry order. We observed that a model with the intrinsic coupling entered first showed reduced ΔR2 of subsequent blocks [intrinsic functional connectivity-FA-cortical thickness (IC-FA-CT) model: ICΔR2, 0.479 (p < 0.001); FAΔR2, 0.071 (p = 0.107); CTΔR2, 0.064 (p = 0.014); IC-CT-FA model: CTΔR2, 0.038 (p = 0.074); FAΔR2, 0.097 (p = 0.028)]. A confirmatory regression analysis without the block terms was performed. This analysis checked all the possible models and selected a best subset. Neither outliers (Cook's distances, <0.18) nor multicollinearity (tolerances, >0.70) was observed.
Structural equation modeling.
Using structural equation modeling in Amos 18 (SPSS), we tested whether the neural correlates of the vmPFC fear generalization impact clinical anxiety. We included all neural correlates of the vmPFC generalization gradient. We then introduced a latent variable to estimate collective effects of FA values (of the tracts) on functional connectivity measures (of the regions). Once specifying an initial model, we modified it referencing modification indices in every iteration of estimation to improve model fits, using the maximum likelihood method. This step involved modeling correlations between variables: ATR and vmPFC–PHG, ATR and CCG, CCG and vmPFC–PHG, vmPFC thickness and vmPFC–IFG, vmPFC–thalamus and vmPFC–PHG, and vmPFC–thalamus and vmPFC–amygdala.
Results
Characterization of the vmPFC fear generalization response
During fear generalization, vmPFC activation showed a significant group difference as a function of perceptual similarity of cues to the CS. Patients with GAD showed a less discriminating vmPFC response during safety versus threat, compared with healthy controls (for group difference results, see Greenberg et al., 2013b). We then identified the contrast for which vmPFC BOLD estimates best predicted clinical anxiety: we conducted a logistic binary regression analysis using group as the dependent variable and 10 potentially meaningful contrasts among the four conditions. Indeed, we found that the slope of linear fit on all stimuli was the best predictor [control, −0.33 ± 0.06 (SE); GAD, −0.18 ± 0.06; Table 1]. Therefore, we used the slope of vmPFC gradient as an index of vmPFC functioning in the following analyses.
Thickness predicts the vmPFC fear generalization response
We assessed whether mean thickness of the vmPFC was associated with vmPFC reactivity during fear generalization. We found that a reduction in left vmPFC thickness correlated with a less discriminate vmPFC response (r(51) = −0.46, p = 0.001, two-tailed; partial correlation controlling for group, age, and intracranial volume; Table 2; Fig. 2). No association was observed in the right vmPFC (p > 0.42). We confirmed this with a vertex-based, whole-brain surface approach. Peak correlation between cortical thickness and the fear generalization gradient occurred in the left vmPFC (peak vertex: p = 0.0004; MNI: −11, 39, −11; size of cluster, 45.52 mm2 at uncorrected p of 0.001). Of note, the peak coordinate was proximal (11 mm apart; Euclidean distance) to the coordinate of the peak vmPFC fear generalization gradient effect (MNI: −4, 40, −20; Greenberg et al., 2013b). Given this strong correlation, we hypothesized that patients with GAD would show vmPFC thinning. We found no significant effects of group on vmPFC thickness (p > 0.44; General Linear Modeling containing age, intracranial volume, and self-reported depressive symptoms as controlling variables). These results strongly support a positive association between gray matter structural integrity and vmPFC function in generalizing threat.
Table 2.
Partial correlations of neural metrics and the vmPFC generalization gradient
| GEN vmPFC |
||||||
|---|---|---|---|---|---|---|
| Both groups |
Controls |
GAD |
||||
| R | p | r | p | r | p | |
| CTlh | −0.46*** | 5 × 10⁻⁴ | −0.45* | 0.04 | −0.47** | 0.008 |
| CTrh | −0.11 | 0.42 | −0.15 | 0.49 | −0.12 | 0.53 |
| FA ATRlh | −0.38** | 0.006 | −0.48* | 0.02 | −0.31 | 0.10 |
| FA ATRrh | 0.05 | 0.71 | −0.17 | 0.41 | 0.05 | 0.79 |
| FA CCGlh | −0.37** | 0.008 | −0.4* | 0.05 | −0.34 | 0.07 |
| FA CCGrh | −0.34* | 0.01 | −0.41* | 0.05 | −0.30 | 0.11 |
| FA UFlh | −0.39* | 0.04 | −0.62** | 0.002 | −0.05 | 0.78 |
| FA UFrh | −0.19 | 0.18 | −0.44 | 0.03 | 0.01 | 0.95 |
| IC Am | 0.47*** | 6 × 10⁻⁴ | 0.54** | 0.009 | 0.41* | 0.03 |
| IC Th | −0.50*** | 2 × 10⁻⁴ | −0.24 | 0.12 | −0.60*** | 2 × 10⁻⁴ |
| IC Ph | 0.43** | 0.002 | 0.31 | 0.16 | 0.58** | 0.002 |
| IC MFG | −0.49*** | 4 × 10⁻⁴ | −0.42* | 0.05 | −0.55** | 0.003 |
| IC INS | 0.02 | 0.91 | −0.58** | 0.005 | 0.59** | 0.001 |
| IC Am-PH | 0.34* | 0.02 | 0.43* | 0.04 | 0.29 | 0.14 |
Control variables included group (for “Both groups”) and age (cortical thickness and FA). Am, amygdala; CT, cortical thickness; GEN, generalization gradient; IC, intrinsic functional coupling; INS, insula; lh, left hemisphere; PH, parahippocampal gyrus; rh, right hemisphere; Th, thalamus.
*p < 0.05;
**p < 0.01;
***p < 0.005.
Figure 2.

vmPFC cortical thickness correlates with the vmPFC fear generalization response. A, Anatomically defined vmPFC ROI for cortical thickness analyses shown in yellow; vmPFC ROI for fear generalization gradient shown in red. B, Scatter plot of vmPFC thickness and fear generalization, i.e., slopes of the linear fit. Participants with a greater vmPFC thickness showed a steeper slope (thus were more discriminating) of the fear generalization gradient. See Table 2 for correlation coefficients and significances.
White matter microstructure of prefrontal–subcortical pathway predicts the vmPFC fear generalization response
We then tested whether vmPFC structural connectivity with other components of the fear circuit would affect the vmPFC fear generalization gradient. To do this, we reconstructed three major white matter pathways converging in the mPFC (including the ventral portion)—the ATR, CCG, and UF—using an anatomically informed probabilistic tractography approach (Yendiki et al., 2011; Movie 1). We used the mean FA of each tract for correlation analyses. We found that a lower FA significantly correlated with a less discriminate vmPFC response in all the three tracts (left ATR: r(51) = −0.38, p = 0.006, two-tailed, partial correlation controlling for group and age; left CCG: r(51) = −0.37, p = 0.008; left UF: r(51) = −0.39, p = 0.037; Table 2; Fig. 3A–C). FA of the whole-brain and posterior tracts did not correlate with the vmPFC generalization gradient (p values > 0.16; by comparison, we observed a correlation at a trend level in the right superior longitudinal fasciculus parietal, r(51) = −0.27, p = 0.07). The correlation results were robust to outliers (p values < 0.026; robust regression). Furthermore, we examined effects of group on FA values. We performed a general linear model using group as a regressor, as well as age, whole-brain FA, and depressive symptoms as covariates. This model revealed a trend between clinical anxiety and decreased FA in the UF [Wald χ2 = 3.21, p = 0.073; estimated mean difference (control minus GAD), 0.26 ± 0.014], but not in the ATR or CCG (p values > 0.2).
Figure 3.

Integrity of the white matter fibers connecting the vmPFC with the fear circuit predicts the vmPFC fear generalization response. A–C, Scatter plots of the mean FA of the UF, the ATR, and the CCG versus vmPFC fear generalization. A reduced FA in each tract predicted a closer-to-zero vmPFC generalization gradient, hence more indiscriminating. The mean FA of the ATR and the CCG were correlated, r(51) = 0.49, p = 0.0001, but other combinations were not (all p values > 0.11). A histogram of each metric with Kolmogorov–Smirnov test results indicates a continuous distribution. D, Tract-Based Spatial Statistics revealed a similar pattern as the tractography results: lower FA values predicted a closer-to-zero vmPFC fear generalization gradient at corrected p < 0.05 (whole brain). Three reconstructed major tracts are shown in distinct colors. The vmPFC anatomical ROI (in yellow) and fear generalization (black circle) are also shown (middle, sagittal view). Significant effects were observed along the majority of the UF and the ATR tracts projecting to the ventral and dorsal portions of the fear circuit, respectively (right, axial view). Similarly, the anterior CCG projecting to the dorsal end of the vmPFC showed significant effects. Note that, along with the major tracts, local neighboring fibers adjacent to some of the fear circuit showed significant associations: these include the hippocampus, midbrain, thalamus, amygdala, and insula (arrowheads). Tracts that do not directly project to the vicinity of the prefrontal cortex also showed correlations: the putative, cortical spinal tract (around the midbrain region), and the longitudinal fasciculus.
Movie 1.
Reconstructed major white matter pathways using diffusion tractography. Three tracts of interest in the left hemisphere are shown: the ATR (red), the CCG (blue), and the UF (yellow). The tracts were first spatially normalized to the MNI space, then averaged across all subjects for the purpose of presentation.
To examine the local features of the effects within the tracts-of-interest and neighboring fear-circuit components, we then used a voxelwise statistical approach: Tract-Based Spatial Statistics (Smith et al., 2006). We confirmed the above negative correlation between the vmPFC fear generalization gradient and widespread fiber integrity, at whole-brain corrected p < 0.05 (Fig. 3D). Significant FA foci were found near the vmPFC along with the majority of the UF, ATR, and anterior portions of CCG and bordered key fear-circuit components, including the accumbens, amygdala, hippocampus, thalamus, and midbrain.
Intrinsic functional connectivity of vmPFC: fear circuit predicts the vmPFC fear generalization response
We next examined whether the vmPFC fear generalization gradient could be predicted by the extent to which the vmPFC was intrinsically coupled within the fear circuit (i.e., resting-state functional connectivity). Our regions of interest for the intrinsic coupling analyses included the thalamus, amygdala, PHG, MFG, and IFG. We observed significant associations between the vmPFC fear generalization and vmPFC coupling with the thalamus (z = 3.38; peak p = 3 × 10⁻⁴; cluster size, 77 voxels; MNI: −6, −14, 10), PHG (z = 3.28; peak p = 0.001; cluster size, 14 voxels; MNI: 18, −2, −26), amygdala (z = 3.30; peak p = 4 × 10⁻⁴; cluster size, 44 voxels; an amygdala-seeded, vmPFC-targeted analysis), and IFG (z = 3.33; peak p = 4 × 10⁻⁴; cluster size, 40 voxels; MNI: −42, 22, 18) at ROI corrected p < 0.05 (Table 3). The effects were robust after controlling for group and age. The peak coordinate in the thalamus occurred within the mediodorsal region showing 65% structural connectivity probability with the PFC (Thalamic Connectivity Atlas; http://www2.fmrib.ox.ac.uk/connect/). Post hoc analyses on extracted coupling estimates revealed that heightened vmPFC–amygdala connectivity (r(48) = 0.47; p = 6 × 10⁻⁴; two-sided, partial correlation) and vmPFC–PHG coupling (r(48) = 0.43; p = 0.002) predicted a more indiscriminate vmPFC fear generalization gradient (Fig. 4). On the other hand, reduced vmPFC–thalamus (r(48) = −0.50; p = 2 × 10⁻⁴) and vmPFC–IFG coupling (r(48) = 0.49; p = 4 × 10⁻⁴) also predicted a less discriminate vmPFC fear generalization gradient.
Table 3.
VmPFC intrinsic functional connectivity with fear circuit showing correlations with fear generalization or group differences
| Analysis and region | Corrected p* | Cluster extent (voxels) | Peak |
MNI (mm) |
||||
|---|---|---|---|---|---|---|---|---|
| F (or t) | z | p | x | y | z | |||
| vmPFC-seeded connectivity | ||||||||
| Correlation (with fear generalization gradient) | ||||||||
| Thalamus | <0.001 | 77 | 14.69 | 3.38 | 3 × 10⁻⁴ | −6 | −14 | 10 |
| IFG (BA45) | <0.001 | 40 | 14.24 | 3.33 | 4 × 10⁻⁴ | −42 | 22 | 18 |
| PHG | <0.05 | 14 | 13.85 | 3.28 | 0.001 | 18 | −2 | −26 |
| Mean difference (control > GAD) | ||||||||
| MFG (BA46) | <0.001 | 482 | 5.01a | 4.49 | 3 × 10⁻⁶ | −36 | 42 | 26 |
| Amygdala (Rh)-seeded connectivity | ||||||||
| Correlation (with fear generalization gradient) | ||||||||
| vmPFC | 0.024b | 44 | 14.00 | 3.30 | 4 × 10⁻⁴ | 6 | 42 | −20 |
| Mean difference (GAD > control) | ||||||||
| PHG | < 0.01 | 26 | 3.85a | 3.59 | 2 × 10⁻⁴ | 24 | −2 | −30 |
*Cluster-extent correction in anatomical ROI (see Materials and Methods for details).
at Value.
bFWE small volume correction (peak value-wise) from a priori coordinates due to inaccuracy of 3dClustSim on a small mask. Rh, right hemisphere.
Figure 4.
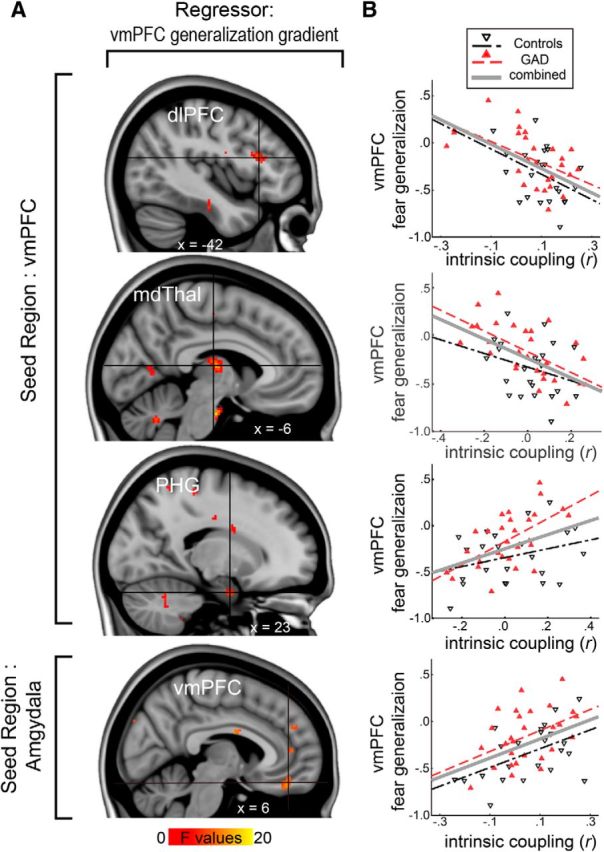
vmPFC resting-state functional connectivity to emotional circuitry predicts the vmPFC fear generalization response. A, Whole-brain correlation results showing vmPFC intrinsic coupling derived from resting-state fMRI associated with fear generalization. vmPFC coupling with the dlPFC, thalamus, PHG (vmPFC-seeded connectivity), and amygdala (amygdala-seeded connectivity) showed significant correlations at corrected p < 0.05. B, Scatter plots of the intrinsic coupling estimates (r) and the vmPFC fear generalization gradient. The vmPFC fear generalization gradient negatively correlated with vmPFC intrinsic coupling to the dlPFC or the thalamus, and positively correlated with the coupling to the PHG and the amygdala. FGG, fear generalization gradient.
Impact of clinical anxiety on prefrontal and limbic connectivity
Based on previous literature implicating impaired (dorsal) prefrontal attention and executive system in anxiety (S. Bishop et al., 2004; S. J. Bishop, 2009), we reasoned that abnormal intrinsic connectivity between the dorsal and ventral PFC may be related to clinical anxiety as well. Thus, we tested for a relationship between clinical anxiety and vmPFC–frontal gyrus intrinsic functional coupling. Patients with GAD showed reduced vmPFC–MFG functional connectivity compared with controls (z = 4.49; peak p = 3 × 10⁻⁶; cluster size, 482; MNI, −36, 42, 26; Fig. 5).
Figure 5.
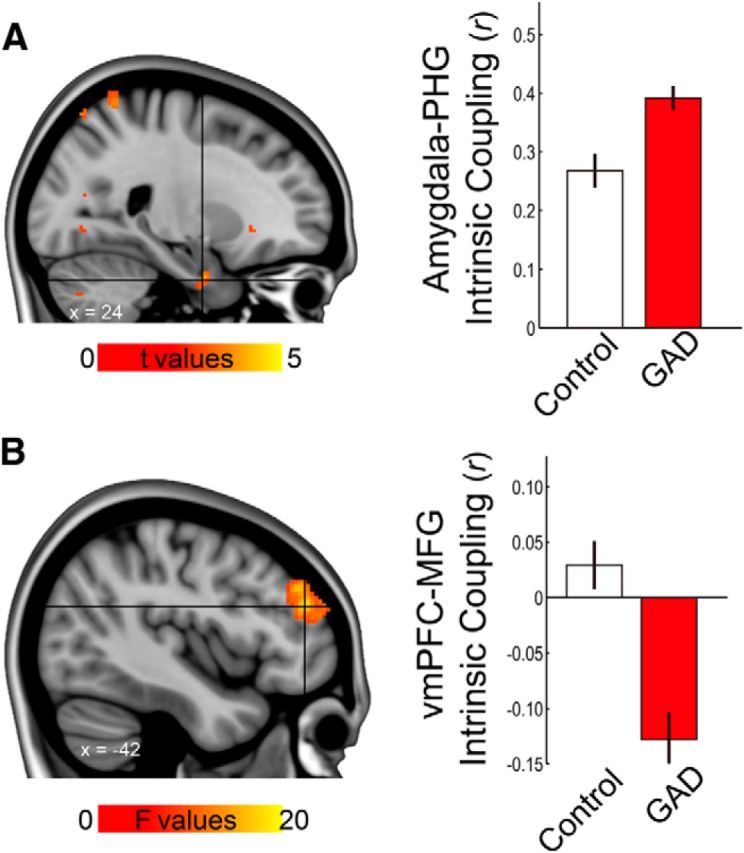
Altered intrinsic functional coupling in GAD. A, Left, Amygdala–PHG coupling was significantly different between groups. Right, Post hoc analyses revealed that the GAD group showed greater coupling than controls (t(50) = 3.58, p < 0.001, 2-sample t test), while both showed mean positive values (p < 0.001). B, left, Voxelwise analyses showed significant group difference in vmPFC-seeded intrinsic coupling with the dlPFC at corrected p < 0.001. Activation maps were thresholded at uncorrected p < 0.001, cluster size > 20 voxels. Right, Bar graph from coupling estimates extracted from the peak coordinate (within 6 mm radius) revealed reduced and negative vmPFC–dlPFC coupling in GAD. Error bars are ±1 SE. MFG, Middle frontal gyrus; PHG, parahippocampal gyrus.
Together with literature reporting significant amygdala–PHG connectivity in both emotion processing (Stein et al., 2007) and resting state (Robinson et al., 2010), and based on our results that vmPFC–amygdala and vmPFC–PHG coupling correlate with fear generalization, we next reasoned that amygdala–PHG coupling would be closely related to vmPFC threat processing or pathophysiology of anxiety. Indeed, amygdala–PHG coupling was significantly correlated with the vmPFC fear generalization gradient, such that a higher coupling predicted a less discriminate vmPFC fear generalization gradient (r(48) = 0.30, p < 0.04, two-tailed partial correlation controlling for group). Furthermore, a voxelwise analysis showed that GAD patients demonstrate significantly increased connectivity compared with controls at a corrected p < 0.01 (Table 3, Fig. 5). Together with the MFG results, these findings suggest a strong association between clinical anxiety and prefrontal (vmPFC–MFG) and limbic (amygdala–PHG) connectivity.
Multiple neural measures predict the vmPFC fear generalization gradient and generalized anxiety disorder: multiple linear regression and structural equation modeling
We performed multiblock linear regression analyses, taking the vmPFC gradient as the dependent variable and its structural (gray and white matter) and functional factors as the independent variables, categorized into three blocks: vmPFC thickness, fiber integrity (i.e., FA of each of the three major tracts), and functional connectivity (i.e., vmPFC intrinsic coupling with the amygdala, thalamus, PHG, and IFG respectively). Group and age were initially entered into the model. We found that all three blocks independently accounted for significant portions of the variance in the vmPFC fear generalization gradient (Table 4): volumetrics accounted for 15.6% of variance in the fear generalization (p < 0.003), fiber integrity 21.8% (p < 0.002), and functional coupling 19.1% (p < 0.001). The resultant model had an adjusted R2 of 0.60 (p < 0.001). Significant individual predictors included vmPFC cortical thickness (β = −0.28, p < 0.01), FA of ATR (β = −0.41, p < 0.001), vmPFC–amygdala functional coupling (β = 0.32, p < 0.01), and vmPFC–IFG functional coupling (β = −0.24, p < 0.03), followed by a marginally significant vmPFC–thalamus coupling (β = −0.18, p < 0.09). We investigated relative predictability among the factors by switching block entry order. In all four alternative models, each factor significantly predicted a distinct proportion of the variance in the fear generalization (p values <0.05). Of note however, the ΔR2 of each factor dropped when entered last, compared with first (CT, 60.9%; FA, 31.7%; IC, 48.2%). This indicates association between each factor and indirect effects. Such an observation is indeed intuitive in that all factors in part represent properties of a broad vmPFC network and predict the vmPFC fear generalization gradient. A confirmatory regression model without block terms showed similar results: vmPFC thickness, FA of ATR, vmPFC–amygdala, and vmPFC–IFG each significantly accounted for a portion of the total variance in the vmPFC fear generalization (53.9%; ps <0.01).
Table 4.
Block-wise multiple regression model with vmPFC generalization gradient as the dependent variable and the three categories of neural metrics as the independent variables
| Step | Block | Predictors | Coefficients |
Model summary |
|||
|---|---|---|---|---|---|---|---|
| β | Significance | R2 | Adjusted R2 | ΔR2 (p) | |||
| 0 | (Initial, fixed terms) | 0.113 | 0.075 | 0.113 (0.060) | |||
| Group | 0.283a | 0.045a | |||||
| Age | 0.176a | 0.207a | |||||
| 1 | Cortical thickness | 0.269 | 0.221 | 0.156 (0.003) | |||
| CT | −0.412a | 0.003a | |||||
| 2 | Fractional anisotropy | 0.269 | 0.415 | 0.218 (0.002) | |||
| CT | −0.417 | 0.001 | |||||
| FAATR | −0.310a | 0.020a | |||||
| FACCG | −0.111a | 0.376a | |||||
| FAUF | −0.234a | 0.045a | |||||
| 3 | Intrinsic (functional) coupling | 0.678 | 0.596 | 0.191 (0.001) | |||
| CT | −0.277 | 0.010 | |||||
| FAATR | −0.412 | 0.001 | |||||
| FACCG | 0.003 | 0.976 | |||||
| FAUF | −0.069 | 0.500 | |||||
| ICAm | 0.317a | 0.011a | |||||
| ICTh | −0.176a | 0.091a | |||||
| ICPHG | −0.074a | 0.520a | |||||
| ICIFG | −0.242a | 0.027a | |||||
aNewly entered predictors.
Am, amygdala; CT, cortical thickness; IC, intrinsic functional coupling; Th, thalamus.
We then used structural equation modeling to investigate whether each of these correlates of the vmPFC fear generalization gradient would be associated with clinical anxiety. Two latent variables were hypothesized to estimate the collective impacts of axonal integrity and functional coupling, respectively (See Materials and Methods for details of model specification). The effects of CCG fiber integrity and vmPFC–PHG coupling were not significant. The model showed that the direct effects of structural and functional neural substrates onto the latent variables, the vmPFC fear generalization gradient, were significant. More importantly, the indirect effects of the variables onto clinical anxiety, via the vmPFC fear generalization gradient, were also significant (Fig. 6). Together with the multiple regression model, these results suggest that the structural and functional neural features contribute to GAD via disruption of vmPFC threat processing.
Figure 6.

A structural model shows that individual differences of the circuit-wide neural features are associated with clinical anxiety; an indirect effect appears to be mediated, in part, through vmPFC fear generalization. Indirect effects are depicted as dotted gray lines. The model included the same variables as the multiple regression model. Correlations between some of the variables were modeled, but for brevity, are not shown (see Materials and Methods). This model showed a reasonable fit: d.f., 29; χ2/df, 1.05; comparative fit index, 0.98; root mean square error of approximation, 0.03 (cutoff criteria: comparative fit index, >0.95; root mean square error of approximation <0.06; Hu and Bentler, 1999). Significance of effects was determined by a bootstrapping sampling with bias-corrected confidence intervals of 90%. *p < 0.05; ***p < 0.001.
Discussion
In the present study, we demonstrate (1) that vmPFC threat processing correlates with variability of gray matter structure and vmPFC connectivity with distributed systems, (2) that this relationship is independent across the neural factors, and (3) that variability in factors may contribute to clinical anxiety by affecting vmPFC function. These results further demonstrate that dysfunctional vmPFC recruitment in negative affect processing, a well known pathogenic marker of clinical anxiety (Milad and Rauch, 2007; Greenberg et al., 2013b), is correlated with circuit-wide abnormalities in a parallel manner.
Our results indicate that individual variability in the vmPFC fear generalization gradient is independently explained by the vmPFC thickness, fiber integrity of the white matter tracts converging on it, and intrinsic functional coupling of the corticolimbic fear circuit. These results endorse the notion of the vmPFC's integral role in the corticolimbic system (Roy et al., 2012) and further suggest that impoverished vmPFC recruitment in clinical anxiety, as previously documented by our group (Greenberg et al., 2013b) and others (Milad and Rauch, 2007; Myers-Schulz and Koenigs, 2012), is closely related to parallel system-wide abnormalities between cortical or subcortical nodes in the fear circuit.
We show that individuals with thicker vmPFC display a more discriminate vmPFC reactivity during the fear generalization task, thus indicating a direct structure and function relationship. This result is in line with previous research reporting that vmPFC thickness positively correlates with fear extinction, as indexed by skin conductance responses to CS (Milad et al., 2005). It should be noted that patients with GAD did not show signs of vmPFC thinning, which could be due to relatively young patient samples (mean age of 22.3 ± 4.5 years). Future research may determine the impact of prolonged illness on vmPFC thickness.
Our tractography data show that the fiber integrity of all three major pathways that converge upon the PFC correlates with vmPFC fear generalization. Not only do our Tract-Based Spatial Statistics results support this, they also demonstrate that fibers proximal to the hippocampus, the amygdala, the thalamus, and even the midbrain, play an important role in contributing to vmPFC function. The pervasive correlation effect throughout the corticolimbic system in the Tract-Based Spatial Statistics analysis is striking, given the conservative whole-brain corrected p combined with a nonparametric permutation method. Thus, these results provide strong support for the role of the vmPFC as a hub of diverse brain regions that collectively contribute to the vmPFC response to affective stimuli. This notion is also relevant to other domains of vmPFC function, such as cognition, valuation, and memory (Price, 2007; Roy et al., 2012).
Here, we found a trend-level relationship between lower FA in the UF and GAD. This is consistent with previous studies showing attenuation of UF fiber integrity in patients with GAD (Hettema et al., 2012; Tromp et al., 2012), in patients with generalized social anxiety disorder (Phan et al., 2009), and in nonclinical trait-anxious individuals (Kim and Whalen, 2009). However, it should be noted that the directionality of the relationship between UF fiber integrity and anxiety has produced mixed results (Ayling et al., 2012; Montag et al., 2012), and certain anxiety-related behaviors, such as attentional bias to threat, are associated with heightened UF integrity (Carlson et al., 2013a,b). Nevertheless, it should be noted that, in the present study, patients with GAD still showed overgeneralizing reactivity to threat versus safety, even without showing an apparent FA reduction. This indicates that FA reduction in the UF tract may not be essential for impoverished vmPFC threat processing and that there may exist parallel pathways for maladaptive vmPFC fear processing.
It is important to note that the directions of correlations between vmPFC coupling and its fear generalization gradient are distinct across different regions. Decreased vmPFC coupling with the mediodorsal thalamus and the IFG correlates with a less discriminate vmPFC gradient. Indeed, the mediodorsal thalamus–vmPFC connectivity has been implicated in associative learning in animal studies (Mitchell and Gaffan, 2008; Cross et al., 2012; Parnaudeau et al., 2013). Furthermore, it has been suggested that the mediodorsal thalamus plays a critical role in the modulation of fear extinction (Lee et al., 2012). Our functional connectivity results cannot resolve directionality; nevertheless, they provide support for these previous findings in animals. Similarly, decreased vmPFC–IFG coupling also correlates with indiscriminating vmPFC fear generalization. Finally, clinically anxious individuals displayed decreased vmPFC–MFG coupling. These results are consistent with previous reports in which vmPFC interaction with other prefrontal regions (the MFG and the IFG) has been implicated in emotion regulation (Delgado et al., 2008) and value-based decision making (Hare et al., 2009; Baumgartner et al., 2011). Impoverished functioning in these regions has also been shown to contribute to the development of anxiety (Bishop et al., 2004; Bishop, 2009). Together with prior literature, our results suggest that inefficient prefrontal–vmPFC interaction is an important contributor to maladaptive vmPFC threat processing and, consequently, to the pathophysiology of anxiety.
In contrast, we found the opposite relationship with vmPFC–limbic system coupling: individuals with greater intrinsic coupling displayed less discriminate vmPFC fear generalization gradients. Our results also show that heightened coupling of the amygdala–PHG is related to clinical anxiety. Thus, maintaining balanced connectivity of the vmPFC–limbic network appears to be critical to proper vmPFC functioning. Our observations from structural equation modeling—that a greater vmPFC–amygdala intrinsic coupling is associated with clinical anxiety via mediation of vmPFC fear generalization—seem to contradict a previous report that found that patients with social anxiety disorder exhibit reduced vmPFC–amygdala resting-state functional coupling (Hahn et al., 2011). Nevertheless, our results raise the question of whether dysregulation in vmPFC–amygdala pathway in anxiety (or in mood disorders more generally) can be solely characterized as a decrease in resting-state functional connectivity. In line with this, increased vmPFC–amygdala intrinsic coupling has been linked to the short variant of serotonin transporter (5-HTT; Heinz et al., 2005), a well known genetic risk factor of anxiety disorder (Schinka et al., 2004; Sen et al., 2004). Altogether, our results suggest that abnormal vmPFC–limbic connections may contribute to vmPFC fear generalization in clinical anxiety.
Our block-wise regression model indicates that vmPFC thickness, fiber integrity, and functional connectivity independently account for significant variability in vmPFC reactivity during fear generalization. This supports the hypothesis that the altered vmPFC fear response in clinically anxious individuals is associated with parallel neural abnormalities. Clinical anxiety is a heterogeneous construct associated with distinct symptoms or pathologies that may or may not be present in any given individual with anxiety. Complicating issues further, clinical anxiety could result from multiple factors, such as prolonged or acute aversive experiences and/or potential genetic risk factors. Our structural equation modeling supports the notion that clinical anxiety may have multiple parallel pathophysiologies in distributed brain areas, which together have a significant impact on vmPFC functioning. This is in accord with recent reports that distinct neural circuits are responsible for different aspects of anxious states in rodent models (Jennings et al., 2013; S. Y. Kim et al., 2013). Such an accumulative contribution of multiple factors to pathophysiology is similar to that of autism (O'Roak et al., 2011) and cardiac disorders (Spooner, 2009). Our findings provide functional and structural support for a multihit model for clinical anxiety.
Footnotes
This work was supported by function from the Office of Naval Research (#N0014-04-1-005, to L.R.M.-P.) and the National Science Foundation (#0954643, to L.R.M.-P.).
The authors declare no competing financial interests.
References
- Ayling E, Aghajani M, Fouche JP, van der Wee N. Diffusion tensor imaging in anxiety disorders. Curr Psychiatry Rep. 2012;14:197–202. doi: 10.1007/s11920-012-0273-z. [DOI] [PubMed] [Google Scholar]
- Baas D, Aleman A, Kahn RS. Lateralization of amygdala activation: a systematic review of functional neuroimaging studies. Brain Res Brain Res Rev. 2004;45:96–103. doi: 10.1016/j.brainresrev.2004.02.004. [DOI] [PubMed] [Google Scholar]
- Baumgartner T, Knoch D, Hotz P, Eisenegger C, Fehr E. Dorsolateral and ventromedial prefrontal cortex orchestrate normative choice. Nat Neurosci. 2011;14:1468–1474. doi: 10.1038/nn.2933. [DOI] [PubMed] [Google Scholar]
- Behzadi Y, Restom K, Liau J, Liu TT. A component based noise correction method (CompCor) for BOLD and perfusion based fMRI. Neuroimage. 2007;37:90–101. doi: 10.1016/j.neuroimage.2007.04.042. [DOI] [PMC free article] [PubMed] [Google Scholar]
- Bishop SJ. Trait anxiety and impoverished prefrontal control of attention. Nat Neurosci. 2009;12:92–98. doi: 10.1038/nn.2242. [DOI] [PubMed] [Google Scholar]
- Bishop S, Duncan J, Brett M, Lawrence AD. Prefrontal cortical function and anxiety: controlling attention to threat-related stimuli. Nat Neurosci. 2004;7:184–188. doi: 10.1038/nn1173. [DOI] [PubMed] [Google Scholar]
- Carlson JM, Cha J, Mujica-Parodi LR. Functional and structural amygdala–anterior cingulate connectivity correlates with attentional bias to masked fearful faces. Cortex. 2013a;49:2595–2600. doi: 10.1016/j.cortex.2013.07.008. [DOI] [PubMed] [Google Scholar]
- Carlson JM, Cha J, Harmon-Jones E, Mujica-Parodi LR, Hajcak G. Influence of the BDNF genotype on amygdalo-prefrontal white matter microstructure is linked to nonconscious attention bias to threat. Cereb Cortex. 2013b doi: 10.1093/cercor/bht089. Advance online publication. Retrieved February 13, 2014. [DOI] [PubMed] [Google Scholar]
- Clark LA, Watson D. Tripartite model of anxiety and depression: psychometric evidence and taxonomic implications. J Abnorm Psychol. 1991;100:316–336. doi: 10.1037/0021-843X.100.3.316. [DOI] [PubMed] [Google Scholar]
- Cross L, Brown MW, Aggleton JP, Warburton EC. The medial dorsal thalamic nucleus and the medial prefrontal cortex of the rat function together to support associative recognition and recency but not item recognition. Learn Mem. 2012;20:41–50. doi: 10.1101/lm.028266.112. [DOI] [PMC free article] [PubMed] [Google Scholar]
- Damasio AR. The somatic marker hypothesis and the possible functions of the prefrontal cortex. Philos Trans R Soc Lond B Biol Sci. 1996;351:1413–1420. doi: 10.1098/rstb.1996.0125. [DOI] [PubMed] [Google Scholar]
- Delgado MR, Nearing KI, Ledoux JE, Phelps EA. Neural circuitry underlying the regulation of conditioned fear and its relation to extinction. Neuron. 2008;59:829–838. doi: 10.1016/j.neuron.2008.06.029. [DOI] [PMC free article] [PubMed] [Google Scholar]
- Greenberg T, Carlson JM, Cha J, Hajcak G, Mujica-Parodi LR. Neural reactivity tracks fear generalization gradients. Biol Psychol. 2013a;92:2–8. doi: 10.1016/j.biopsycho.2011.12.007. [DOI] [PubMed] [Google Scholar]
- Greenberg T, Carlson JM, Cha J, Hajcak G, Mujica-Parodi LR. Ventromedial prefrontal cortex reactivity is altered in generalized anxiety disorder during fear generalization. Depress Anxiety. 2013b;30:242–250. doi: 10.1002/da.22016. [DOI] [PubMed] [Google Scholar]
- Hahn A, Stein P, Windischberger C, Weissenbacher A, Spindelegger C, Moser E, Kasper S, Lanzenberger R. Reduced resting-state functional connectivity between amygdala and orbitofrontal cortex in social anxiety disorder. Neuroimage. 2011;56:881–889. doi: 10.1016/j.neuroimage.2011.02.064. [DOI] [PubMed] [Google Scholar]
- Hare TA, Camerer CF, Rangel A. Self-control in decision-making involves modulation of the vmPFC valuation system. Science. 2009;324:646–648. doi: 10.1126/science.1168450. [DOI] [PubMed] [Google Scholar]
- Hartley CA, Fischl B, Phelps EA. Brain structure correlates of individual differences in the acquisition and inhibition of conditioned fear. Cereb Cortex. 2011;21:1954–1962. doi: 10.1093/cercor/bhq253. [DOI] [PMC free article] [PubMed] [Google Scholar]
- Heinz A, Braus DF, Smolka MN, Wrase J, Puls I, Hermann D, Klein S, Grüsser SM, Flor H, Schumann G, Mann K, Büchel C. Amygdala-prefrontal coupling depends on a genetic variation of the serotonin transporter. Nat Neurosci. 2005;8:20–21. doi: 10.1038/nn1366. [DOI] [PubMed] [Google Scholar]
- Hettema JM, Kettenmann B, Ahluwalia V, McCarthy C, Kates WR, Schmitt JE, Silberg JL, Neale MC, Kendler KS, Fatouros P. Pilot multimodal twin imaging study of generalized anxiety disorder. Depress Anxiety. 2012;29:202–209. doi: 10.1002/da.20901. [DOI] [PMC free article] [PubMed] [Google Scholar]
- Hu LT, Bentler PM. Cutoff criteria for fit indexes in covariance structure analysis: conventional criteria versus new alternatives. Struct Equ Modeling. 1999;6:1–55. doi: 10.1080/10705519909540118. [DOI] [Google Scholar]
- Jennings JH, Sparta DR, Stamatakis AM, Ung RL, Pleil KE, Kash TL, Stuber GD. Distinct extended amygdala circuits for divergent motivational states. Nature. 2013;496:224–228. doi: 10.1038/nature12041. [DOI] [PMC free article] [PubMed] [Google Scholar]
- Kalisch R, Korenfeld E, Stephan KE, Weiskopf N, Seymour B, Dolan RJ. Context-dependent human extinction memory is mediated by a ventromedial prefrontal and hippocampal network. J Neurosci. 2006;26:9503–9511. doi: 10.1523/JNEUROSCI.2021-06.2006. [DOI] [PMC free article] [PubMed] [Google Scholar]
- Kessler RC, Berglund P, Demler O, Jin R, Merikangas KR, Walters EE. Lifetime prevalence and age-of-onset distributions of DSM-IV disorders in the National Comorbidity Survey Replication. Arch Gen Psychiatry. 2005;62:593–602. doi: 10.1001/archpsyc.62.6.593. [DOI] [PubMed] [Google Scholar]
- Kheirbek MA, Klemenhagen KC, Sahay A, Hen R. Neurogenesis and generalization: a new approach to stratify and treat anxiety disorders. Nat Neurosci. 2012;15:1613–1620. doi: 10.1038/nn.3262. [DOI] [PMC free article] [PubMed] [Google Scholar]
- Kim MJ, Whalen PJ. The structural integrity of an amygdala-prefrontal pathway predicts trait anxiety. J Neurosci. 2009;29:11614–11618. doi: 10.1523/JNEUROSCI.2335-09.2009. [DOI] [PMC free article] [PubMed] [Google Scholar]
- Kim SY, Adhikari A, Lee SY, Marshel JH, Kim CK, Mallory CS, Lo M, Pak S, Mattis J, Lim BK, Malenka RC, Warden MR, Neve R, Tye KM, Deisseroth K. Diverging neural pathways assemble a behavioural state from separable features in anxiety. Nature. 2013;496:219–223. doi: 10.1038/nature12018. [DOI] [PMC free article] [PubMed] [Google Scholar]
- Kriegeskorte N, Simmons WK, Bellgowan PS, Baker CI. Circular analysis in systems neuroscience: the dangers of double dipping. Nat Neurosci. 2009;12:535–540. doi: 10.1038/nn.2303. [DOI] [PMC free article] [PubMed] [Google Scholar]
- Lee S, Ahmed T, Lee S, Kim H, Choi S, Kim DS, Kim SJ, Cho J, Shin HS. Bidirectional modulation of fear extinction by mediodorsal thalamic firing in mice. Nat Neurosci. 2012;15:308–314. doi: 10.1038/nn.2999. [DOI] [PubMed] [Google Scholar]
- Lehman JF, Greenberg BD, McIntyre CC, Rasmussen SA, Haber SN. Rules ventral prefrontal cortical axons use to reach their targets: implications for diffusion tensor imaging tractography and deep brain stimulation for psychiatric illness. J Neurosci. 2011;31:10392–10402. doi: 10.1523/JNEUROSCI.0595-11.2011. [DOI] [PMC free article] [PubMed] [Google Scholar]
- Lissek S. Toward an account of clinical anxiety predicated on basic, neurally mapped mechanisms of Pavlovian fear-learning: the case for conditioned overgeneralization. Depress Anxiety. 2012;29:257–263. doi: 10.1002/da.21922. [DOI] [PMC free article] [PubMed] [Google Scholar]
- Milad MR, Quirk GJ. Fear extinction as a model for translational neuroscience: ten years of progress. Annu Rev Psychol. 2012;63:129–151. doi: 10.1146/annurev.psych.121208.131631. [DOI] [PMC free article] [PubMed] [Google Scholar]
- Milad MR, Rauch SL. The role of the orbitofrontal cortex in anxiety disorders. Ann N Y Acad Sci. 2007;1121:546–561. doi: 10.1196/annals.1401.006. [DOI] [PubMed] [Google Scholar]
- Milad MR, Quinn BT, Pitman RK, Orr SP, Fischl B, Rauch SL. Thickness of ventromedial prefrontal cortex in humans is correlated with extinction memory. Proc Natl Acad Sci U S A. 2005;102:10706–10711. doi: 10.1073/pnas.0502441102. [DOI] [PMC free article] [PubMed] [Google Scholar]
- Milad MR, Wright CI, Orr SP, Pitman RK, Quirk GJ, Rauch SL. Recall of fear extinction in humans activates the ventromedial prefrontal cortex and hippocampus in concert. Biol Psychiat. 2007;62:446–454. doi: 10.1016/j.biopsych.2006.10.011. [DOI] [PubMed] [Google Scholar]
- Mitchell AS, Gaffan D. The magnocellular mediodorsal thalamus is necessary for memory acquisition, but not retrieval. J Neurosci. 2008;28:258–263. doi: 10.1523/JNEUROSCI.4922-07.2008. [DOI] [PMC free article] [PubMed] [Google Scholar]
- Montag C, Reuter M, Weber B, Markett S, Schoene-Bake JC. Individual differences in trait anxiety are associated with white matter tract integrity in the left temporal lobe in healthy males but not females. Neuroscience. 2012;217:77–83. doi: 10.1016/j.neuroscience.2012.05.017. [DOI] [PubMed] [Google Scholar]
- Myers-Schulz B, Koenigs M. Functional anatomy of ventromedial prefrontal cortex: implications for mood and anxiety disorders. Mol Psychiatry. 2012;17:132–141. doi: 10.1038/mp.2011.88. [DOI] [PMC free article] [PubMed] [Google Scholar]
- O'Roak BJ, Deriziotis P, Lee C, Vives L, Schwartz JJ, Girirajan S, Karakoc E, Mackenzie AP, Ng SB, Baker C, Rieder MJ, Nickerson DA, Bernier R, Fisher SE, Shendure J, Eichler EE. Exome sequencing in sporadic autism spectrum disorders identifies severe de novo mutations. Nat Genet. 2011;43:585–589. doi: 10.1038/ng.835. [DOI] [PMC free article] [PubMed] [Google Scholar]
- Parnaudeau S, O'Neill PK, Bolkan SS, Ward RD, Abbas AI, Roth BL, Balsam PD, Gordon JA, Kellendonk C. Inhibition of mediodorsal thalamus disrupts thalamofrontal connectivity and cognition. Neuron. 2013;77:1151–1162. doi: 10.1016/j.neuron.2013.01.038. [DOI] [PMC free article] [PubMed] [Google Scholar]
- Phan KL, Orlichenko A, Boyd E, Angstadt M, Coccaro EF, Liberzon I, Arfanakis K. Preliminary evidence of white matter abnormality in the uncinate fasciculus in generalized social anxiety disorder. Biol Psychiat. 2009;66:691–694. doi: 10.1016/j.biopsych.2009.02.028. [DOI] [PMC free article] [PubMed] [Google Scholar]
- Phelps EA, Delgado MR, Nearing KI, LeDoux JE. Extinction learning in humans: role of the amygdala and vmPFC. Neuron. 2004;43:897–905. doi: 10.1016/j.neuron.2004.08.042. [DOI] [PubMed] [Google Scholar]
- Price JL. Definition of the orbital cortex in relation to specific connections with limbic and visceral structures and other cortical regions. Ann N Y Acad Sci. 2007;1121:54–71. doi: 10.1196/annals.1401.008. [DOI] [PubMed] [Google Scholar]
- Robinson JL, Laird AR, Glahn DC, Lovallo WR, Fox PT. Metaanalytic connectivity modeling: delineating the functional connectivity of the human amygdala. Hum Brain Mapp. 2010;31:173–184. doi: 10.1002/hbm.20854. [DOI] [PMC free article] [PubMed] [Google Scholar]
- Roy M, Shohamy D, Wager TD. Ventromedial prefrontal-subcortical systems and the generation of affective meaning. Trends Cogn Sci. 2012;16:147–156. doi: 10.1016/j.tics.2012.01.005. [DOI] [PMC free article] [PubMed] [Google Scholar]
- Schinka JA, Busch RM, Robichaux-Keene N. A meta-analysis of the association between the serotonin transporter gene polymorphism (5-HTTLPR) and trait anxiety. Mol Psychiatry. 2004;9:197–202. doi: 10.1038/sj.mp.4001405. [DOI] [PubMed] [Google Scholar]
- Sen S, Burmeister M, Ghosh D. Meta-analysis of the association between a serotonin transporter promoter polymorphism (5-HTTLPR) and anxiety-related personality traits. Am J Med Genet B Neuropsychiatr Genet. 2004;127B:85–89. doi: 10.1002/ajmg.b.20158. [DOI] [PubMed] [Google Scholar]
- Sierra-Mercado D, Padilla-Coreano N, Quirk GJ. Dissociable roles of prelimbic and infralimbic cortices, ventral hippocampus, and basolateral amygdala in the expression and extinction of conditioned fear. Neuropsychopharmacology. 2011;36:529–538. doi: 10.1038/npp.2010.184. [DOI] [PMC free article] [PubMed] [Google Scholar]
- Smith SM, Jenkinson M, Johansen-Berg H, Rueckert D, Nichols TE, Mackay CE, Watkins KE, Ciccarelli O, Cader MZ, Matthews PM, Behrens TE. Tract-based spatial statistics: voxelwise analysis of multi-subject diffusion data. Neuroimage. 2006;31:1487–1505. doi: 10.1016/j.neuroimage.2006.02.024. [DOI] [PubMed] [Google Scholar]
- Sotres-Bayon F, Sierra-Mercado D, Pardilla-Delgado E, Quirk GJ. Gating of fear in prelimbic cortex by hippocampal and amygdala inputs. Neuron. 2012;76:804–812. doi: 10.1016/j.neuron.2012.09.028. [DOI] [PMC free article] [PubMed] [Google Scholar]
- Spooner PM. Sudden cardiac death: the larger problem. The larger genome. J Cardiovasc Electrophysiol. 2009;20:585–596. doi: 10.1111/j.1540-8167.2008.01419.x. [DOI] [PubMed] [Google Scholar]
- Stein JL, Wiedholz LM, Bassett DS, Weinberger DR, Zink CF, Mattay VS, Meyer-Lindenberg A. A validated network of effective amygdala connectivity. Neuroimage. 2007;36:736–745. doi: 10.1016/j.neuroimage.2007.03.022. [DOI] [PubMed] [Google Scholar]
- Tromp DP, Grupe DW, Oathes DJ, McFarlin DR, Hernandez PJ, Kral TR, Lee JE, Adams M, Alexander AL, Nitschke JB. Reduced structural connectivity of a major frontolimbic pathway in generalized anxiety disorder. Arch Gen Psychiatry. 2012;69:925–934. doi: 10.1001/archgenpsychiatry.2011.2178. [DOI] [PMC free article] [PubMed] [Google Scholar]
- Yendiki A, Panneck P, Srinivasan P, Stevens A, Zöllei L, Augustinack J, Wang R, Salat D, Ehrlich S, Behrens T, Jbabdi S, Gollub R, Fischl B. Automated probabilistic reconstruction of white-matter pathways in health and disease using an atlas of the underlying anatomy. Front Neuroinform. 2011;5:23. doi: 10.3389/fninf.2011.00023. [DOI] [PMC free article] [PubMed] [Google Scholar]