

Abstract
The dentate gyrus (DG) serves as a primary gate to control information transfer from the cortex to the hippocampus. Activation of incoming cortical inputs results in rapid synaptic excitation followed by slow GABA-mediated (GABAergic) synaptic inhibition onto DG granule cells (GCs). GABAergic inhibitory interneurons (INs) in the DG comprise fast-spiking (FS) and non–fast-spiking (non-FS) cells. Anatomical analyses of DG INs reveal that FS cells are soma-targeting INs, whereas non-FS cells are dendrite-targeting INs. These two IN classes are differentially recruited by excitatory inputs and in turn provide exquisite spatiotemporal control over GC activity. Yet, little is known how FS and non-FS cells transform their presynaptic dynamics into varying postsynaptic response amplitudes. Using paired recordings in rat hippocampal slices, we show that inhibition in the DG is dominated by somatic GABAergic inputs during periods of sparse presynaptic activity, whereas dendritic GABAergic inputs are rapidly shifted to powerful and sustained inhibition during periods of intense presynaptic activity. The variant dynamics of dendritic inhibition is dependent on presynaptic IN subtypes and their activity patterns and is attributed to Ca2+-dependent increases in the probability of release and the size of the readily releasable pool. Furthermore, the degree of dynamic GABA release can be reduced by blocking voltage-gated K+ channels, which increases the efficacy of dendrite-targeting IN output synapses during sparse firing. Such rapid dynamic modulation of dendritic inhibition may act as a frequency-dependent filter to prevent overexcitation of GC dendrites and thus set the excitatory–inhibitory synaptic balance in the DG circuits.
Keywords: feedforward inhibition, GABA, hippocampus, interneuron, paired recording, readily releasable pool
Introduction
Local-circuit GABA-releasing (GABAergic) inhibitory interneurons (INs) provide inhibition to control neuronal activity (Freund and Buzsáki, 1996; McBain and Fisahn, 2001; Klausberger and Somogyi, 2008). Two distinct classes of inhibitory INs, soma-targeting and dendrite-targeting INs, mediate the inhibitory control. Soma-targeting INs control the spike initiation of principal neurons (PNs) via axonal innervations onto perisomatic areas of PNs (Cobb et al., 1995; Miles et al., 1996), whereas dendrite-targeting INs regulate dendritic electrical and biochemical signaling and synaptic plasticity by innervating dendritic domains of PNs (Miles et al., 1996; Leão et al., 2012; Chiu et al., 2013). On the basis of microcircuit structures, two inhibitory loops are identified. Feedforward inhibition arises when excitatory afferent inputs to cortical areas diverge onto both PNs and local GABAergic INs, which in turn inhibit PNs (Buzsáki, 1984; Pouille and Scanziani, 2001). Feedback inhibition is generated when activated PNs excite local INs, which in turn send inhibitory outputs back to a group of PNs, including those that initially activated the INs (Pouille and Scanziani, 2004).
Feedforward and feedback inhibition serves distinct network functions. Feedforward inhibition enables cortical neurons to accurately report temporal information by shortening the time window of EPSP summation (Pouille and Scanziani, 2001). In contrast, feedback inhibition scales GABAergic inhibition to local excitatory output, thereby contributing to the generation of rhythmic activities (Mann et al., 2005). Sparse firing of dentate gyrus (DG) granule cells (GCs) is thought to be important for rapid pattern separation and spatial information encoding (Leutgeb et al., 2007; McHugh et al., 2007; Moser et al., 2008). The relatively uniform GCs are supported by a rich diversity of GABAergic INs that provide general inhibition and also temporally regulate GC activity. In the DG, parvalbumin-expressing basket cells (PV+BCs), a class of soma-targeting INs, generate reliable and powerful phasic inhibition (Kraushaar and Jonas, 2000), whereas cholecystokinin (CCK)-expressing INs, which innervate the proximal parts of GC dendrites, release GABA in a highly asynchronous manner, thus generating long-lasting inhibition (Hefft and Jonas, 2005). In contrast, synaptic inhibition provided by other types of GABAergic INs has not been investigated. Hippocampal INs in vivo fire in bursts, with variable number and frequency of spikes (Bragin et al., 1995), but presynaptic spikes do not all give rise to identical postsynaptic responses. It is not known how GABAergic INs transform their dynamics into varying postsynaptic response amplitudes.
With rigorous anatomical reconstruction, we here examined properties of GABAergic synapses between INs and target GCs. We found that dendrite-targeting INs generate weak and less reliable inhibition onto GCs during sparse firing compared with soma-targeting INs. However, dendritic inhibition is rapidly switched to the robust and reliable mode during bouts of raised presynaptic activity. Such rapid dynamic changes are presynaptic IN activity- and Ca2+-dependent. Our results reveal a rapid frequency-dependent modulation of dendritic inhibition, a key strategy through which the DG can maintain a balance of excitation and inhibition at different states of cortical activity.
Materials and Methods
Slice preparation and electrophysiology.
Male Sprague Dawley rats (16–25 d postnatal) were killed by rapid decapitation without anesthesia, in accordance with national and institutional guidelines. All experimental protocols involving animals were reviewed and approved by the Institutional Animal Care and Use Committee of National Yang-Ming University. Their brains were rapidly removed, and 300-μm-thick transverse hippocampal slices were cut in ice-cold sucrose solution containing the following (in mm): 87 NaCl, 25 NaHCO3, 1.25 NaH2PO4, 2.5 KCl, 10 glucose, 75 sucrose, 0.5 CaCl2, and 7 MgCl2 using a vibratome (DTK-1000, Dosaka). Slices were incubated in the sucrose solution (equilibrated with 95% O2 and 5% CO2) in a holding chamber at 34°C for 40 min and kept in the same chamber at room temperature (23 ± 2°C) until used. During experiments, slices were placed in a recording chamber and superfused with oxygenated artificial CSF (ACSF) containing the following (in mm): 125 NaCl, 25 NaHCO3, 1.25 NaH2PO4, 2.5 KCl, 25 glucose, 2 CaCl2, and 1 MgCl2. The recording temperature was 23 ± 2°C in the majority of experiments and 35 ± 2°C in a subset (see Fig. 9).
Figure 9.

Rapid dynamic changes of dendritic inhibition preserved at near-physiological temperature. A1, Top, Spike train (shown with hash marks; adapted from Massi et al., 2012) as the stimulation protocol. Middle, Evoked spikes in a dendrite-targeting IN. Bottom, uIPSCs recorded from a postsynaptic GC (single sweep). A2, Enlargement of spikes and uIPSCs as indicated in A1. B1, Top, Same stimulation protocol as in A1. Middle, Discharge pattern of a soma-targeting IN. Bottom, uIPSCs recorded from a postsynaptic GC (single sweep). B2, Enlargement of spikes and uIPSCs as indicated in B1. C, Summary of mean uIPSC1 (normalized to the “Single” mode) from the “Single” and “Burst” modes. *p < 0.05. D, Summary of normalized mean charge transfer per AP from the “Single” and “Burst” modes. Circle represents 35°C (n = 7); square represents 23°C (n = 3). *p < 0.05.
Recording electrodes (3–7 mΩ) were pulled from borosilicate glass (outer diameter, 1.5 mm; thickness 0.32 mm; Harvard apparatus). Putative INs were first identified at the border between the granule cell layer (GCL) and the hilus by their relatively large somata (diameter >10 μm) under infrared and differential interference contrast microscope (Olympus BX51WI) coupled with an infrared-sensitive CCD camera (Hamamatsu, C7500–50) and then confirmed by their electrophysiological characteristics. Cell-attached recordings (pipette resistance 3–5 mΩ) were made to detect spike responses of single INs (Lien et al., 2006). Spikes were orthodromically evoked by glass electrodes (tip diameter ∼10 μm; filled with ACSF) or bipolar tungsten electrodes (MicroProbes) placed in different DG molecular layers. Trains of 10 pulses (100 μs) at 50 Hz at near-threshold intensities were delivered every 5 s using a stimulus isolator (Isoflex, A.M.P.I.). With near-threshold intensities, each train triggered at least one spike in >50% of trials, and the probability of spike generation triggered by any stimulus did not exceed 0.8 (Pouille and Scanziani, 2004). To induce depolarization-induced suppression of inhibition (DSI), GCs were depolarized to 0 mV for 5 s. Paired recordings from synaptically coupled presynaptic INs and postsynaptic GCs in the DG were made as described previously (Kraushaar and Jonas, 2000). Presynaptic INs were held near −70 mV in current clamp. One or multiple short (1 ms duration) current pulses were delivered to evoke single or clustered APs. Postsynaptic cells were held at −80 mV in voltage clamp. Whole-cell patch-clamp recordings were made using a Multiclamp 700B amplifier (Molecular Devices). Pipette capacitances of both electrodes were carefully compensated (by >95%), and series resistance (Rs) was compensated using the automatic bridge balance (readouts after compensation were 9–28 mΩ). Signals were filtered at 4 kHz using the 4-pole low-pass Bessel filter. A Digidata 1440A (Molecular Devices) connected to a personal computer was used for stimulus generation and data acquisition. The sampling frequency was 10 kHz. Pulse sequences were generated by pClamp 10.2 (Molecular Devices). No correction for liquid junction potentials was made.
Solutions and drugs.
The pipette solution for cell-attached recordings contained the following (mm): 141.5 K-gluconate, 13.5 KCl, 0.1 EGTA, 2 MgCl2, 4 Na2ATP, and 10 HEPES. For whole-cell patch-clamp recordings, the intracellular solution for presynaptic cells contained the following (mm): 135 K-gluconate, 20 KCl, 2 MgCl2, 4 Na2ATP, 10 HEPES, and 0.4% biocytin. For postsynaptic GC recordings, the intracellular solutions contained the following (mm): 15 K-gluconate, 140 KCl, 0.1 EGTA, 2 MgCl2, 4 Na2ATP, 10 HEPES, and 0.4% biocytin; or 135 K-gluconate, 20 KCl, 0.1 EGTA, 2 MgCl2 4 Na2ATP, 10 HEPES, and 0.4% biocytin; for postsynaptic IN recordings, the intracellular solutions contained the following (mm): 135 K-gluconate, 20 KCl, 2 MgCl2, 4 Na2ATP, 10 HEPES, and 0.4% biocytin; pH adjusted to 7.3 with KOH. EGTA-AM was purchased from Invitrogen; all other chemicals were purchased from Sigma.
Image acquisition, 3D reconstruction, and axonal density analysis.
For 3D reconstruction of biocytin-labeled cells, high-resolution two-photon images of INs were acquired. Labeled INs were examined by a two-photon microscope using a pulsed titanium: sapphire laser (Chameleon-Ultra II tuned to 800 nm; Coherent) attached to a Leica DM6000 CFS (Leica) that was equipped with a 63×/0.9 numerical aperture water-immersion objective (objective type HCX APO L). The morphology of the cells was reconstructed from a stack of 51–179 images per cell (voxel size, 271–758 nm in the x-y plane; 1 μm along the z-axis). Image stacks belonging to one cell were imported into the Neuromantic 1.6.3 software (Myatt et al., 2012) for 3D reconstruction. To quantify the axonal density along the radial axis, we counted the number of intersections made by the axons with lines running parallel to the border between the GCL and the molecular layer and interspaced by 10 μm (Pouille and Scanziani, 2004).
Data analysis and statistics.
Data were analyzed using Clampfit 10.2 (Molecular Devices) and Prism 5.0 (GraphPad). The synaptic latency was measured from the peak amplitude of the action potential (AP) to the 10% rise time of the unitary IPSC (uIPSC) (Glickfeld and Scanziani, 2006); the decay time constant of the uIPSC was fitted with a single exponential; the coefficient of variation (CV) of the interspike intervals (ISIs) was calculated from 1 s spike train elicited in response to current pulse (0.6 nA) injection (Lien and Jonas, 2003). The input resistance (Rin) was measured by the ratio of the steady-state (average of the last 100 ms) voltage response versus the injected 1 s hyperpolarizing (100 pA) current pulse. The membrane time constant (τm) was calculated using a single-exponential fit to the late portion of the voltage change produced by hyperpolarizing (100 pA) current pulse injection in the current-clamp mode at the resting membrane potential. To estimate the change of the readily releasable pool (RRP) size, AP trains (60 stimuli; 25 Hz) were delivered at 5 s after single and burst stimulations. The RRP size was quantified with a charge integral of the synaptic current (Moulder and Mennerick, 2005; Stevens and Williams, 2007). Linear regression fits to cumulative IPSC area plots after 1 s were back-extrapolated to estimate the cumulative area (RRP charge) at time 0. Data were presented as mean ± SEM, and n indicates the number of cells or pairs studied. Error bars indicate SEM and were plotted only when they exceeded the respective symbol size. Statistical significance was tested by the Wilcoxon rank-sum or Wilcoxon signed-rank test at the significance level (p) as indicated, using Prism 5.0.
Results
Functional and anatomical dichotomies between non–fast spiking (non-FS) and FS INs in the DG
To study the role of INs in the DG circuitry, experiments were initiated by establishing whole-cell recordings from GABAergic inhibitory INs located between the GCL and the hilus, then correlating their intrinsic properties with morphologies. Based on their firing properties in response to step current injection, GABAergic inhibitory INs were classified as non-FS and FS INs (Fig. 1A). Non-FS INs generated relatively slow, accommodating firing patterns during depolarizing current steps (Fig. 1A, left). The mean firing frequency did not increase monotonically with the injected current intensity (from 0.1 to 1 nA), but rather showed a maximal value (25 ± 4 Hz, n = 14) at an intermediate current intensity (0.6 nA; Fig. 1B, blue traces). In contrast, FS INs exhibited fast, nonaccommodating firing patterns (mean firing frequency, 61 ± 4 Hz at 0.6 nA, n = 16; Fig. 1A, right) with deep, fast afterhyperpolarization, and the mean firing frequency increased monotonically with the current intensity from 0.1 to 1 nA (Fig. 1B, red traces). Non-FS and FS INs also differed significantly in their CV of ISI (non-FS INs, 0.65 ± 0.14, n = 15; FS INs, 0.11 ± 0.02, n = 15; p < 0.0005, Wilcoxon rank-sum test), τm (non-FS INs, 40.6 ± 2.7 ms, n = 14; FS INs, 21.5 ± 1.5 ms, n = 16; p < 0.0005, Wilcoxon rank-sum test), and Rin (non-FS INs, 447 ± 42 mΩ, n = 15; FS INs, 144 ± 8 mΩ, n = 15; p < 0.0005, Wilcoxon rank-sum test) (Fig. 1C). To further correlate intrinsic properties with the morphologies of FS and non-FS INs, we filled cells with biocytin in a subset of recordings and recovered their morphologies after experiments. Anatomical analysis revealed that non-FS and FS INs had distinctive axonal distribution patterns (Fig. 1D1,D2). With the GCL as reference (Fig. 1E), reconstructed non-FS INs had the majority of axonal density distributions outside the GCL (in the ML), whereas FS INs had the highest axonal density distribution within the GCL.
Figure 1.

Intrinsic, morphological, and synaptic properties of non-FS and FS cells. A, Exemplar voltage responses evoked by a series of current pulses in a non-FS (blue) and an FS (red) cell. Current during the pulse was −0.1, 0.3, 0.6, and 0.8 nA. Membrane potential before the pulse was −70 mV. B, The relationship between the mean AP frequency and injected current for a subset of representative non-FS (n = 14) and FS (n = 16) cells. Individual cells were in lighter color, and the average values were darker. C, Summary of CV of ISI, τm, and Rin of non-FS (blue, n = 6–13) and FS (red, n = 7–17) cells. ***p < 0.0005. D, Exemplar reconstruction of a non-FS IN (D1), which had the main axonal distribution (blue) outside the GCL, and an FS IN (D2), which had the major axonal distribution (red) within the GCL. Somata and dendrites are indicated in black. ML, Molecular layer. E, Axonal density distribution for non-FS (n = 11) and FS (n = 4) INs plotted against distance from the GCL. A reconstructed GC (gray) is aligned and scaled to the plot for reference. F, Left, Schematic of paired recordings from a non-FS IN (blue)-to-GC (black) pair and a FS IN (red)-to-GC pair. Bursts of five APs were evoked in the non-FS IN and the FS IN by injection of brief current pulses (1 ms, 25 Hz) every 5 s. Presynaptic INs were current clamped at −70 mV, whereas postsynaptic GCs were voltage clamped at −80 mV. Right, The first AP from non-FS (blue) and FS (red) INs and their corresponding average uIPSCs (average of 70 and 73 sweeps, respectively, currents were inverted for clarity) in the target GCs (black) on an expanded time scale (vertical lines are separated by 2.5 ms). Squares represent average uIPSC latencies for non-FS (n = 11) and FS cells (n = 10). ***p < 0.0005. G, Summary of AP half-width (blue, n = 8; red, n = 10), 20–80% rise time (blue, n = 10; red, n = 12), and decay time constant (blue, n = 9; red, n = 12). ***p < 0.0005.
We next compared the functional properties of non-FS IN and FS IN output synapses in paired recordings (Fig. 1F). Inhibitory synaptic connections were identified by evoking uIPSCs in GCs with five brief depolarizing current pulses (1 ms at 25 Hz; 5 s interval) applied in presynaptic INs. Several differences were detected between non-FS IN-to-GC and FS IN-to-GC synapses. First, presynaptic AP half-width of non-FS INs was significantly longer than that of FS INs (non-FS INs, 1.69 ± 0.09 ms, n = 10; FS INs, 1.00 ± 0.07 ms, n = 8; p < 0.0005, Wilcoxon rank-sum test; Fig. 1G). Second, 20–80% rise time (non-FS INs, 1.11 ± 0.08 ms, n = 12; FS INs, 0.46 ± 0.03 ms, n = 10; p < 0.0005, Wilcoxon rank-sum test; Fig. 1G) and decay time constant (non-FS INs, 25.4 ± 2.1 ms, n = 12; FS INs, 13.6 ± 0.8 ms, n = 9; p < 0.0005, Wilcoxon rank-sum test; Fig. 1G) of uIPSCs recorded from pairs of non-FS IN-to-GC synapses were significantly slower than those of FS IN-to-GC synapses. Finally, the synaptic latency was significantly longer for non-FS IN-to-GC synapses than for FS IN-to-GC synapses (non-FS INs, 3.67 ± 0.16 ms, n = 11; FS INs, 1.95 ± 0.14 ms, n = 10; p < 0.0005, Wilcoxon rank-sum test; Fig. 1F). These results were similar to previous observations (Hefft and Jonas, 2005) and were consistent with a more distal location of non-FS IN terminals on the dendrites of GCs (Fig. 1D1).
Classification of IN subtypes
Non-FS and FS INs can be further classified into several IN subtypes based on their axonal projection patterns (Han et al., 1993; Hefft and Jonas, 2005). Non-FS INs with their somata at the border between the GCL and the hilus comprise at least three distinct subtypes: the cannabinoid receptor type 1-expressing INs (CB1R+INs, also known as CCK+INs), the hilar IN with commissural/associational (C/A) pathway-associated (HICAP) cells and the hilar IN with PP-associated axon terminals (HIPP) cells. Unlike CB1R+INs in the CA1 area (Glickfeld and Scanziani, 2006), CB1R+INs had their axonal distribution in the inner molecular layer (IML) rather than the GCL (Hefft and Jonas, 2005). Thus, CB1R+INs (6 cells; Fig. 2A1) in this study were identified by asynchronous release (Fig. 2A2), cannabinoid sensitivity (40.6 ± 0.3% of control, n = 5 pairs; Fig. 2A3), and their axonal distribution in the IML (Glickfeld and Scanziani, 2006). Cannabinoid sensitivity was tested through the DSI protocol (see Materials and Methods). Similar to CB1R+INs, HICAP cells also had the highest density of axons within the IML (Fig. 2B1). However, in contrast to CB1R+INs, HICAP cells (14 cells) did not display DSI responses (103.4 ± 11.9% of control, n = 10 pairs; Fig. 2B2). Unlike CB1R+INs and HICAP cells, HIPP cells (9 cells) had their axonal projection extended to the PP terminal field, whereas its dendrites were restricted to the hilus (Fig. 2C). Interestingly, we observed four HIPP-like cells, which projected their axons to the outer molecular layer (OML), but had the dendritic arbor in the ML and the hilus (Fig. 2D).
Figure 2.
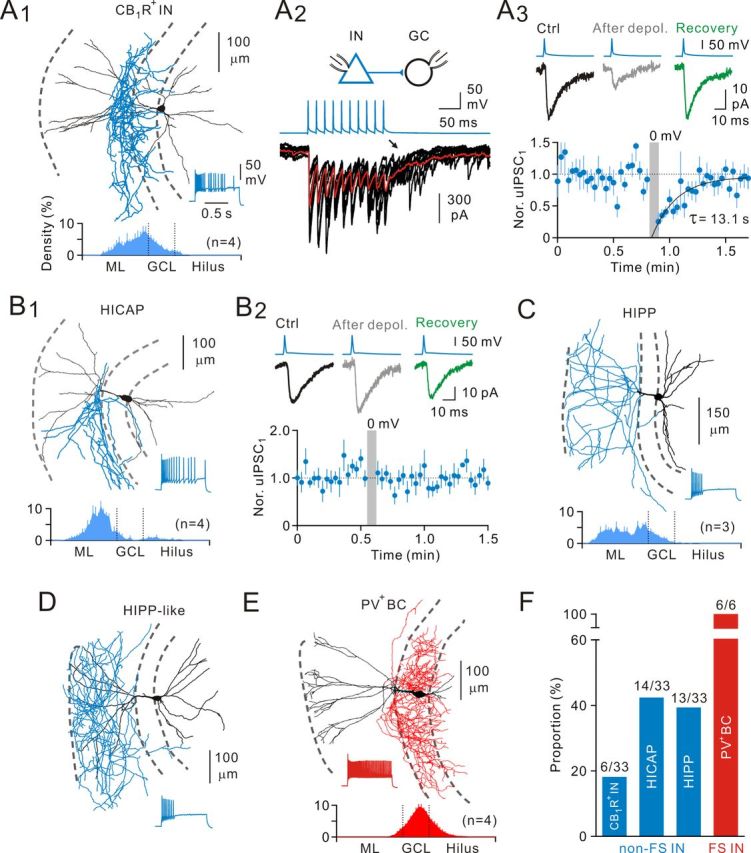
Heterogeneity of non-FS INs. A, A non-FS cell (A1), a putative CB1R+IN, with the axonal distribution within the IML (bottom, density plot) exhibited asynchronous release onto GCs (A2, arrow) and DSI (A3). To induce DSI, GCs were depolarized to 0 mV for 5 s. Eight single uIPSC sweeps are superimposed in A2; red curve is the average of 35 sweeps. A3, Top, uIPSC traces in control, after depolarization, and recovery from DSI; uIPSC traces are average of 8–25 sweeps. Bottom, Summary of the time course of uIPSC suppression from putative CB1R+ IN-to-GC pairs (n = 5). Recovery is fitted with a single exponential function. CB1R+, Cannabinoid receptor type 1 (+). B, A non-FS cell, a putative hilar C/A pathway-related (HICAP) cell (B1), had the main axonal innervation in the IML. B2, HICAP cells had no DSI response (average of 10 pairs). The dendritic processes penetrated the GCL and radially ascended into the ML, whereas the remaining dendrites ramified in the hilus. Bottom, Axonal density plot. C, A non-FS cell, a typical hilar PP-associated (HIPP) cell, had the axonal distribution in the PP terminal field. There are dendrites strictly in the hilus. Bottom, Axonal density plot. D, An exemplar atypical HIPP-like cell, which had the axonal distribution of HIPP cells, but the dendrites ramified in the ML, in addition to the hilus. E, An FS cell, a putative PV+BC with the axonal distribution within the GCL. There are tangential axon collaterals in the hilus and scattered boutons all along. Bottom, Axonal density plot. F, Summary of morphological classification of non-FS and FS INs.
In contrast to non-FS INs, FS INs had remarkable axonal projection almost restricted within the GCL (Fig. 2E) and likely comprise two subtypes: axo-axonic cells (AACs) and PV+BCs. AACs have prominent radial axon collaterals with vertical rows of axonal terminals, thus also termed chandelier cells, whereas PV+BCs have tangential axonal collaterals with scattered boutons in the GCL (Howard et al., 2005; Hu et al., 2010). In this study, all recovered FS INs were identified as PV+BCs based on their axonal projection pattern and AACs were not present (Fig. 2E). Summary of morphologically identified INs was shown in Figure 2F.
Differential recruitment of FS and non-FS INs by excitatory afferents
The DG has a distinct laminated structure and receives incoming excitatory inputs from the entorhinal cortex and the hilar regions (Förster et al., 2006; Bartos et al., 2011). The perforant path (PP) from the entorhinal cortex layer II forms a bundle and innervates the distal part of GC dendrites within the outer two thirds of the molecular layer (OML), whereas the C/A afferents, which originate from the mossy cells in the contralateral and ipsilateral hilar regions, innervate proximal GC dendrites within the IML (Fig. 3A). In addition to GCs, both excitatory afferents target local inhibitory INs, which critically control the GC output. To understand how INs exert their inhibition onto postsynaptic GCs in the normal DG circuitry, it is important to understand not only IN outputs, but also the nature of their inputs. To investigate how excitatory afferents recruit INs, we performed cell-attached recordings from individual INs located in or near the GCL. INs were activated by stimulating the PP with glass or bipolar tungsten electrodes placed in the OML (Fig. 3A; see Materials and Methods). Spikes, detected as extracellular AP currents, were recorded from the soma of presumed INs in response to trains of 10 electrical stimuli delivered at 50 Hz to the PP. Two populations of INs differed in their responses to the sustained PP afferent stimulation: the first group of INs, termed “late-onset” cells, had the low firing probability in response to the first five stimuli and rapidly increased their firing probability over the course of train stimuli (Fig. 3B,D); the second group of INs, termed “early-onset” cells, preferred to respond to the first four stimuli and responded less reliably to the latter stimuli (Fig. 3C,D). After cell-attached recordings, whole-cell recordings of the same cells showed that late-onset cells displayed adapting, irregular spiking at lower frequency (36 ± 2 Hz, n = 6; Fig. 3B, inset), whereas early-onset cells generated nonadapting, high-frequency spike train (63 ± 5 Hz, n = 10; Fig. 3C, inset) in response to square pulse current (0.6 nA) injection.
Figure 3.

Differential recruitment of two IN classes by excitatory afferents. A, Schematic diagram showing extracellular stimulation of afferents (PP stim. and C/A stim.) and FS-IN and non-FS IN recording configuration (not simultaneous). Black circle represents GC; blue triangle represents dendrite-targeting IN; red triangle represents soma-targeting IN. MF, Mossy fiber. There are reciprocal connections between soma-targeting INs and GCs. B, Exemplar cell-attached recording of responses (arrowheads) to PP stimuli (50 Hz trains (arrows) delivered at near-threshold intensities) in a “late-onset” IN. The stimulation electrode was positioned within the OML to activate the PP pathway. Inset, Whole-cell current-clamp recording of the same cell displayed adapting, non-FS patterns in response to positive square pulse of currents. In the following figures, the spiking pattern allowing identification of the neurons as non-FS or FS cells is shown as an inset. C, Same stimulation as in B triggered responses in an “early-onset” IN, which responded at the early phase of stimulations. Inset, The same cell displayed non-adapting, FS patterns upon depolarization. D, Histogram showing spike probability of non-FS and FS cells in response to 10 PP stimulations. Each data point is a 10 ms bin with spike number normalized to the total spike number during stimulation. E, Cell-attached recording of spike responses from a “late-onset” IN to 10 stimulations of the C/A pathways. Inset, The same cell displayed adapting, non-FS patterns upon depolarization. F, Same stimulation as in E triggered spike responses of an “early-onset” IN. Inset, The same cell displayed nonadapting, FS patterns upon depolarization. G, Histogram showing spike probability of non-FS and FS cells in response to C/A afferents stimulation (bin width, 10 ms).
In addition to the PP, INs receive C/A afferents, which terminate in the IML (Fig. 3A). Similar to PP activation, sustained stimulation of the C/A afferents sequentially recruited early-onset and late-onset INs. In the early-onset cells, the probability of spiking was highest at the onset of the series and rapidly fell during the sustained afferent stimulation (Fig. 3E,G). In the late-onset cells, the probability of spike generation was low at the onset of the series and slightly increased over the course of train stimuli (Fig. 3F,G). Whole-cell recordings of these two types of neurons also revealed that late-onset cells displayed adapting, non-FS patterns (32 ± 3 Hz, n = 8; Fig. 3E, inset), whereas early-onset cells exhibited non-adapting, FS patterns (65 ± 5 Hz, n = 7; Fig. 3F, inset).
Rapid dynamic changes of GABA release in non-FS IN-to-GC synapses
In neurons in vivo, the membrane potential exhibits substantial rapid variations, during all behavioral states, because of fluctuations in synaptic bombardment (reviewed by Haider and McCormick, 2009). Cortical inhibitory INs in vivo fire bursts of APs at γ frequency range (20–50 Hz) during the Up state or γ and spindle oscillations (Haider et al., 2006; Massi et al., 2012). It is unclear how the spike timing of INs is translated into their output synapses in different states. To address this question, we made paired recordings between FS or non-FS INs and GCs. Postsynaptic uIPSCs recorded in GCs were evoked by applying brief current pulses to the presynaptic INs. A single AP or a 25 Hz burst of five APs was repetitively applied every 5 s (Fig. 4A). Synaptic transmission at 5 s interval during periods of either single AP or burst AP complex mode was found to be stable for 8 min in the absence of GABA receptor type B antagonists (data not shown). As illustrated in Figure 4B (left traces), non-FS IN-to-GC synapses exhibited small uIPSCs (11.7 ± 3.0 pA, n = 18 pairs) with a larger number of failures (0.54 ± 0.04, n = 36 pairs) during single AP stimulations. Interestingly, when non-FS cells fired at bursting complexes, the efficacy (28.0 ± 7.5 pA, n = 18 pairs; p < 0.0005, Wilcoxon signed-rank test) and reliability (failure rate of IPSC1, 0.24 ± 0.03, n = 36 pairs; p < 0.0005, Wilcoxon signed-rank test) of neurotransmission robustly increased (Fig. 4B, right traces). When the peak amplitude of the first uIPSC (uIPSC1) was plotted against time, the magnitude was small during single firing modes, whereas the magnitude rapidly increased during burst firing modes (Fig. 4C). On average, the uIPSC1 magnitude increased to 412 ± 67% (n = 36; p < 0.0005, Wilcoxon signed-rank test; Fig. 4D). Similar results were also found when the mean charge transfer (the charge integral of the synaptic current) per AP was plotted against time during mode transitions (single, 0.18 ± 0.06 pC; burst, 0.55 ± 0.17 pC, n = 18; p < 0.0005, Wilcoxon signed-rank test; Fig. 4E).
Figure 4.
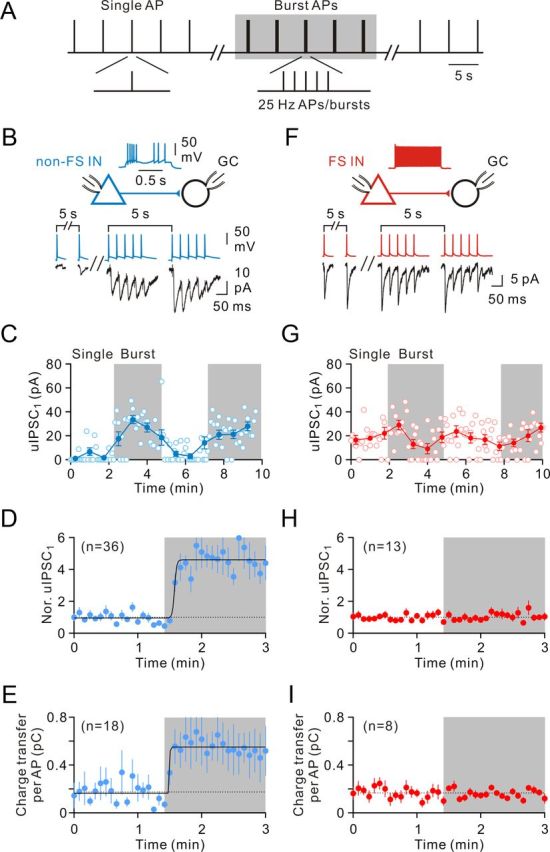
Cell type-specific dynamics of GABA release. A, Stimulation protocol used to trigger presynaptic spikes in paired recordings between presynaptic INs and postsynaptic GCs. A single AP (“Single” mode) or a 25 Hz burst of five presynaptic APs (“Burst” mode) evoked by brief current pulses were applied at a repetition frequency of 0.2 Hz. B, Paired recording between a presynaptic non-FS IN (blue) and a postsynaptic GC (black). Presynaptic IN was evoked by stimulation protocol shown in A and the corresponding uIPSCs (bottom traces, single sweeps). C, Plot of the peak amplitude of the uIPSC1 evoked by single APs and the uIPSC1 evoked by 25 Hz burst of five APs against time; the same cell as shown in B. Open circle represents individual uIPSC1; filled circle represents average uIPSC1 (average of 9 events). D, Summary of uIPSC1 from non-FS IN-to-GC pairs. D, E, Curves represent Boltzmann functions fitted to the data points. There is a brief delay (∼10 s) before the switch of synaptic strength. E, Summary of average charge transfer per AP from non-FS IN-to-GC pairs. F, Similar to B, paired recording from a FS IN (red)-to-GC (black) pair. Presynaptic APs (top traces) and corresponding uIPSCs (bottom traces, single sweeps). G, Plot of peak amplitude of uIPSC1 against time; the same cell as shown in F. Open circle represents individual uIPSC1; filled circle represents average uIPSC1 (average of 9 events). H, Summary of uIPSC1 from FS IN-to-GC pairs. I, Summary of average charge transfer per AP from FS IN-to-GC pairs.
In contrast, FS cells generated relatively reliable and high efficacy of GABA release during single firing modes (Fig. 4F,G). While FS cells fired at burst modes, they maintained stable transmission during burst of 5 APs (Fig. 4F). Unlike the non-FS IN synapses, the uIPSC1 magnitude (single, 12.8 ± 1.5 pA; burst, 12.0 ± 1.8 pA, n = 8; p = 0.82, Wilcoxon signed-rank test; Fig. 4H), the failure rate of IPSC1 (single, 0.21 ± 0.06; burst, 0.22 ± 0.06, n = 13; p = 0.67, Wilcoxon signed-rank test; data not shown), and the mean charge transfer (single, 0.17 ± 0.02 pC; burst, 0.16 ± 0.01 pC, n = 8; p = 0.31, Wilcoxon signed-rank test) per AP were unchanged after transition to burst firing modes (Fig. 4I).
Heterogeneity of dendrite-targeting IN output synapses
As illustrated in Figure 2, dendrite-targeting INs are heterogeneous and the properties of most GABAergic synapses between dendrite-targeting INs and GCs are unknown (Hefft and Jonas, 2005). With rigorous anatomical reconstruction, we have identified three subtypes (CB1R+, HICAP, and HIPP) of dendrite-targeting INs. In agreement with the distance of their axonal termination to the GC soma (Fig. 2), both uIPSC rise time and decay τ were fast at the CB1R+IN-GC synapse, modest at the HICAP-GC synapse, and slow at the HIPP-GC synapse (Table 1). Our present study provides, to our knowledge, the first description of their synaptic strength and properties. The main points are as follows. First, the peak amplitude of uIPSC and the charge transfer per AP at the HICAP-GC synapse (1.7 ± 0.5 pA; 0.03 ± 0.01 pC, n = 7) are much smaller than those at the CB1R+IN-GC synapse (13.5 ± 5.6 pA; 0.2 ± 0.1 pC, n = 4) and the HIPP-GC synapse (10.4 ± 8.0 pA; 0.15 ± 0.09 pC, n = 3) during basal transmission. Second, the degree (∼10-fold) of dynamic change of both CB1R+IN and HICAP cell output synapses is greater than that (∼1.5- to 3-fold) of the HIPP output synapse during mode-transitions. Third, the mean charge transfer per AP of the CB1R+IN-GC synapse (2.41 ± 1.39 pC, n = 4) is substantially larger than those of the HICAP-GC (0.31 ± 0.08 pC, n = 7), HIPP-GC (0.48 ± 0.32 pC, n = 3), and PV+BC-GC (0.29 ± 0.07 pC, n = 4) synapses during the burst mode, indicating that CB1R+IN-mediated asynchronous release provides the main inhibitory control onto GCs.
Table 1.
Functional properties of IN-to-GC connectionsa
| CB1R+IN→GC | HICAP→GC | HIPP→GC | PV+BC→GC | |
|---|---|---|---|---|
| AP half-width (ms) | 1.7 ± 0.1 | 1.7 ± 0.1 | 1.9 ± 0.2 | 1.2 ± 0.1 |
| CV of ISI | 0.75 ± 0.20 | 0.80 ± 0.26 | 0.54 ± 0.32 | 0.09 ± 0.01 |
| Rin (MΩ) | 303 ± 13 | 343 ± 18 | 295 ± 48 | 109 ± 20 |
| τm (ms) | 42.2 ± 3.2 | 45.9 ± 1.6 | 40.8 ± 5.2 | 16.5 ± 2.6 |
| Latency (ms) | 3.4 ± 0.3 | 3.8 ± 0.3 | 3.7 ± 0.4 | 1.6 ± 0.2 |
| 20–80% rise time (ms) | 1.6 ± 0.4 | 1.8 ± 0.3 | 2.5 ± 0.1 | 0.7 ± 0.1 |
| uIPSC decay τ (ms) | 19.9 ± 5.5 | 27.2 ± 5.2 | 40.7 ± 6.8 | 16.4 ± 4.4 |
| Peak amplitude of uIPSC (pA)b | 12.0 ± 4.5 | 1.7 ± 0.5 | 9.2 ± 5.8 | 32.5 ± 8.9 |
| Peak amplitude of uIPSC1 (pA)c | 118.0 ± 78.3 | 16.1 ± 3.5 | 14.5 ± 8.7 | 24.0 ± 9.0 |
| Charge transfer per AP (pC)b | 0.18 ± 0.08 | 0.03 ± 0.01 | 0.15 ± 0.06 | 0.51 ± 0.15 |
| Charge transfer per AP (pC)c | 2.03 ± 1.14 | 0.31 ± 0.08 | 0.43 ± 0.23 | 0.29 ± 0.07 |
| Failure rate of uIPSCb | 0.68 ± 0.07 | 0.91 ± 0.02 | 0.59 ± 0.11 | 0.07 ± 0.05 |
| Failure rate of uIPSC1c | 0.20 ± 0.05 | 0.21 ± 0.07 | 0.39 ± 0.07 | 0.17 ± 0.07 |
| Multiple-pulse depressiond | 0.73 ± 0.15 | 0.68 ± 0.26 | 0.65 ± 0.05 | 0.44 ± 0.04 |
aData from rigorously confirmed CB1R+IN-to-GC (n = 5), HICAP-to-GC (n = 7), HIPP-to-GC (n = 4), and PV+BC-to-GC (n = 4) pairs.
buIPSCs were measured during the single firing mode, including failures.
cuIPSCs were measured during the burst firing mode, including failures.
dMultiple-pulse depression (25 Hz) was defined as IPSC5/IPSC1.
Dynamic GABA release is sensitive to presynaptic activity patterns and Ca2+ buffers
The synaptic strength at non-FS IN-to-GC synapses was rapidly switched from low to high release during mode transitions, whereas the dynamics of FS IN-to-GC synapses was relatively independent of presynaptic activity. For non-FS INs, the marked increase in GABA release suggests that the probability of release rapidly increased during AP bursts, which persisted until the first AP of the next burst at 5 s later. To further examine the presynaptic activity dependence at non-FS IN-to-GC synapses, we prolonged the interburst interval from 5 to 10 s (Fig. 5A). As illustrated in Figure 5B, the uIPSC1 magnitude and the mean charge transfer of per AP were greatly reduced. Overall, the uIPSC1 magnitude and the mean charge transfer per AP decreased to 60 ± 8% (from 30.0 ± 11.3 pA to 18.9 ± 7.7 pA, n = 9; p < 0.05, Wilcoxon signed-rank test; Fig. 5C) and 71 ± 7% (from 0.66 ± 0.28 pC to 0.41 ± 0.17 pC, n = 9; p < 0.05, Wilcoxon signed-rank test; Fig. 5D), respectively. In contrast, both the failure rate of uIPSC1 (from 0.28 ± 0.07 to 0.49 ± 0.10, n = 9; p < 0.05, Wilcoxon signed-rank test; Fig. 5E) and the multiple-pulse ratio (uIPSC5/uIPSC1 from 0.54 ± 0.09 to 0.94 ± 0.16, n = 9; p < 0.05, Wilcoxon signed-rank test) were significantly increased (Fig. 5F). These results confirm that the use-dependent effects were generated at a presynaptic locus.
Figure 5.
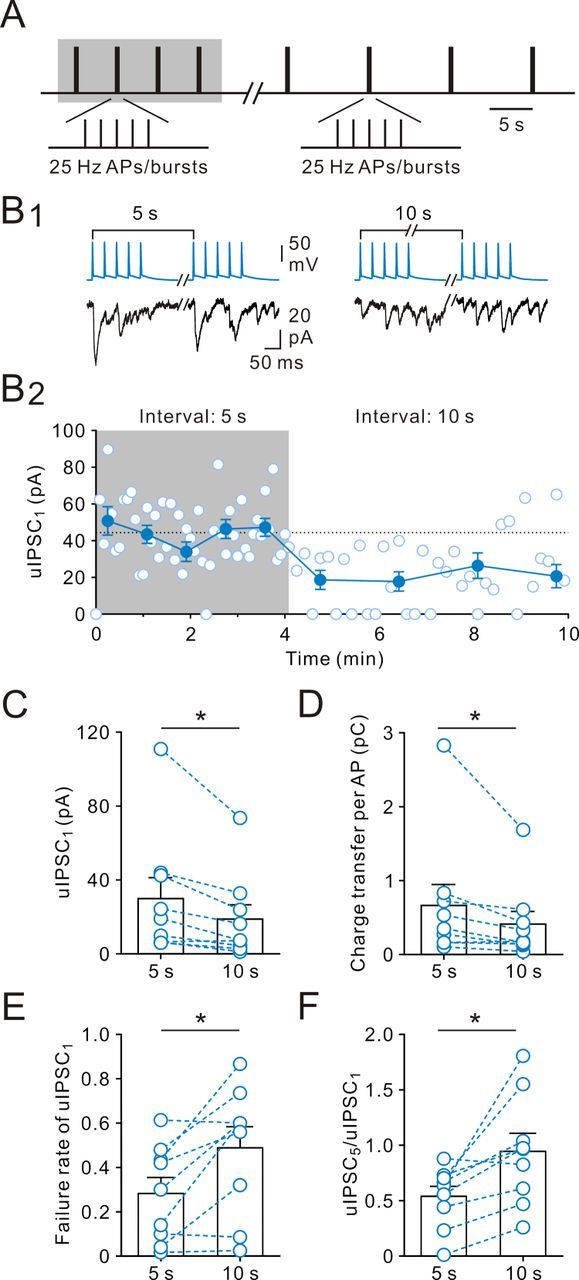
Presynaptic activity-dependent fast dynamic switches of GABA release. A, Stimulation protocol: 25 Hz bursts of presynaptic five APs were evoked repetitively at 5 or 10 s intervals. B1, Presynaptic APs (top) and postsynaptic uIPSCs (bottom, single sweeps). B2, Peak amplitude of uIPSC1 is plotted against time. The peak amplitude of uIPSC1 was rapidly decreased after the transition. C, Summary of uIPSC1 amplitude at 5 and 10 s intervals. *p < 0.05. D, Summary of mean integral of uIPSC per AP at 5 and 10 s intervals. *p < 0.05. E, Summary of failure rate at 5 and 10 s intervals. *p < 0.05. F, Summary of multiple-pulse ratio (uIPSC5/uIPSC1). Bars represent mean values; circles connected by dashed lines represent data from the same experiment. *p < 0.05.
Residual elevation of presynaptic [Ca2+]i as well as loose coupling between Ca2+ sources and synaptic vesicles may contribute to activity-dependent facilitation of GABA release during burst activities (Zucker and Regehr, 2002; Bucurenciu et al., 2008; Jonas and Vyleta, 2012). To test this hypothesis, we applied the acetoxymethylester form of EGTA (EGTA-AM, 10 μm), a slowly acting, membrane-permeable Ca2+ chelator to interfere with the coupling between endogenous Ca2+ and synaptic vesicles (Bucurenciu et al., 2008; Jonas and Vyleta, 2012). The EGTA-AM loaded into the cell can be deesterified by endogenous esterases, and the deesterified EGTA can accumulate to millimolar levels as opposed to the micromolar concentration of the EGTA-AM in the bath (Zucker and Regehr, 2002). A representative recording showed that, after 5 min bath application of EGTA-AM, the uIPSC1 magnitude during burst firing markedly decreased (from 247.0 ± 31.1 pA to 54.7 ± 11.6 pA; Fig. 6A1,A2). On average, the uIPSC1 magnitude decreased to 43 ± 7% (from 426.0 ± 209.5 pA to 158.1 ± 69.8 pA, n = 6; p < 0.05, Wilcoxon signed-rank test; Fig. 6B) in the presence of EGTA-AM. A similar effect on uIPSC was found during the period of single spiking (control, 23.8 ± 9.9 pA; EGTA-AM, 5.3 ± 1.8 pA; n = 5; data not shown). Consistent with the chelator effects on the presynaptic release machinery, the failure rate of the uIPSC1 during bursting spiking increased from 0.18 ± 0.08 to 0.57 ± 0.07 (n = 6; p < 0.05, Wilcoxon signed-rank test; Fig. 6C) and the multiple-pulse ratio (uIPSC5/uIPSC1) increased from 0.39 ± 0.10 to 0.76 ± 0.19 (n = 6; p < 0.05, Wilcoxon signed-rank test; Fig. 6D), whereas the CV−2 of uIPSC1 amplitude was reduced from 6.25 ± 4.12 to 2.01 ± 0.99 (p < 0.05, Wilcoxon signed-rank test; 6 pairs, respectively; data not shown).
Figure 6.

Membrane-permeable Ca2+ chelator EGTA-AM decreased GABA release in non-FS INs. A1, The 25 Hz bursts of five presynaptic APs and postsynaptic uIPSC traces (average of 25 sweeps). A2, Plot of their corresponding uIPSC1 amplitude in control and after bath perfusion of EGTA-AM (10 μm). Horizontal bar represents time of EGTA-AM application. EGTA-AM also altered synaptic dynamics. B, Summary of mean uIPSC1 amplitude before and after addition of EGTA-AM. *p < 0.05. C, Failure rate of uIPSC1 before and after addition of EGTA-AM. *p < 0.05. D, Multiple-pulse ratio before and after addition of EGTA-AM. *p < 0.05. E1, Simultaneous recordings of presynaptic APs evoked in a FS IN (top) and the uIPSCs in a GC (bottom, average of 40 sweeps for each). E2, Plot of their corresponding uIPSC1 amplitude in control and after bath perfusion of EGTA-AM. F, Summary of mean uIPSC1 amplitude before and after addition of EGTA-AM. G, Failure rate of uIPSC1 before and after addition of EGTA-AM. H, Multiple-pulse ratio before and after addition of EGTA-AM.
Previous studies showed that GABA release at FS IN-GC synapses is insensitive to the slow Ca2+ chelator EGTA, suggesting that Ca2+ source and Ca2+ sensor are tightly coupled at this synapse (Hefft and Jonas, 2005; Bucurenciu et al., 2008). In agreement with those of Hefft and Jonas (2005) and Bucurenciu et al. (2008), bath application of EGTA-AM had little effect on FS IN synapses during single spiking (control, 398.2 ± 147.2 pA; EGTA-AM, 375.8 ± 126.7 pA; n = 3; data not shown). Similarly, the uIPSC1 was not changed in the presence of EGTA-AM during burst spiking (control, 642.7 ± 27.2 pA; EGTA-AM, 587.6 ± 24.0 pA; Fig. 6E1,E2). On average, the uIPSC1 magnitude before and after EGTA-AM application was unchanged (control, 369.5 ± 140.0 pA; EGTA-AM, 359.3 ± 114.3 pA; n = 3; Fig. 6F). Consistently, there were no changes of failure rate (control, 0.015 ± 0.008; EGTA-AM, 0.009 ± 0.006; n = 3; Fig. 6G) and the multiple-pulse ratio (control, 0.57 ± 0.04; EGTA-AM, 0.50 ± 0.06; n = 3; Fig. 6H). As non-FS IN output synapses are markedly more sensitive to Ca2+ chelators than FS IN output synapses, our results suggest residual presynaptic [Ca2+]i and/or loose coupling between Ca2+ sources and synaptic vesicles in non-FS IN terminals.
The RRP size increased during periods of burst firing
In addition to increasing the probability of release, a recent study (Thanawala and Regehr, 2013) shows that presynaptic Ca2+ accumulation may increase neurotransmitter release in part by increasing the size of the RRP. To test the contribution of this mechanism, we depleted the RRPs in non-FS IN-GC pairs at 5 s after periods of single and burst AP firing using AP trains (Fig. 7A) and then compared the change of the RRP charge using cumulative methods (Moulder and Mennerick, 2005; Rizzoli and Betz, 2005; Stevens and Williams, 2007; Thanawala and Regehr, 2013).
Figure 7.

The RRP size increased during the burst stimulation. A, Protocols showing that AP trains (60 stimuli; 25 Hz) were delivered after single (left) and burst (right) stimulations to deplete the RRP. B, Representative single AP-induced uIPSC (average of 20 traces) and IPSC train (average of 2 trials) recorded from a non-FS IN-to-GC pair. Synaptic currents during AP trains show synchronous and asynchronous release. C, Representative burst AP-induced uIPSC (average of 30 traces) and IPSC train (average of 3 trials) recorded from the same pair as in B. D, Representative cumulative IPSC area values versus time from the same 60 stimuli, 25 Hz train. Each data point is a 120 ms bin with cumulative charge. Each data point for single and burst firing is an average of 2 and 3 trials, respectively. The solid lines represent linear regression fits to data points after 1 s to estimate the cumulative area at time 0. E, Summary of total RRP charge (cumulative area at time 0), as determined with trains. Circles connected by dashed lines represent data from the same cell. *p < 0.05.
As illustrated in Figure 7B, the uIPSCs during periods of single AP firing were small. After obtaining stable release during periods of single AP firing, AP trains of 60 stimuli at 25 Hz were delivered. The synaptic responses to the first 5 APs were small and then transiently increased during the train, but soon depressed and reached an apparent steady state. Notably, synaptic currents displayed synchronous and asynchronous release. After the recovery from train-induced depletion, INs were then stimulated in the burst mode. In agreement with non-FS IN output synapses, the uIPSC rapidly increased after transition to burst firing and then reached a steady state. To deplete the RRP, the same AP trains were delivered to INs. As illustrated in Figure 7C, synaptic responses were initially large, but rapidly depressed and reached an apparent steady state over the course of 60 stimuli, indicating the rapid depletion of the RRP. Furthermore, synaptic responses showed similar buildup of asynchronous release during AP trains (Fig. 7C). To account for asynchronous release during AP trains, we made cumulative area plots from the 25 Hz trains (Moulder and Mennerick, 2005; Stevens and Williams, 2007). They consisted of charge integrals of total synaptic charge transfer, and a line of best fit was calculated by linear regression (Fig. 7D). The average RRP charge estimated from the cumulative area at time 0 was 7.9 ± 3.3 pC (n = 7) during single firing and markedly increased to 26.4 ± 7.4 pC (n = 7), a more than threefold increase during the burst stimulation (p < 0.05, Wilcoxon signed-rank test; Fig. 7E).
Attenuation of rapid dynamic change of GABA release by 4-aminopyridine (4-AP)
Unlike the release-independent short-term plasticity found at FS IN-to-GC synapses (Kraushaar and Jonas, 2000), rapid dynamic changes of non-FS IN-to-GC synapses are presynaptic activity- and release-dependent. We next asked whether increasing presynaptic spike duration, and therefore driving more Ca2+ into terminals, could further increase the probability of release and in turn decrease the extent of the dynamic switch. We inhibited voltage-gated K+ channels with 30 μm 4-AP. Bath application of 4-AP slightly increased the somatic AP half-duration (control, 1.60 ± 0.07 ms; 4-AP, 1.91 ± 0.14 ms, n = 6; p = 0.06, Wilcoxon signed-rank test) and preferentially increased the uIPSC1 magnitude during single AP modes (control, 125.0 ± 113.7 pA; 4-AP, 269.0 ± 227.2 pA, n = 6; p < 0.05, Wilcoxon signed-rank test; Fig. 8A1,A2). On average, the degree of the dynamic switch of the uIPSC1 magnitude was reduced in the presence of 4-AP (control, 8.58 ± 1.08-fold; 4-AP, 2.87 ± 0.86-fold; n = 6; p < 0.05, Wilcoxon signed-rank test; Fig. 8C). Notably, although the multiple-pulse ratio (uIPSC5/uIPSC1) decreased (control, 0.58 ± 0.15; 4-AP, 0.19 ± 0.04; 6 pairs, respectively; p < 0.05, Wilcoxon signed-rank test; Fig. 8D) in the presence of 4-AP, the uIPSC1 magnitude during burst AP modes was unchanged (see Discussion).
Figure 8.

Blockade of K+ channels decreased the extent of the dynamic switch of dendritic inhibition. A1, Bursts of presynaptic APs (“Burst” mode, 25 Hz) and single presynaptic APs (“Single” mode) were repetitively evoked at 0.2 Hz in a non-FS cell; postsynaptic uIPSC traces were average of 15–30 sweeps. A2, Plot of their mean uIPSC1 amplitude (normalized to the “Single” mode in control) in control and in the presence of 4-AP (30 μm). Horizontal bar represents time of 4-AP application. 4-AP greatly increased uIPSCs and decreased the failures during the “single” mode. B1, Bursts of presynaptic APs (“Burst” mode, 25 Hz) and single presynaptic APs (“Single” mode) were repetitively evoked at 0.2 Hz in a FS cell; postsynaptic uIPSC traces were average of 30 sweeps. B2, Plot of their normalized mean uIPSC1 amplitude in control and in the presence of 4-AP (30 μm). Horizontal bar represents time of 4-AP application. C, Ratio of mean uIPSC1 amplitude in the “Burst” mode over mean uIPSC1 amplitude in the “Single” mode in control and in the presence of 4-AP (30 μm). *p < 0.05. D, Multiple-pulse ratio in control and in the presence of 4-AP. *p < 0.05.
We also tested for 4-AP effect on FS IN-to-GC synapses. In contrast to non-FS IN-to-GC synapses, bath application of 4-AP at low concentrations had little effect on the uIPSC1 magnitude during both single and burst AP modes (Fig. 8B1,B2). On average, the degrees of the dynamic switch of the uIPSC1 magnitude in control and in the presence of 4-AP were 1.04 ± 0.05-fold and 1.12 ± 0.05-fold (4 pairs, Fig. 8C), respectively. Consistently, the multiple-pulse ratio (uIPSC5/uIPSC1) was unchanged (control, 0.44 ± 0.06; 4-AP, 0.39 ± 0.04; 4 pairs, respectively; Fig. 8D). As non-FS IN output synapses are markedly more sensitive to 4-AP at low concentrations than FS IN output synapses, our results suggest differential expression of K+ channels between FS and non-FS IN terminals.
Rapid dynamic changes of dendritic inhibition is preserved at near-physiological temperature
Cortical inhibitory INs in vivo discharge bursts of APs at γ frequency range during the Up state (Massi et al., 2012). Although the natural firing pattern of INs in the DG remains to be determined, we tested whether dendrite-targeting INs fired in in vivo recorded discharge patterns exhibited rapid dynamic release during bursting complexes. To mimic the physiological activity, INs were stimulated for 20 s at near-physiological temperature using an IN spike train (Fig. 9A1,B1, hash marks) recorded from anesthetized rats as the stimulation protocol. The stimulation protocol comprised variable stimuli at 30–90 Hz frequency (cell code LK10c from Massi et al., 2012). At 35 ± 2°C, rapid dynamic release from dendrite-targeting IN output synapses during mode transitions was preserved. As illustrated in Figure 9A1, the efficacy of neurotransmission was low during low-frequency AP stimulation but was greatly enhanced during clustered AP stimulation. Figure 9A2 illustrates that single APs did not reliably generate postsynaptic responses in contrast to AP bursts. On average, the uIPSC1 magnitude and charge transfer per AP increased to 523 ± 122% (n = 6 pairs; p < 0.05, Wilcoxon signed-rank test; Fig. 9C) and 568 ± 153% (n = 6 pairs; p < 0.05, Wilcoxon signed-rank test; Fig. 9D), respectively. In contrast, soma-targeting INs maintained stable and reliable release during single to burst AP transitions (Fig. 9B1,B2). On average, the uIPSC1 and charge transfer per AP were unchanged (uIPSC1, 86 ± 4%; charge transfer per AP, 96 ± 5%; n = 4 pairs; Fig. 9C,D). Under the same conditions tested, the substantial difference between dendrite- and soma-targeting IN output synapses was preserved at 35 ± 2°C (Fig. 9C,D). Thus, rapid dynamic changes of GABA release from dendrite-targeting IN terminals occur at physiological temperature and with behaviorally relevant stimulation patterns. As dendrite-targeting INs provide a rapid fluctuating output, they could efficiently change the gain of input–output relations of GCs in vivo (Hefft and Jonas, 2005).
Functional connectivity and specificity of the synaptic dynamic switch
To further determine whether the rapid dynamic switch of GABA release is dependent on postsynaptic cell type, we recorded from non-FS IN-to-non-FS IN, non-FS IN-to-FS IN, FS IN-to-FS IN, and FS IN-to-non-FS IN pairs (Fig. 10A1,B1). Regardless of the cell type of postsynaptic targets, the rapid dynamic switch of GABA release was exclusively detected at pairs with non-FS cells as presynaptic neurons, suggesting presynaptic cell type specificity (Fig. 10A2,B2). The uIPSC1 (single/burst) ratios at non-FS IN-to-GC and non-FS IN-to-non-FS IN synapses were 0.24 ± 0.03 (n = 36) and 0 (n = 2), respectively (Fig. 10A3). By contrast, the uIPSC1 (single/burst) ratios at FS IN output synapses (FS IN-to-GC, 1.10 ± 0.09, n = 13; FS IN-to-non-FS IN, 1.05 ± 0.11, n = 5; FS IN-to-FS IN, 1.05, n = 2) were close to 1 (Fig. 10B3). Further analyses of synaptic dynamics revealed that FS IN output synapses exhibited short-term depression when tested at 25 Hz (uIPSC5/uIPSC1: 0.51 ± 0.04 at FS IN-to-GC pairs, n = 12; 0.54 ± 0.10 at FS IN-to-non FS IN pairs, n = 5; 0.50 at FS IN-to-FS IN pairs, n = 2). In contrast, non-FS IN output synapses appeared to display a functional divergence: the non-FS IN-to-GC synapses showed short-term depression (uIPSC5/uIPSC1: 0.63 ± 0.06, n = 29), whereas non-FS IN-to-non FS IN synapses exhibited little short-term plasticity (uIPSC5/uIPSC1: 1.10, n = 2) under the same stimulation condition. Notably, no functional connectivity was detected at non-FS IN-to-FS IN pairs in the present study (11 pairs; Fig. 10A4).
Figure 10.

Connectivity and specificity of the synaptic dynamic switch. A1, Schematic of non-FS IN (blue triangle) to GC (black circle), non-FS IN (blue triangle), and FS IN (red triangle) connections. A2, Representative AP trace (top) from a non-FS IN and average uIPSC traces (bottom) recorded from a GC, a non-FS IN, and a FS IN. No functional connection was detected at non-FS IN-to-FS IN synapses. A3, Summary of the fraction of uIPSC1 (Single)/uIPSC1 (Burst) from non-FS IN-to-GC, non-FS IN-to-non-FS IN, and non-FS IN-to-FS IN connections, respectively. A4, Summary plot of the frequency of possible non-FS IN-to-GC, non-FS IN-to-non-FS IN, and non-FS IN-to-FS IN connections. There were 151 of 391 possible non-FS IN-to-GC, 2 of 64 possible non-FS IN-to-non-FS IN, and 0 of 11 possible non-FS IN-to-FS IN connections. B1, Schematic of FS IN to GC, non-FS IN, and FS IN connections. B2, AP trace (top) from a FS IN and average uIPSC traces (bottom) recorded from a GC, a non-FS IN, and a FS IN. Current traces are average of 20–80 sweeps. B3, Summary of the fraction of uIPSC1 (Single)/uIPSC1 (Burst) from FS IN-to-GC, FS IN-to-non-FS IN, and FS IN-to-FS IN connections, respectively. B4, Summary plot of the frequency of possible connections. There were 30 of 52 possible FS IN-to-GC, 5 of 11 possible FS IN-to-non-FS IN, and 2 of 4 possible FS IN-to-FS IN connections.
Our study also revealed cell-type specificity of the functional connectivity (Fig. 10A4,B4). Non-FS INs preferentially formed functional connections with GCs (38.6%; 151 of 391 pairs) but rarely formed connections with non-FS INs (3.1%; 2 of 64 pairs) and FS INs (0%; 0 of 11 pairs). In contrast, FS INs frequently and almost equally formed connections with GCs (57.7%; 30 of 52 pairs), non-FS INs (45.4%; 5 of 11 pairs), and FS INs (50%; 2 of 4 pairs).
Discussion
Here, we report a novel synaptic dichotomy between two IN classes (soma targeting vs dendrite targeting) in the DG. Notably, despite considerable heterogeneity in dendrite-targeting IN properties and projection patterns, they all exhibit a rapid switch in GABA release between periods of sparse spiking activity and periods of enhanced activity at both 23°C and 35°C in contrast to soma-targeting INs (Table 1).
IN dichotomy in distinct microcircuits
Similar to our present study, a number of functional and anatomical dichotomies have been shown to exist between two IN classes, PV+BCs and CCK+BCs, in the hippocampus proper (see review by Armstrong and Soltesz, 2012). However, these two circuits, CA areas and DG, differ in some respects. First, INs in the DG exert shunting inhibition and depolarize GCs at rest, whereas INs in the CA1 and CA3 areas generate hyperpolarizing inhibition onto pyramidal cells (Glickfeld et al., 2009; Chiang et al., 2012). Second, unlike the remarkable axonal distribution of CB1R+ INs within the IML, CCK+ (also termed CB1R-containing) BCs in the CA1 area primarily synapse onto the somata of their principal cell targets with a slight shifted distribution toward the proximal dendrites (Glickfeld and Scanziani, 2006). Third, PV+BC input, but not CCK+BC input, in the CA1 area is selectively modulated by the hyperpolarization-activated chloride channel, ClC-2 (Földy et al., 2010). Such synapse-specific expression of ClC-2 is not present in the DG. Overall, these differences point to circuit-specific network function of INs.
Classification of dendrite-targeting INs
Compared with soma-targeting INs, dendrite-targeting INs are more complex and heterogeneous. In this study, we focus exclusively on dendrite-targeting INs with their somata at the border between the GCL and the hilus. According to previous studies (Han et al., 1993; Freund and Buzsáki, 1996), there are three major subtypes (i.e., CB1+INs, HICAP and HIPP cells). However, we observed a small population of INs not compatible with these classifications. In this study, INs with their axon projection to the OML were classified as HIPP cells. Among them, the majority (9 of 13 cells) of HIPP cells did display their dendrites strictly in the hilus, in agreement with that of Han et al. (1993). In other words, we observed four atypical HIPP-like cells, which project their axons to the OML, but have the dendritic arbor in the ML. Furthermore, we found that 7 of 13 of HIPP cells exhibit axon collaterals in the IML in addition to the OML. The possible explanation is that our slices were cut from the hippocampus at some septotemporal level where the IML may be very narrow or the angle of sectioning relative to layer boundaries may influence the appearance of the axon. It is also likely that those atypical HIPP cells represent a novel subtype of INs. The features of Petilla nomenclature (Ascoli et al., 2008) may provide a stepping stone toward a future classification of these atypical INs.
Synapse selectivity in the DG
The connectivity of non-FS IN onto different types of target cells in the DG suggests target-cell selectivity. The probability of finding a synaptic connection between non-FS INs and GCs is considerably higher than those in non-FS IN-to-non-FS IN and non-FS IN-to-FS IN pairs (Fig. 10A4). In contrast, the connectivity of FS IN onto target cells is relatively independent of target cell type (Fig. 10B4). Interestingly, nonrandom local circuits have been reported previously in the DG (Larimer and Strowbridge, 2008). Mossy cells in the hilus show profound synapse selectivity: 87.5% of their intralamellar excitatory connections are exclusively onto hilar INs (mossy cell-to-IN connectivity is 6%; 7 of 114 cells) and 12.5% of their intralamerllar excitatory connections (mossy cell-to-mossy cell connectivity is 0.5%; 1 of 206 cells) are onto mossy cell. Similarly, hilar INs also show high synapse selectivity and primarily synapse onto mossy cells (81% of inhibitory connections; hilar IN-to-mossy cell connectivity is 15%) with relatively few connections (19% of inhibitory connections; hilar IN-to-hilar IN connectivity is 6%) onto other hilar INs.
Possible mechanisms by which presynaptic activity regulates the short-term presynaptic facilitation
Cortical INs display a specific mode of firing composed of sparse and clustered APs (Goldberg et al., 2008). In our experimental conditions, whereas firing of dendrite-targeting INs is switched from the single to the burst spiking mode, the probability of release is rapidly enhanced, suggesting that AP bursts induced a long-lasting increase in [Ca2+]i in the terminals and the residual [Ca2+]i enables the enhancement of subsequent GABA release. Accumulation of residual [Ca2+]i may be attributed to the loose coupling between Ca2+ sources and release sensors (Eggermann et al., 2012) and/or saturation of endogenous Ca2+ buffers (Fioravante and Regehr, 2011). This hypothesis can be tested by introducing the slowly acting, but high-affinity, Ca2+ buffer EGTA into presynaptic terminals (Eggermann et al., 2012). Indeed, the effect of EGTA-AM strongly depress GABA release in dendrite-targeting INs. This is in great contrast to the lack of effect of the EGTA-AM on soma-targeting IN output synapses, where Ca2+ channels and Ca2+ sensors are tightly coupled (Hefft and Jonas, 2005; Bucurenciu et al., 2008). Here, a potential caveat should be noted. We cannot exclude a contribution of other variables that can affect neurotransmission by EGTA-AM; for instance, the treatment could affect the release of another substance that is selectively modulating synaptic transmission at non-FS IN output synapses but not FS IN output synapses.
Changes of AP shape can regulate release probability. By prolonging AP duration in the terminals, the probability of release may increase via the enhancement of presynaptic Ca2+ influx. In agreement with this view, inhibition of voltage-gated K+ channels with 4-AP increases AP duration and greatly enhances single AP-evoked uIPSCs. A significant decrease in multiple-pulse ratio (Fig. 8D) confirmed that 4-AP enhances presynaptic release, thus reducing the extent of dynamic change during mode transitions. A lack of 4-AP effect on the enhancement of uIPSC1 amplitude during the burst mode suggests that other activity-dependent gating mechanisms may be involved in regulating neurotransmission (Brody and Yue, 2000; Kraushaar and Jonas, 2000).
As indicated by an increase in multiple-pulse ratio (Figs. 5 and 6), the reduction of burst-induced IPSC amplitude by the prolonged interburst interval or EGTA-AM appears to be a result of a decrease in the probability of the release. However, a recent study (Thanawala and Regehr, 2013) shows that alterations in presynaptic calcium influx can also change the effective RRP size. Indeed, we found that the RRP is markedly increased during periods of burst firing. Thus, the calcium dependence of rapid enhancement of GABA release is likely determined by the combined calcium dependencies of the release probability and the effective size of the RRP. Finally, in addition to those discussed above, we still cannot exclude other mechanisms here, such as use-dependent increases in presynaptic Ca2+ currents (Ishikawa et al., 2005) or activation of presynaptic receptors (Ruiz et al., 2010).
Significance of dynamic switches of dendritic inhibition in network function
Sparse dentate activity is thought to be important for pattern separation and spatial information encoding (Leutgeb et al., 2007; McHugh et al., 2007; Moser et al., 2008). Multiple cellular mechanisms are coordinated for sparse activation of GCs. First, GC dendrites act as strong voltage attenuators. Synaptic inputs from the cortex strongly attenuate along GC dendrites (Schmidt-Hieber et al., 2007; Krueppel et al., 2011). Second, GC dendritic properties are linear integrators. GC dendrites summate synaptic inputs linearly and are not designed for highly efficient synchrony detection (Krueppel et al., 2011). Third, GC dendrites lack dendritic spikes that would allow them to be more efficiently to bring EPSPs to AP threshold (Krueppel et al., 2011). Finally, GCs have relatively hyperpolarized resting membrane potentials compared with other types of neurons (Schmidt-Hieber et al., 2007; Chiang et al., 2012). Beyond the cellular level, what is the circuit mechanism that contributes to the quiescent nature of GCs? Here, we show that GCs are controlled by the powerful dendritic inhibition during periods of intense activity. This novel finding not only provides an important bridge between the fields of synaptic short-term plasticity and hippocampal network states but also lends a considerable support for a critical role of dendritic inhibitory circuits in gating the information transfer from the cortex to the hippocampus.
GABAergic INs exert shunting inhibition onto GCs in the adult brain (Chiang et al., 2012). Therefore, burst spiking of dendrite-targeting INs during Up states may promote dendritic excitability but also exert powerful shunting inhibition to limit the degree of dendritic depolarization. Such a rapid switch on/off of dendritic inhibition during state transitions can prevent overexcitation of GCs and effectively control the total amount of signal transfer from the cortex to the hippocampus under normal conditions. Dendrite-targeting IN-GC synapses have a long synaptic latency. What is the computational significance of such a long delay? Analysis of IN network models suggests that the network oscillation frequency is reduced by longer delays and increased by shorter delays (see review by Bartos et al., 2007). Moreover, network coherence is substantially increased by shorter delays and reduced by longer delays. Together, specialization of dendrite-targeting IN connections may expand the dynamic range of network oscillation frequency and coherence.
Footnotes
This work was supported by the Ministry of Education (Aim for the Top University Plan), the National Health Research Institutes (NHRI-EX102-10105NI), the National Science Council (NSC101-2321-B-010-024, NSC100-2320-B-010-014-MY3), and the Cheng Hsin General Hospital (Grant 100-53 and 100F117CY19). We thank M. Bartos, P. Geshwill, D. Engel, A.J. Ruiz, and H.W. Tao for critically reading this manuscript and their comments on this manuscript; P. Somogyi (Oxford University) for help with cell identification; T. Klausberger for providing the in vivo interneuron spiking trains; and members of the C.-C.L. laboratory for discussions.
The authors declare no competing financial interests.
References
- Armstrong C, Soltesz I. Basket cell dichotomy in microcircuit function. J Physiol. 2012;590:683–694. doi: 10.1113/jphysiol.2011.223669. [DOI] [PMC free article] [PubMed] [Google Scholar]
- Ascoli GA, Alonso-Nanclares L, Anderson SA, Barrionuevo G, Benavides-Piccione R, Burkhalter A, Buzsáki G, Cauli B, Defelipe J, Fairén A, Feldmeyer D, Fishell G, Fregnac Y, Freund TF, Gardner D, Gardner EP, Goldberg JH, Helmstaedter M, Hestrin S, Karube F, et al. Petilla terminology: nomenclature of features of GABAergic interneurons of the cerebral cortex. Nat Rev Neurosci. 2008;9:557–568. doi: 10.1038/nrn2402. [DOI] [PMC free article] [PubMed] [Google Scholar]
- Bartos M, Vida I, Jonas P. Synaptic mechanisms of synchronized gamma oscillations in inhibitory interneuron networks. Nat Rev Neurosci. 2007;8:45–56. doi: 10.1038/nrn2044. [DOI] [PubMed] [Google Scholar]
- Bartos M, Alle H, Vida I. Role of microcircuit structure and input integration in hippocampal interneuron recruitment and plasticity. Neuropharmacology. 2011;60:730–739. doi: 10.1016/j.neuropharm.2010.12.017. [DOI] [PubMed] [Google Scholar]
- Bragin A, Jandó G, Nádasdy Z, Hetke J, Wise K, Buzsáki G. Gamma (40–100 Hz) oscillation in the hippocampus of the behaving rat. J Neurosci. 1995;15:47–60. doi: 10.1523/JNEUROSCI.15-01-00047.1995. [DOI] [PMC free article] [PubMed] [Google Scholar]
- Brody DL, Yue DT. Release-independent short-term synaptic depression in cultured hippocampal neurons. J Neurosci. 2000;20:2480–2494. doi: 10.1523/JNEUROSCI.20-07-02480.2000. [DOI] [PMC free article] [PubMed] [Google Scholar]
- Bucurenciu I, Kulik A, Schwaller B, Frotscher M, Jonas P. Nanodomain coupling between Ca2+ channels and Ca2+ sensors promotes fast and efficient transmitter release at a cortical GABAergic synapse. Neuron. 2008;57:536–545. doi: 10.1016/j.neuron.2007.12.026. [DOI] [PubMed] [Google Scholar]
- Buzsáki G. Feed-forward inhibition in the hippocampal formation. Prog Neurobiol. 1984;22:131–153. doi: 10.1016/0301-0082(84)90023-6. [DOI] [PubMed] [Google Scholar]
- Chiang PH, Wu PY, Kuo TW, Liu YC, Chan CF, Chien TC, Cheng JK, Huang YY, Chiu CD, Lien CC. GABA is depolarizing in hippocampal dentate granule cells of the adolescent and adult rats. J Neurosci. 2012;32:62–67. doi: 10.1523/JNEUROSCI.3393-11.2012. [DOI] [PMC free article] [PubMed] [Google Scholar]
- Chiu CQ, Lur G, Morse TM, Carnevale NT, Ellis-Davies GC, Higley MJ. Compartmentalization of GABAergic inhibition by dendritic spines. Science. 2013;340:759–762. doi: 10.1126/science.1234274. [DOI] [PMC free article] [PubMed] [Google Scholar]
- Cobb SR, Buhl EH, Halasy K, Paulsen O, Somogyi P. Synchronization of neuronal activity in hippocampus by individual GABAergic interneurons. Nature. 1995;378:75–78. doi: 10.1038/378075a0. [DOI] [PubMed] [Google Scholar]
- Eggermann E, Bucurenciu I, Goswami SP, Jonas P. Nanodomain coupling between Ca2+ channels and sensors of exocytosis at fast mammalian synapses. Nat Rev Neurosci. 2012;13:7–21. doi: 10.1038/nrn3125. [DOI] [PMC free article] [PubMed] [Google Scholar]
- Fioravante D, Regehr WG. Short-term forms of presynaptic plasticity. Curr Opin Neurobiol. 2011;21:269–274. doi: 10.1016/j.conb.2011.02.003. [DOI] [PMC free article] [PubMed] [Google Scholar]
- Földy C, Lee SH, Morgan RJ, Soltesz I. Regulation of fast-spiking basket cell synapses by the chloride channel ClC-2. Nat Neurosci. 2010;13:1047–1049. doi: 10.1038/nn.2609. [DOI] [PMC free article] [PubMed] [Google Scholar]
- Förster E, Zhao S, Frotscher M. Laminating the hippocampus. Nat Rev Neurosci. 2006;7:259–267. doi: 10.1038/nrn1882. [DOI] [PubMed] [Google Scholar]
- Freund TF, Buzsáki G. Interneurons of the hippocampus. Hippocampus. 1996;6:347–470. doi: 10.1002/(SICI)1098-1063(1996)6:4<347::AID-HIPO1>3.0.CO;2-I. [DOI] [PubMed] [Google Scholar]
- Glickfeld LL, Scanziani M. Distinct timing in the activity of cannabinoid-sensitive and cannabinoid-insensitive basket cells. Nat Neurosci. 2006;9:807–815. doi: 10.1038/nn1688. [DOI] [PMC free article] [PubMed] [Google Scholar]
- Glickfeld LL, Roberts JD, Somogyi P, Scanziani M. Interneurons hyperpolarize pyramidal cells along their entire somatodendritic axis. Nat Neurosci. 2009;12:21–23. doi: 10.1038/nn.2230. [DOI] [PMC free article] [PubMed] [Google Scholar]
- Goldberg EM, Clark BD, Zagha E, Nahmani M, Erisir A, Rudy B. K+ channels at the axon initial segment dampen near-threshold excitability of neocortical fast-spiking GABAergic interneurons. Neuron. 2008;58:387–400. doi: 10.1016/j.neuron.2008.03.003. [DOI] [PMC free article] [PubMed] [Google Scholar]
- Haider B, McCormick DA. Rapid neocortical dynamics: cellular and network mechanism. Neuron. 2009;62:171–189. doi: 10.1016/j.neuron.2009.04.008. [DOI] [PMC free article] [PubMed] [Google Scholar]
- Haider B, Duque A, Hasenstaub AR, McCormick DA. Neocortical network activity in vivo is generated through a dynamic balance of excitation and inhibition. J Neurosci. 2006;26:4535–4545. doi: 10.1523/JNEUROSCI.5297-05.2006. [DOI] [PMC free article] [PubMed] [Google Scholar]
- Han ZS, Buhl EH, Lörinczi Z, Somogyi P. A high degree of spatial selectivity in the axonal and dendritic domains of physiologically identified local-circuit neurons in the dentate gyrus of the rat hippocampus. Eur J Neurosci. 1993;5:395–410. doi: 10.1111/j.1460-9568.1993.tb00507.x. [DOI] [PubMed] [Google Scholar]
- Hefft S, Jonas P. Asynchronous GABA releases generates long-lasting inhibition at a hippocampal interneuron-principal neuron synapse. Nat Neurosci. 2005;8:1319–1328. doi: 10.1038/nn1542. [DOI] [PubMed] [Google Scholar]
- Howard A, Tamas G, Soltesz I. Lighting the chandelier: new vistas for axo-axonic cells. Trends Neurosci. 2005;28:310–316. doi: 10.1016/j.tins.2005.04.004. [DOI] [PubMed] [Google Scholar]
- Hu H, Martina M, Jonas P. Dendritic mechanisms underlying rapid synaptic activation of fast-spiking hippocampal interneurons. Science. 2010;327:52–58. doi: 10.1126/science.1177876. [DOI] [PubMed] [Google Scholar]
- Ishikawa T, Kaneko M, Shin HS, Takahashi T. Presynaptic N-type and P/Q-type Ca2+ channels mediating synaptic transmission at the calyx of Held of mice. J Physiol. 2005;568:199–209. doi: 10.1113/jphysiol.2005.089912. [DOI] [PMC free article] [PubMed] [Google Scholar]
- Jonas P, Vyleta NO. Loose coupling between Ca2+ channels and release sensors generated “conditional detonator” properties of hippocampal mossy fiber terminals (Program 334.19). 2012 Neuroscience Meeting Planner; Washington, DC: Society for Neuroscience; 2012. [Google Scholar]
- Klausberger T, Somogyi P. Neuronal diversity and temporal dynamics: the unity of hippocampal circuit operations. Science. 2008;321:53–57. doi: 10.1126/science.1149381. [DOI] [PMC free article] [PubMed] [Google Scholar]
- Kraushaar U, Jonas P. Efficacy and stability of quantal GABA release at a hippocampal interneuron-principal neuron synapse. J Neurosci. 2000;20:5594–5607. doi: 10.1523/JNEUROSCI.20-15-05594.2000. [DOI] [PMC free article] [PubMed] [Google Scholar]
- Krueppel R, Remy S, Beck H. Dendritic integration in hippocampal dentate granule cells. Neuron. 2011;71:512–528. doi: 10.1016/j.neuron.2011.05.043. [DOI] [PubMed] [Google Scholar]
- Larimer P, Strowbridge BW. Nonrandom local circuits in the dentate gyrus. J Neurosci. 2008;28:12212–12223. doi: 10.1523/JNEUROSCI.3612-08.2008. [DOI] [PMC free article] [PubMed] [Google Scholar]
- Leão RN, Mikulovic S, Leão KE, Munguba H, Gezelius H, Enjin A, Patra K, Eriksson A, Loew LM, Tort AB, Kullander K. OLM interneurons differentially modulate CA3 and entorhinal inputs to hippocampal CA1 neurons. Nat Neurosci. 2012;15:1524–1530. doi: 10.1038/nn.3235. [DOI] [PMC free article] [PubMed] [Google Scholar]
- Leutgeb JK, Leutgeb S, Moser MB, Moser EI. Pattern separation in the dentate gyrus and CA3 of the hippocampus. Science. 2007;315:961–966. doi: 10.1126/science.1135801. [DOI] [PubMed] [Google Scholar]
- Lien CC, Jonas P. Kv3 potassium conductance is necessary and kinetically optimized for high-frequency action potential generation in hippocampal interneurons. J Neurosci. 2003;23:2058–2068. doi: 10.1523/JNEUROSCI.23-06-02058.2003. [DOI] [PMC free article] [PubMed] [Google Scholar]
- Lien CC, Mu Y, Vargas-Caballero M, Poo MM. Visual stimuli-induced LTD of GABAergic synapses mediated by presynaptic NMDA receptors. Nat Neurosci. 2006;9:372–380. doi: 10.1038/nn1649. [DOI] [PubMed] [Google Scholar]
- Mann EO, Suckling JM, Hajos N, Greenfield SA, Paulsen O. Perisomatic feedback inhibition underlies cholinergically induced fast network oscillations in the rat hippocampus in vitro. Neuron. 2005;45:105–117. doi: 10.1016/j.neuron.2004.12.016. [DOI] [PubMed] [Google Scholar]
- Massi L, Lagler M, Hartwich K, Borhegyi Z, Somogyi P, Klausberger T. Temporal dynamics of parvalbumin-expressing axo-axonic and basket cells in the rat medial prefrontal cortex in vivo. J Neurosci. 2012;32:16496–16502. doi: 10.1523/JNEUROSCI.3475-12.2012. [DOI] [PMC free article] [PubMed] [Google Scholar]
- McBain CJ, Fisahn A. Interneurons unbound. Nat Rev Neurosci. 2001;2:11–23. doi: 10.1038/35049047. [DOI] [PubMed] [Google Scholar]
- McHugh TJ, Jones MW, Quinn JJ, Balthasar N, Coppari R, Elmquist JK, Lowell BB, Fanselow MS, Wilson MA, Tonegawa S. Dentate gyrus NMDA receptors mediate rapid pattern separation in the hippocampal network. Science. 2007;317:94–99. doi: 10.1126/science.1140263. [DOI] [PubMed] [Google Scholar]
- Miles R, Tóth K, Gulyás AI, Hájos N, Freund TF. Differences between somatic and dendritic inhibition in the hippocampus. Neuron. 1996;16:815–823. doi: 10.1016/S0896-6273(00)80101-4. [DOI] [PubMed] [Google Scholar]
- Moser EI, Kropff E, Moser MB. Place cells, grid cells, and the brain's spatial representation system. Annu Rev Neurosci. 2008;31:69–89. doi: 10.1146/annurev.neuro.31.061307.090723. [DOI] [PubMed] [Google Scholar]
- Moulder KL, Mennerick S. Reluctant vesicles contribute to the total readily releasable pool in glutamatergic hippocampal neurons. J Neurosci. 2005;25:3842–3850. doi: 10.1523/JNEUROSCI.5231-04.2005. [DOI] [PMC free article] [PubMed] [Google Scholar]
- Myatt DR, Hadlington T, Ascoli GA, Nasuto SJ. Neuromantic- from semi-manual to semi-automatic reconstruction of neuron morphology. Front Neuroinform. 2012;6:4. doi: 10.3389/fninf.2012.00004. [DOI] [PMC free article] [PubMed] [Google Scholar]
- Pouille F, Scanziani M. Enforcement of temporal fidelity in pyramidal cells by somatic feed-forward inhibition. Science. 2001;293:1159–1163. doi: 10.1126/science.1060342. [DOI] [PubMed] [Google Scholar]
- Pouille F, Scanziani M. Routing of spike series by dynamic circuits in the hippocampus. Nature. 2004;429:717–723. doi: 10.1038/nature02615. [DOI] [PubMed] [Google Scholar]
- Rizzoli SO, Betz WJ. Synaptic vesicle pools. Nat Rev Neurosci. 2005;6:57–69. doi: 10.1038/nrn1583. [DOI] [PubMed] [Google Scholar]
- Ruiz A, Campanac E, Scott RS, Rusakov DA, Kullmann DM. Presynaptic GABAA receptors enhance transmission and LTP induction at hippocampal mossy fiber synapses. Nat Neurosci. 2010;13:431–438. doi: 10.1038/nn.2512. [DOI] [PMC free article] [PubMed] [Google Scholar]
- Schmidt-Hieber C, Jonas P, Bischofberger J. Subthreshold dendritic signal processing and coincidence detection in dentate gyrus granule cells. J Neurosci. 2007;27:8430–8441. doi: 10.1523/JNEUROSCI.1787-07.2007. [DOI] [PMC free article] [PubMed] [Google Scholar]
- Stevens CF, Williams JH. Discharge of the readily releasable pool with action potentials at hippocampal synapses. J Neurophysiol. 2007;98:3221–3229. doi: 10.1152/jn.00857.2007. [DOI] [PMC free article] [PubMed] [Google Scholar]
- Thanawala MS, Regehr WG. Presynaptic calcium influx controls neurotransmitter release in part by regulating the effective size of the readily releasable pool. J Neurosci. 2013;33:4625–4633. doi: 10.1523/JNEUROSCI.4031-12.2013. [DOI] [PMC free article] [PubMed] [Google Scholar]
- Zucker RS, Regehr WG. Short-term synaptic plasticity. Annu Rev Physiol. 2002;64:355–405. doi: 10.1146/annurev.physiol.64.092501.114547. [DOI] [PubMed] [Google Scholar]