

Abstract
The hippocampus plays important roles in brain functions. Despite the importance of hippocampal functions, recent analyses of neuronal migration have mainly been performed on the cerebral neocortex, and the cellular mechanisms responsible for the formation of the hippocampus are not yet completely understood. Moreover, why a prolonged time is required for hippocampal neurons to complete their migration has been unexplainable for several decades. We analyzed the migratory profile of neurons in the developing mouse hippocampal CA1 region and found that the hippocampal pyramidal neurons generated near the ventricle became postmitotic multipolar cells and accumulated in the multipolar cell accumulation zone (MAZ) in the late stage of development. The hippocampal neurons passed through the pyramidal layer by a unique mode of migration. Their leading processes were highly branched and made contact with many radial fibers. Time-lapse imaging revealed that the migrating cells changed their scaffolds from the original radial fibers to other radial fibers, and as a result they proceed in a zigzag manner, with long intervals. The migrating cells in the hippocampus reminded us of “rock climbers” that instead of using their hands to pull up their bodies were using their leading processes to pull up their cell bodies. Because this mode of migration had never been described, we called it the “climbing” mode. The change from the “climbing” mode in the hippocampus to the “locomotion” mode in the neocortex may have contributed to the brain expansion during evolution.
Keywords: cortex, development, hippocampus, migration, neuron
Introduction
Neuronal migration is an essential part of the development of the hippocampus. However, recent analyses of neuronal migration have mainly been performed on the cerebral neocortex, and the cellular mechanisms responsible for the formation of the hippocampal layers are not yet completely understood.
In the developing neocortex, several different neuronal migration modes, including “locomotion,” “somal translocation,” “terminal translocation,” and “multipolar migration,” have been described (Rakic, 1972; Nadarajah et al., 2001; Tabata and Nakajima, 2003; Noctor et al., 2004; Cooper, 2008; Tabata et al., 2009; Sekine et al., 2011; Sekine et al., 2012; Yoshinaga et al., 2012). In contrast, the precise migration modes in the hippocampus are not yet known.
In the neocortex, neurons generated in the ventricular zone (VZ) accumulate in the lower part of the subventricular zone (SVZ) as multipolar cells (Tabata and Nakajima, 2003), where we dubbed the “multipolar cell accumulation zone” (MAZ) (Tabata et al., 2009, 2012). Although the neocortical MAZ overlaps with the SVZ, these two concepts are different from each other (Tabata et al., 2009, 2012) because the SVZ was originally defined as the zone adjacent to the VZ with proliferative activity but without interkinetic nuclear movement during the mitotic cycle (Angevine et al., 1970). The MAZ, on the other hand, is a zone enriched with postmitotic cells. The upper border of the SVZ is not very clear compared with that of the MAZ because basal progenitors are widely distributed from around the upper border of the VZ to the intermediate zone (IZ) of the neocortex (Tabata et al., 2009, 2012).
Analyses of fixed sections of developing hippocampus revealed that hippocampal neurons acquire a bipolar morphology during their migration through the stratum pyramidale (SP) (pyramidal layer) (Stensaas, 1967a, b; Nowakowski and Rakic, 1979; Nakahira and Yuasa, 2005). Multipolar cells have also been reported to exist in the developing hippocampus of the rabbit (Stensaas, 1967a, b), monkey (Nowakowski and Rakic, 1979), and mouse (Nakahira and Yuasa, 2005). However, knowledge of their contribution to the production of hippocampal neurons remains elusive. In addition, although it has been repeatedly pointed out that the hippocampal pyramidal neurons require a long time to complete their migration (Nowakowski and Rakic, 1981; Altman and Bayer, 1990; Tomita et al., 2011), why they require such a long time is unknown.
In the present study, we tracked the cells that were generated in the VZ of the hippocampal CA1 region. In the late stage of development, most of the postmitotic migrating cells assumed a multipolar shape and accumulated just above the VZ, or in the MAZ. They then left the MAZ and transformed into well-branched bipolar cells to migrate through the SP. One characteristic of these migrating cells was that they made contacts with more than one radial fiber at a time by their leading processes. Because this migratory behavior is distinct from the known modes of neocortical migration, we refer to this migration as the “climbing” mode.
Materials and Methods
In utero electroporation.
All animal experiments were performed according to the guidelines of Keio University School of Medicine. Pregnant ICR (Japan SLC) mice were deeply anesthetized with pentobarbital sodium (Nembutal), and their intrauterine embryos were surgically manipulated as described previously (Nakajima et al., 1997; Tabata and Nakajima, 2001; Kubo et al., 2010b). Embryos and pups of either sex were used. A CAG-driven enhanced green fluorescent protein (GFP) expression vector (pEGFP-CAGGS1) (Niwa et al., 1991) at a concentration of 1.0 μg/μl was injected into a lateral ventricle of the brain of each embryo, and in utero electroporation was performed. To transfect the embryonic hippocampus, we injected plasmids into a lateral ventricle of the telencephalon of each embryo and placed the cathode adjacent to the neocortex on the side of the target hippocampus for electroporation as we reported (Tomita et al., 2011). Mammalian Cre recombinase gene (M-cre) was obtained as a kind gift from Dr. Shuji Miyazaki (Koresawa et al., 2000) and subcloned into the pCAGGS1 vector (pCAG-M-cre). Lyn-GFP (Sawano et al., 2002) (kindly provided by Dr. Atsushi Miyawaki) was subcloned into the pCAGGS1 (pCAG-Lyn-GFP) or pCALNL vector (pCALNL-Lyn-GFP, pCALNL vector was purchased from Addgene). pCAG-Lyn-GFP at a concentration of 1.0 μg/μl or pCALNL-Lyn-GFP at a concentration of 1.0 μg/μl mixed with a very low concentration (1.0 ng/μl) of pCAG-M-cre was injected into a lateral ventricle, and in utero electroporation was performed.
Brain slice preparation and staining.
Coronal slices of developing brains were prepared as described previously (Tabata and Nakajima, 2003). Briefly, the brains were fixed with 4% paraformaldehyde and cut into 20 to 100 μm sections with a cryostat. Green fluorescent images were captured directly, except for Figure 3N, N′. The primary antibodies used were anti-GFP (1:1000, MBL International) (Fig. 3N,N′), anti-HuC/HuD (mouse antihuman HuC/HuD, 1:200, Invitrogen), antineurofilament-M (NF-M; rabbit anti-NF-M, 1:500, Millipore), anti-BrdU (mouse anti-BrdU, 1:50, BD Biosciences), anti-Ki67 (rabbit anti-Ki67, 1:100, Thermo), and anti-nestin (rat anti-nestin, 1:300, BD Biosciences). For in vivo BrdU labeling, pregnant mice were intraperitoneally injected with a 50 μg/g body weight dose of BrdU (Sigma). In some sections, the nuclei were labeled with propidium iodide (PI; Invitrogen) or DAPI (Invitrogen). Images were acquired through confocal microscopes (FV300 or FV1000, Olympus Optical).
Figure 3.

Multipolar cells accumulated in the MAZ of the hippocampus in the later stage of development. A–J, A GFP-plasmid was transfected into the hippocampal cells at E12.5 (A,F), E13.5 (B,G), E14.5 (C,H), E15.5 (D,I), or E16.5 (E,J) by in utero electroporation (EP), and the brains were examined 1 d (A–E) or 2 d (F–J) later. A′–J′, The images are higher magnifications of the boxed areas in A–J. K–L″, A GFP-plasmid was transfected into the hippocampal cells at E16.5, and the brains were examined 2 d later. Sections were stained for the neuronal marker HuC/D (magenta) and counterstained with DAPI (blue). L–L″, Higher magnifications of the boxed area in K‴. The GFP-positive cells in the MAZ were positive for HuC/D (white arrows). M, A GFP-plasmid was transfected into hippocampal cells at E12.5, E13.5, E14.5, E15.5, or E16.5, and the brains were examined 2 d later. Sections were stained with anti-NF-M antibody. N–N′, A GFP-plasmid was transfected at E13.5, a tdTomato-plasmid was transfected at E16.5, and the brains were examined 2 d later. Sections were counterstained with DAPI (blue). N′, A higher magnification of the boxed area in N.
Statistical analysis of cell distribution.
Cell distribution was statistically analyzed as described previously (Kubo et al., 2010a). Briefly, to analyze the distributions of the cells in vivo quantitatively, the nuclei of the GFP-positive cells were visualized by staining with PI. First, the relative distance of each cell from the ventricle was determined by measuring the distance (X) of the nucleus from the ventricle with the ImageJ software and dividing it (X) by the distance (Y) between the top of the SP and the ventricle along a line that passed through the nucleus (X/Y corresponds to the relative distance of the nucleus from the ventricle). Cell distribution was then evaluated by dividing areas into 5 bins and counting the cells in each bin. The deepest bin was designated Bin 1, and the most superficial bin was designated Bin 5. For the sake of accuracy, the relative distance of each cell from the ventricle (X/Y above) was used to assign the cells to each of the 5 bins. For example, cells whose relative distance was >0.8 but ≦1.0 were assigned to Bin 5, and those whose relative distance was 0–0.2 were assigned to Bin 1. The ratio of cells in each bin was calculated by dividing the number of cells in the bin by the total number of cells in all of the bins.
Time-lapse imaging and analysis of movement.
Time-lapse imagining was performed as described previously (Tabata and Nakajima, 2003). Briefly, coronal brain slices (200 μm thick) from the central one third of the forebrain were placed on a Millicell-CM membrane (pore size, 0.4 μm; Millipore), mounted in low melting temperature agarose, and cultured in Neurobasal medium containing B27 (Invitrogen). The dishes were then mounted in a 40% O2 incubator chamber fitted onto a confocal microscope (FV1000, Olympus Optical). Approximately 10 optical Z-section images were acquired at the indicated interval, and all focal planes (−200 μm thick) were merged.
Movement was analyzed using Move-tr/2D software program (Library).
Movies except for Movie 1 are available on the K.N. laboratory website (http://plaza.umin.ac.jp/∼Nakajima/page6/page19/page17/page17.html).
Results
Migration profile of CA1 pyramidal neurons at each stage of development
The pyramidal neurons in the mouse hippocampus are generated during embryonic days (E) 12–18 (Angevine, 1965; Caviness, 1973; Smart, 1982), and their generation peaks between E14 and E16 (Angevine, 1965; Stanfield and Cowan, 1979). To clarify the relationship between the migration profiles and the birth dates of the neurons, we transfected a GFP-expression plasmid into hippocampal VZ cells by in utero electroporation (Tabata and Nakajima, 2001; Tomita et al., 2011) at E12.5, E13.5, E14.5, E15.5, or E16.5, to label the pyramidal neurons that were generated on each of those days (Fig. 1).
Figure 1.

Migration profile of the CA1 pyramidal neurons at each stage of development. GFP-plasmid was transfected into the hippocampal cells at E12.5, E13.5, or E14.5, and the brains were examined 0.5, 1, 2, 3, 4, 5, and 6 d later. When electroporation (EP) was performed at E15.5 and at E16.5, the brains were also examined after 7 and 8, and after 7, 8, and 9 d, respectively. The sections were counterstained with PI (magenta). The numbers on the left side of the panels are the numbers of the 5 bins used to evaluate cell distribution. (The deepest bin was designated Bin 1, and the most superficial bin was designated Bin 5.) Two days after E12.5 electroporation, the GFP-labeled cells comprised the first cohort of cells (yellow arrows) that moved toward the pial surface. Three days after E12.5 electroporation, the thin SP of the hippocampal CA1 region (between the broken white lines) first became visible. Six days after E12.5 electroporation, the GFP-labeled neurons comprised the lowest part of the SP (black arrow). The broken white lines in panel of 3d are the boundaries of the forming SP. One day and 2 d after electroporation at E15.5 or E16.5, most of the GFP-labeled cells had accumulated just above the VZ (white arrows). The GFP-labeled cells remained in the IZ below the SP from 4 d to 6 d after E15.5 electroporation (white arrowheads), and for 4–7 d after E16.5 electroporation (white arrowheads). When electroporation was performed at E16.5, a considerable number of cells remained in the SO (yellow arrowheads) and did not enter the SP.
The time required for hippocampal neurons to reach the SP varied with the stage of the development. When electroporation was performed at E12.5, the first cohort of neurons generated in the VZ is thought to have been labeled. The cells labeled by electroporation on E12.5 started to move toward the pial surface at E14.5 (Fig. 1, 2d, yellow arrows). At E15.5 (3 d after electroporation), the thin primitive SP (pyramidal layer; hippocampal plate) of the hippocampal CA1 region became discernible, as reported previously (Fig. 1, 3d, between the broken white lines) (Soriano et al., 1994), and the first cohort of GFP-labeled cells participated in the emergence of the SP. At E18.5, 6 d after electroporation, the GFP-labeled cells were positioned in the lowest part of the SP, reflecting the “inside-out” manner of layer formation (Fig. 1, 6d, black arrow).
Figure 2.

Quantitative analysis of the migration profiles of the CA1 pyramidal neurons. A, A bin analysis was performed for the results shown in Figure 1 to evaluate cell distribution by dividing the space between the top of the SP and the ventricle into 5 equal areas (5 bins), and the number of GFP-positive cells in each bin was calculated as a percentage of the total number of cells in all 5 bins. Data are mean ± SE of the data obtained in three different brains. Blue asterisks: When electroporation (EP) was performed at E13.5 or E14.5, cells reached Bin 5 at 3 d after electroporation, indicating that it took 3 d for the fast migrating cells to reach the top of the SP. Magenta asterisks: Peaks in Bin 5 were observed 5 or 6 d after electroporation, indicating that the majority of GFP-labeled cells needed 5–6 d to migrate into the SP. Black asterisks: When electroporation was performed at E15.5 or E16.5, the peaks in Bin 5 were observed 7 and 8 d after electroporation, indicating that most GFP-labeled cells required a longer time (∼7 d) to complete their migration. B, A schematic representation of the neuronal migration profiles shown in A.
Figure 6.

Hippocampal neuron migration was compared with neocortical neuron “locomotion.” A, Time-lapse images of a migrating neocortical cell were obtained from a neocortical slice prepared 5 d after electroporation of a GFP-plasmid at E15.5. Top, Pia matter side. Bottom, Ventricular side. B, C, Trajectories of migrating hippocampal (SP) and neocortical (CP) cells are shown. Images were acquired every 15 min. Left panels, Trajectories (white lines) have been superimposed on the images of the last time frame. Right panels, Magenta arrows that reflect the speed and direction of the movements in each time frame have been superimposed on the trajectories. D, E, The trajectories of migrating cells in the SP of the hippocampus and in the CP of the neocortex were traced, and the speeds and direction of movements of the migrating cells in each time frame were measured. The durations of movements at relatively high speeds are shaded in gray bars. F, G, Mean ± SE of the maximum migration speeds (F) and mean ± SE of the average migration speeds (G) of cells in the SP of the hippocampus from 5 different brains and in the CP of the neocortex from 6 different brains, respectively. *p < 0.05 (Student's t test). **p < 0.01 (Student's t test). H, H′, The proportion of the movements by the migrating cells in the SP of the hippocampus and in the CP of the neocortex that were within the angles shown in H was measured for 5 (SP) different brains and 6 (CP) different brains, respectively. **p < 0.01 (Student's t test). The movements that were within 0 ± 15 degrees (i. 30 degrees) of a line drawn perpendicular to the ventricular surface were regarded as perpendicular movements.
It took longer time for the migrating cells to reach the top of the SP as development proceeded. When electroporation was performed at E13.5 or E14.5, the GFP-labeled cells left the VZ and gradually migrated toward the top of the SP. It took 3 d for the fast migrating cells to reach the top of the SP, but it took 5–6 d for the majority of the GFP-labeled cells to migrate into the SP (the cells in Fig. 1 reached Bin 5 at 3 d after electroporation; Fig. 2A, blue asterisks, E13.5EP and E14.5EP), and the peaks in Bin 5 were observed 5 or 6 d after electroporation (Fig. 2A, magenta asterisks, E13.5EP and E14.5EP; see also Fig. 2B). When electroporation was performed at E15.5 or E16.5, it took longer, ∼7 d, for most of the GFP-labeled cells to complete their migration (Fig. 1). In Figure 2A, the peaks in Bin 5 were observed 7 and 8 d after electroporation (Fig. 2A, black asterisks, EP15.5 and EP16.5; see also Fig. 2B). One day and 2 d after electroporation at E15.5 or E16.5, a majority of the GFP-labeled cells was found just above the VZ (Fig. 1, white arrows, 1 d and 2 d). After the GFP-labeled cells left this zone, they remained in the IZ below the SP from 4 to 6 d after electroporation on E15.5 (Fig. 1, white arrowheads) and from 4 to 7 d after electroporation on E16.5 (Fig. 1, white arrowheads). When electroporation was performed at E16.5, a considerable number of cells remained in the stratum oriens (SO), even 9 d after electroporation (Fig. 1; yellow arrowheads; see also Fig. 2B). Migration profiles in the hippocampal CA1 region are schematically summarized in Figure 2B.
Multipolar cells accumulated in the hippocampal MAZ in the late stage of development
Just after the GFP-labeled cells left the VZ, especially 1 or 2 d after electroporation, they assumed a multipolar morphology (Fig. 3A–J,A′–J′). At E16.5, 2 d after electroporation at E14.5, time-lapse imaging of multipolar cells labeled with GFP showed that they were exhibiting characteristic “multipolar movement” (Tabata and Nakajima, 2003), in which they extended and retracted processes dynamically and wandered or advanced slowly toward the SP (data not shown). When electroporation was performed at E15.5 or E16.5, the multipolar cells were more tangentially oriented and had densely accumulated just above the VZ (Fig. 3K–K‴). This zone in which the multipolar cells had accumulated was positive for the neuronal marker HuC/D (Fig. 3K′,K‴,L′,L″). Based on the above findings together, we concluded that an MAZ, which was originally described in the neocortex (Tabata et al., 2009, 2012; see Introduction for the details), is also present in the developing hippocampus.
The above results suggested that the long migration time in the late developmental stages might coincide with the appearance of the MAZ. We hypothesized that the axon bundles in the SO affect the migration and the shapes of the multipolar cells in the MAZ. To test our hypothesis, we visualized the axons with an anti-neurofilament (NF) antibody (Fig. 3M), and we found that the prominent NF-positive fiber bundles appeared at approximately E16.5, 2 d after electroporation at E14.5, and that the multipolar cells became tangentially aligned as the numbers of NF-positive fiber bundles increased. To examine whether the fiber bundles would derive from the earlier-generated neurons that have already reached the SP, we performed a sequential in utero electroporation (Kubo et al., 2010b; Sekine et al., 2011, 2012) by transfecting a GFP plasmid at E13.5 to label the early-born neurons, and then transfected a tdTomato plasmid at E16.5 to label the late-born neurons. When the brains were analyzed at E18.5, the tdTomato-positive cells were tangentially aligned underneath the GFP-positive axon bundles that derived from the GFP-positive cells in the SP (Fig. 3N,N′). Thus, the tangential orientation of the multipolar cells appeared to coincide with the appearance of the fiber bundles in the SO that include axons extended from the earlier-generated neurons.
Basal (intermediate) progenitors are rare in the CA1 region of the developing hippocampus
The discovery of the presence of the MAZ in the hippocampus led us to investigate whether an SVZ, which overlaps the MAZ and IZ and harbors basal progenitors in the developing neocortex (Angevine et al., 1970; Tabata et al., 2009, 2012), was present in the hippocampus. In the late stage of neocortical development, the SVZ contains two distinct populations of cells (Tabata et al., 2009, 2012). One of the populations of cells, a slowly exiting population (SEP), completes its final cell division within the VZ and migrates slowly into the MAZ, where the cells exhibit typical multipolar cell morphology and densely accumulate. The other population, a rapidly exiting population (REP), rapidly exits the VZ by somal translocation, and the majority of the cells in the REP undergo an additional cell division within the SVZ/IZ. The SEP in the SVZ are postmitotic neurons, whereas REP is thought to be mainly composed of basal progenitors, but it also contains some glial progenitors and oRG/bRG cells (outer SVZ radial glia-like cells/basal radial glial cells) (Tabata et al., 2009, 2012, 2013; Fietz et al., 2010; Hansen et al., 2010; Shitamukai et al., 2011; Wang et al., 2011; Hevner and Haydar, 2012). Because mitotic figures have been reported in the outer VZ and IZ in the developing hippocampus (Smart, 1982), we next investigated whether two similar distinct populations (equivalents of an SEP and REP in the neocortex) are also present in the developing hippocampus.
The hippocampal MAZ became apparent at E16.5. At E16.5, 1 d after electroporation at E15.5, more GFP-labeled cells were distributed in the MAZ (90.9 ± 1.6%, n = 205, 3 brains; Fig. 4C) than in the SO (8.4 ± 1.2%, n = 205, 3 brains; Fig. 4C). A few GFP-labeled cells that had a long ascending process and a trailing process and exhibited a somal-translocation morphology (Nadarajah et al., 2001) (Fig. 4A–B″, yellow arrow) were found in the SO (hippocampal IZ) above the MAZ. The proliferative activity of these cells exhibiting a somal-translocation morphology was assessed by a single shot of BrdU 24 h after electroporation and fixation of the embryos 30 min later. Although only a small proportion of the GFP-positive cells was present in the SO, a high proportion of the GFP-positive cells in the SO were BrdU-positive (29.6 ± 3.0%, n = 18, 3 brains; Fig. 4D), whereas BrdU-positive cells were rarely found (1.6 ± 0.9%, n = 187, 3 brains) in the MAZ of the hippocampus (Fig. 4D).
Figure 4.

A few basal progenitors were present in the CA1 region of the hippocampus. A–D, A GFP-plasmid was transfected into the hippocampal cells at E15.5, and the brains were examined 1 d later. BrdU was injected 30 min before fixation. The sections were stained with anti-BrdU (magenta) and counterstained with DAPI (blue). Most of the GFP-positive cells were found in the VZ and MAZ, but some were found in the SO (A, arrow). B–B″, High magnification revealed that it exhibited “somal-translocation” morphology having an ascending processes and a trailing process. C, The numbers of GFP-positive cells in the hippocampal MAZ and SO were calculated as a proportion of the total number of GFP-positive cells in the MAZ and SO combined. Values shown are mean ± SE of the average values obtained in three different brains. D, The numbers of BrdU- and GFP-double positive cells as a proportion of the GFP-positive cells in the MAZ and in the SO were calculated. Values shown are mean ± SE of the average values obtained in three different brains. E–H, A GFP-plasmid was transfected into the neocortical cells at E16.5, and the brains were examined 1 d later. BrdU was injected 30 min before fixation. Sections were stained with anti-BrdU (magenta) and counterstained with DAPI (blue). Most of the GFP-positive cells were found in the VZ and MAZ, but some cells with somal-translocation morphology were found in the IZ (E, arrows). F–F″, Higher magnification of a cell with somal-translocation morphology (E, yellow arrow) revealed that it was BrdU-positive. G, The numbers of GFP-positive cells in the neocorical MAZ and in the neocortical IZ were calculated as a proportion of the total number of GFP-positive cells in the MAZ and IZ combined. Values shown are mean ± SE of the average values obtained in three different brains. H, The numbers of BrdU- and GFP-double positive in the neocortical MAZ and in the IZ were calculated as a proportion of the GFP-positive cells in the MAZ and IZ. Values shown are mean ± SE of the average values obtained in three different brains. I–L, A GFP-plasmid was transfected into hippocampal cells at E15.5, and the brains were examined 1 d later. Sections were stained with anti-Ki67 (magenta) and counterstained with DAPI (blue). Some GFP and Ki67-double positive cells were distributed in the SO (I, arrows). J–J″, High magnifications of a cell in I (yellow arrow). K, The numbers of GFP-positive cells in the hippocampal MAZ and in the hippocampal SO were calculated as a proportion of the total number of GFP-positive cells in the MAZ and SO combined. Values shown are mean ± SE of the average values obtained in three different brains (n = 194). GFP-positive cells were rarely observed in the SO of the hippocampus where they account for only 8.4 ± 2.3% of the total number of GFP-positive cells in the MAZ and SO combined. L, The numbers of Ki67- and GFP-double positive cells were calculated as a portion of the GFP-positive cells distributed in the MAZ and in the SO. Values shown are mean ± SE of the average values obtained in three different brains. A high proportion of the GFP-positive cells in the SO was Ki67-positive (45.4 ± 9.8% of the GFP-positive cells in the SO, n = 16, 3 brains). Only a small proportion of the GFP-positive cells in the MAZ was the Ki67-positive cells (3.0 ± 1.3%, n = 178, 3 brains).
For comparison, in the medial neocortex (Fig. 4E–F″), the typical MAZ was observed at E17.5, and more GFP-positive cells were found in the neocortical MAZ (corresponding to the SEP, 72.9 ± 4.4%, n = 290, 3 brains; Fig. 4G) than in the IZ (corresponding to the REP, 22.6 ± 4.2%, n = 290, 3 brains; Fig. 4G), 1 d after electroporation at E16.5. The proportion of GFP-positive cells in the medial neocortex that was BrdU-positive (Fig. 4E, arrows) was higher in the IZ (24.0 ± 1.0% of the GFP-positive cells, n = 73, 3 brains) than in the MAZ (8.8 ± 1.4% of the GFP-positive cells, n = 217, 3 brains) (Fig. 4H), similar to the results in the hippocampus.
The above observations indicated that most of the GFP-positive cells in the hippocampal MAZ were not proliferative, the same as in the neocortical MAZ. The examination using an antibody against Ki67 (a marker for mitotically active cells in all phases of the cell cycle, including the G1, S, G2, and M phases) (Gerdes et al., 1984) confirmed the low proliferative activity in the hippocampal MAZ (Fig. 4I–L). These results suggested that most CA1 hippocampal cells complete their final cell division in the VZ and migrate into the MAZ, where they become postmitotic multipolar cells. These multipolar cells accumulate in the hippocampal MAZ, especially in the late stage of development (i.e., after E15.5). Members of the other population, basal progenitors, which exhibit a migratory profile similar to that of the neocortical REP, are rather rare in the developing hippocampus.
Time-lapse imaging of hippocampal neurons migrating through the SO and the SP
Although it was previously suggested that multipolar cells transformed into spindle-shaped cells arranged along the radial glia based on examinations of fixed tissue sections (Nakahira and Yuasa, 2005), the precise modes of migration of hippocampal cells had never been investigated by imaging living cells. Two distinct modes of radial neuronal migration, “locomotion” and “terminal translocation,” have been reported in the cortical plate (CP) of the developing neocortex (Nadarajah et al., 2001). In the “locomotion” mode, cells having an unbranched (or slightly branched) leading process migrate a long distance along the radial fibers in a saltatory manner. When the tip of the leading process reaches the neocortical MZ, they migrate by the “terminal translocation” mode, in which only the soma rapidly moves to the top of the neocortical CP, whereas the branched tips of the process remain attached to the MZ. We then investigated how the hippocampal cells migrate to the top of the SP.
Examination of the brains 5 d after electroporation at E15.5 showed that the GFP-labeled cells were mainly located in the SO, but some had already entered the SP (Fig. 1). A high-magnification view of GFP-positive cells in the SO showed that they were spindle-shaped bipolar cells that extended multiple processes in various directions (Fig. 5A–A″). The GFP-positive cells that had already entered the SP were more radially oriented and had thin trailing processes, and their leading processes usually had several branches (Fig. 5B–B″).
Figure 5.
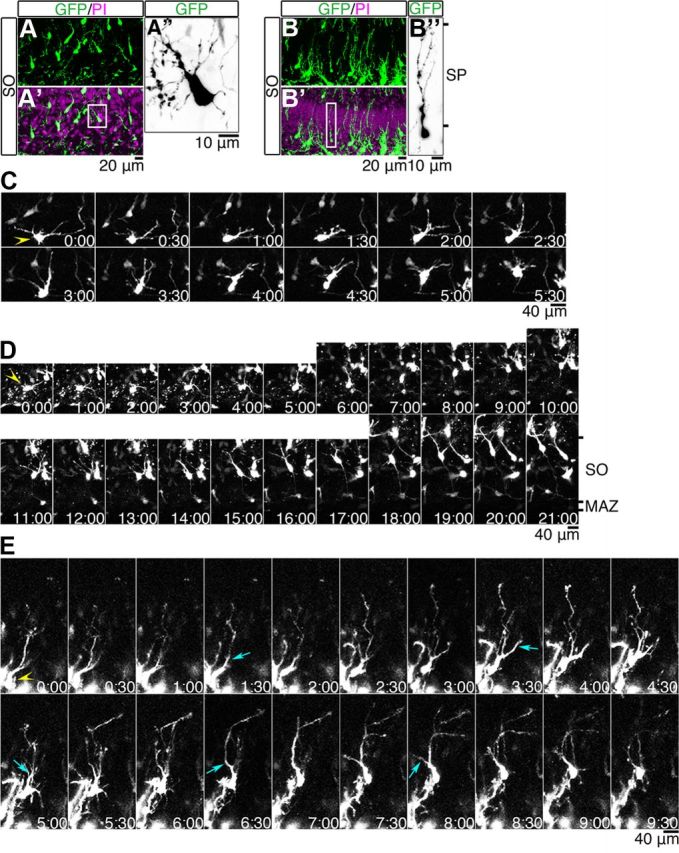
Time-lapse imaging of migrating hippocampal cells. A–B″, A GFP-plasmid was transfected into the hippocampal cells at E15.5, and the brains were examined 5 d later. A′, B′, Sections were counterstained with PI (magenta). A″, B″, Higher magnifications of the GFP images in the boxed areas in A′ and B′. C, Time-lapse images of a multipolar cell (yellow arrowhead) were obtained from a hippocampal slice prepared 3 d after electroporation of a GFP-plasmid at E15.5. D, E, Time-lapse images of hippocampal cells (yellow arrowheads) were obtained from a hippocampal slice prepared 5 d after electroporation of a GFP-plasmid at E15.5. The time displayed in each panel indicates the time (hours and minutes) elapsed since the start of the observation period. The proximal part of one branch became thicker (cyan arrows), and soon the cell body moved a short distance toward the point where the process branched. Top, SP side. Bottom, Ventricular side.
We then introduced a GFP plasmid into the VZ cells at E15.5, prepared hippocampal slices 3–5 d after electroporation, and acquired time-lapse images every 15 min for 24 h (Fig. 5C–E). When we started to make our observations 3 d after electroporation at E15.5, the GFP-labeled cells in the SO exhibited characteristic “multipolar movement,” but they gradually transformed into spindle-shaped bipolar cells that had elaborate leading processes with multiple branches (Fig. 5C). Some cells were in a transitional state between a bipolar morphology and the multipolar morphology (Fig. 5C); transitions were also observed in Fig. 5D. When our observations started 5 d after electroporation at E15.5, the GFP-labeled multipolar cells were seen to gradually migrate toward the SP and enter it (Fig. 5D). They became spindle-shaped and usually had one or two major branched leading processes (Fig. 5B–B″; see Fig. 7B).
Figure 7.

Sparse-cell labeling of “climbing” neurons. A, A schematic representation of the sparse-cell labeling technique. To restrict transgene expression to just a few cells, a combination of a Cre-dependent expression vector containing the CAG promoter, a floxed “stop cassette,” and a reporter gene (EGFP) (pCLANL-GFP vector) and a very low concentration (1.0 ng/μl) of a Cre-recombinase expression vector (pCAG-M-cre) was used. B, Sparse-cell labeling was performed by transfecting hippocampal cells at E15.5, and the brains were examined 5 d later. B′, Sections were stained with an anti-nestin antibody (magenta) and counterstained with DAPI (blue). B″, Higher magnifications of the single confocal sections of the boxed areas in B′ (i-v) are shown. C, C′, Sparse-cell labeling with a membrane-anchored form of GFP (Lyn-GFP) was performed by transfecting hippocampal cells at E15.5, and the brains were examined 5 d later. Lyn-GFP was inserted into a Cre-dependent expression vector containing a CAG promoter and a floxed “stop cassette” (pCALNL-Lyn-GFP vector). Sections were stained with an anti-nestin antibody (magenta) and counterstained with DAPI (blue). C″, Higher magnifications of the single confocal sections in the boxed areas in (C′) (i-vi) are shown. D, A GFP-plasmid was transfected into the hippocampal cells at E13.5 (green), and tdTomato plasmid was transfected at E15.5 (magenta), and the brains were examined at E17.0. Sections were counterstained with DAPI (blue). E, F, Time-lapse images were obtained from a hippocampal slice prepared at E17.5 (E) and E16.0 (F) that had been electroporated with a Lyn-GFP plasmid at E14.5 (E) and E13.5 (F) to label the migrating cells (green) and with a tdTomato plasmid at E16.5 (E) and E15.5 (F) to label the radial fibers (magenta). The major processes of the migrating cells (yellow arrowheads in panel 0:00) were in contact with a radial fiber at certain times (yellow arrows) but were seen to be in contact with a different radial fiber at a later time (cyan arrows). The time displayed in each panel is the time (hours and minutes) that had elapsed since the start of the observation period. Top, the MZ side; bottom, the ventricular side. See also Movie 1. E′, Higher magnification of the panel in Figure 7E (2:00). The GFP-labeled cells were seen to have made multiple contacts with different tdTomato-labeled radial fibers (E′, yellow arrows).
Examination of the cells migrating in the SP revealed that the presence of one or two very long, branched major leading processes (Fig. 5E). Without stopping the dynamically moving branches, the basal part of a leading process grew thicker and the cell body moved a short distance toward the point where the leading process branched. The proximal part of one branch later became thicker and looked like a new leading process (Fig. 5E, cyan arrows), and soon the cell body moved a short distance toward the point where this new process branched. After the cell body moved in this manner several times, the cell finally reached the top of the SP.
Hippocampal neurons migrate through the SP in a zigzag manner
Next, to compare the migratory behavior of the neurons in the hippocampus and neocortex, we performed time-lapse imaging of neocortical neurons (Fig. 6A). Although the tip of the leading process of the migrating cells in the neocortex was occasionally branched, the smooth, simple leading processes of the neocortical cells migrating in the “locomotion” mode contrasted with the leading processes of hippocampal cells, which had several long branches. We then quantitatively analyzed cell movement by tracing the trajectories of cells and measuring their speed and angle of migration during each observation period (Fig. 6B–H′). The result showed that the migrating hippocampal cells frequently changed direction and pursued a zigzag course. Analysis of the migration speeds in the hippocampal SP and in the neocortical CP, showed that the speed of the cells alternated fast and slow (Fig. 6D,E). The duration of the rapid movement in the hippocampal SP was shorter than in the neocortical CP (Fig. 6D,E, shaded in gray). The average maximum speed of the movement of the cell bodies of the hippocampal cells (40.9 ± 5.9 μm/h, n = 5) was slower than that of the neocortical cells (80.6 ± 10.2 μm/h, n = 6) (Fig. 6F), and as a result the average migration speed of the hippocampal cells (7.1 ± 1.4 μm/h, n = 5) was significantly slower than that of the neocortical cells (20.5 ± 2.4 μm/h, n = 6) (Fig. 6G). Comparison of directions in which the cells migrated showed that the direction of the neocortical cells was mostly perpendicular to the ventricular surface (0 ± 15 degrees; Fig. 6H, “i. 30 degrees”) and that the hippocampal cells frequently moved in different directions. The proportions of the movements by the migrating cells in the neocortical CP that deviated no more than 15 degrees from a line drawn perpendicular to the ventricular surface was 63.2 ± 5.5% (Fig. 6H′, “i”), whereas it was 29.1 ± 1.6% for the migrating cells in the hippocampal SP (Fig. 6H′, “i”). Thus, the neocortical cells moved relatively in a straight line (Fig. 6C), whereas the hippocampal cells migrated in a zigzag manner (Fig. 6B).
The mode of migration of the hippocampal cells differed from the “locomotion” mode or “terminal translocation” mode of migration of the neocortical cells. The cell bodies of the hippocampal cells translocated toward the branching point of the leading processes in a manner similar to the “terminal translocation,” but their migration speed was much slower than the reported migration speed of “terminal translocation” (66 μm/h) (Nadarajah et al., 2001). The hippocampal cells repeated these slow, short translocations several times, whereas the neocortical cells exhibit “terminal translocation” only once, just before they complete migration (Nadarajah et al., 2001; Sekine et al., 2011). The hippocampal cells repeatedly moved short distances in a discontinuous manner that was similar to the movements in the “locomotion” mode of migration, but the “locomotion” movements of the neocortical cells are a saltatory movement, and their trajectory is linear, whereas the movement of the hippocampal cells was zigzag, with long intervals between movements. Moreover, although the leading process of neocortical cells is rather simple during “locomotion,” the hippocampal cells have highly branched complex leading processes. In other words, the hippocampal cells undergo sequential translocation in which they use their branched leading processes to pass through the SP. In total, we imaged 67 hippocampal migrating neurons from 41 slices. Sixty neurons (89.6%) had branched leading processes, and among them, 53 neurons (79.1%) moved in a zigzag manner by repeatedly extending and shortening their branched leading processes.
Hippocampal neurons migrate by a “climbing” mode
To examine the morphology of the migrating hippocampal neurons in greater detail, we labeled each migrating neuron by a sparse-cell labeling technique. To restrict transgene expression to a limited number of cells and enable to label a small subset of migrating cells, we used a Cre-dependent expression vector containing a CAG promoter (Matsuda and Cepko, 2007), a floxed stop cassette, and a reporter gene (GFP) (the pCALNL-GFP vector) in combination with a very low concentration of a Cre-recombinase expression vector (pCAG-M-cre) (Fig. 7A). The cells that were visualized had elaborate leading processes that extended many branches (Fig. 7B). Staining with an anti-nestin antibody showed that migrating cells frequently came into contact with the radial fibers at the sites of the varicosities (Fig. 7B′; single confocal sections of the boxed areas are shown in Fig. 7B″).
Movie 1.
Time-lapse imaging of migrating cells and the radial fibers labeled with Lyn-GFP and tdTomato, respectively, by sequential in utero electroporation. Images were captured every 30 min. The movie corresponds to Figure 7F.
To further elucidate the interaction between the migrating cells and the radial fibers in the hippocampus, we labeled the migrating cells with a membrane-anchored form of GFP (Lyn-GFP) (Sawano et al., 2002), which enabled us to fully depict the contours of the migrating cells (Fig. 7C). Staining with an anti-nestin antibody showed that each migrating cell contacted more than one radial fiber with their branched processes (Fig. 7C; single confocal sections of the boxed areas are shown in Fig. 7C′).
To perform time-lapse imaging, we labeled the migrating cells and the radial fibers with different colors by sequential in utero electroporation. As shown in Figure 7D and in our previous papers (Kubo et al., 2010b; Sekine et al., 2011, 2012), cells born at different dates are labeled by different colors using this method. First, electroporation with a Lyn-EGFP plasmid was performed 3 d before time-lapse imaging to monitor the migrating neurons in SP. Next, we transfected a tdTomato plasmid into the same embryos a half day before the imaging to label the radial fibers and then prepared brain slices for time-lapse imaging. The tdTomato-positive fibers were nestin-positive within 2 d of the electroporation (data not shown), indicating that the radial fibers had been labeled by tdTomato. When time-lapse imaging of the Lyn-GFP-labeled cells and the tdTomato-labeled radial fibers were merged (Fig. 7E,F; Movie 1), the Lyn-GFP-labeled cells were observed to make multiple contacts with different tdTomato-labeled radial fibers (Fig. 7E′, arrows). The major processes of most of the migrating cells made contacts with radial fibers at several different points in time (Fig. 7E,F, yellow arrows), but moved to other radial fibers (Fig. 7E,F, cyan arrows) during the observation period. These results revealed that leading processes of the migrating cells came into contact with more than one radial fiber and changed their scaffolds from the original radial fibers to other radial fibers during their migration. Because the migrating cells in the hippocampus reminded us of “rock climbers” that, instead of using their hands to pull up their bodies were using their leading processes to pull up their cell bodies, we propose to call this mode of migration the “climbing” mode.
Discussion
In this study, we tracked the migrating cells generated in the hippocampal VZ (Fig. 8). The migrating cells in the hippocampus have highly branched leading processes, in contrast to the simple major process of the migrating cells in the neocortical CP. Moreover, although the leading processes of the migrating hippocampal cells made extensive contact with the radial fibers, their cell bodies did not seem to make close contact with the radial fibers, a finding that was consistent with the results of a previous study showing that migrating hippocampal cells in the outermost part of the monkey IZ lose their apparent apposition to radial fibers (Nowakowski and Rakic, 1979). Close contact of hippocampal leading processes with radial fibers and their relatively free cell bodies may explain the zigzag trajectory of the hippocampal cells (Fig. 6B) and their wandering between the different radial fibers (Fig. 7E,F; Movie 1).
Figure 8.

A schematic representation of the migratory behavior of neocortical and hippocampal cells. Two populations of cells in the neocortex, an SEP and an REP, migrate from the VZ during late development. REP cells are mainly basal progenitors, and they include glial progenitors. SEP cells transform into multipolar cells without further cell division and accumulate just above the VZ in what is called the MAZ. Both SEP cells and REP cells have multipolar morphology, transform into spindle-shaped bipolar cells, enter the CP, and migrate by the “locomotion” mode. They reach the top of the cortical plate by the “terminal translocation” mode. Both SEP cells and REP cells were observed in the hippocampus, but the REP was smaller than the SEP. SEP cells accumulate in the hippocampal MAZ, where they transform into spindle-shaped cells with multiple processes. As they migrated through the SP, they retained several processes that were in contact with radial fibers. Their cell bodies did not have extensive contact with radial fibers. The cell bodies of the migrating cells translocated several times and changed their scaffolds from the original radial fibers to other radial fibers until they reached the top of SP. Because their appearance reminds us of “rock climbers” that, instead of using their hands to pull up their bodies, were using their leading processes to pull up their cell bodies; we called this mode of migration the “climbing” mode. SR, Stratum radiatum.
We call the above-described mode of migration in the hippocampus the “climbing” mode. The “climbing” mode may be necessary to squeeze between the crowded cell bodies of predecessors in the hippocampal SP. Translocation movements by the cell bodies of the hippocampal cells toward the branch point of the leading processes occurred several times, whereas the neocortical cells move only once in a process called terminal translocation. The high cell density of the hippocampal SP resembles the densely packed primitive cortical zone in the neocortex through which the migrating cells pass by the terminal translocation mode (Sekine et al., 2011, 2012). However, because the average thickness of the SP is >100 μm (Fig. 1), as opposed to an average thickness of the primitive cortical zone of 40–50 μm (Sekine et al., 2011), the hippocampal SP may be too thick for migrating cells to pass through in a single movement. Thus, the hippocampal cells might make repeated terminal-translocation-like movements to pass through the SP.
Some studies have shown that hippocampal pyramidal neurons take a longer time to reach their final destination, even though the distance between the ventricular surface and the top of the neocortical CP is many times greater than the distance from the hippocampal ventricular surface and the top of the SP in CA1 (Nowakowski and Rakic, 1981; Altman and Bayer, 1990; Nakahira and Yuasa, 2005; Tomita et al., 2011). Nowakowski and Rakic (1981) mentioned that difference in migration rate might depend on the mechanism of cell translocation and/or the timing of signals that initiate cell movement. Both are indeed shown in our current study because our results demonstrated that the hippocampal neurons accumulated in the MAZ for several days and then migrated through the pyramidal layer by a unique mode of migration. Altman and Bayer (1990) suspected that the “alveolar channels” that constitute the extracellular matrix required to guide hippocampal fibers, especially the axons of pyramidal neurons, might be responsible for the longer sojourn of pyramidal cells. We hypothesized that the axon bundles in the SO affect the migration and morphology of the multipolar cells, and in support of our hypothesis, we observed that the multipolar cells became tangentially oriented when they encountered NF-positive axon bundles (Fig. 3M) and that they included axons extended from the earlier-generated neurons in the SP (Fig. 3N). It may take several days for the multipolar cells to acquire some mechanisms to pass through the overlying fiber bundles.
We also investigated whether a neocortical REP-like population, including the basal progenitors, is present in the developing hippocampus. We observed proliferative activity by the GFP-labeled cells in the SO in the CA1 region of the hippocampus, but there were few proliferative SO cells, indicating that, unlike the neocortex, the CA1 region of the hippocampus does not contain many basal progenitors. Although the contribution of basal progenitors to hippocampal neurogenesis seems to be rather limited, it should be noted that an archicortex, such as the hippocampus, contains some basal progenitors, considering that the existence and increase of basal progenitors are thought to be important for the evolution of neocortex (Kriegstein et al., 2006; Hansen et al., 2010). Future elucidation of the precise molecular mechanisms that underlie neuronal migration in the hippocampus and comparison with the neocortex may provide the insight into changes in the development of the cerebral cortex during the course of evolution.
Footnotes
This work was supported by the Strategic Research Program for Brain Sciences (“Understanding of molecular and environmental bases for brain health”), the Grant-in-Aid for Scientific Research of the Ministry of Education, Culture, Sports, Science, and Technology of Japan (22111004; 22240041; 25640039; 23700417; 25116522), and Keio Gijuku Academic Development Funds. Movies except for Movie 1 are available on the K.N. laboratory website (http://plaza.umin.ac.jp/∼Nakajima/page6/page19/page17/page17.html). We thank members of K.N. laboratory for valuable discussions; Dr. Atsushi Miyawaki, Dr. Jun-ichi Miyazaki, and Dr. Shuji Miyagawa for the Lyn-EGFP, CAG promoter, and M-cre, respectively; and Dr. Shinji Sasaki and Dr. Hidenori Tabata for the construction of pCAG-M-cre and pCALNL-Lyn-GFP, respectively.
The authors declare no competing financial interests.
References
- Altman J, Bayer SA. Prolonged sojourn of developing pyramidal cells in the intermediate zone of the hippocampus and their settling in the stratum pyramidale. J Comp Neurol. 1990;301:343–364. doi: 10.1002/cne.903010303. [DOI] [PubMed] [Google Scholar]
- Angevine JB., Jr Time of neuron origin in the hippocampal region: an autoradiographic study in the mouse. Exp Neurol. 1965;(Suppl 2):1–70. [PubMed] [Google Scholar]
- Angevine JB, Bodian D, Coulombre AJ, Edds MV, Hamburger V, Jacobson M, Lyser KM, Prestige MC, Sidman RL, Varon S, Weiss PA. Embryonic vertebrate central nervous system: revised terminology: the Boulder Committee. Anat Rec. 1970;166:257–261. doi: 10.1002/ar.1091660214. [DOI] [PubMed] [Google Scholar]
- Caviness VS., Jr Time of neuron origin in the hippocampus and dentate gyrus of normal and reeler mutant mice: an autoradiographic analysis. J Comp Neurol. 1973;151:113–120. doi: 10.1002/cne.901510203. [DOI] [PubMed] [Google Scholar]
- Cooper JA. A mechanism for inside-out lamination in the neocortex. Trends Neurosci. 2008;31:113–119. doi: 10.1016/j.tins.2007.12.003. [DOI] [PubMed] [Google Scholar]
- Fietz SA, Kelava I, Vogt J, Wilsch-Bräuninger M, Stenzel D, Fish JL, Corbeil D, Riehn A, Distler W, Nitsch R, Huttner WB. OSVZ progenitors of human and ferret neocortex are epithelial-like and expand by integrin signaling. Nat Neurosci. 2010;13:690–699. doi: 10.1038/nn.2553. [DOI] [PubMed] [Google Scholar]
- Gerdes J, Lemke H, Baisch H, Wacker HH, Schwab U, Stein H. Cell cycle analysis of a cell proliferation-associated human nuclear antigen defined by the monoclonal antibody Ki-67. J Immunol. 1984;133:1710–1715. [PubMed] [Google Scholar]
- Hansen DV, Lui JH, Parker PR, Kriegstein AR. Neurogenic radial glia in the outer subventricular zone of human neocortex. Nature. 2010;464:554–561. doi: 10.1038/nature08845. [DOI] [PubMed] [Google Scholar]
- Hevner RF, Haydar TF. The (not necessarily) convoluted role of basal radial glia in cortical neurogenesis. Cereb Cortex. 2012;22:465–468. doi: 10.1093/cercor/bhr336. [DOI] [PMC free article] [PubMed] [Google Scholar]
- Koresawa Y, Miyagawa S, Ikawa M, Matsunami K, Yamada M, Shirakura R, Okabe M. Synthesis of a new Cre recombinase gene based on optimal codon usage for mammalian systems. J Biochem. 2000;127:367–372. doi: 10.1093/oxfordjournals.jbchem.a022617. [DOI] [PubMed] [Google Scholar]
- Kriegstein A, Noctor S, Martínez-Cerdeño V. Patterns of neural stem and progenitor cell division may underlie evolutionary cortical expansion. Nat Rev Neurosci. 2006;7:883–890. doi: 10.1038/nrn2008. [DOI] [PubMed] [Google Scholar]
- Kubo K, Tomita K, Uto A, Kuroda K, Seshadri S, Cohen J, Kaibuchi K, Kamiya A, Nakajima K. Migration defects by DISC1 knockdown in C57BL/6, 129X1/SvJ, and ICR strains via in utero gene transfer and virus-mediated RNAi. Biochem Biophys Res Commun. 2010a;400:631–637. doi: 10.1016/j.bbrc.2010.08.117. [DOI] [PMC free article] [PubMed] [Google Scholar]
- Kubo K, Honda T, Tomita K, Sekine K, Ishii K, Uto A, Kobayashi K, Tabata H, Nakajima K. Ectopic Reelin induces neuronal aggregation with a normal birthdate-dependent “inside-out” alignment in the developing neocortex. J Neurosci. 2010b;30:10953–10966. doi: 10.1523/JNEUROSCI.0486-10.2010. [DOI] [PMC free article] [PubMed] [Google Scholar]
- Matsuda T, Cepko CL. Controlled expression of transgenes introduced by in vivo electroporation. Proc Natl Acad Sci U S A. 2007;104:1027–1032. doi: 10.1073/pnas.0610155104. [DOI] [PMC free article] [PubMed] [Google Scholar]
- Nadarajah B, Brunstrom JE, Grutzendler J, Wong RO, Pearlman AL. Two modes of radial migration in early development of the cerebral cortex. Nat Neurosci. 2001;4:143–150. doi: 10.1038/83967. [DOI] [PubMed] [Google Scholar]
- Nakahira E, Yuasa S. Neuronal generation, migration, and differentiation in the mouse hippocampal primoridium as revealed by enhanced green fluorescent protein gene transfer by means of in utero electroporation. J Comp Neurol. 2005;483:329–340. doi: 10.1002/cne.20441. [DOI] [PubMed] [Google Scholar]
- Nakajima K, Mikoshiba K, Miyata T, Kudo C, Ogawa M. Disruption of hippocampal development in vivo by CR-50 mAb against reelin. Proc Natl Acad Sci U S A. 1997;94:8196–8201. doi: 10.1073/pnas.94.15.8196. [DOI] [PMC free article] [PubMed] [Google Scholar]
- Niwa H, Yamamura K, Miyazaki J. Efficient selection for high-expression transfectants with a novel eukaryotic vector. Gene. 1991;108:193–199. doi: 10.1016/0378-1119(91)90434-D. [DOI] [PubMed] [Google Scholar]
- Noctor SC, Martínez-Cerdeño V, Ivic L, Kriegstein AR. Cortical neurons arise in symmetric and asymmetric division zones and migrate through specific phases. Nat Neurosci. 2004;7:136–144. doi: 10.1038/nn1172. [DOI] [PubMed] [Google Scholar]
- Nowakowski RS, Rakic P. The mode of migration of neurons to the hippocampus: a Golgi and electron microscopic analysis in foetal rhesus monkey. J Neurocytol. 1979;8:697–718. doi: 10.1007/BF01206671. [DOI] [PubMed] [Google Scholar]
- Nowakowski RS, Rakic P. The site of origin and route and rate of migration of neurons to the hippocampal region of the rhesus monkey. J Comp Neurol. 1981;196:129–154. doi: 10.1002/cne.901960110. [DOI] [PubMed] [Google Scholar]
- Rakic P. Mode of cell migration to the superficial layers of fetal monkey neocortex. J Comp Neurol. 1972;145:61–83. doi: 10.1002/cne.901450105. [DOI] [PubMed] [Google Scholar]
- Sawano A, Hama H, Saito N, Miyawaki A. Multicolor imaging of Ca(2+) and protein kinase C signals using novel epifluorescence microscopy. Biophys J. 2002;82:1076–1085. doi: 10.1016/S0006-3495(02)75467-2. [DOI] [PMC free article] [PubMed] [Google Scholar]
- Sekine K, Honda T, Kawauchi T, Kubo K, Nakajima K. The outermost region of the developing cortical plate is crucial for both the switch of the radial migration mode and the Dab1-dependent “inside-out” lamination in the neocortex. J Neurosci. 2011;31:9426–9439. doi: 10.1523/JNEUROSCI.0650-11.2011. [DOI] [PMC free article] [PubMed] [Google Scholar]
- Sekine K, Kawauchi T, Kubo K, Honda T, Herz J, Hattori M, Kinashi T, Nakajima K. Reelin controls neuronal positioning by promoting cell-matrix adhesion via inside-out activation of integrin alpha5beta1. Neuron. 2012;76:353–369. doi: 10.1016/j.neuron.2012.07.020. [DOI] [PMC free article] [PubMed] [Google Scholar]
- Shitamukai A, Konno D, Matsuzaki F. Oblique radial glial divisions in the developing mouse neocortex induce self-renewing progenitors outside the germinal zone that resemble primate outer subventricular zone progenitors. J Neurosci. 2011;31:3683–3695. doi: 10.1523/JNEUROSCI.4773-10.2011. [DOI] [PMC free article] [PubMed] [Google Scholar]
- Smart IH. Radial unit analysis of hippocampal histogenesis in the mouse. J Anat. 1982;135:763–793. [PMC free article] [PubMed] [Google Scholar]
- Soriano E, Del Río JA, Martínez A, Supèr H. Organization of the embryonic and early postnatal murine hippocampus: I. Immunocytochemical characterization of neuronal populations in the subplate and marginal zone. J Comp Neurol. 1994;342:571–595. doi: 10.1002/cne.903420406. [DOI] [PubMed] [Google Scholar]
- Stanfield BB, Cowan WM. The development of the hippocampus and dentate gyrus in normal and reeler mice. J Comp Neurol. 1979;185:423–459. doi: 10.1002/cne.901850303. [DOI] [PubMed] [Google Scholar]
- Stensaas LJ. The development of hippocampal and dorsolateral pallial regions of the cerebral hemisphere in fetal rabbits: IV. Forty-one millimeter stage, intermediate lamina. J Comp Neurol. 1967a;131:409–422. doi: 10.1002/cne.901310402. [DOI] [PubMed] [Google Scholar]
- Stensaas LJ. The development of hippocampal and dorsolateral pallial regions of the cerebral hemisphere in fetal rabbits: 3. Twenty-nine millimeter stage, marginal lamina. J Comp Neurol. 1967b;130:149–162. doi: 10.1002/cne.901300204. [DOI] [PubMed] [Google Scholar]
- Tabata H, Nakajima K. Efficient in utero gene transfer system to the developing mouse brain using electroporation: visualization of neuronal migration in the developing cortex. Neuroscience. 2001;103:865–872. doi: 10.1016/S0306-4522(01)00016-1. [DOI] [PubMed] [Google Scholar]
- Tabata H, Nakajima K. Multipolar migration: the third mode of radial neuronal migration in the developing cerebral cortex. J Neurosci. 2003;23:9996–10001. doi: 10.1523/JNEUROSCI.23-31-09996.2003. [DOI] [PMC free article] [PubMed] [Google Scholar]
- Tabata H, Kanatani S, Nakajima K. Differences of migratory behavior between direct progeny of apical progenitors and basal progenitors in the developing cerebral cortex. Cereb Cortex. 2009;19:2092–2105. doi: 10.1093/cercor/bhn227. [DOI] [PubMed] [Google Scholar]
- Tabata H, Yoshinaga S, Nakajima K. Cytoarchitecture of mouse and human subventricular zone in developing cerebral neocortex. Exp Brain Res. 2012;216:161–168. doi: 10.1007/s00221-011-2933-3. [DOI] [PMC free article] [PubMed] [Google Scholar]
- Tabata H, Hachiya T, Nagata K, Sakakibara Y, Nakajima K. Screening for candidate genes involved in the production of mouse subventricular zone proliferative cells and an estimation of their changes in evolutionary pressure during primate evolution. Front Neuroanat. 2013;7:24. doi: 10.3389/fnana.2013.00024. [DOI] [PMC free article] [PubMed] [Google Scholar]
- Tomita K, Kubo K, Ishii K, Nakajima K. Disrupted-in-Schizophrenia-1 (Disc1) is necessary for migration of the pyramidal neurons during mouse hippocampal development. Hum Mol Genet. 2011;20:2834–2845. doi: 10.1093/hmg/ddr194. [DOI] [PubMed] [Google Scholar]
- Wang X, Tsai JW, LaMonica B, Kriegstein AR. A new subtype of progenitor cell in the mouse embryonic neocortex. Nat Neurosci. 2011;14:555–561. doi: 10.1038/nn.2807. [DOI] [PMC free article] [PubMed] [Google Scholar]
- Yoshinaga S, Ohkubo T, Sasaki S, Nuriya M, Ogawa Y, Yasui M, Tabata H, Nakajima K. A phosphatidylinositol lipids system, lamellipodin, and Ena/VASP regulate dynamic morphology of multipolar migrating cells in the developing cerebral cortex. J Neurosci. 2012;32:11643–11656. doi: 10.1523/JNEUROSCI.0738-12.2012. [DOI] [PMC free article] [PubMed] [Google Scholar]