

Abstract
In the domain of working memory (WM), a sigmoid-shaped relationship between WM load and brain activation patterns has been demonstrated in younger adults. It has been suggested that age-related alterations of this pattern are associated with changes in neural efficiency and capacity. At the same time, WM training studies have shown that some older adults are able to increase their WM performance through training. In this study, functional magnetic resonance imaging during an n-back WM task at different WM load levels was applied to compare blood oxygen level-dependent (BOLD) responses between younger and older participants and to predict gains in WM performance after a subsequent 12-session WM training procedure in older adults. We show that increased neural efficiency and capacity, as reflected by more “youth-like” brain response patterns in regions of interest of the frontoparietal WM network, were associated with better behavioral training outcome beyond the effects of age, sex, education, gray matter volume, and baseline WM performance. Furthermore, at low difficulty levels, decreases in BOLD response were found after WM training. Results indicate that both neural efficiency (i.e., decreased activation at comparable performance levels) and capacity (i.e., increasing activation with increasing WM load) of a WM-related network predict plasticity of the WM system, whereas WM training may specifically increase neural efficiency in older adults.
Keywords: aging, fMRI, neuroimaging, plasticity, training, working memory
Introduction
Aging is related to changes in brain structure and functioning (Raz et al., 2005; Greenwood, 2007; Reuter-Lorenz and Park, 2010; Grady, 2012), but a number of studies suggest that there are no clear associations between brain structure and behavioral task performance (Kaup et al., 2011; Salthouse, 2011; Bolandzadeh et al., 2012). Apparently, the brain has mechanisms to compensate to some extent for age-related neural decline. The “compensation-related utilization of neural circuits hypothesis” (CRUNCH; Reuter-Lorenz and Cappell, 2008) suggests that older adults recruit more neural resources to achieve a similar performance as younger adults at low task demands (reduced processing efficiency in older adults), whereas older adults are unable to further exceed their neural activation levels at high task demands (Todd and Marois, 2005; Schneider-Garces et al., 2010; reduced capacity in older adults). In the domain of working memory (WM), a sigmoid or inverted U-shaped relationship between blood oxygen level-dependent (BOLD) signal and WM load has been shown (Callicott et al., 1999; Nyberg et al., 2009) in which older participants reach their maximum BOLD response at lower WM load levels compared with younger adults (Mattay et al., 2006; Cappell et al., 2010; Schulze et al., 2011). At the same time, functional connectivity within WM-related brain areas was found to increase with WM task demand (Honey et al., 2002; Axmacher et al., 2008; Nagel et al., 2011; Kim et al., 2012) but seems to decline with age (Andrews-Hanna et al., 2007; Steffener et al., 2012).
Alongside age-related decline in WM performance and associated brain responses, sizeable individual differences have been reported in older adults (De Frias et al., 2007; Lövdén et al., 2010), suggesting that some maintain a relatively well preserved WM functioning, whereas others show considerable decline (Nyberg et al., 2012). In a recent WM study (Nagel et al., 2011), a relatively low BOLD signal in brain areas of the WM network (Owen et al., 2005) at low levels of WM load (high neural efficiency) together with a relatively high BOLD signal at high levels of WM load (high neural capacity) has been associated with higher WM performance in both younger and older participants. Such a more “youth-like” (cf. Nagel et al., 2011) BOLD response pattern associated with increased WM performance has been proposed as a biomarker for cognitive reserve (Stern, 2009).
Several studies have reported that training-related increases in WM performance in older adults (Li et al., 2008; Richmond et al., 2011; Heinzel et al., 2013) go along with decreases in frontoparietal BOLD activation patterns (Erickson et al., 2007; Dahlin et al., 2008; Brehmer et al., 2011), but, to date, little is known about how functional brain activation patterns before training predict training-related behavioral WM plasticity.
In the current study, we investigated whether the WM load-dependent pattern of BOLD response and functional connectivity in WM-related regions of interest (ROIs) are associated with training-related performance gains in WM and other cognitive domains. Furthermore, we explored training-related changes in WM load-dependent BOLD activation and connectivity.
Materials and Methods
Subjects and screening instruments
Twenty healthy older and 18 younger adults were included in the study. One participant of the older group had to be excluded from analyses because of a technical failure during the functional magnetic resonance imaging (fMRI) scanning. Therefore, the final sample consisted of 19 older participants (six females) with a mean ± SD age of 66.0 ± 3.73 years (range, 61–75 years) and 18 younger adults (eight females) with a mean ± SD age of 24.1 ± 2.43 years (range, 21–30 years). In a subsample of 15 older participants, a second fMRI scan was conducted after the training procedure. All participants were native German speakers, right-handed, had normal or corrected-to-normal vision, no history of any neurological or psychiatric diseases, and did not take any psychopharmacological medication. All participants were suitable for fMRI, and none of the participants took any antihypertensive medication. The study was approved by the local Ethics Committee of the Charité–Universitätsmedizin Berlin according to the Declaration of Helsinki, and written informed consent was obtained from all participants after the procedures had been fully explained.
Neuropsychological assessments
For neuropsychological screening and the examination of possible gains in untrained cognitive tasks from pretest to posttest, neuropsychological tests were selected for measuring short-term memory (Digit Span Fwd, Digit Span Bwd), processing speed (Digit Symbol, D2 Test), executive functions (Verbal Fluency, Stroop Interference), and reasoning (Raven's SPM, Figural Relations).
Short-term memory tasks.
To obtain an estimate of each participant's short-term memory capacity, Digit Span Forward (Digit Span Fwd) and Backward (Digit Span Bwd) from the Wechsler Adult Intelligence Scale (WAIS; Wechsler, 1987) was administered. Two trials of each list length were presented. If participants failed to repeat both trials of a certain list length, the assessment of this task was terminated. The score used in the following analyses was determined by the amount of correctly repeated trials.
Processing speed tasks.
The D2 Test (Brickenkamp, 2002) and the Digit Symbol Substitution subtest (Digit Symbol) of the WAIS (Wechsler, 1987) were included to assess mental processing speed and attention. In the D2 Test, participants were instructed to cross out the letter “d” but not the letter “p.” The score used in this study represents the amount of crossed out d letters within 4 min 40 s. In Digit Symbol, participants were asked to copy symbols as quickly as possible into empty boxes located below a random sequence of numbers ranging from 1 to 9 according to a specific coding key. The score used for analyses was the number of correct symbols completed within 60 s.
Executive functions tasks.
Verbal Fluency requires the ability to generate words while monitoring previously recalled words and following specific rules. Verbal Fluency was assessed by a German version of the Controlled Oral Word Association Test (Benton and Hamsher, 1989). Participants were asked to generate as many words as possible starting with the letter “S” within 60 s (not including proper names or names of places and cities). In the Stroop task (Stroop, 1935), participants were first instructed to name the color of words (task A), then to name the meaning of words (task B), and finally to name the color of words while inhibiting the meaning of the words (a different color, task C). The Stroop Interference score in this study was calculated using the following equation (Golden, 1978): Stroop Interference = task C − [(task A × task B)/(task A + task C)]. The raw values of each task represent the time required to finish the task.
Abstract reasoning tasks.
Abstract reasoning abilities were measured by Raven's Standard Progressive Matrices (Raven's SPM; Raven et al., 1990) and by the Figural Relations subtest of a German intelligence test (Leistungspruefsystem; Horn, 1983). To solve these tasks, participants were required to identify patterns of nonverbal symbols: in Raven's SPM, they were instructed to find a matching item to complete a pattern, whereas in the Figural Relations, they had to mark the non-matching item of a pattern of symbols. Both reasoning tasks were timed, and the scores were derived from the number of correct items accomplished within 7.5 min (Raven's SPM) or 3 min (Figural Relations), respectively.
n-back paradigm during fMRI
A computerized version of the n-back paradigm with numerical stimuli (Cohen et al., 1997) was used in this study. The n-back task consisted of two runs. In each run, 16 blocks were presented in four different pseudorandomized orders counterbalanced across subjects. The total duration of the task was 22 min. The n-back task was presented using Presentation software (version 14.9; Neurobehavioral Systems). WM load (0-, 1-, 2-, and 3-back) was varied between blocks. The WM load condition of each block was indicated by a cue 2 s before the block started. In each block, 16 randomly created digits from 0 to 9 were presented in the center of a black screen one at a time for 500 ms, with an interstimulus interval (ISI) of 500 or 1500 ms (pseudorandomized across blocks); the occurrence of five target stimuli was pseudorandomized. Targets were defined as reoccurrence of a number previously presented one, two, or three trials before (1-, 2-, or 3-back condition). In the 0-back condition, the target was defined as the number “0.” The participants were instructed to press a button with their right thumb when they recognized a target. After each block, a white fixation cross was presented in the center of a black screen for 12 s.
n-back training procedure
Older participants accomplished an adaptive n-back training procedure over a period of 4 weeks (12 training sessions). They accomplished three runs of the n-back task in each training session, lasting ∼45 min. Each run consisted of 12 blocks. At run 1 in session 1, all participants began the training with difficulty level 1 (four blocks of each 0-, 1-, and 2-back at an ISI of 1500 ms). The difficulty level of the task increased across training runs according to individual performance by introducing higher WM load levels and by shortening the ISI (Heinzel et al., 2013). Whenever a participant successfully completed one run with a hit rate of ≥80% within each block and with a false alarm rate below 15%, the next difficulty level was introduced in the following run. From level 1 to level 3, ISIs were gradually decreased from 1500 to 500 ms in steps of 500 ms. At level 4, the next n-level was introduced (3-back), and 0-back was removed, i.e., participants completed 1-, 2-, and 3-back tasks. In addition, the ISI was set back to 1500 ms. At levels 5 and 6, ISIs gradually decreased again to 1000 and 500 ms. At level 7, 4-back was introduced and 1-back was removed.
Relative training gain
As shown in Equation 1, relative training gain was computed as the difference of the mean n-back performance at posttest and pretest divided by performance at pretest:
 |
Performance was defined as hit rate − false alarm rate.
MR image acquisition
fMRI data were collected at two study centers. Twenty participants (11 females, seven younger) were scanned at Charité Virchow Campus, Berlin, with a 3 T GE Signa Excite (GE Healthcare) and 17 participants (12 females, 11 younger) at Charité Campus Mitte, Berlin, with a 3 T Magnetom Trio Tim MR system (Siemens). χ2 tests indicated no significant differences in distribution of age groups and sex across scanner sites (all p values >0.10). In the beginning of each scanning procedure, one T1-weighted 3D pulse sequence was obtained [repetition time (TR), 7.8 ms; echo time (TE), 3.164 ms; flip angle, 20°; field of view, 256 × 256 mm2; matrix size, 256 × 256; 176 sagittal slices with 1 mm thickness; voxel size, 1 × 1 × 1 mm3]. Functional data were obtained using a gradient echo echo-planar imaging pulse sequence (TR, 2000 ms; TE, 35 ms; flip angle, 80°; matrix size, 64 × 64; voxel size, 3.1 × 3.1 × 3.8 mm). Thirty-one slices were acquired approximately axial to the bicommissural plane.
MR image processing and analysis
All fMRI analyses were performed with SPM8 (Wellcome Department of Imaging Neuroscience, London, UK). After correction for head motion and computation of a mean echo planar image, the T1-weighted anatomical image was coregistered to the mean echo planar image and warped into the spatial standard space as defined by the template of the International Consortium for Brain Mapping (http://www.loni.usc.edu/ICBM/). Spatial transformations as estimated in the step before were applied to echo planar images. Echo planar images were resampled into isotropic voxels with an edge length of 3.3 mm and spatially smoothed with an isotropic Gaussian kernel of 8 mm full-width half-maximum.
Estimation of BOLD effect sizes in n-back
The WM experiment was analyzed within the framework of the general linear model (GLM). To this end, at the single-subject level, we created design matrixes comprising the experimental conditions of 0-, 1-, 2-, and 3-back as separate regressors of interest and all other experimental conditions (cue, button presses, and the six rigid body realignment parameters) as regressors of no interest. The GLM was fitted voxelwise into the filtered time series using the restricted maximum likelihood algorithm as implemented in SPM8.
Computation of literature-based probabilistic ROIs
ROIs for n-back associated brain areas were created by combining anatomical hypotheses with functional findings as reported in literature for comparable experimental designs. To this end, spatial coordinates for bilateral medial PFC [rostral cingulate zone (RCZ); Ridderinkhof et al., 2004; BA 32/6], left and right lateral premotor cortex (LPMC; BA 6), left and right dorsolateral prefrontal cortex (DLPFC; BA 9/46), and left and right intraparietal sulcus (IPS; BA 40) were taken from 23 fMRI publications using verbal n-back paradigms (all citations available on request). First, we created anatomical ROIs comprising the frontal gyri, the frontal cortical midline structures, and the superior parietal cortex as provided by the Automated Anatomical Labeling brain atlas (Tzourio-Mazoyer et al., 2002). Second, we created the probabilistic ROIs within these anatomical constraints in a three-step process (Schubert et al., 2008).
- (1) The probability that a voxel at a given position within an anatomical ROI showed neural activity regarding the corresponding literature was estimated by calculating a 3D normal (Gaussian) distribution G(x, y, z) as follows (Turkeltaub et al., 2002):
where C is the covariance matrix for all coordinate triples x, y, z from the underlying literature, and x̄, ȳ, z̄ are the mean values of the x, y, and z coordinates, respectively (Nielsen and Hansen, 2002).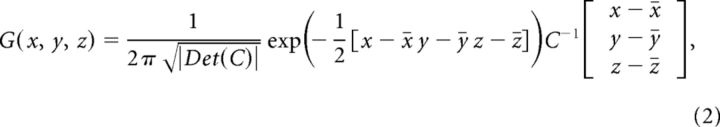
(2) The outer limits of the finally used ROI were defined by the outer limits of the anatomical ROI and a threshold of 2 SDs of the resulting 3D distribution.
(3) Finally, a binary mask including all voxels spatially within these boundaries was formed. The ROIs are depicted in Figure 1C. The WM network is defined as all ROIs combined. Note that the script for generating the probabilistic ROIs (written in MATLAB by author T.W. and compatible with SPM8) and the full lists of coordinates used for ROI generation can be obtained on request.

Figure 1.
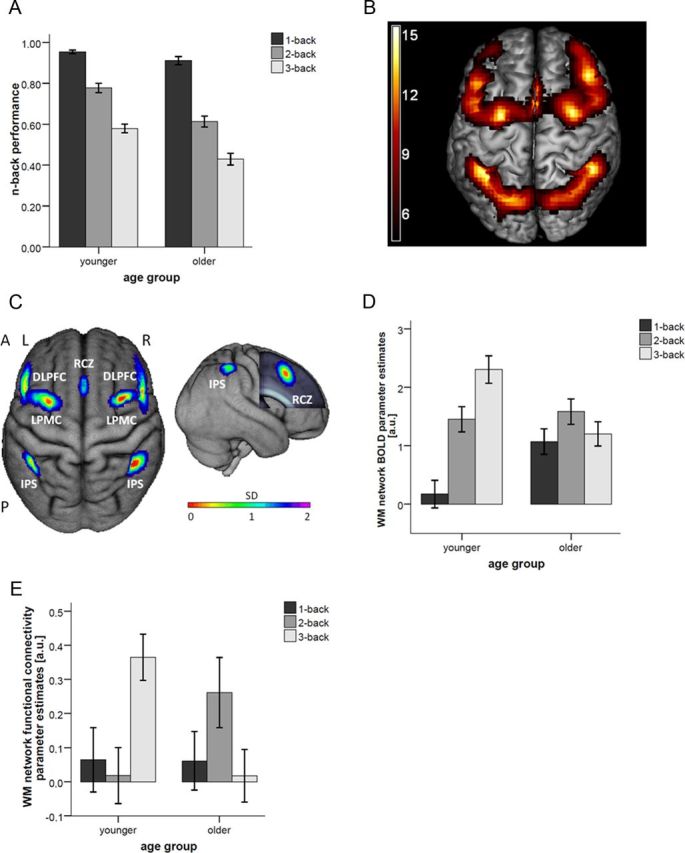
WM performance, load-dependent activations, and functional connectivity in younger and older participants. A, Performance in 1-, 2-, and 3-back in the younger and older groups. Error bars indicate SEMs. B, Frontoparietal WM network in 19 older and 18 younger adults (T values for 1-, 2-, and 3-back vs 0-back at p < 0.05 FWE corrected for whole brain). C, Literature-based probabilistic ROIs of the n-back network. Left, Dorsal view of the ROIs overlaid onto the surface of the sample mean brain. Right, Right lateral view. The frontal lobe was cut to display the midsagittal ROI. A, anterior; P, posterior; L, left; R right. D, Plot of parameter estimates [arbitrary units (a.u.)] in probabilistic ROIs of the WM network for the contrasts: 1-back > 0-back, 2-back > 0-back, and 3-back > 0-back in younger and older participants. E, Functional connectivity parameter estimates derived from the PPI analysis from right DLPFC to all other ROIs of the WM network.
Statistical analyses of imaging data
For group-level analysis, the individual contrast images (1-back > 0-back, 2-back > 0-back, and 3-back > 0-back) from the subject-level analyses were entered into a 3 (WM load) × 2 (age group) ANCOVA model in SPM8. The type of MR system (GE Healthcare vs Siemens) was used as a dummy covariate to correct for unspecific variance caused by differences in hardware configuration. Results of the n-back main effect (1-, 2-, and 3-back > 0-back across both age groups) are shown at p < 0.05 familywise error (FWE) corrected for whole brain and minimum cluster size > 10 voxels in Figure 1B. Parameter estimates were extracted for the WM network (all ROIs combined) and each ROI separately and exported to SPSS for additional analysis. Training-associated changes in BOLD response from pretest to posttest in the older group were analyzed by entering individual contrast images (1-back > 0-back, 2-back > 0-back, and 3-back > 0-back) from the subject-level analyses into a 3 (WM load) × 2 (time) ANCOVA model with the dummy covariate “MR system” in SPM8.
Voxel-based morphometry analysis
A voxel-based morphometry (VBM) analysis using the VBM8 toolbox implemented in SPM8 (http://dbm.neuro.uni-jena.de/vbm) was conducted with the default parameters to obtain individual gray matter volumes. For group comparisons, a two-sample t test with the covariates sex and MR system was calculated and gray matter volume was extracted per participant in the literature-based WM network ROIs to investigate age differences. Changes in gray matter volume in the older group from pretest to posttest were analyzed by a paired t test using sex and MR system as covariates.
Psychophysiological interaction analysis
To investigate age-related WM load-dependent alterations in functional connectivity, we calculated a psychophysiological interaction (PPI) analysis with the seed region in the DLPFC (Nagel et al., 2011). We chose the right hemispheric DLPFC as seed region because previous research has indicated that WM task-related functional connectivity with this region seems to be both age (Steffener et al., 2012) and WM load sensitive (Honey et al., 2002; Deserno et al., 2012). The PPI allows analyzing the temporal association of the right DLPFC with other areas in the WM network taking the psychological variable of WM load into account. To this end, the individual mean first eigenvariate time series was extracted for the literature-based ROI of the right DLPFC. Four different WM load-dependent PPI regressors were generated by convolving this right DLPFC eigenvariate time series with the experimental psychological variable of WM load (0-back, 1-back, 2-back, and 3-back). A new GLM was set up including the four PPI regressors, the four psychological variables (corresponding to the n-back regressors, which were used in the standard GLM as mentioned above), the first eigenvariate time series of the right DLPFC, and the six rigid body movement parameters. On single-subject level, differential T-contrast images were calculated for the PPI regressors of 1-back versus 0-back, 2-back versus 0-back, and 3-back versus 0-back and taken to group level. For group comparison, these differential T-contrast images representing the functional coupling between right DLPFC and other brain areas were entered to a ANOVA with the factors group (younger and older adults) and WM load (1-back, 2-back, and 3-back) and the covariate of MR system. Finally, parameter estimates were extracted for the WM network except the right DLPFC and exported to SPSS for additional analysis. Training-associated changes in functional connectivity from pretest to posttest in the older group were analyzed by entering individual contrast images from the subject-level analyses into a 3 (WM load) × 2 (time) ANCOVA model with the dummy covariate MR system in SPM8.
Statistical analyses of relationship between imaging and behavioral data
Statistical analyses of relationships between fMRI and behavioral data were performed using SPSS version 18.0 (SPSS). Measures were compared between younger and older adults and between high and low training gainers within the older group. High (n = 9) and low (n = 10) training gainers were defined using a median split of the relative training gain. For the prediction and cross-validation of training gain, we used canonical discriminant analyses as a function of training gain group (high vs low training gainers). WM network gray matter volume was included as an additional covariate in all regression analyses. All statistical tests that were performed are reported in Results.
Computation of BOLD activation Delta scores
As a measure of the load-dependent BOLD response pattern, we used a difference score (Delta score; cf. Nagel et al., 2011) that was calculated as the difference between the parameter estimates of the 3-back versus 0-back contrast and the parameter estimates of the 1-back versus 0-back contrast. Delta scores were calculated for the WM network (WM network Delta score) and for each ROI separately.
Results
Age differences
Behavioral n-back performance
A 2 (age group) × 3 (WM load) ANOVA of the n-back performance at pretest revealed a significant interaction (F(2,70) = 4.96, p = 0.010, partial η2 = 0.124), as well as significant main effects of WM load (F(2,70) = 205.44, p < 0.001, partial η2 = 0.854) and age group (F(1,35) = 34.99, p < 0.001, partial η2 = 0.500). Follow-up two-sample t tests indicated that younger adults had a better performance at 2-back (t(35) = 4.66, p < 0.001) and 3-back (t(35) = 4.24, p < 0.001) but only at trend level at 1-back (t(35) = 1.89, p = 0.068; Fig. 1A).
Neuropsychological measures
Means, SDs, and t test results of the performance at pretest in the neuropsychological measures Digit Span Fwd, Digit Span Bwd, D2 Test, Digit Symbol, Verbal Fluency, Stroop Interference, Raven's SPM, and Figural Relations are shown in Table 1. A multivariate ANOVA (MANOVA) indicated that younger adults performed better in neuropsychological measures compared with older participants (F(8,28) = 3.98, p = 0.003, partial η2 = 0.532).
Table 1.
Demographic variables, neuropsychological performance, gray matter volume, and functional brain response (Delta scores) in all ROIs
| Variable | Younger (n = 18) | Older (n = 19) | Younger versus older t(35) (p) |
|---|---|---|---|
| Age | 24.06 ± 2.41 | 65.95 ± 3.73 | 40.28 (<0.001) |
| Sex | 8 males/10 females | 6 males/13 females | χ2(37,1) = 0.65 (0.508) |
| Education | 16.36 ± 1.86 | 15.61 ± 3.26 | 0.86 (0.395) |
| WM network gray matter volume | 0.58 ± 0.05 | 0.48 ± 0.03 | 7.62 (<0.001) |
| WM network Delta score | 2.60 ± 1.74 | 0.13 ± 1.60 | 4.26 (<0.001) |
| RCZ Delta score | 2.15 ± 1.24 | 0.28 ± 1.93 | 3.83 (0.001) |
| l LPMC Delta score | 1.76 ± 0.99 | 0.23 ± 1.55 | 4.13 (<0.001) |
| r LPMC Delta score | 2.56 ± 1.61 | 0.24 ± 1.54 | 3.55 (0.001) |
| l DLPFC Delta score | 1.51 ± 1.24 | 0.67 ± 2.08 | 3.08 (0.004) |
| r DLPFC Delta score | 2.04 ± 1.55 | −0.07 ± 1.49 | 3.51 (0.001) |
| l IPS Delta score | 2.34 ± 1.82 | −0.61 ± 1.81 | 4.78 (<0.001) |
| r IPS Delta score | 2.13 ± 1.23 | −0.13 ± 1.62 | 4.35 (<0.001) |
| Digit Span Fwd | 9.39 ± 1.50 | 7.58 ± 1.87 | 3.24 (0.003) |
| Digit Span Bwd | 7.89 ± 2.25 | 6.68 ± 1.86 | 1.78 (0.083) |
| D2 Test | 500.77 ± 72.35 | 394.68 ± 79.48 | 4.24 (<0.001) |
| Digit Symbol | 41.50 ± 6.31 | 32.32 ± 6.21 | 4.46 (<0.001) |
| Verbal Fluency | 17.39 ± 3.40 | 16.58 ± 4.74 | 0.59 (0.556) |
| Stroop Interference | 57.61 ± 11.75 | 69.50 ± 17.79 | 2.38 (0.023) |
| Raven's SPM | 21.83 ± 3.50 | 16.84 ± 4.34 | 3.84 (<0.001) |
| Figural Relations | 26.33 ± 3.66 | 19.00 ± 4.78 | 5.21 (<0.001) |
Descriptive characteristics of the samples and t test in younger and older participants. Delta score, Parameter estimates of (3-back > 0-back) − (1-back > 0-back). l, Left; r, right.
Gray matter volume at pretest
Gray matter volume in the ROI-based WM network (t(35) = 7.62, p < 0.001) was larger in younger compared with older adults (Table 1).
FMRI results at pretest
Whole-brain analyses of 1-, 2-, and 3-back versus 0-back conditions in 37 participants (19 older and 18 younger adults) revealed the well known frontoparietal network involved in maintaining and updating information in WM (Owen et al., 2005; Fig. 1B).
A 2 (age group) × 3 (WM load) ANOVA of the parameter estimates derived from the ROI-based WM network (Fig. 1C) showed a significant interaction indicating different load-dependent BOLD response patterns between younger and older adults (F(2,70) = 9.49, p < 0.001, partial η2 = 0.213). Follow-up paired t tests indicated an increase of BOLD response in younger participants from 1- to 2-back (t(17) = 3.95, p = 0.001) and from 2- to 3-back (t(17) = 2.46, p = 0.025), which was not found in older participants (all p values >0.16; Fig. 1D). Additional follow-up two-sample t tests comparing brain responses in the WM network between age groups at each WM load level separately showed a lower BOLD response at 1-back (t(35) = 2.81, p = 0.008). This effect also held when matching for performance levels in 1-back by excluding the two worst performers in the old sample (t(33) = 2.78, p = 0.009). There were no differences between age groups at 2-back (t(35) = 0.42, p = 0.674). Furthermore, we found a higher BOLD response at 3-back (t(35) = 3.53, p = 0.001) in younger adults compared with older adults. Consequently, we found a significant difference in WM network Delta score between age groups (t(35) = 4.26, p < 0.001; Fig. 1D).
PPI analyses at pretest
PPI analyses using the right DLPFC as a seed region revealed differences in functional connectivity to the other ROIs in the WM network between younger and older participants (Fig. 1E). A 2 (age group) × 3(WM load) ANOVA indicated that strength of connectivity within the WM network differs as a function of WM load between the age groups (F(2,70) = 6.01, p = 0.004, partial η2 = 0.146). Follow-up two-sample t tests showed that, in younger adults, strength of connectivity is higher at 3-back (t(35) = 3.37, p = 0.002), whereas there is a trend for an increased connectivity at 2-back in older compared with younger participants (t(35) = 1.84, p = 0.075). The difference score between 3- and 1-back connectivity in the WM network (parameter estimates of connectivity in 3-back − 1-back) was higher in younger compared with older adults (t(35) = 2.15, p = 0.039).
Prediction of training gain
Improvements in WM performance after training
As shown in Figure 2A, the older training group as a whole improved after n-back training. A 2 (time) × 3(WM load) ANOVA indicated that improvements differed between WM load levels (F(2,36) = 8.65, p = 0.001, partial η2 = 0.325). Follow-up paired t tests showed that n-back performance increased in 1-back (t(18) = 3.37, p = 0.003), 2-back (t(18) = 7.47, p < 0.001), and 3-back (t(18) = 4.86, p < 0.001) after training. Mean differences indicate that the strongest improvement was found in 2-back performance (Fig. 2A). The relative training gain (Eq. 1) in the training group was 14.68 ± 8.48% (mean ± SD). The high training gainers (defined by median split) improved by 21.40 ± 6.45% (mean ± SD), whereas the low training gainers improved by 8.66 ± 4.62% (mean ± SD, t(17) = 4.99, p < 0.001). At pretest, no difference in mean performance in n-back was found between high (mean ± SD, 0.72 ± 0.06) and low (mean ± SD, 0.74 ± 0.04, t(17) = 1.11, p = 0.282) training gainers. At posttest, high training gainers (mean ± SD, 0.87 ± 0.05) outperformed low training gainers (mean ± SD, 0.81 ± 0.05, t(17) = 2.63, p = 0.018).
Figure 2.

Training-related performance changes and prediction of training gain in older participants. A, Performance in 1-, 2-, and 3-back before and after n-back training in older participants. B, Scatter plot of the mean WM network BOLD parameter estimates at 1-back and relationship to relative training gain (R2 = 0.175). C, Scatter plot of the mean WM network BOLD parameter estimates at 3-back and relationship to relative training gain (R2 = 0.359). D, Scatter plot of the mean WM network Delta score and relationship to relative training gain (R2 = 0.347). E, WM network BOLD parameter estimates at 1-, 2-, and 3-back for high and low training gainers.
Correlation analyses
Exploratory analyses showed that relative training gains were significantly negatively associated with pretest WM BOLD activity during 1-back (r = −0.417, p < 0.001) and significantly positively associated with pretest WM BOLD network activity during 3-back (r = 0.599, p < 0.001; Fig. 2B,C). At the same time, WM BOLD network activity during 1-back was significantly associated with WM BOLD network activity during 3-back (r = −0.477, p = 0.039) at pretest.
Regression analyses
The WM network Delta score in older adults at pretest was linearly related to relative training gains (Pearson's correlation coefficient, r = 0.589, p = 0.004; Fig. 2D). Older adults with a BOLD response pattern more similar to the one found in younger participants (higher WM network Delta score) had a better training outcome. Hierarchical regression analyses showed that WM network Delta score at pretest explained significantly more variance in relative training gains (β = 0.598, R2 change = 0.336, F(1,13) = 7.02, p = 0.020) than gray matter volume (β = 0.026, R2 change = 0.000, F change (1,14) = 0.01, p = 0.936) and the covariates age (β = 0.095), sex (β = 0.174), and years of education (β = −0.017, R2 change = 0.042, F change (1,15) = 0.22, p = 0.882).
In addition, regression analyses, controlling for age, gender, education, and gray matter volume, showed that beyond the effects of pretest n-back performance (β = 0.622, R2 change = 0.218, F change (1,13) = 3.73, p = 0.076), WM network Delta score at pretest was associated with training gain (β = 0.627, R2 change = 0.369, F change (1,12) = 11.31, p = 0.006).
When including connectivity scores at pretest as an additional predictor in regression models to behavioral training gain, no increase in explained variance was detected compared with models including covariates (age, sex, education) and gray matter volume (1-back connectivity: R2 change = 0.029, F change (1,13) = 0.40, p = 0.539; 2-back connectivity: R2 change = 0.000, F change (1,13) = 0.000, p = 0.983; 3-back connectivity: R2 change = 0.106, F change (1,13) = 1.61, p = 0.226; 3-back − 1-back connectivity score: R2 change = 0.010, F change (1,13) = 0.14, p = 0.717).
Canonical discriminant analyses
To test accuracy of classification into high and low training gainers that could be achieved by the WM network Delta score at pretest, canonical discriminant analyses were performed. It was found that WM network Delta score increased both sensitivity and specificity of classifying high (sensitivity) and low (specificity) training gainers compared with gray matter volume within the WM network and covariates age, sex, and education. Sensitivity increased from 56.7 to 89.5, specificity raised from 61.0% to 91.0%. Classification accuracy increased from 58.7% for covariates and gray matter volume to 90.5% for covariates and gray matter volume plus WM network Delta score. Cross-validation, using leave-one out analyses with bootstrapping, revealed a classification accuracy of 79.5%.
Differences in BOLD response between high and low training gainers at pretest
The 2 (high vs low training gainers) × 3(WM load) ANOVA with BOLD activation as the dependent variable indicated that high and low training gainers differ in WM load-dependent BOLD activation of the WM network (F(2,34) = 4.81, p = 0.042, partial η2 = 0.221; Fig. 2E). Consequently, the WM network Delta score was larger in high compared with low training gainers (t(17) = 2.19, p = 0.042).
Differences in functional connectivity between high and low training gainers at pretest
When comparing connectivity strength from right DLPFC to the other regions of the WM network between high and low training gainers, no differences were found at any WM load level (all p values >0.29).
Changes in the WM network from pretest to posttest
Changes in gray matter volume
In the subgroup of older participants that received a second fMRI scan at posttest (n = 15), there was no significant change in WM network gray matter volume after training (t(14) = 0.83, p = 0.421).
Changes in WM BOLD activity
Within the older participants, a 2 (time) × 3(WM load) ANOVA of BOLD response in the WM network showed no significant interaction (F(2,28) = 0.34, p = 0.714, partial η2 = 0.024) but a significant main effect of time (F(1,14) = 12.68, p = 0.003, partial η2 = 0.475), indicating a general reduction in BOLD response in the WM network after training. However, follow-up paired t tests revealed that the time effect was driven mainly by a BOLD decrease in 1-back (t(14) = 2.43, p = 0.029), whereas decreases in 2-back (t(14) = 0.99, p = 0.337) and 3-back (t(14) = 1.33, p = 0.206) were not significant (Fig. 3). Hence, the WM network Delta score did not change significantly after training (t(14) = 0.77, p = 0.456).
Figure 3.

Training-related BOLD response changes in a subset of older participants (n = 15). WM network BOLD parameter estimates at 1-, 2-, and 3-back before and after n-back training.
Changes in functional connectivity
When comparing functional connectivity strength before and after training in the older group, a 2 (time) × 3 (WM load) repeated-measures ANOVA did not reveal any WM load-dependent differences in connectivity changes in WM network (F(2,28) = 1.08, p = 0.355, partial η2 = 0.071). Follow-up paired t tests for time effects in 1-, 2-, and 3-back separately were nonsignificant (all p values >0.30).
Exploratory associations with behavioral measures
Exploratory correlational analyses of associations between training-related change in WM network BOLD activity and baseline neuropsychological measures (all p values >0.29), n-back performance levels (all p values >0.14) and baseline BOLD activation (all p values >0.15) did not reveal any significant results.
Gains in untrained tasks from pretest to posttest
Changes in neuropsychological test performance from pretest to posttest are reported in Table 2. A repeated-measures MANOVA with the factor time showed that older adults improved in neuropsychological measures after the training procedure (F(8,11) = 12.42, p < 0.001, partial η2 = 0.900). Post hoc paired t tests showed that Digit Span Fwd (t(18) = 2.97, p = 0.008), D2 Test (t(18) = 6.15, p = 0.001), Digit Symbol (t(18) = 2.76, p = 0.013), Stroop Interference (t(18) = 3.28, p = 0.004), and Figural Relations (t(18) = 4.74, p = 0.001) showed significant improvements, whereas Digit Span Bwd (t(18) = 1.49, p = 0.155), Verbal Fluency (t(18) = 1.26, p = 0.224), and Raven's SPM (t(18) = 0.55, p = 0.591) did not show significant changes after n-back training.
Table 2.
Changes in neuropsychological measures from pretest to posttest in older participants
| Variable | Pretest | Posttest | Pretest versus posttest t(18) (p) |
|---|---|---|---|
| Digit Span Fwd | 7.58 ± 1.87 | 8.63 ± 1.74 | 2.97 (0.008) |
| Digit Span Bwd | 6.68 ± 1.86 | 7.15 ± 1.61 | 1.49 (0.155) |
| D2 Test | 394.68 ± 79.48 | 435.26 ± 80.83 | 6.48 (<0.001) |
| Digit Symbol | 32.32 ± 6.21 | 34.37 ±6.78 | 2.76 (0.013) |
| Vebal Fluency | 16.58 ± 4.74 | 17.74 ± 4.28 | 1.26 (0.224) |
| Stroop Interference | 68.50 ± 17.79 | 63.04 ± 13.66 | 3.28 (0.004) |
| Raven's SPM | 16.84 ± 4.34 | 17.26 ± 4.47 | 0.55 (0.591) |
| Figural Relations | 19.00 ± 4.78 | 22.21 ± 3.72 | 4.73 (<0.001) |
Bivariate correlations were found between relative training gain in n-back and relative gain in Digit Span Fwd (r = 0.679, p = 0.001). Relative gain in all other neuropsychological measures was not related to relative training gain in n-back (all p values >0.12). At the same time, BOLD activation (WM network Delta score) at baseline was associated with relative gain in Digit Span Fwd at trend level (r = 0.429, p = 0.067).
Discussion
In the current study, we compared the BOLD signal and functional connectivity within WM-related ROIs during an n-back task at different load levels between younger and older participants and tested the association between WM load-dependent BOLD signal before and behavioral gains after a 12-session WM training experiment in older adults. Furthermore, training associated changes in BOLD signal, functional connectivity, and neuropsychological tests were investigated.
Age differences
As expected, younger adults outperformed older adults in the n-back task and neuropsychological tests at pretest. Consistent with previous research (Mattay et al., 2006; Cappell et al., 2010; Nagel et al., 2011), younger participants showed lower BOLD activations in the WM network at 1-back and higher activations at 3-back compared with older participants at pretest, which resulted in significant differences in the WM network Delta score (i.e., the difference between 3- and 1-back BOLD response in all WM-related ROIs).
Age-related differences in WM network Delta score may reflect both differences in efficiency (i.e., decreased activation at comparable performance levels) and capacity (i.e., increasing activation with increasing WM load; for a recent discussion on this issue, see Barulli and Stern, 2013). Therefore, we also analyzed age differences in WM network BOLD response at comparable levels of performance (1-back). By matching younger and older adults in performance, age-related BOLD activation increases at 1-back reflect a decrease in efficiency of WM network activations with age. With respect to capacity, we found a distinct pattern of WM load-related linear increase in BOLD activity in young adults, whereas older adults showed a tendency toward an inverted U-type pattern of BOLD activation with increasing WM load. These cross-sectional results are in line with previous findings suggesting that WM load-dependent BOLD activation changes with age and is associated with aspects of WM capacity (Mattay et al., 2006; Cappell et al., 2010; Schneider-Garces et al., 2010; Nagel et al., 2011). However, beyond that, results indicate that the WM load-dependent pattern in older adults, on a neural level, reflects both decreased neural capacity (in that older adults did not show an increase in BOLD activation at 3-back) and decreased efficiency (in that older adults at 1-back, when matched for performance, showed increased levels of BOLD activation; Barulli and Stern, 2013).
In addition to BOLD differences, we found a similar difference in WM load-dependent functional connectivity between younger and older adults within the WM network at pretest: in younger adults, functional connectivity was higher in 3-back, whereas in older adults, functional connectivity reached a maximum at 2-back. Functional connectivity here basically reflects temporal coactivation of right DLPFC and the other regions within the WM network. The maximum of this simultaneous co-utilization was reached at load levels associated with maximum BOLD activation in both age groups, suggesting that connectivity may increase at the limits of WM capacity.
Prediction of WM training gains
In older participants, we found a significant negative correlation between WM network activation during 1-back at pretest and relative training gain, indicating that decreased activation during 1-back (increased efficiency) was associated with larger subsequent behavioral plasticity. In addition, we found that increased activation during 3-back was positively associated with subsequent behavioral training gain, indicating that capacity within the WM network was also related to plasticity. Consequently, when predicting individual differences in behavioral WM plasticity within the older group, it was found that older participants showing a more youth-like (Nagel et al., 2011) BOLD response pattern (i.e., higher WM network Delta scores) achieved higher WM training gains, regardless of age, sex, years of education, and gray matter volume. Specifically, we found that WM network Delta score at pretest significantly predicted training gains beyond the effects of pretest behavioral performance and gray matter volume, suggesting a unique effect of BOLD activation on behavioral training gains.
These findings indicate that the functional properties of the aging brain may be more relevant for WM plasticity than structural properties (Stern, 2009; Nyberg et al., 2012) and that plasticity within WM seems to depend on both neural capacity and neural efficiency within WM (Reuter-Lorenz and Park, 2010; Nagel et al., 2011; Barulli and Stern, 2013). Crucially, our finding that these aspects of neural correlates of WM functioning are closely related and predict behavioral training gain beyond the effects of baseline WM performance indicates that behavioral plasticity in WM in older adults may be governed by an interplay between neural efficiency and capacity. This is in line with recent proposals in the domain of visual WM (Anderson et al., 2013) and integrates current theories on age-related neural compensatory processes (CRUNCH; Reuter-Lorenz and Cappell, 2008) and neural efficiency (Schneider-Garces et al., 2010).
Functional connectivity in the WM network at pretest did not predict behavioral WM plasticity in our older sample. Thus, we could not replicate very recent findings from younger adults, suggesting a relationship between baseline functional connectivity and behavioral WM training gains (Kundu et al., 2013). It seems that a relatively youth-like functioning of the WM network found in high training gainers might rely mainly on BOLD activation patterns rather than WM load-dependent WM network connectivity in older adults. This might be attributable to a considerable age-related decrease in functional connectivity at high WM load found in this and other studies (Nagel et al., 2011). At high executive task demand, age-related decrease in functional connectivity was found to be more pronounced than age-related differences in BOLD activation (Madden et al., 2010).
Changes in WM network activations and connectivity from pretest to posttest
With respect to changes in BOLD activation succeeding WM training, the pattern of decreased activations after training may best be described as an increase in efficiency, which is further corroborated by a significant decrease especially in the 1-back condition. This finding is in line with previous WM training research in older adults reporting BOLD activation decreases in cortical WM areas rather than increases (Erickson et al., 2007; Brehmer et al., 2011). Because increases in WM network Delta scores after training were not significant, conclusions on training-related capacity changes may not be drawn from the current data.
Similar to a nonsignificant prediction of WM training gain by functional connectivity, no changes in overall WM network connectivity were found in the current study. In future work, analyses testing more specific connectivity models (Deserno et al., 2012) could be performed to detect more locally defined changes in functional connectivity.
However, at this stage, the small effect sizes in pre–post fMRI measures in our study precluded us from additional analysis of predictors and correlates of training-induced changes in WM BOLD activation and connectivity.
Gains in untrained tasks after n-back training
Exploratory analyses of additional pre–post effects suggested that n-back training may have been associated with improvements in tasks of attention, WM, executive functions, and fluid intelligence. Also, relative gains in n-back performance correlated with relative gains in Digit Span performance. However, because of the lack of an untrained control group, we cannot rule out that gains in untrained tasks were related to a practice effect.
We found trendwise associations between WM network Delta score and Digit Span gains, indicating that WM network activation patterns may predict gains in both trained n-back and untrained Digit Span tasks. If confirmed by additional research, this finding suggests that WM network Delta score may serve as a functional biomarker of WM plasticity beyond task-specific effects.
Limitations and future directions
Although 37 subjects may be considered a moderate sample size for fMRI studies, a replication of the observed findings in larger samples would be desirable. A cross-validation of the classification algorithm in an independent test set would further increase confidence in the predictive value of the WM network Delta score. Furthermore, in future studies, diffusion tensor imaging should be applied to obtain a more comprehensive measure of brain connectivity. A strength of the current work is that differences in WM load-dependent activations between younger and older participants as well as prediction of training gains in older adults were related to a brain response pattern that was found to be very consistent across the literature-based probabilistic ROIs. Nevertheless, parameters for defining ROI dimensions could be chosen differently, and, more importantly, other regions such as ventrolateral PFC or thalamus could also be included into ROI analyses. Because we were interested in the predictive value of WM load-dependent BOLD response in older adults, no training was conducted in the younger group. In future studies, a comparison group of younger training participants could be included.
Conclusions
Together, our study highlights that individual differences in neurobiological resources—specifically, the neural efficiency and capacity of the WM load-dependent brain response in the WM network—can serve as a predictor for WM plasticity in older adults. Our results provide first evidence integrating theories of neural and behavioral plasticity in relation to age-associated neural compensatory effects. It seems that older adults showing a more youth-like WM load-dependent brain response will best respond to WM training. Age-related activation increases at low task demand (1-back), which have been attributed to compensation, were associated with both reduced neural efficiency and reduced behavioral WM plasticity.
Footnotes
This work was supported by German National Academic Foundation grants (S.H., R.C.L.), the German Ministry for Education and Research (Federal Ministry of Education and Research Grants 01QG87164, 01GS08195, and 01GQ0914), the German Research Foundation (FOR 1617: Grant RA1047/2-1), and a MaxNetAging Award (M.A.R.). Parts of this work are part of an unpublished thesis. We thank L. Oliveras Puig, Q.-L. Duong, and S. Saase for assistance during data acquisition.
The authors declare no competing financial interests.
References
- Anderson DE, Vogel EK, Awh E. A common discrete resource for visual working memory and visual search. Psychol Sci. 2013;24:929–938. doi: 10.1177/0956797612464380. [DOI] [PMC free article] [PubMed] [Google Scholar] [Retracted]
- Andrews-Hanna JR, Snyder AZ, Vincent JL, Lustig C, Head D, Raichle ME, Buckner RL. Disruption of large-scale brain systems in advanced aging. Neuron. 2007;56:924–935. doi: 10.1016/j.neuron.2007.10.038. [DOI] [PMC free article] [PubMed] [Google Scholar]
- Axmacher N, Schmitz DP, Wagner T, Elger CE, Fell J. Interactions between medial temporal lobe, prefrontal cortex, and inferior temporal regions during visual working memory: a combined intracranial EEG and functional magnetic resonance imaging study. J Neurosci. 2008;28:7304–7312. doi: 10.1523/JNEUROSCI.1778-08.2008. [DOI] [PMC free article] [PubMed] [Google Scholar]
- Barulli D, Stern Y. Efficiency, capacity, compensation, maintenance, plasticity: emerging concepts in cognitive reserve. Trends Cogn Sci. 2013;17:502–509. doi: 10.1016/j.tics.2013.08.012. [DOI] [PMC free article] [PubMed] [Google Scholar]
- Benton AL, Hamsher K. Multilingual aphasia examination. Iowa City, IA: AJA Associates; 1989. [Google Scholar]
- Bolandzadeh N, Davis JC, Tam R, Handy TC, Liu-Ambrose T. The association between cognitive function and white matter lesion location in older adults: a systematic review. BMC Neurol. 2012;12:126. doi: 10.1186/1471-2377-12-126. [DOI] [PMC free article] [PubMed] [Google Scholar]
- Brehmer Y, Rieckmann A, Bellander M, Westerberg H, Fischer H, Bäckman L. Neural correlates of training-related working-memory gains in old age. Neuroimage. 2011;58:1110–1120. doi: 10.1016/j.neuroimage.2011.06.079. [DOI] [PubMed] [Google Scholar]
- Brickenkamp R. Test d2. The d2 test of attention. Ed 9. Goettingen, Germany: Hogrefe; 2002. [Google Scholar]
- Callicott JH, Mattay VS, Bertolino A, Finn K, Coppola R, Frank JA, Goldberg TE, Weinberger DR. Physiological characteristics of capacity constraints in working memory as revealed by functional MRI. Cereb Cortex. 1999;9:20–26. doi: 10.1093/cercor/9.1.20. [DOI] [PubMed] [Google Scholar]
- Cappell KA, Gmeindl L, Reuter-Lorenz PA. Age differences in prefontal recruitment during verbal working memory maintenance depend on memory load. Cortex. 2010;46:462–473. doi: 10.1016/j.cortex.2009.11.009. [DOI] [PMC free article] [PubMed] [Google Scholar]
- Cohen JD, Perlstein WM, Braver TS, Nystrom LE, Noll DC, Jonides J, Smith EE. Temporal dynamics of brain activation during a working memory task. Nature. 1997;386:604–608. doi: 10.1038/386604a0. [DOI] [PubMed] [Google Scholar]
- Dahlin E, Neely AS, Larsson A, Bäckman L, Nyberg L. Transfer of learning after updating training mediated by the striatum. Science. 2008;320:1510–1512. doi: 10.1126/science.1155466. [DOI] [PubMed] [Google Scholar]
- De Frias CM, Lövdén M, Lindenberger U, Nilsson L-G. Revisiting the dedifferentiation hypothesis with longitudinal multi-cohort data. Intelligence. 2007;35:381–392. doi: 10.1016/j.intell.2006.07.011. [DOI] [Google Scholar]
- Deserno L, Sterzer P, Wüstenberg T, Heinz A, Schlagenhauf F. Reduced prefrontal-parietal effective connectivity and working memory deficits in schizophrenia. J Neurosci. 2012;32:12–20. doi: 10.1523/JNEUROSCI.3405-11.2012. [DOI] [PMC free article] [PubMed] [Google Scholar]
- Erickson KI, Colcombe SJ, Wadhwa R, Bherer L, Peterson MS, Scalf PE, Kim JS, Alvarado M, Kramer AF. Training-induced plasticity in older adults: effects of training on hemispheric asymmetry. Neurobiol Aging. 2007;28:272–283. doi: 10.1016/j.neurobiolaging.2005.12.012. [DOI] [PubMed] [Google Scholar]
- Golden CJ. Stroop color and word test: a manual for clinical and experimental uses. Wood Dale, IL: Stoelting; 1978. [Google Scholar]
- Grady C. The cognitive neuroscience of ageing. Nat Rev Neurosci. 2012;13:491–505. doi: 10.1038/nrn3256. [DOI] [PMC free article] [PubMed] [Google Scholar]
- Greenwood PM. Functional plasticity in cognitive aging: review and hypothesis. Neuropsychology. 2007;21:657–673. doi: 10.1037/0894-4105.21.6.657. [DOI] [PubMed] [Google Scholar]
- Heinzel S, Schulte S, Onken J, Duong QL, Riemer TG, Heinz A, Kathmann N, Rapp MA. Working memory training improvements and gains in non-trained cognitive tasks in young and older adults. Neuropsychol Dev Cogn B Aging Neuropsychol Cogn. 2013 doi: 10.1080/13825585.2013.790338. doi: 10.1080/13825585.2013.790338. Advance online publication. Retrieved December 10, 2013. [DOI] [PubMed] [Google Scholar]
- Honey GD, Fu CHY, Kim J, Brammer MJ, Croudace TJ, Suckling J, Pich EM, Williams SCR, Bullmore ET. Effects of verbal working memory load on corticocortical connectivity modeled by path analysis of functional magnetic resonance imaging data. Neuroimage. 2002;17:573–582. doi: 10.1006/nimg.2002.1193. [DOI] [PubMed] [Google Scholar]
- Horn W. Leistungspruefsystem LPS. Ed 2. Goettingen, Germany: Hogrefe; 1983. [Google Scholar]
- Kaup AR, Mirzakhanian H, Jeste DV, Eyler LT. A review of the brain structure correlates of successful cognitive aging. J Neuropsychiatr Clin Neurosci. 2011;23:6–15. doi: 10.1176/appi.neuropsych.23.1.6. [DOI] [PMC free article] [PubMed] [Google Scholar]
- Kim JS, Jung WH, Kang DH, Park JY, Jang JH, Choi JS, Choi CH, Kim J, Kwon JS. Changes in effective connectivity according to working memory load: an fMRI study of face and location working memory tasks. Psychiatry Investig. 2012;9:283–292. doi: 10.4306/pi.2012.9.3.283. [DOI] [PMC free article] [PubMed] [Google Scholar]
- Kundu B, Sutterer DW, Emrich SM, Postle BR. Strengthened effective connectivity underlies transfer of working memory training to tests of short-term memory and attention. J Neurosci. 2013;33:8705–8715. doi: 10.1523/JNEUROSCI.5565-12.2013. [DOI] [PMC free article] [PubMed] [Google Scholar]
- Li SC, Schmiedek F, Huxhold O, Röcke C, Smith J, Lindenberger U. Working memory plasticity in old age: practice gain, transfer, and maintenance. Psychol Aging. 2008;23:731–742. doi: 10.1037/a0014343. [DOI] [PubMed] [Google Scholar]
- Lövdén M, Bäckman L, Lindenberger U, Schaefer S, Schmiedek F. A theoretical framework for the study of adult cognitive plasticity. Psychol Bull. 2010;136:659–676. doi: 10.1037/a0020080. [DOI] [PubMed] [Google Scholar]
- Madden DJ, Costello MC, Dennis NA, Davis SW, Shepler AM, Spaniol J, Bucur B, Cabeza R. Adult age differences in functional connectivity during executive control. Neuroimage. 2010;52:643–657. doi: 10.1016/j.neuroimage.2010.04.249. [DOI] [PMC free article] [PubMed] [Google Scholar]
- Mattay VS, Fera F, Tessitore A, Hariri AR, Berman KF, Das S, Meyer-Lindenberg A, Goldberg TE, Callicott JH, Weinberger DR. Neurophysiological correlates of age-related changes in working memory capacity. Neurosci Lett. 2006;392:32–37. doi: 10.1016/j.neulet.2005.09.025. [DOI] [PubMed] [Google Scholar]
- Nagel IE, Preuschhof C, Li SC, Nyberg L, Bäckman L, Lindenberger U, Heekeren HR. Load modulation of BOLD response and connectivity predicts working memory performance in younger and older adults. J Cogn Neurosci. 2011;23:2030–2045. doi: 10.1162/jocn.2010.21560. [DOI] [PubMed] [Google Scholar]
- Nielsen FA, Hansen LK. Modeling of activation data in the BrainMapTM database: detection of outliers. Hum Brain Mapp. 2002;15:146–156. doi: 10.1002/hbm.10012. [DOI] [PMC free article] [PubMed] [Google Scholar]
- Nyberg L, Dahlin E, Stigsdotter Neely A, Bäckman L. Neural correlates of variable working memory load across adult age and skill: dissociative patterns within the fronto-parietal network. Scand J Psychol. 2009;50:41–46. doi: 10.1111/j.1467-9450.2008.00678.x. [DOI] [PubMed] [Google Scholar]
- Nyberg L, Lövdén M, Riklund K, Lindenberger U, Bäckman L. Memory aging and brain maintenance. Trends Cogn Sci. 2012;16:292–305. doi: 10.1016/j.tics.2012.04.005. [DOI] [PubMed] [Google Scholar]
- Owen AM, McMillan KM, Laird AR, Bullmore E. N-back working memory paradigm: a meta-analysis of normative functional neuroimaging studies. Hum Brain Mapp. 2005;25:46–59. doi: 10.1002/hbm.20131. [DOI] [PMC free article] [PubMed] [Google Scholar]
- Raven J, Summers B, Birchfield M, Brosier G, Burciaga L, Bykrit B. Oxford: Oxford Psychologists; 1990. Manual for raven's progressive matrices and vocabulary scales. Research supplement no. 3: a compendium of North American normative and validity studies. [Google Scholar]
- Raz N, Lindenberger U, Rodrigue KM, Kennedy KM, Head D, Williamson A, Dahle C, Gerstorf D, Acker JD. Regional brain changes in aging healthy adults: general trends, individual differences and modifiers. Cereb Cortex. 2005;15:1676–1689. doi: 10.1093/cercor/bhi044. [DOI] [PubMed] [Google Scholar]
- Reuter-Lorenz PA, Cappell KA. Neurocognitive aging and the compensation hypothesis. Curr Dir Psychol Sci. 2008;17:177–182. doi: 10.1111/j.1467-8721.2008.00570.x. [DOI] [Google Scholar]
- Reuter-Lorenz PA, Park DC. Human neuroscience and the aging mind: a new look at old problems. J Gerontol B Psychol Sci Soc Sci. 2010;65B:405–415. doi: 10.1093/geronb/gbq035. [DOI] [PMC free article] [PubMed] [Google Scholar]
- Richmond LL, Morrison AB, Chein JM, Olson IR. Working memory training and transfer in older adults. Psychol Aging. 2011;26:813–822. doi: 10.1037/a0023631. [DOI] [PubMed] [Google Scholar]
- Ridderinkhof KR, Ullsperger M, Crone EA, Nieuwenhuis S. The role of the medial frontal cortex in cognitive control. Science. 2004;306:443–447. doi: 10.1126/science.1100301. [DOI] [PubMed] [Google Scholar]
- Salthouse TA. Neuroanatomical substrates of age-related cognitive decline. Psychol Bull. 2011;137:753–784. doi: 10.1037/a0023262. [DOI] [PMC free article] [PubMed] [Google Scholar]
- Schneider-Garces NJ, Gordon BA, Brumback-Peltz CR, Shin E, Lee Y, Sutton BP, Maclin EL, Gratton G, Fabiani M. Span, CRUNCH, and beyond: working memory capacity and the aging brain. J Cogn Neurosci. 2010;22:655–669. doi: 10.1162/jocn.2009.21230. [DOI] [PMC free article] [PubMed] [Google Scholar]
- Schubert R, Ritter P, Wüstenberg T, Preuschhof C, Curio G, Sommer W, Villringer A. Spatial attention related SEP amplitude modulations covary with BOLD signal in S1–a simultaneous EEG–fMRI study. Cereb Cortex. 2008;18:2686–2700. doi: 10.1093/cercor/bhn029. [DOI] [PubMed] [Google Scholar]
- Schulze ET, Geary EK, Susmaras TM, Paliga JT, Maki PM, Little DM. Anatomical correlates of age-related working memory declines. J Aging Res. 2011;2011:606871. doi: 10.4061/2011/606871. [DOI] [PMC free article] [PubMed] [Google Scholar]
- Steffener J, Habeck CG, Stern Y. Age-related changes in task related functional network connectivity. PLoS One. 2012;7:e44421. doi: 10.1371/journal.pone.0044421. [DOI] [PMC free article] [PubMed] [Google Scholar]
- Stern Y. Cognitive reserve. Neuropsychologia. 2009;47:2015–2028. doi: 10.1016/j.neuropsychologia.2009.03.004. [DOI] [PMC free article] [PubMed] [Google Scholar]
- Stroop JR. Studies of interference in serial verbal reactions. J Exp Psychol. 1935;18:643–662. doi: 10.1037/h0054651. [DOI] [Google Scholar]
- Todd JJ, Marois R. Posterior parietal cortex activity predicts individual differences in visual short-term memory capacity. Cogn Affect Behav Neurosci. 2005;5:144–155. doi: 10.3758/CABN.5.2.144. [DOI] [PubMed] [Google Scholar]
- Turkeltaub PE, Eden GF, Jones KM, Zeffiro TA. Meta-analysis of the functional neuroanatomy of single-word reading: method and validation. Neuroimage. 2002;16:765–780. doi: 10.1006/nimg.2002.1131. [DOI] [PubMed] [Google Scholar]
- Tzourio-Mazoyer N, Landeau B, Papathanassiou D, Crivello F, Etard O, Delcroix N, Mazoyer B, Joliot M. Automated anatomical labeling of activations in SPM using a macroscopic anatomical parcellation of the MNI MRI single-subject brain. Neuroimage. 2002;15:273–289. doi: 10.1006/nimg.2001.0978. [DOI] [PubMed] [Google Scholar]
- Wechsler D. Wechsler memory scale–revised: manual. San Antonio, TX: Psychology Corporation; 1987. [Google Scholar]