

Abstract
The concomitant release of multiple numbers of synaptic vesicles [multivesicular release (MVR)] in response to a single presynaptic action potential enhances the flexibility of synaptic transmission. However, the molecular mechanisms underlying MVR at a single CNS synapse remain unclear. Here, we show that the Cav2.1 subtype (P/Q-type) of the voltage-gated calcium channel is specifically responsible for the induction of MVR. In the rat cerebellar cortex, paired-pulse activation of granule cell (GC) ascending fibers leads not only to a facilitation of the peak amplitude (PPFamp) but also to a prolongation of the decay time (PPPdecay) of the EPSCs recorded from molecular layer interneurons. PPFamp is elicited by a transient increase in the number of released vesicles. PPPdecay is highly dependent on MVR and is caused by dual mechanisms: (1) a delayed release and (2) an extrasynaptic spillover of the GC transmitter glutamate and subsequent pooling of the glutamate among active synapses. PPPdecay was specifically suppressed by the Cav2.1 channel blocker ω-agatoxin IVA, while PPFamp responded to Cav2.2/Cav2.3 (N-type/R-type) channel blockers. The membrane-permeable slow Ca2+ chelator EGTA-AM profoundly reduced the decay time constant (τdecay) of the second EPSC; however, it only had a negligible impact on that of the first, thereby eliminating PPPdecay. These results suggest that the distance between presynaptic Cav2.1 channels and exocytotic Ca2+ sensors is a key determinant of MVR. By transducing presynaptic action potential firings into unique Ca2+ signals and vesicle release profiles, Cav2.1 channels contribute to the encoding and processing of neural information.
Keywords: Ca2+ microdomain, whole-cell patch clamp, roscovitine
Introduction
The number of vesicles released for fast neurotransmission plays a major role in determining the strength of the postsynaptic response (Zucker and Regehr, 2002). The quantal output of a single axon terminal is generally restricted to one vesicle per presynaptic action potential (AP), while the concomitant release of multiple vesicles per AP [multivesicular release (MVR)] has been reported in some CNS synapses (Auger et al., 1998; Wall and Usowicz, 1998; Wadiche and Jahr, 2001). However, the mechanism by which a single AP causes the release of a number of vesicles remains unclear.
Paired-pulse facilitation (PPF) is a ubiquitous form of presynaptic short-term plasticity (Zucker and Regehr, 2002; Neher and Sakaba, 2008). We previously reported that paired-pulse activation of rat cerebellar granule cell (GC) axons at short intervals (30–100 ms) caused both facilitation of the peak amplitude (PPFamp) of the second EPSC (EPSC2) recorded from molecular layer interneurons (MLIs) and prolongation of the EPSC2 decay time (PPPdecay) relative to those of the first EPSC (EPSC1) (Satake et al., 2012). The mechanisms underlying PPFamp and PPPdecay are different. PPFamp is the result of transient increases in release probability and MVR; however, PPPdecay is elicited by an increase in MVR and the subsequent pooling of MVR glutamate among adjacent active synapses (Satake et al., 2012), as well as by a delayed release (Atluri and Regehr, 1998; Chen and Regehr, 1999). In the present study, we probed the molecular mechanisms of MVR by examining PPFamp and PPPdecay at the GC-MLI synapse.
Synaptic vesicle release is triggered by Ca2+ influx through several subtypes of voltage-gated calcium channels (VGCCs) located on the presynaptic membrane adjacent to vesicle release sites. The different subtypes of VGCCs are defined by their distinct α1 subunit (Catterall et al., 2013). In the mammalian CNS, there is considerable evidence that Cav2.1 (P/Q-type) and Cav2.2 (N-type) channels are the dominant VGCC subtypes triggering vesicular neurotransmitter release (Catterall et al., 2013). The activation of a mixed population of Cav2.1 and Cav2.2 channels is generally thought to be responsible for transmitter release (Takahashi and Momiyama, 1993; Mintz et al., 1995). Differences in transmitter release have been reported when mediated by distinct VGCC subtypes (Catterall et al., 2013). In the calyx of Held, which is a large glutamatergic synapse located in the auditory brainstem, Cav2.1 channels trigger vesicle release more efficiently than Cav2.2 channels, and Cav2.2 channels are located farther away from release sites (Wu et al., 1999). However, whether VGCC subtypes differentially contribute to vesicle release at CNS synapses of a typical size remains unclear.
Several mechanisms for PPF have been proposed. The widely discussed residual calcium hypothesis suggests that facilitated release results from a higher Ca2+ peak at release sites due to the summation of phasic influx with residual Ca2+ remaining from a previous release event (Augustine, 2001; Zucker and Regehr, 2002). Activity-dependent modification of presynaptic Ca2+ influx (Borst and Sakmann, 1998; Cuttle et al., 1998), local saturation of endogenous Ca2+ buffers (Rozov et al., 2001; Felmy et al., 2003), and long-lived Ca2+ binding to exocytotic sensors (Bornschein et al., 2013) have also been suggested to be involved in PPF at some synapses. Our present electrophysiological studies of paired EPSCs during the application of subtype-specific VGCC modifiers and intracellular Ca2+ buffers suggest that (1) Cav2.1 and Cav2.2 channels differentially regulate PPPdecay and PPFamp and (2) the topographical distance between Cav2.1 channels and exocytotic Ca2+ sensors plays a critical role in eliciting MVR.
Materials and Methods
All the experiments were performed according to institutional guidelines for animal experiments and were approved by the Institutional Animal Care and Use Committee of the National Institutes of Natural Sciences.
Preparation of cerebellar slices.
Parasagittal cerebellar slices (250 μm thick) were prepared from juvenile Wistar rats (postnatal 12–21-d-old of either sex). The rats were decapitated after deep anesthetization with halothane, and slices were prepared on a vibratome (VT1000S, Leica Microsystems) in iced Na+-deficient saline containing the following (in mm): 300 sucrose, 3.4 KCl, 0.3 CaCl2, 3.0 MgCl2, 10 HEPES, 0.6 NaH2PO4, and 10.0 glucose (the saline was equilibrated with 100% O2; pH was adjusted to 7.4 with NaOH at room temperature). The slices were incubated at room temperature for at least 1 h in artificial CSF (ACSF) containing the following (in mm): 138.6 NaCl, 3.35 KCl, 2.5 CaCl2, 1.0 MgCl2, 21.0 NaHCO3, 0.6 NaH2PO4, and 10.0 glucose (ACSF was equilibrated with 95% O2 and 5% CO2, pH 7.4, at room temperature). After incubation, the slices were transferred to a recording chamber mounted on a microscope stage (BX51WI, Olympus) and continuously superfused with ACSF at 1.0–1.5 ml/min.
Recording of postsynaptic currents.
Synaptic responses were recorded from visually identified MLIs by whole-cell voltage clamping (Satake et al., 2000, 2010) under Nomarski optics with a water-immersion objective (63×; numerical aperture, 0.90; Olympus). Patch-clamp electrodes (resistance, 3–6 MΩ) were filled with an internal solution containing the following (in mm): 150.0 Cs-methanesulfonate, 5.0 KCl, 0.1 EGTA, 5.0 HEPES, 3.0 Mg-ATP, and 0.4 Na3-GTP, pH 7.4 (Satake et al., 2000, 2010). Membrane potential was mostly held at −80 mV with a voltage-clamp amplifier (EPC-10, HEKA Elektronik) controlled by PULSE software (HEKA Elektronik). Currents were filtered at 3 kHz and digitized at 20 kHz. All the recordings were performed at room temperature because the relationships between interstimulus intervals (ISIs) and paired-pulse ratio of the amplitude (PPRamp) and between ISIs and paired-pulse ratio of τdecay (PPRdecay) were similar at high (31–34°C) and room temperatures (24–27°C) (Satake et al., 2012). The series resistance and leak currents were continuously monitored and, if these parameters changed significantly (>20% and >200 pA, respectively) during recording, the cells were not included in the analysis.
GC ascending fiber-mediated EPSCs were evoked by focal stimulation (a single pulse of 5 V for 100 μs) through an ACSF-filled glass electrode (10–20 MΩ) placed in the exterior region of the Purkinje cell (PC) layer between the recorded MLI and GC layer. Stimulation in this configuration will activate only a few ascending GC fibers to evoke EPSCs at the axon hillock region of MLI (Satake et al., 2012). The GC-MLI EPSC amplitude was measured from the peak to the basal current level immediately preceding the stimulus artifact. Unless otherwise stated, the τdecay of EPSCs was calculated by a single-exponential fitting procedure in the PULSEFIT program (HEKA Elektronik). To record asynchronous EPSCs from MLI, we replaced the extracellular CaCl2 in ACSF with 5 mm SrCl2. Asynchronous EPSCs were analyzed by the Mini Analysis program (Synaptosoft) in a 300 ms window following the stimulus, as described previously (Satake et al., 2012).
Drug application.
All the drugs used in the present study were applied in the bath, unless otherwise stated. The drugs were purchased from the Peptide Institute, Wako Pure Chemical Industries, Tocris Bioscience, and Merck. Some stock solutions were prepared in dimethyl sulfoxide. The final dimethyl sulfoxide concentration in ACSF never exceeded 0.1% (v/v). In some experiments, bicuculline (5 μm) was included in ACSF to distinguish EPSCs from spontaneous IPSCs.
Data analyses.
PPRamp and PPRdecay were calculated in averaged traces from the ratio of the second to the first currents evoked by paired pulses with ISI of 30 ms (Satake et al., 2012), which can avoid practical errors originating in random fluctuations (Kim and Alger, 2001). ANOVA and post hoc multiple-comparison tests were used to investigate statistical differences between treatments. All analyses were performed with the KyPlot program (KyensLab). Differences with p values <0.05 were judged as significant.
Results
In rat cerebellar MLIs, paired-pulse activation of GC ascending fibers at an ISI of 30 ms caused both the facilitation of EPSC2 amplitude (PPFamp) and a longer τdecay (PPPdecay) relative to those of EPSC1, as recorded by whole-cell voltage clamping (Fig. 1A). In a previous study, we presented evidence that PPPdecay is mediated, at least in part, by MVR (Satake et al., 2012). To address the mechanisms underlying PPPdecay and MVR, we first examined the effect of subtype-selective Cav2 channel blockers (McDonough, 2007) because the channel subtype can markedly influence presynaptic Ca2+ dynamics and the quantal release pattern (Augustine, 2001; Bollmann and Sakmann, 2005; Catterall et al., 2013). Although PPPdecay occurred at 1.2 mm external Ca2+ (Satake et al., 2012), we used 2.5 mm external Ca2+ in the present study to evoke larger and less variable EPSCs for kinetic analysis.
Figure 1.

Presynaptic Cav2.1 (P/Q-type) and Cav2.2 (N-type) channels regulate different forms of short-term plasticity at GC-MLI synapses. A, B, Effects of the Cav2.1 channel-selective blocker AgTX (0.1 μm; A) and the Cav2.2 channel-selective blocker CgTX (1 μm; B) on GC-MLI synaptic transmission. Top, GC axons were stimulated with paired pulses (ISI of 30 ms). Five EPSC pairs recorded from a single MLI before (left) and after (right) treatment with the indicated blocker are superimposed. Bottom, Averaged traces of EPSC1 (gray traces) and EPSC2 (black traces) are scaled to the same peak amplitude. C, D, Time course of changes in the amplitude of the EPSC1 (white circles) and EPSC2 (closed circles) after the application of AgTX (0.1 μm; C) or CgTX (1 μm; D). EPSCs were evoked every 15 s by test stimulation. The amplitude is expressed as a percentage of EPSC1 amplitude determined before drug application. AgTX or CgTX was applied for 10 min by perfusion (as indicated by a horizontal bar). Each point represents the mean ± SEM of 10 cells. E, H, Summary of PPRamp (E) and PPRdecay (H) examined with an ISI of 30 ms before (control, white columns) and after treatment with AgTX (0.1 μm, black columns) or CgTX (1 μm, gray columns). Each column represents the mean ± SEM (n = 8–20 cells). **p < 0.01. F, G, Time course of changes in the τdecay of EPSC1 (white circles) and EPSC2 (black circles) after the application of AgTX (0.1 μm; F) or CgTX (1 μm; G). Each point represents the mean ± SEM (n = 8–11). I–K, Summary of the effects of AgTX (black columns) or CgTX (gray columns) on EPSC2 decay kinetics as fitted by a double-exponential function. Each column represents the mean ± SEM (n = 8–18). *p < 0.05.
Different Cav2 channel subtypes contribute to PPFamp and PPPdecay
As shown in Figure 1A–D, both the selective Cav2.1 (P/Q-type) channel blocker ω-agatoxin IVA (AgTX, 0.1 μm) and the Cav2.2 (N-type) channel blocker ω-conotoxin GVIA (CgTX, 1 μm) irreversibly reduced the amplitude of EPSC1. The amplitude of EPSC1 at 10 min after the termination of blocker treatment was 72.2 ± 5.7% of the baseline in AgTX (n = 10 cells, p = 0.009) and 72.2 ± 3.6% in CgTX (n = 10, p = 0.003). The magnitude of inhibition was not significantly different (p = 0.99) at these blocker concentrations. Treatment with a higher concentration of AgTX (0.5 μm) suppressed GC-MLI EPSC1 more strongly (19.1 ± 4.6% of baseline control, n = 8) than treatment with 0.1 μm AgTX (p < 0.001). In contrast, CgTX-mediated EPSC1 inhibition was not enhanced further by increasing the concentration to 5 μm (76.8 ± 5.4% of control, n = 5, p = 0.49 compared with 1 μm CgTX). These results indicate that 0.1 μm AgTX only partially inhibited Cav2.1 channel-mediated transmitter release at GC-MLI synapses and 1 μm CgTX was sufficient to completely block Cav2.2 channel-mediated release (Mintz et al., 1995).
The effects of AgTX and CgTX on EPSC2 evoked after 30 ms of ISI were markedly different. AgTX (0.1 μm) reduced the τdecay of EPSC2 without affecting that of EPSC1 (Fig. 1A,F), resulting in a significant reduction in the PPRdecay (F(2,34) = 7.44, p = 0.002; Fig. 1H). The decay kinetics of EPSC2 were modeled more precisely by a double-exponential function with terms τfast and τslow (Satake et al., 2012), revealing that the reduced τdecay of EPSC2 in the presence of AgTX was caused by a reduction in the ratio of the amplitude of the slow component (defined by τslow) to the peak amplitude (%slow; Fig. 1I–K). In addition, AgTX increased the latency from the stimulus artifact to the onset of EPSC2 (p = 0.038; Fig. 2A,B,D) and decreased the time-to-peak from the onset (p = 0.013; Fig. 2C,D) such that mean EPSC2 was nearly superimposable on the mean EPSC1 when scaled to peak (Figs. 1A, 2D). However, AgTX did not change PPRamp (Fig. 1E). In contrast, CgTX (1 μm) markedly augmented PPRamp (F(2,36) = 5.15, p = 0.011; Fig. 1E) without affecting EPSC2 kinetics (τdecay, latency, time-to-peak; Figs. 1B,G, 2E–H) or PPRdecay (Fig. 1H). The Cav2.3 (R-type) channel also mediates transmission at some synapses; however, the physiological significance of this channel type has been examined less extensively. Therefore, we examined the effects of the Cav2.3 channel blocker SNX-482 on GC-MLI EPSC. SNX-482 (0.1 μm) also reduced the EPSC amplitude and significantly augmented PPRamp (p = 0.012); however, it did not affect PPRdecay (p = 0.56; Fig. 3A,D–G).
Figure 2.

Effects of subtype-selective Cav2 channel blockers on the rising phase of GC-MLI EPSC. A, E, Thirty consecutive EPSC2 sweeps acquired before (control) and after a 10 min application of AgTX (0.1 μm; A) or CgTX (0.1 μm; E). The superimposed averaged EPSC is indicated by a gray line. B, C, Superimposed average traces of the early period from stimulation to EPSC onset (B) and the period from onset to peak (C) of EPSC2 before (control, gray trace) and after (black trace) treatment with AgTX. Horizontal arrows indicate the latency from the stimulus artifact to EPSC onset (B) and from EPSC onset to peak (C). F, G, Averaged traces as those in B and C but in the presence of CgTX. Traces were aligned at the center of stimulation artifact (B, F) or scaled to the same peak amplitude (C, G). D, H, Summary of EPSC2 kinetics (#2, ISI of 30 ms) before (black columns) and after (gray columns) AgTX (n = 11; D) or CgTX (n = 8; H) treatment. For comparison, latency and time-to-peak values of EPSC1 are also shown (#1, white columns). Each column represents the mean ± SEM. *p < 0.05.
Figure 3.

Effects of the Cav2.3 channel blocker SNX-482, the intracellular Ca2+ secretagogue thapsigargin, and the Ca2+ chelator BAPTA on PPFamp and PPPdecay at GC-MLI synapses. A–C, Effects of extracellular SNX-482 (0.1 μm; A), extracellular thapsigargin (1 μm; B), and postsynaptic BAPTA injection (20 mm; C) on GC-MLI EPSC. Paired EPSCs were evoked at an ISI of 30 ms. Top, Five successive EPSC pairs recorded from a single MLI are shown. Bottom, Averaged traces of EPSC1 (gray traces) and EPSC2 (black traces) are scaled to the same peak amplitude. D, E, Time course of changes in the amplitude (D) and τdecay (E) of EPSC1 (white circles) and EPSC2 (black circles) during the application of SNX-482 (0.1 μm). EPSCs were evoked every 15 s. Amplitude is expressed as a percentage of EPSC1 amplitude determined before the application of SNX-482. SNX-482 was applied by perfusion (as indicated by a horizontal bar). Each point represents the mean ± SEM (n = 6–9). F, G, Summary of PPRamp (F) and PPRdecay (G) before (control, white columns) and during treatment with SNX-482 (black columns), thapsigargin (gray columns), or BAPTA (hatched gray columns). Each column represents the mean ± SEM (n = 7–9). *p < 0.05.
These results suggest that PPFamp is dependent on Cav2.2 and Cav2.3 channels, whereas PPRdecay is dependent on Cav2.1 channels. However, the contribution of Cav2.1 channels to PPRamp cannot be excluded. In general, the inhibition of presynaptic Ca2+ influx reduces release probability and increases PPRamp (Zucker and Regehr, 2002; Neher and Sakaba, 2008). AgTX selectively decreased the time-to-peak of EPSC2 but not that of EPSC1 (Fig. 2A–D), indicating that Cav2.1 channel inhibition decreased the number of vesicles released in response to the second stimulus (Satake et al., 2012). Therefore, by reducing MVR, AgTX may negate the PPRamp enhancement caused by the suppression of Ca2+ influx. In α1A subunit knock-out mice, Cav2.1 channels were predominantly replaced by Cav2.2 channels at the calyx of Held presynaptic terminal, and this compensation similarly resulted in reduced PPFamp when examined under conditions of low release probability (0.6 mm [Ca2+]o; Inchauspe et al., 2004).
Neither the endoplasmic reticulum Ca2+ pump inhibitor thapsigargin (1 μm) nor postsynaptic injection of the Ca2+ chelator BAPTA (20 mm) changed PPRdecay (F(3,29) = 0.28, p = 0.84; Fig. 3B,C,F,G), ruling out contributions of Ca2+ release from presynaptic stores and Ca2+ influx through postsynaptic AgTX-sensitive VGCCs to PPPdecay. Together, these results suggest that (1) MVR (and PPPdecay that follows) is controlled by presynaptic Cav2.1 channels and (2) MVR is regulated independently of PPFamp. In addition, AgTX may reduce the size of the readily releasable pool (RRP). The effective RRP size is closely dependent on the Ca2+ influx through Cav2.1 channels at the calyx terminal (Sheng et al., 2012; Thanawala and Regehr, 2013). Such a decrease in the RRP size likely reduced the amplitude of GC-MLI EPSCs without affecting PPRamp. The decrease in the effective RRP size will also suppress MVR and PPPdecay.
Roscovitine elicits MVR through a Cav2.1 channel-dependent mechanism
If presynaptic Cav2.1 channels mediate MVR, the exogenous activation of Cav2.1 channels should induce or enhance PPPdecay. To test this idea, we examined the effects of roscovitine on GC-MLI EPSCs because roscovitine can prolong the open time of Cav2.1 and Cav2.2 channels (DeStefino et al., 2010), thereby potentiating transmitter release in cultured neurons (Tomizawa et al., 2002; Yan et al., 2002; Kim and Ryan, 2010). Roscovitine (30 μm for 10 min) caused a marked potentiation of the EPSC1 amplitude for at least 30 min (142.8 ± 16.9% of control, n = 8; Fig. 4A,B). The magnitude of PPRamp (ISI of 30 ms) at 10 min after the termination of roscovitine treatment was significantly lower than that before roscovitine application (p = 0.009; Fig. 4D), indicating that roscovitine potentiates the EPSC amplitude by increasing transmitter release. Roscovitine-induced potentiation of EPSC was completely blocked by pretreatment with 0.1 μm AgTX for 10 min (77.4 ± 12.3% of AgTX alone, n = 8; p = 0.005 compared with roscovitine alone; Fig. 5A–C) but was still observed in the presence of CgTX (1 μm; 142.7 ± 8.7% of control CgTX, n = 10; p > 0.99 compared with roscovitine alone; Fig. 5D,E). Therefore, roscovitine-mediated potentiation of the EPSC amplitude is Cav2.1 channel-dependent at cerebellar GC-MLI synapses.
Figure 4.

Roscovitine enhances PPRdecay at GC-MLI synapses. A, Effects of roscovitine (30 μm) on GC-MLI synaptic transmission. Paired EPSCs were evoked at 30 ms of ISI. Five EPSCs recorded from a single MLI before (left) and after (middle) the application of roscovitine are superimposed. The traces are averaged and scaled to peak on the right. B, C, Time course of changes in the amplitude (B) and the τdecay (C) of EPSC1 (white circles) and EPSC2 (black circles) during the application of roscovitine (30 μm). Pairs of EPSCs (ISI of 30 ms) were evoked every 15 s by test stimulation. Amplitude is expressed as a percentage of EPSC1 amplitude determined before drug application. Roscovitine was applied for 10 min by perfusion (as indicated by a horizontal bar). Each point represents the mean ± SEM (n = 8–10). D, E, Summary of PPRamp (D) and PPRdecay (E) before (control, white columns) and after (black columns) treatment with roscovitine. Each column represents the mean ± SEM (n = 8). **p < 0.01. F–H, Summary of the effects of roscovitine (black columns) on EPSC2 kinetics as fitted by a double-exponential function. Each column represents the mean ± SEM (n = 8). *p < 0.05.
Figure 5.

Effects of subtype-selective Cav2 channel blockers on roscovitine action. A, Left three traces, Five first EPSCs recorded from a single MLI during successive application of AgTX (0.1 μm) and roscovitine (30 μm). Right, Averaged traces are scaled to the same peak amplitude. B, C, Time course of changes in the amplitude (B) and τdecay (C) of EPSC1 (white circles) and EPSC2 (black circles) during the application of AgTX (0.1 μm) and roscovitine (30 μm). Pairs of EPSCs (ISI of 30 ms) were evoked every 15 s. Amplitude is expressed as a percentage of EPSC1 amplitude determined before the application of AgTX. AgTX and roscovitine were applied for 10 min by perfusion (as indicated by a horizontal bar). Each point represents the mean ± SEM (n = 8). D, E, Time course of changes in the amplitude (D) and τdecay (E) of EPSC1 (white circles) and EPSC2 (black circles) during successive application of CgTX (1 μm) and roscovitine (30 μm). Amplitude is expressed as a percentage of EPSC1 amplitude determined before CgTX application. Roscovitine and CgTX were applied for 10 min by perfusion (indicated by the horizontal bar). Each point represents the mean ± SEM (n = 9).
Roscovitine (30 μm) markedly increased τdecay of both EPSC1 and EPSC2 (Fig. 4A,C). Roscovitine also enhanced PPRdecay (p = 0.008; Fig. 4E) but had no effect on either τfast or τslow; rather, there was a significant increase in the %slow value after roscovitine treatment (Fig. 4F–H). Thus, the Cav2.1 channel blocker AgTX decreased the slowly decaying component of EPSC2 (%slow; Fig. 1K), while the Cav2.1 channel agonist roscovitine enhanced %slow. Furthermore, the effects of roscovitine on EPSC decay were completely eliminated by AgTX but not by CgTX (Fig. 5). Roscovitine (30 μm) decreased the latency between the stimulus artifact and the onset of EPSC1 and increased the time-to-peak (Fig. 6). These changes in the τslow ratio, onset delay, and time-to-peak induced by roscovitine mimicked the effect of EPSC1 on EPSC2 at a short ISI (Satake et al., 2012) and were reciprocal to the changes in EPSC2 caused by AgTX treatment (Fig. 2B–D).
Figure 6.
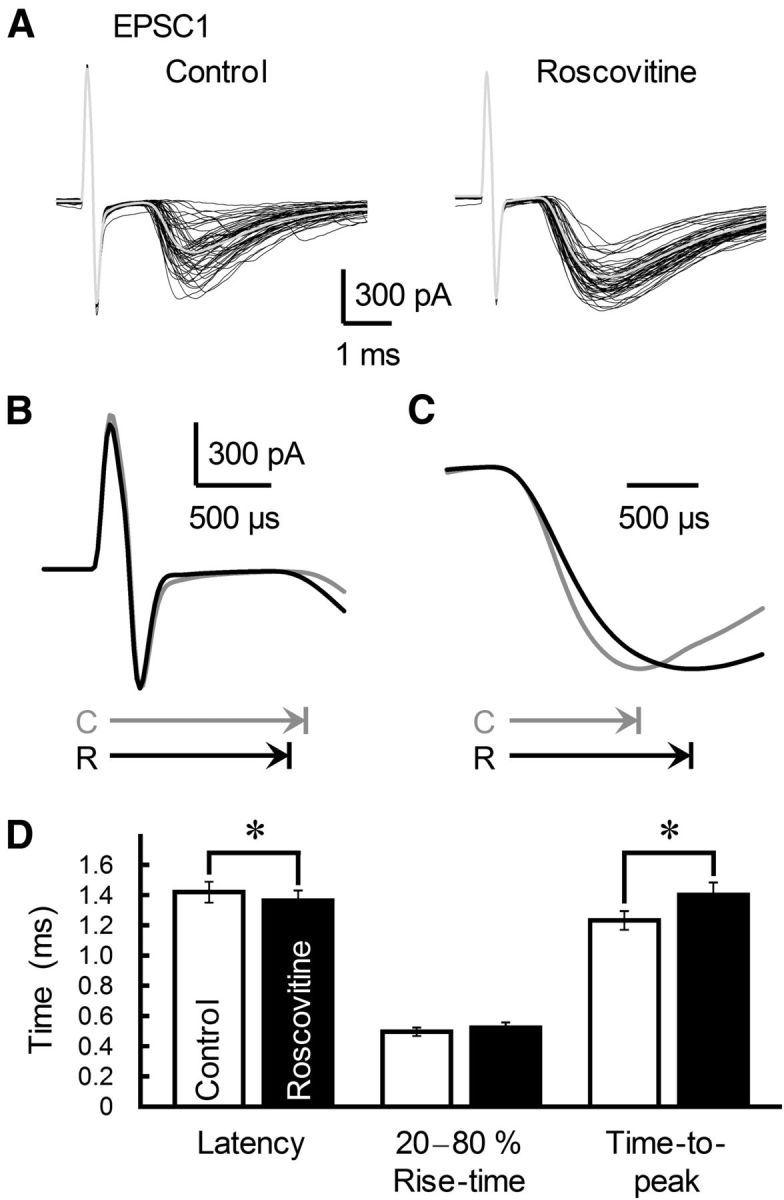
Effects of roscovitine on the rising phase of GC-MLI EPSC. A, Fifty consecutive EPSCs recorded from a single MLI before (left) and after (right) roscovitine (30 μm) treatment are shown. An averaged trace is indicated by a gray line. B, Superimposed averaged traces of the stimulus artifact and EPSC1 onset before (control, gray trace) and after (black trace) treatment with roscovitine (same data as in A). Horizontal arrows show latency to EPSC1 onset (C, control; R, roscovitine). C, Superimposed averaged traces showing EPSC1 onset and peak before (control, gray trace) and after (black trace) roscovitine treatment are scaled to the same peak amplitude and aligned at the rising phase (same data as in A). Horizontal arrows show the time-to-peak from EPSC onset. D, Summary of EPSC1 kinetics recorded before (white columns) and after (black columns) roscovitine treatment. Each column represents the mean ± SEM (n = 10). *p < 0.05.
Theoretically, these effects on EPSC kinetics could reflect changes in the kinetics of the postsynaptic AMPA receptors (AMPARs) that mediate glutamatergic EPSCs in MLIs. However, in our previous study, we found no changes in AMPAR kinetics during PPPdecay (Satake et al., 2012). Moreover, τdecay of miniature EPSCs is mainly determined by AMPAR kinetics, and roscovitine (30 μm) had no effect on the mean τdecay of asynchronous small EPSCs evoked in Sr2+-containing ACSF (Fig. 7) (Satake et al., 2012).
Figure 7.

Effects of roscovitine on asynchronously occurring EPSCs at GC-MLI synapses. A, Effects of roscovitine (30 μm) on asynchronous EPSCs recorded from a single MLI. Asynchronous EPSCs were evoked by single pulses to GC axons at least 15 min after the perfusion of Sr2+-containing ACSF; three successive sweeps before (left) and during (right) roscovitine treatment are shown. B–D, Summary of the frequency (B), mean amplitude (C), and mean τdecay (D) of asynchronized EPSCs recorded before (white columns) and after (black columns) the application of roscovitine. All asynchronous EPSCs analyzed were collected during a 300 ms window starting from the stimulus. Each column represents the mean ± SEM (n = 9). ***p < 0.001.
The low-affinity competitive AMPAR antagonist γ-d-glutamlyglycine (γ-DGG; 200 μm) was less effective in reducing the EPSC amplitude following roscovitine-mediated EPSC potentiation (p = 0.025 compared with γ-DGG alone; Fig. 8A,B,D), indicating that roscovitine increased the glutamate concentration in the synaptic cleft. Furthermore, γ-DGG significantly reduced the roscovitine-induced increase in τdecay of both EPSC1 and EPSC2 (p = 0.018; Fig. 8A,C,E). Together, these results suggest that (AgTX-sensitive and roscovitine-sensitive) Cav2.1 channels play a critical role in triggering MVR. In addition, the depletion of the RRP after the first release causes selective depletion of docked vesicles near functionary active channels (namely roscovitine-induced reduction of PPRamp); however, this process will leave other docked vesicles ready to be released by the second AP (Wadel et al., 2007).
Figure 8.

Roscovitine enhances MVR glutamate at GC-MLI synapses. A, Effect of sequential application of roscovitine (30 μm) and γ-DGG (200 μm) on GC-MLI EPSC. Paired EPSCs were evoked with an ISI of 30 ms. The low-affinity competitive glutamate receptor antagonist γ-DGG was applied after roscovitine-induced potentiation. Left three traces, Five successive EPSC1s recorded from a single MLI before (left) and after the application of roscovitine (middle) and γ-DGG (right) are superimposed. Right, Averaged traces of EPSC1 before and after roscovitine treatment are scaled to the same peak amplitude. B, C, Time course of changes in the amplitude (B) and τdecay (C) of EPSC1 (white circles) and EPSC2 (black circles) during the application of roscovitine (30 μm) and γ-DGG (200 μm). EPSCs were evoked every 15 s by test stimulation. Amplitude is expressed as a percentage of EPSC1 amplitude determined before the application of roscovitine. Roscovitine and γ-DGG were applied for 10 min by perfusion (as indicated by horizontal bars). Each point represents the mean ± SEM (n = 8–10). D, E, Summary of the inhibitory effects of γ-DGG on the amplitude (D) and τdecay (E) of EPSC1 and EPSC2 (ISI of 30 ms). Each column represents the mean ± SEM (n = 11–13). *p < 0.05.
Role of accumulated free Ca2+ from distal VGCCs in MVR
The peak [Ca2+]i at a given release site closely depends on its distance from open VGCCs (Nadkarni et al., 2012) as well as on the concentrations, kinetic properties, and diffusion characteristics of endogenous intracellular Ca2+ buffers (Eggermann et al., 2012). Synchronous vesicular release has been explained by short-lived “nanodomains” and “microdomains” of elevated [Ca2+]i at the terminal. The nanodomain spans the area within a few tens of nanometers of VGCC pores, a region where Ca2+ is not in equilibrium with fast Ca2+ buffers. In contrast, a microdomain spans 0.1–1 μm across and consists of a considerable number of nanodomains (Oheim et al., 2006; Neher and Sakaba, 2008; Eggermann et al., 2012). The sum of the suppressive effects of AgTX (0.5 μm) and CgTX (1 μm) on GC-MLI EPSCs was larger than 100% (Fig. 1), suggesting an overlap of Cav2.1 and Cav2.2 channel-mediated Ca2+ nanodomains (Mintz et al., 1995) and the presence of microdomain signaling at the single GC terminal.
At some excitatory synapses, PPFamp is thought to be caused by free residual Ca2+ remaining from the first AP (Augustine, 2001; Zucker and Regehr, 2002). In synapses with fast presynaptic Ca2+ buffers, local Ca2+ buffer saturation has also been proposed as a mechanism for PPFamp (Blatow et al., 2003; Felmy et al., 2003). Competition between the Ca2+ buffer and the Ca2+ sensor for Ca2+ entering through open VGCCs is the critical factor determining buffer saturation and thus the amount of free Ca2+ at the release site (Rozov et al., 2001). Cerebellar GCs express the fast Ca2+ buffer calretinin but not the other fast buffers calbindin-D28k or parvalbumin (Bastianelli, 2003; Eggermann and Jonas, 2012; Schmidt et al., 2013). Compared to Ca2+ buffers with near diffusion-limited forward-rate constants (fast buffers), slower Ca2+ chelators would be more effective in buffering Ca2+ entering through VGCCs more distant from the release site (and suppressing vesicle release mediated by this remote Ca2+ influx). Indeed, EGTA can bind residual Ca2+, thereby preventing vesicular release caused by the accumulation of free Ca2+ (Blatow et al., 2003), whereas it cannot affect Ca2+ dynamics in the presence of a large quantity of a faster Ca2+ buffer. Therefore, we speculated that a moderate concentration of EGTA would selectively block the accumulation of free Ca2+ throughout the GC terminal without affecting the local saturation of endogenous fast Ca2+ buffers near open channels. In addition, because of the slow rate of Ca2+ binding to EGTA, Ca2+ can diffuse from the entry site before being bound by EGTA (Eggermann et al., 2012). We can thus evaluate the topographical relationship between presynaptic VGCCs and exocytotic Ca2+ sensors by monitoring the effect of EGTA on PPFamp and PPPdecay.
Using a membrane-permeable form of EGTA (EGTA-AM; Atluri and Regehr, 1996; Kamiya et al., 2002; Blatow et al., 2003), we introduced EGTA into presynaptic terminals; the concentration of free EGTA in the terminals will be higher than that of extracellular EGTA-AM (Atluri and Regehr, 1996). The amplitude of GC-MLI EPSCs irreversibly decreased after the application of EGTA-AM at 100 μm (Fig. 9A,B). This suppression was stronger for EPSC2, thereby significantly reducing PPRamp (p = 0.007; Fig. 9D). In addition, EGTA-AM treatment significantly reduced τdecay of EPSC2 but had little effect on τdecay of EPSC1 (Fig. 9C), resulting in the suppression of PPRdecay (p = 0.016; Fig. 9E). The suppression of PPRdecay was due to a reduction in the %slow component of EPSC2 (Fig. 9F–H). These results suggest that (1) Ca2+ sensors that mediate MVR are located more distally from Cav2.1 channels and (2) Ca2+ accumulates even at release sites distant from the open channel.
Figure 9.

Contribution of free Ca2+ accumulation to PPPdecay at GC-MLI synapses. A, Top, Effects of the slow Ca2+ chelator EGTA-AM (100 μm) on GC-MLI synaptic transmission. GC axons were stimulated with paired pulses (ISI of 30 ms). Left two traces, Five successive EPSC pairs recorded from a single MLI before (left) and after (middle) treatment with the Ca2+ chelator are superimposed. Right, After averaging, the depressed EPSC1 (black trace) was scaled to the control EPSC1 (gray trace) and superimposed. Bottom, Averaged traces of EPSC1 (gray traces) and EPSC2 (black traces) are scaled to the same peak amplitude. B, C, Time course of changes in the amplitude (B) and τdecay (C) of EPSC1 (white circles) and EPSC2 (black circles) during the application of EGTA-AM (100 μm). EPSCs were evoked every 15 s by test stimulation. Amplitude is expressed as a percentage of EPSC1 amplitude determined before the application of EGTA-AM. EGTA-AM was applied for 10 min by perfusion (as indicated by a horizontal bar). Each point represents the mean ± SEM (n = 8). D, E, EGTA-AM decreases both PPRamp (D) and PPRdecay (E). Each column represents the mean ± SEM (n = 8). **p < 0.01, *p < 0.05. F–H, Summary of the effects of EGTA-AM (black columns) on EPSC2 kinetics as fitted by a double-exponential function. Each column represents the mean ± SEM (n = 8).
Finally, we compared the effect of subtype-selective Cav2 channel blockers on GC-MLI EPSCs after treatment with EGTA-AM (100 μm). AgTX (0.1 μm) and CgTX (1 μm) reduced the amplitude of EPSC1 to 68.6 ± 5.8% (n = 9, p = 0.016; Fig. 10A,C) and 74.8 ± 6.0% (n = 9, p = 0.018; Fig. 10B,E) of control EGTA-AM, respectively, with a clear increase in PPRamp (p = 0.004 in AgTX; Fig. 10G; p = 0.004 in CgTX; Fig. 10I). These Cav2 blockers did not cause any significant changes in EPSC decay (Fig. 10D,F) or in PPRdecay (p = 0.52 in AgTX; Fig. 10H; p = 0.16 in CgTX; Fig. 10J) after EGTA-AM treatment. Thus, Cav2.1 and Cav2.2 channels appeared to have similar effects on exocytotic transmitter release at the GC axon terminal when the accumulation of free Ca2+ and the following activation of distally located Ca2+ sensors (namely microdomain signaling) were suppressed.
Figure 10.

Effect of sequential application of EGTA-AM and subtype-selective Cav2 channel blockers on GC-MLI EPSC. A, B, Top two traces, Five paired EPSCs (ISI of 30 ms) recorded from a single MLI during successive application of EGTA-AM (100 μm, control) and AgTX (0.1 μm, A) or CgTX (1 μm, B). Bottom, Averaged traces of EPSC1 are scaled to the same peak amplitude. Each Cav2 channel blocker was applied after EGTA-AM-induced depression. C–F, Time course of changes in the amplitude (C, E) and τdecay (D, F) of EPSC1 (white circles) and EPSC2 (black circles) during the application of EGTA-AM (100 μm) and AgTX (0.1 μm; C, D) or CgTX (1 μm; E, F). EPSCs were evoked every 15 s by test stimulation. Amplitude is expressed as a percentage of EPSC1 amplitude determined before the application of EGTA-AM. EGTA-AM and the Cav2 channel blocker were applied for 10 min by perfusion (as indicated by a horizontal bar). Each point represents the mean ± SEM (n = 9). G–J, Summary of PPRamp (G, I) and PPRdecay (H, J) examined with an ISI of 30 ms before (ACSF, white columns) and after treatment with EGTA-AM (control, gray columns) and AgTX (G, H, black columns) or CgTX (I, J, black columns). Each column represents the mean ± SEM (n = 9). **p < 0.01.
Discussion
In the present study, we demonstrated that presynaptic Cav2.1 (P/Q-type) channels, located farther away from release sites than channels triggering fast release in response to isolated APs, play a major role in triggering MVR at GC ascending axon fibers. In turn, these changes in EPSC kinetics greatly influence the temporal excitability of postsynaptic MLIs (Satake et al., 2012). Therefore, Cav2.1 channel-mediated MVR adds additional complexity to neural encoding and transduction at rat cerebellar GC-MLI glutamatergic synapses (Fig. 11).
Figure 11.
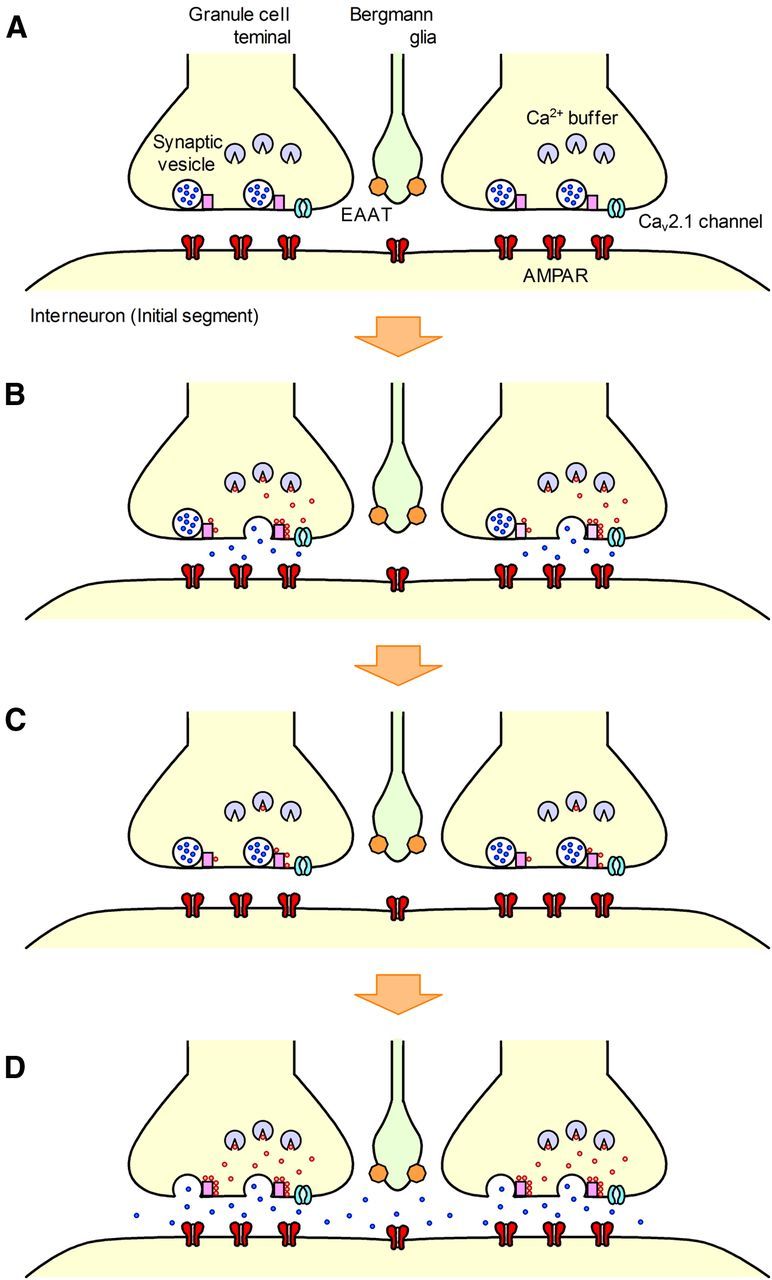
Proposed mechanisms underlying PPFamp and PPPdecay at rat cerebellar GC-MLI synapses. A, B, Cav2.1 channels are activated by a single AP, thereby eliciting Ca2+ influx into the GC axon terminal and subsequent vesicular release (the first release). C, If the interval to the second AP is short, intracellular Ca2+ will accumulate, possibly augmented by use-dependent facilitation of the Cav2.1 channel and/or occupation of endogenous Ca2+ buffers. D, The accumulated free Ca2+ permits the activation of Ca2+ sensors located more distant from the Cav2.1 channel, thereby increasing the number of released vesicles (the second release; MVR and PPFamp). A considerable amount of glutamate spills out from the synaptic cleft, leading to intersynaptic pooling of glutamate among active GC synapses (PPPdecay).
Cav2.1 channels mediate MVR at the GC-MLI synapse
Presynaptic Ca2+ entry is necessary for phasic vesicle release in response to APs. The accumulation of residual Ca2+ and modulation of VGCCs are important for presynaptic short-term plasticity during high-frequency nerve firing (Zucker and Regehr, 2002; Neher and Sakaba, 2008; Catterall et al., 2013). We demonstrate that the magnitude of PPPdecay is sensitive to Cav2.1 channel modifiers, decreasing in the presence of the channel antagonist AgTX (Fig. 1) and increasing in the presence of the channel agonist roscovitine (Fig. 4). In addition, these Cav2.1 channel modifiers reciprocally affected the onset and time-to-peak value of EPSC (Figs. 2, 6). In the olivocerebellar climbing fibers, the transmitter glutamate is released not only at the active zones but also at the ectopic sites (Matsui and Jahr, 2003). This ectopic release was specifically suppressed by the Cav2.2 channel blocker CgTX (Matsui and Jahr, 2004). Although PPPdecay at the GC-MLI synapse was insensitive to CgTX (Fig. 1), ectopic release may also be implicated in PPPdecay.
The selective coupling between the Cav2.1 channel opening and MVR may result from the use-dependent facilitation of Cav2.1 channel activity. At the calyx of Held, Cav2.1 channel-mediated Ca2+ currents undergo activity-dependent facilitation during repetitive activation (Borst and Sakmann, 1998; Cuttle et al., 1998; Inchauspe et al., 2004; Ishikawa et al., 2005; Catterall et al., 2013), and this facilitation accounts for ∼40% of PPFamp under low release probability conditions (0.6 mm [Ca2+]o; Müller et al., 2008). This AP frequency-dependent Cav2.1 channel modulation results from the accumulation of intracellular Ca2+ and subsequent binding of Ca2+ sensor proteins to the calmodulin-binding domain and/or the IQ-like domain of the α12.1 subunit (Tsujimoto et al., 2002; Lee et al., 2003; Lautermilch et al., 2005; Mochida et al., 2008; Catterall et al., 2013). The relationship between PPRamp of Cav2.1 channel-mediated currents and ISI at the calyx synapse (Cuttle et al., 1998) is similar to that between PPRdecay and ISI at cerebellar GC-MLI synapses (Satake et al., 2012). Although the actual current mediated by Cav2.1 channels cannot be directly measured at GC-MLI synapses, Adams et al. (2010) reported that a gain-of-function missense mutation (R192Q) of the Cav2.1 channel impaired the Ca2+-dependent facilitation of Cav2.1 channel-mediated currents in culture and reduced PPFamp at cerebellar GC-PC synapses in the mutant mice. However, a similar use-dependent facilitation has not been shown for Cav2.2/Cav2.3 subtypes.
In addition to the frequency-dependent facilitation of the Cav2.1 channel current, the accumulation of intracellular Ca2+ may contribute to ensuing MVR. This mechanism would depend on the number of activated Cav2.1 channels and endogenous Ca2+ buffers, and their spatial relationship with exocytotic Ca2+ sensors at the presynaptic membrane. Local saturation of Ca2+ buffers will also play a role in determining the amount of free Ca2+ at the release site (Blatow et al., 2003; Felmy et al., 2003; Eggermann and Jonas, 2012). AgTX inhibits Cav2.1 channel activity in an all-or-none fashion (McDonough, 2007); therefore, the application of low concentrations should reduce the density of functional Cav2.1 channels on the plasma membrane. Phasic increases in [Ca2+]i produced by the facilitation of Cav2.1 channels during successive APs and the accumulation of free Ca2+ could synergistically act to increase the number of vesicles released given that the release–[Ca2+]i relation follows a power law function (due to the cooperativity of Ca2+ binding; Catterall et al., 2013). Furthermore, specific types of presynaptic VGCCs induce relatively asynchronous or synchronous transmitter release at hippocampal and cortical GABAergic neurons (Hefft and Jonas, 2005; Williams et al., 2012). The opening of presynaptic VGCCs is mainly driven by AP, the waveform of which can broaden during repetitive firing due to the inactivation of presynaptic K+ channels (Geiger and Jonas, 2000). Broader APs are frequently coincident with greater presynaptic Ca2+ influx and postsynaptic currents (Sabatini and Regehr, 1997; Geiger and Jonas, 2000); therefore, this process may also enhance Cav2.1 channel-mediated Ca2+ influx and elicit MVR.
Ca2+ sensors that mediate MVR are located at a distance from Cav2.1 channels
The distance between presynaptic VGCCs and exocytotic Ca2+ sensors is a major determinant of the latency from the peak Ca2+ current to the maximal vesicular release (Wadel et al., 2007; Bucurenciu et al., 2008; Eggermann et al., 2012; Nadkarni et al., 2012; Schneggenburger et al., 2012). PPRdecay was markedly suppressed by moderate concentrations of the slow Ca2+ chelator EGTA (Fig. 9), suggesting that within the single Ca2+ microdomain, the facilitation of Cav2.1 channel currents or an increase in the number of activated Cav2.1 channels leads to a higher peak free [Ca2+]i and greater activation of exocytotic Ca2+ sensors. The end result would be higher MVR.
Differential localization of VGCC subtypes at the presynaptic terminal may be involved in the induction of different types of PPF. Kulik et al. (2004) showed that Cav2.1 immunoreactivity is densely clustered at the active zone of GC axonal varicosities. At the calyx synapses, immunoreactivity for Cav2.2 and Cav2.3 subunits is more distant from release sites and does not colocalize with Cav2.1 subunit immunoreactivity (Wu et al., 1999). Differences in VGCC localization in relation to synaptic vesicles, Ca2+ sensors, and Ca2+ buffers/pumps potentially influence the relationship between ICa and the vesicle release rate, delay between ICa onset and release onset, time to peak release, decay of elevated release probability, and the effects of secretagogues, exogenous buffers, and pump inhibitors (Spafford and Zamponi, 2003; Neher and Sakaba, 2008).
More recently, Schmidt et al. (2013) reported that the coupling distance between Ca2+ influx and exocytotic Ca2+ sensor is shorter than 30 nm (namely nanodomain coupling) at the cerebellar parallel fiber (PF)-PC synapse. They quantified the coupling distance by applying multiprobability fluctuation analysis to PF-PC EPSC1 and showed a less suppressive action of EGTA-AM on EPSC1. In contrast, we found that the amplitude of GC-MLI EPSCs irreversibly decreased after the application of EGTA-AM and this decrease was stronger for EPSC2 (Fig. 9). Furthermore, EGTA-AM reduced τdecay of EPSC2 but had little effect on τdecay of EPSC1 (Fig. 9). These results clearly showed the involvements of distally located Ca2+ sensors from Cav2.1 channels in MVR (Fig. 10). A significant difference has been reported in the property of PPFamp at the GC synapse converging onto the different type of neurons (Bao et al., 2010). In response to repetitive activation (50 Hz train), GC-MLI synapses exhibited transient and small facilitation and subsequent depression of the EPSC amplitude. In contrast, GC-PC synapses only showed a strong facilitation. This difference is mainly mediated by the target-specific short-term plasticity at the GC terminal; in particular, presynaptic Munc13-3 plays a major role in the synaptic depression at the GC-MLI synapse (Bao et al., 2010). Together, EPSC2 (MVR) at the GC-MLI ascending synapse will be elicited differently from EPSC1 (fast phasic release) at the PF-PC dendritic synapse.
Considerable evidence indicates that Cav2.1 and Cav2.2 channels differentially couple with vesicle release machinery, depending on the synapse type (Catterall et al., 2013). Thousands of unique Cav2 isoforms are produced by single genes through alternative pre-mRNA splicing, RNA editing, and post-translational modifications (Lipscombe et al., 2013). Each Cav2 channel gene can show a specific expression profile to satisfy cellular demands. In addition, molecular interactions between Cav2 channels and subcellular-specific proteins are crucial in establishing the specific function of the channel. For example, RIM (Rab3-interacting molecule) proteins tether Cav2.1 and Cav2.2 channels to presynaptic active zones through a direct PDZ domain-dependent interaction (Kaeser et al., 2011), although this binding has not been shown to regulate the differential localization of Cav2 subtypes. In cultured hippocampal neurons, the VGCC auxiliary subunit α2δ promotes the trafficking of Cav2 channels from the cell soma to the presynaptic terminals and mediates close coupling between the Cav2 channels and Ca2+ sensors (Hoppa et al., 2012). This dual functionality of the α2δ subunit will augment the accumulation of Cav2 channels in the vicinity of release sites and exocytotic vesicular release. Therefore, differences in pre-mRNA splicing, RNA editing, and post-translational modifications of Cav2 channel isoforms, auxiliary subunits, and other interacting proteins likely contribute to synapse type-specific differences in Cav2 channel-mediated exocytosis (Catterall et al., 2013; Lipscombe et al., 2013).
The Ca2+ sensors that initiate vesicle release in response to Cav2.1 or Cav2.2/Cav2.3 channel activation may have different Ca2+ affinities. Sun et al. (2007) reported that at the calyx synapse, different Ca2+ sensors with distinct Ca2+-cooperativities triggered synchronous or asynchronous vesicular release, depending on the local Ca2+ dynamics. Calcium-binding sites with higher affinity should be able to track [Ca2+]i more efficiently and maintain vesicular release for a longer period. Slow Ca2+ unbinding from the sensor (Bornschein et al., 2013) may also play a role in release facilitation (Fig. 11). The mechanisms underlying the Cav2 channel-dependent control of MVR and PPRdecay at GC-MLI synapses await further scrutiny. Nonetheless, we present compelling evidence that Cav2 subtypes transduce presynaptic APs at common terminals of a regular size into transmitter release patterns differing in the probability, multiplicity, variability, duration, timing, and synchronism.
Footnotes
This work was partly supported by grants-in-aid from the Ministry of Education, Culture, Sports, Science and Technology of Japan, and the Japan Society for the Promotion of Science. We thank T. Inoue for comments on an early version of the manuscript; H. Ishihara, M. Tanaka, and A. Nakamura for technical assistance; and M. Miyata, D. Uta, Y. Yamagata, and H. Furue for helpful discussion.
The authors declare no competing financial interests.
References
- Adams PJ, Rungta RL, Garcia E, van den Maagdenberg AM, MacVicar BA, Snutch TP. Contribution of calcium-dependent facilitation to synaptic plasticity revealed by migraine mutations in the P/Q-type calcium channel. Proc Natl Acad Sci U S A. 2010;107:18694–18699. doi: 10.1073/pnas.1009500107. [DOI] [PMC free article] [PubMed] [Google Scholar]
- Atluri PP, Regehr WG. Determinants of the time course of facilitation at the granule cell to Purkinje cell synapse. J Neurosci. 1996;16:5661–5671. doi: 10.1523/JNEUROSCI.16-18-05661.1996. [DOI] [PMC free article] [PubMed] [Google Scholar]
- Atluri PP, Regehr WG. Delayed release of neurotransmitter from cerebellar granule cells. J Neurosci. 1998;18:8214–8227. doi: 10.1523/JNEUROSCI.18-20-08214.1998. [DOI] [PMC free article] [PubMed] [Google Scholar]
- Auger C, Kondo S, Marty A. Multivesicular release at single functional synaptic sites in cerebellar stellate and basket cells. J Neurosci. 1998;18:4532–4547. doi: 10.1523/JNEUROSCI.18-12-04532.1998. [DOI] [PMC free article] [PubMed] [Google Scholar]
- Augustine GJ. How does calcium trigger neurotransmitter release? Curr Opin Neurobiol. 2001;11:320–326. doi: 10.1016/S0959-4388(00)00214-2. [DOI] [PubMed] [Google Scholar]
- Bao J, Reim K, Sakaba T. Target-dependent feedforward inhibition mediated by short-term synaptic plasticity in the cerebellum. J Neurosci. 2010;30:8171–8179. doi: 10.1523/JNEUROSCI.0276-10.2010. [DOI] [PMC free article] [PubMed] [Google Scholar]
- Bastianelli E. Distribution of calcium-binding proteins in the cerebellum. Cerebellum. 2003;2:242–262. doi: 10.1080/14734220310022289. [DOI] [PubMed] [Google Scholar]
- Blatow M, Caputi A, Burnashev N, Monyer H, Rozov A. Ca2+ buffer saturation underlies paired pulse facilitation in calbindin-D28k-containing terminals. Neuron. 2003;38:79–88. doi: 10.1016/S0896-6273(03)00196-X. [DOI] [PubMed] [Google Scholar]
- Bollmann JH, Sakmann B. Control of synaptic strength and timing by the release-site Ca2+ signal. Nat Neurosci. 2005;8:426–434. doi: 10.1038/nn1417. [DOI] [PubMed] [Google Scholar]
- Bornschein G, Arendt O, Hallermann S, Brachtendorf S, Eilers J, Schmidt H. Paired-pulse facilitation at recurrent Purkinje neuron synapses is independent of calbindin and parvalbumin during high-frequency activation. J Physiol. 2013;591:3355–3370. doi: 10.1113/jphysiol.2013.254128. [DOI] [PMC free article] [PubMed] [Google Scholar]
- Borst JG, Sakmann B. Facilitation of presynaptic calcium currents in the rat brainstem. J Physiol. 1998;513:149–155. doi: 10.1111/j.1469-7793.1998.149by.x. [DOI] [PMC free article] [PubMed] [Google Scholar]
- Bucurenciu I, Kulik Á, Schwaller B, Frotscher M, Jonas P. Nanodomain coupling between Ca2+ channels and Ca2+ sensors promotes fast and efficient transmitter release at a cortical GABAergic synapse. Neuron. 2008;57:536–545. doi: 10.1016/j.neuron.2007.12.026. [DOI] [PubMed] [Google Scholar]
- Catterall WA, Leal K, Nanou E. Calcium channels and short-term synaptic plasticity. J Biol Chem. 2013;288:10742–10749. doi: 10.1074/jbc.R112.411645. [DOI] [PMC free article] [PubMed] [Google Scholar]
- Chen C, Regehr WG. Contributions of residual calcium to fast synaptic transmission. J Neurosci. 1999;19:6257–6266. doi: 10.1523/JNEUROSCI.19-15-06257.1999. [DOI] [PMC free article] [PubMed] [Google Scholar]
- Cuttle MF, Tsujimoto T, Forsythe ID, Takahashi T. Facilitation of the presynaptic calcium current at an auditory synapse in rat brainstem. J Physiol. 1998;512:723–729. doi: 10.1111/j.1469-7793.1998.723bd.x. [DOI] [PMC free article] [PubMed] [Google Scholar]
- DeStefino NR, Pilato AA, Dittrich M, Cherry SV, Cho S, Stiles JR, Meriney SD. (R)-roscovitine prolongs the mean open time of unitary N-type calcium channel currents. Neuroscience. 2010;167:838–849. doi: 10.1016/j.neuroscience.2010.02.041. [DOI] [PMC free article] [PubMed] [Google Scholar]
- Eggermann E, Jonas P. How the ‘slow’ Ca2+ buffer parvalbumin affects transmitter release in nanodomain-coupling regimes. Nat Neurosci. 2012;15:20–22. doi: 10.1038/nn.3002. [DOI] [PMC free article] [PubMed] [Google Scholar]
- Eggermann E, Bucurenciu I, Goswami SP, Jonas P. Nanodomain coupling between Ca2+ channels and sensors for exocytosis at fast mammalian synapses. Nat Rev Neurosci. 2012;13:7–21. doi: 10.1038/nrn3125. [DOI] [PMC free article] [PubMed] [Google Scholar]
- Felmy F, Neher E, Schneggenburger R. Probing the intracellular calcium sensitivity of transmitter release during synaptic facilitation. Neuron. 2003;37:801–811. doi: 10.1016/S0896-6273(03)00085-0. [DOI] [PubMed] [Google Scholar]
- Geiger JR, Jonas P. Dynamic control of presynaptic Ca2+ inflow by fast-inactivating K+ channels in hippocampal mossy fiber boutons. Neuron. 2000;28:927–939. doi: 10.1016/S0896-6273(00)00164-1. [DOI] [PubMed] [Google Scholar]
- Hefft S, Jonas P. Asynchronous GABA release generates long-lasting inhibition at a hippocampal interneuron-principal neuron synapse. Nat Neurosci. 2005;8:1319–1328. doi: 10.1038/nn1542. [DOI] [PubMed] [Google Scholar]
- Hoppa MB, Lana B, Margas W, Dolphin AC, Ryan TA. α2δ expression sets presynaptic calcium channel abundance and release probability. Nature. 2012;486:122–125. doi: 10.1038/nature11033. [DOI] [PMC free article] [PubMed] [Google Scholar]
- Inchauspe CG, Martini FJ, Forsythe ID, Uchitel OD. Functional compensation of P/Q by N-type channels blocks short-term plasticity at the calyx of Held presynaptic terminal. J Neurosci. 2004;24:10379–10383. doi: 10.1523/JNEUROSCI.2104-04.2004. [DOI] [PMC free article] [PubMed] [Google Scholar]
- Ishikawa T, Kaneko M, Shin HS, Takahashi T. Presynaptic N-type and P/Q-type Ca2+ channels mediating synaptic transmission at the calyx of Held of mice. J Physiol. 2005;568:199–209. doi: 10.1113/jphysiol.2005.089912. [DOI] [PMC free article] [PubMed] [Google Scholar]
- Kaeser PS, Deng L, Wang Y, Dulubova I, Liu X, Rizo J, Südhof TC. RIM proteins tether Ca2+ channels to presynaptic active zones via a direct PDZ-domain interaction. Cell. 2011;144:282–295. doi: 10.1016/j.cell.2010.12.029. [DOI] [PMC free article] [PubMed] [Google Scholar]
- Kamiya H, Ozawa S, Manabe T. Kainate receptor-dependent short-term plasticity of presynaptic Ca2+ influx at the hippocampal mossy fiber synapses. J Neurosci. 2002;22:9237–9243. doi: 10.1523/JNEUROSCI.22-21-09237.2002. [DOI] [PMC free article] [PubMed] [Google Scholar]
- Kim J, Alger BE. Random response fluctuations lead to spurious paired-pulse facilitation. J Neurosci. 2001;21:9608–9618. doi: 10.1523/JNEUROSCI.21-24-09608.2001. [DOI] [PMC free article] [PubMed] [Google Scholar]
- Kim SH, Ryan TA. CDK5 serves as a major control point in neurotransmitter release. Neuron. 2010;67:797–809. doi: 10.1016/j.neuron.2010.08.003. [DOI] [PMC free article] [PubMed] [Google Scholar]
- Kulik Á, Nakadate K, Hagiwara A, Fukazawa Y, Luján R, Saito H, Suzuki N, Futatsugi A, Mikoshiba K, Frotscher M, Shigemoto R. Immunocytochemical localization of the α1A subunit of the P/Q-type calcium channel in the rat cerebellum. Eur J Neurosci. 2004;19:2169–2178. doi: 10.1111/j.0953-816X.2004.03319.x. [DOI] [PubMed] [Google Scholar]
- Lautermilch NJ, Few AP, Scheuer T, Catterall WA. Modulation of Cav2.1 channels by the neuronal calcium-binding protein visinin-like protein-2. J Neurosci. 2005;25:7062–7070. doi: 10.1523/JNEUROSCI.0447-05.2005. [DOI] [PMC free article] [PubMed] [Google Scholar]
- Lee A, Zhou H, Scheuer T, Catterall WA. Molecular determinants of Ca2+/calmodulin-dependent regulation of Cav2.1 channels. Proc Natl Acad Sci U S A. 2003;100:16059–16064. doi: 10.1073/pnas.2237000100. [DOI] [PMC free article] [PubMed] [Google Scholar]
- Lipscombe D, Allen SE, Toro CP. Control of neuronal voltage-gated calcium ion channels from RNA to protein. Trends Neurosci. 2013;36:598–609. doi: 10.1016/j.tins.2013.06.008. [DOI] [PMC free article] [PubMed] [Google Scholar]
- Matsui K, Jahr CE. Ectopic release of synaptic vesicles. Neuron. 2003;40:1173–1183. doi: 10.1016/S0896-6273(03)00788-8. [DOI] [PubMed] [Google Scholar]
- Matsui K, Jahr CE. Differential control of synaptic and ectopic vesicular release of glutamate. J Neurosci. 2004;24:8932–8939. doi: 10.1523/JNEUROSCI.2650-04.2004. [DOI] [PMC free article] [PubMed] [Google Scholar]
- McDonough SI. Gating modifier toxins of voltage-gated calcium channels. Toxicon. 2007;49:202–212. doi: 10.1016/j.toxicon.2006.09.018. [DOI] [PubMed] [Google Scholar]
- Mintz IM, Sabatini BL, Regehr WG. Calcium control of transmitter release at a cerebellar synapse. Neuron. 1995;15:675–688. doi: 10.1016/0896-6273(95)90155-8. [DOI] [PubMed] [Google Scholar]
- Mochida S, Few AP, Scheuer T, Catterall WA. Regulation of presynaptic Cav2.1 channels by Ca2+ sensor proteins mediates short-term synaptic plasticity. Neuron. 2008;57:210–216. doi: 10.1016/j.neuron.2007.11.036. [DOI] [PubMed] [Google Scholar]
- Müller M, Felmy F, Schneggenburger R. A limited contribution of Ca2+ current facilitation to paired-pulse facilitation of transmitter release at the rat calyx of Held. J Physiol. 2008;586:5503–5520. doi: 10.1113/jphysiol.2008.155838. [DOI] [PMC free article] [PubMed] [Google Scholar]
- Nadkarni S, Bartol TM, Stevens CF, Sejnowski TJ, Levine H. Short-term plasticity constrains spatial organization of a hippocampal presynaptic terminal. Proc Natl Acad Sci U S A. 2012;109:14657–14662. doi: 10.1073/pnas.1211971109. [DOI] [PMC free article] [PubMed] [Google Scholar]
- Neher E, Sakaba T. Multiple roles of calcium ions in the regulation of neurotransmitter release. Neuron. 2008;59:861–872. doi: 10.1016/j.neuron.2008.08.019. [DOI] [PubMed] [Google Scholar]
- Oheim M, Kirchhoff F, Stühmer W. Calcium microdomains in regulated exocytosis. Cell Calcium. 2006;40:423–439. doi: 10.1016/j.ceca.2006.08.007. [DOI] [PubMed] [Google Scholar]
- Rozov A, Burnashev N, Sakmann B, Neher E. Transmitter release modulation by intracellular Ca2+ buffers in facilitating and depressing nerve terminals of pyramidal cells in layer 2/3 of the rat neocortex indicates a target cell specific difference in presynaptic calcium dynamics. J Physiol. 2001;531:807–826. doi: 10.1111/j.1469-7793.2001.0807h.x. [DOI] [PMC free article] [PubMed] [Google Scholar]
- Sabatini BL, Regehr WG. Control of neurotransmitter release by presynaptic waveform at the granule cell to Purkinje cell synapse. J Neurosci. 1997;17:3425–3435. doi: 10.1523/JNEUROSCI.17-10-03425.1997. [DOI] [PMC free article] [PubMed] [Google Scholar]
- Satake S, Saitow F, Yamada J, Konishi S. Synaptic activation of AMPA receptors inhibits GABA release from cerebellar interneurons. Nat Neurosci. 2000;3:551–558. doi: 10.1038/75718. [DOI] [PubMed] [Google Scholar]
- Satake S, Song SY, Konishi S, Imoto K. Glutamate transporter EAAT4 in Purkinje cells controls intersynaptic diffusion of climbing fiber transmitter mediating inhibition of GABA release from interneurons. Eur J Neurosci. 2010;32:1843–1853. doi: 10.1111/j.1460-9568.2010.07469.x. [DOI] [PubMed] [Google Scholar]
- Satake S, Inoue T, Imoto K. Paired-pulse facilitation of multivesicular release and intersynaptic spillover of glutamate at rat cerebellar granule cell-interneurone synapses. J Physiol. 2012;590:5653–5675. doi: 10.1113/jphysiol.2012.234070. [DOI] [PMC free article] [PubMed] [Google Scholar]
- Schmidt H, Brachtendorf S, Arendt O, Hallermann S, Ishiyama S, Bornschein G, Gall D, Schiffmann SN, Heckmann M, Eilers J. Nanodomain coupling at an excitatory cortical synapse. Curr Biol. 2013;23:244–249. doi: 10.1016/j.cub.2012.12.007. [DOI] [PubMed] [Google Scholar]
- Schneggenburger R, Han Y, Kochubey O. Ca2+ channels and transmitter release at the active zone. Cell Calcium. 2012;52:199–207. doi: 10.1016/j.ceca.2012.04.011. [DOI] [PubMed] [Google Scholar]
- Sheng J, He L, Zheng H, Xue L, Luo F, Shin W, Sun T, Kuner T, Yue DT, Wu LG. Calcium-channel number critically influences synaptic strength and plasticity at the active zone. Nat Neurosci. 2012;15:998–1006. doi: 10.1038/nn.3129. [DOI] [PMC free article] [PubMed] [Google Scholar]
- Spafford JD, Zamponi GW. Functional interactions between presynaptic calcium channels and the neurotransmitter release machinery. Curr Opin Neurobiol. 2003;13:308–314. doi: 10.1016/S0959-4388(03)00061-8. [DOI] [PubMed] [Google Scholar]
- Sun J, Pang ZP, Qin D, Fahim AT, Adachi R, Südhof TC. A dual-Ca2+-sensor model for neurotransmitter release in a central synapse. Nature. 2007;450:676–682. doi: 10.1038/nature06308. [DOI] [PMC free article] [PubMed] [Google Scholar]
- Takahashi T, Momiyama A. Different types of calcium channels mediate central synaptic transmission. Nature. 1993;366:156–158. doi: 10.1038/366156a0. [DOI] [PubMed] [Google Scholar]
- Thanawala MS, Regehr WG. Presynaptic calcium influx controls neurotransmitter release in part by regulating the effective size of the readily releasable pool. J Neurosci. 2013;33:4625–4633. doi: 10.1523/JNEUROSCI.4031-12.2013. [DOI] [PMC free article] [PubMed] [Google Scholar]
- Tomizawa K, Ohta J, Matsushita M, Moriwaki A, Li ST, Takei K, Matsui H. Cdk5/p35 regulates neurotransmitter release through phosphorylation and downregulation of P/Q-type voltage-dependent calcium channel activity. J Neurosci. 2002;22:2590–2597. doi: 10.1523/JNEUROSCI.22-07-02590.2002. [DOI] [PMC free article] [PubMed] [Google Scholar]
- Tsujimoto T, Jeromin A, Saitoh N, Roder JC, Takahashi T. Neuronal calcium sensor 1 and activity-dependent facilitation of P/Q-type calcium currents at presynaptic nerve terminals. Science. 2002;295:2276–2279. doi: 10.1126/science.1068278. [DOI] [PubMed] [Google Scholar]
- Wadel K, Neher E, Sakaba T. The coupling between synaptic vesicles and Ca2+ channels determines fast neurotransmitter release. Neuron. 2007;53:563–575. doi: 10.1016/j.neuron.2007.01.021. [DOI] [PubMed] [Google Scholar]
- Wadiche JI, Jahr CE. Multivesicular release at climbing fiber-Purkinje cell synapses. Neuron. 2001;32:301–313. doi: 10.1016/S0896-6273(01)00488-3. [DOI] [PubMed] [Google Scholar]
- Wall MJ, Usowicz MM. Development of the quantal properties of evoked and spontaneous synaptic currents at a brain synapse. Nat Neurosci. 1998;1:675–682. doi: 10.1038/3677. [DOI] [PubMed] [Google Scholar]
- Williams C, Chen W, Lee CH, Yaeger D, Vyleta NP, Smith SM. Coactivation of multiple tightly coupled calcium channels triggers spontaneous release of GABA. Nat Neurosci. 2012;15:1195–1197. doi: 10.1038/nn.3162. [DOI] [PMC free article] [PubMed] [Google Scholar]
- Wu LG, Westenbroek RE, Borst JG, Catterall WA, Sakmann B. Calcium channel types with distinct presynaptic localization couple differentially to transmitter release in single Calyx-type synapses. J Neurosci. 1999;19:726–736. doi: 10.1523/JNEUROSCI.19-02-00726.1999. [DOI] [PMC free article] [PubMed] [Google Scholar]
- Yan Z, Chi P, Bibb JA, Ryan TA, Greengard P. Roscovitine: a novel regulator of P/Q-type calcium channels and transmitter release in central neurons. J Physiol. 2002;540:761–770. doi: 10.1113/jphysiol.2001.013376. [DOI] [PMC free article] [PubMed] [Google Scholar]
- Zucker RS, Regehr WG. Short-term synaptic plasticity. Annu Rev Physiol. 2002;64:355–405. doi: 10.1146/annurev.physiol.64.092501.114547. [DOI] [PubMed] [Google Scholar]