

Abstract
We evaluated the effects of ministrokes targeted to individual pial arterioles on motor function in Thy-1 line 18 channelrhodopsin-2 (ChR2) transgenic mice within the first hours after ischemia. Using optogenetics, we directly assessed both the excitability and motor output of cortical neurons in a manner independent of behavioral state or training. Occlusion of individual arterioles within the motor cortex led to a ministroke that was verified using laser speckle contrast imaging. Surprisingly, ministrokes targeted to a relatively small region of the forelimb motor map, with an ischemic core of 0.07 ± 0.03 mm2, impaired motor responses evoked from points across widespread areas of motor cortex even 1.5 mm away. Contrasting averaged ChR2-evoked electroencephalographic, spinal (ChR2 evoked potential), and electromyographic responses revealed a mismatch between measures of cortical excitability and motor output within 60 min after stroke. This mismatch suggests that apparently excitable cortical neurons (even >1 mm into peri-infarct areas, away from the infarct core) were impaired in their capacity to generate spinal potentials leading to even more severe deficits in motor output at muscles. We suggest that ischemia, targeted to a subset of motor cortex, leads to relatively small reductions in excitability within motor cortex, and cumulative depression of both descending spinal circuits and motor output in response to the activation of widespread cortical territories even outside of the area directly affected by the ischemia.
Keywords: stroke, optogenetics, motor-mapping, channelrhodopsin-2, plasticity, mouse
Introduction
Recovery of motor function after stroke is dependent on the capacity of the brain to reorganize surviving circuitry (Nudo et al., 2001; Nudo, 2006). Motor maps exhibit plasticity (Kerr et al., 2011) and alterations during training (Nudo et al., 1996a; Kleim et al., 1998; Tennant et al., 2012), and their remapping over days to weeks after stroke is related to the recovery of motor behavior (Castro-Alamancos and Borrel, 1995; Nudo et al., 1996b). However, assessment of motor function can be challenging in experimental animals given that stroke often produces a period of prolonged synaptic depression (Hossmann, 1971, 1994; Astrup et al., 1977, 1981; Heiss, 2000). Furthermore, to adequately assess motor function sophisticated behavioral tests that can be difficult to implement and interpret in mice are required, particularly at early time points after ischemia (Levin et al., 2009; Alaverdashvili and Whishaw, 2010; Moon et al., 2009). Recently, we have used the light-activated ion channel channelrhodopsin-2 (ChR2; Nagel et al., 2003; Boyden et al., 2005) as a means of assessing the excitability (Xiong and Jin, 2012) of neurons in somatosensory (Chen et al., 2012) and motor cortex (Xie et al., 2013) within the first minutes to hours following global ischemia. Our approach revealed neurons that were silent with respect to sensory processing, but were nonetheless excitable after reperfusion. These excitable neurons may be available to mediate circuit-level plasticity that could contribute to recovery of function. However, our previous work was limited to global ischemia and did not evaluate focal ischemia models where an affected core and a penumbra with a partial reduction in blood flow was present. Here, we extend this previous work to focal ischemia and have directly evaluated motor function using ChR2 stimulation. Given that ischemia impairs initiation (Schafer et al., 2009) and conduction (Bolay and Dalkara, 1998) of neuronal signals, and can also alter the excitation-inhibition balance of cortex (Buchkremer-Ratzmann et al., 1996; Bütefisch et al., 2003; Wang, 2003; Carmichael, 2012; Schmidt et al., 2012), optogenetics can potentially differentiate between effects on general neuronal excitability and selective depression of motor output. In the case of motor function we have applied optogenetics to automate the mapping of motor cortex (Ayling et al., 2009; Hira et al., 2009) to better resolve effects within both the ischemic core and penumbra by examining changes in neuronal excitability and the topography of motor maps within the initial 2.5 h after stroke. We have focused on this time interval because this is when treatments, such as thrombolysis and other interventions, are performed (Cook et al., 2012; Hill et al., 2012). We report that a ministroke directed to a subset of the forelimb motor map has a significantly larger effect on motor output than that expected from its action on local cortical neuronal excitability.
Materials and Methods
Animals and surgery.
All animal protocols were approved by The University of British Columbia Animal Care Committee. Male and Female The Jackson Laboratory Line-18 stock 007612, strain B6Cg-Tg (Thy1-COP4/EyFP)18Gfng/J channel rhodopsin-2 transgenic mice (Arenkiel et al., 2007) from an established breeding colony aged 2–4 months weighing 20–30 g were used. Mice were anesthetized using 2% isoflurane in air, which was reduced to 1–1.5% during surgery. Body temperature was maintained at 37 ± 0.5°C using a heating pad and feedback from a rectal probe. The mouse was placed in a custom made head hold (Harrison et al., 2009) and a craniectomy was made over the right motor cortex without removing the dura. Agarose dissolved in HEPES buffered ACSF, pH 7.3, to 1.5% was placed over the surface of the cortex at 37°C. The surface of the cortex was then covered with a No.1 130, 160- μm-thick glass coverslip. Teflon-coated silver wires were surgically implanted into the left extensor carpi ulnaris for electromyography (EMG) and placed over the surface of cortex for electroencephalography (EEG). After performing a laminectomy over a region corresponding to the fourth cervical vertebrae, a silver ball electrode was inserted superiorly to the exposed area over the dorsal column the spinal cord and stabilized in agarose. Ground electrodes were placed subcutaneously in the forepaw, hindlimb, and above the nose. The skin of the forelimb was sealed with cyanoacrylate, or light-based mapping anesthesia was switched to a ketamine xylazine combination (100/10 mg/kg) and supplemented as required.
Laser-speckle contrast imaging.
The surface of the cortex was illuminated with a 784 nm 32 mW StockerYale SNF-XXX_885 s-35 laser (Stocker and Yale) at a 30-degree angle with a beam expander and light intensity controlled by a polarizer. The flow of blood cells and resultant blurring in the interference patterns was detected by a CCD camera (Dalsa 1M60). Image acquisition was performed using EPIX XCAP software (v2.2). Fifty frames were acquired at 10 Hz with a 10 ms exposure time. The 1024 × 1024 image stack was variance filtered with a kernel size of 3 × 3 pixels and averaged into a single 32-bit image. The square root of the resultant image was divided by the mean filtered image stack to generate a single image. Regions of interest selected for assessment of blood flow over time were 20 × 20 pixels (76 × 76 μm) and centered over the vessel targeted for occlusion. Blood flow measurements were estimated as the inverse square of speckle contrast values and scaled between minimum and maximum flow rate (Ohtsubo and Asakura, 1976; Dunn et al., 2001; Cheng et al., 2003). To determine regional changes in blood flow images were Gaussian filtered, typically with a pixel radius of 15, subtracted from baseline images, and thresholded to contrast levels equivalent to 20, 40, and 60% reductions relative to mean image contrast. Maximal speckle contrast values were empirically determined from dead animals and minimum values were those associated with prestroke image contrast levels.
Optogenetic motor mapping and assessment of neuronal excitability.
The methodology for light-based motor mapping was described in detail previously (Ayling et al., 2009). Custom software written in Igor pro (v6.2, Wavemetrics) moved a scanning stage (ASI MS-2000) with the mouse beneath a fixed 473 nm laser focused to a diameter of ∼100 μm. Laser pulses were 10 ms in duration. Sites of stimulation were 300 μm apart and typically arranged in a 12 × 14 grid of sites that were stimulated in semirandom order, with the requirement that sites had to be further than 750 μm each other to be stimulated sequentially. Stimulation of the grid was repeated three times and the resultant recordings from each independent site of cortical activation and muscular activity in the periphery were averaged to generate a motor and neuronal excitability map. EMG and ChR2-evoked electroencephalographic (Xie et al., 2012), and cortically evoked dorsal spinal potential recordings were amplified 1000 times (model 1700, A-M Systems), digitized (National Instruments NIDAQ), and then recorded and monitored online in Igor pro. The amplitude of EMG signals were quantified as the root mean square of the signal and the amplitude of the EEG was the maximum of the rectified integrated signal >50 ms after stimulus onset. Laser intensity ranged from 1 to 5 mW and was adjusted to the lowest power settings capable of generating stable motor maps. Only responses with amplitude that exceeded three times the SD of the 500 ms prestimulus period were included in mapping data. If the EEG electrode encroached within the mapping grid a distinct light artifact in a minimal number of EEG map pixels from the laser striking the electrode was evident (see Fig. 4C), and was therefore removed from the dataset. To aid analysis of sparsely sampled maps EEG and EMG response maps were upsampled, leading to a pixel size of 100 × 100 μm, normalized to their respective means, aligned relative to the stroke location and averaged.
Figure 4.

Assessment of motor output and neuronal excitability after stroke. A, ChR2-evoked EEG maps generated from repeated mapping of a (Ai) sham animal and (Aii) one with a targeted stroke. Gray values of pixels represent the amplitude of responses from stimulation of that specific location. Saturated pixels from light striking the EEG electrode, marked with a black circle, were not analyzed. B, The percentage change in the mean of EEG responses in the map over time. C, EEG traces from a single animal displaying the initial and delayed persistent response to ChR2 cortical stimulation in (Ci) sham and (Cii) stroke animals. D, The relative change in persistent activity after irradiation and ischemia. Error bars in all graphs are SEM. Significant differences #p < 0.05 with respect to baseline. Significant differences *p < 0.05, **p < 0.01, ***p < 0.001 between groups.
A potential concern is that the laser-induced photoactivation of ChR2 may spread to regions of cortex not affected by the ministroke because light scattering through tissue and other factors increases the apparent area of photoactivation. The greatest responses are at the targeted photo activation site; however, intrinsic optical signal (IOS) imaging revealed that responses are detectable at a distance of 600–900 μm (Ayling et al., 2009). The relatively sharp boundaries of motor maps (presumably due to a threshold) suggest that the area of activation associated with motor responses may be smaller than areas activated and recorded with IOS and here with EEG. In mice in which recordings from the spinal cord were used, ChR2 stimulation was limited to two sites, either at the location of the vessel targeted for occlusion or in a peri-infarct area within motor cortex. These two stimulation sites were at an average distance of 1.36 ± 0.22 mm of each other. Recording ChR2-evoked EEG potentials in the spinal cord, and EMG responses from 200 to 300 repetitions of stimulation at of these two sites was performed before and after stroke. Quantification of potentials recorded from the spinal cord was performed by measuring the peak deflection in the signal.
Targeted photothrombosis.
The animals were placed under an upright microscope (Olympus BX51W1) and the target vessel was located through a 40×0.8 NA water-immersion objective. The animal was injected intravenously in the tail with 0.01–0.03 mg/g rose bengal dye (Sigler et al., 2008; Risher et al., 2010; Mohajerani et al., 2011; Murphy, 2011) diluted in 0.02 ml HEPES buffered artificial CSF. Light from a 532 nm laser (Beta Electronics MgM-20) was directed at the target vessel through the epifluorescence light path of the microscope. Photoactivation of the dye was maintained until the clot formed; this was first confirmed visually and then with laser-speckle imaging similar to previous studies (Sigler et al., 2008, 2009; Mohajerani et al., 2011).
Statistics.
EMG and EEG data were normalized to the average of values acquired in the baseline mapping session for each mouse. Wilcoxon signed rank tests were used to compare EEG, EMG, and blood flow measures to hypothetical baselines. Comparisons between stroke (n = 8) and sham (n = 7) EEG and EMG signals (with some maps missing at random due to the requirement of maintenance of the proper anesthetic plane for mapping), were performed with Mann–Whitney tests. Ischemic territories from these mice were compared with Kruskal–Wallis and Dunn's post hoc statistical tests. Linear regression analysis was applied to quantify the relationship between EEG and EMG signals as a function of distance from the infarct core. In the cohort of mice in which spinal potentials were recorded comparison of EEG, spinal potentials, and EMG signals after stroke were performed with one-way ANOVA followed by Bonferonni within group post hoc tests (n = 4). The same statistical testing was applied to the surface area of ischemic territories. Comparison of EEG, spinal potentials, EMG, and speckle values after stroke to those measured at baseline were performed with paired t tests. Statistical tests were performed using GraphPad Prism (version 5.0).
Results
Light-based motor mapping
Line-18 transgenic mice express ChR-2 via the Thy-1 promoter largely in layer 5 pyramidal neurons (Arenkiel et al., 2007). Automated optogenetic motor mapping (Ayling et al., 2009; Hira et al., 2009) allowed for repeated fast acquisition of a cortical motor representation of the forelimb and averaged EEG responses that reflect aspects of cortical neuronal excitability. EMG recordings in the contralateral forelimb, recordings from the dorsal column of the spinal cord, and ChR2-evoked cortical EEG recordings provide simultaneous assessment of cortical neuronal and spinal excitability while evaluating motor output and regional blood flow (Fig. 1A–C) in response to cortical ChR2 activation. As each of these electrophysiological measurements is based on different but dependent physiological processes, this approach serves to assay selective vulnerabilities within the motor system. Unlike traditional intracortical microstimulation mapping methods which aim to determine the dominant response of a particular area (Tennant et al., 2011), we quantitatively map ChR2-evoked cortical and forelimb EMG responses across the entirety of motor cortex to assay the regional capacity of cells to drive motor output.
Figure 1.

Experimental arrangement for ChR2 cortical and motor mapping. A, Green light image of cortex overlaid with a 12 × 14 grid of stimulation sites each separated by 300 μm (Ai). Traces of EMG (Aii) and EEG (Aiii) responses evoked from light stimulation directed at each site on cortex. Aiv, Quantification of the ChR2 evoked EEG response; the raw, rectified and integrated signal. Bi, Processed laser-speckle image displaying blood flow of surface vasculature, with higher velocity blood flow appearing as a darker tone. The arrow indicates the arteriole targeted for occlusion, selected for its location branching from the middle cerebral artery over a restricted region of the motor map. ChR2 evoked EMG (Bii) and EEG (Biii) responses from three repetitions averaged and scaled between minimal and maximal values represented as pixels ranged from black to white reveal a ChR2-evoked motor and neuronal excitability (EEG) map. Tracings of vasculature superimposed on the motor map, with the vessel targeted for occlusion colored in blue. Biv, Outline of the motor map after thresholding-excluding responses <25% of maximum. Location of vessels targeted for occlusion relative to center of motor maps (n = 8). Outline of thresholded motor map relative to forelimb and hindlimb cortical sensory representations and bregma based on previous observations (Ayling et al., 2009). C, Timeline of the experiment. Baseline maps and laser speckle imaging was performed. Photothrombosis was achieved by irradiating the target vessel after injection of rose bengal. Following induction of stroke, changes in blood flow were measured with laser speckle imaging before ChR2 mapping ensured. This procedure was repeated for 2.5 h.
Evolution of the targeted stroke
Stroke was induced with a modified version of the rose bengal method (Watson et al., 1985) targeting individual surface pial arterioles (Sigler et al., 2008; Fig. 2A). Laser-speckle imaging and laser-optogenetic stimulation did not commence until 5–10 min after the occlusion was induced to avoid additional off-target photoactivation of the dye. Imaging after stroke revealed that within a 20 × 20 pixel (76 × 76 μm) area surrounding the targeted vessel, blood flow was reduced to 27.1 ± 3.9% of baseline (p < 0.05 n = 8 mice; Fig. 2B). Pial arterioles were targeted for occlusion were 46.5 ± 5.7 μm in diameter (n = 8). Within 40–50 min, blood flow decreased to <20% of baseline and continued to decline gradually throughout the experiment. The ischemic territory was calculated by subtracting baseline laser-speckle contrast images from those acquired after induction of stroke. Thresholding images at contrast values equivalent to 20, 40, and 60% of mean baseline blood flow values confirmed that the infarcted area was restricted to a subset of motor cortex (Fig. 2C,D). The targeted vessels were located on average 1.66 ± 0.43 laterally and ±0.21 mm caudally from the center of motor maps (Fig. 1B). The initial 0.07 ± 0.03 mm2 ischemic core defined by 20% blood flow expanded to 0.45 ± 0.27 mm2 within 130–140 min after irradiation. Similarly, hypoperfused areas corresponding to reductions in blood flow of 40% and 60% were initially restricted to 0.8 ± 0.3 mm2 and 1.6 ± 0.5 mm2 regions, but they expanded to 1.2 ± 0.02 and 2.3 ± 0.7 mm2 by 130–140 min after stroke, (Fig. 2C,D). As photoactivation and subsequent occlusion in this model of stroke is localized to surface arterioles, damage to deeper cortical layers occurs more gradually (Enright et al., 2007) and is consistent with the findings where surface vascular networks can supply deeper cortical areas (Schaffer et al., 2006; Blinder et al., 2013; Shih et al., 2013).
Figure 2.

Evolution of the targeted stroke. A, Laser-speckle image displaying blood flow of surface vasculature with a black outline of the corresponding motor map and the area with <20% blood mean blood flow after stroke in white. B, Percentage change in blood flow at the 76 × 76 μm region of interest at the vessel targeted for occlusion. C, The surface area of cortex with area corresponding to various thresholds of blood flow. D, Areas corresponding to 20, 40, and 60% blood flow superimposed onto laser speckle images at 70–80 min poststroke with the most ischemic area (<20% blood flow) outlined. Error bars in all graphs are SEM. Significant differences relative to baseline #p < 0.05, ##p < 0.01 and between groups *p < 0.05, **p < 0.01.
Differential effect of stroke on neuronal excitability, spinal potentials, and motor maps
After stroke, motor output (measured using EMGs) was reduced at all stimulated points within the motor map (Figs. 3A–C, 5A). Deficits in motor maps were more widespread and severe with motor output at the stroke core depressed to 28.8%±13.0 of baseline (see Fig. 5D; group data). Motor output at 1 and 1.5 mm from the stroke core was 58.1%±6.2 and 68.8%±4.6 of baseline, respectively, increasing as a function of distance (Fig. 5D; r2 = 0.92, p < 0.001, group data). There was no significant change in the number of responsive points in motor maps (Fig. 3C). Notably, the majority of the stimulated locations (for EMGs) were not directly encroached upon by the stroke core as defined by laser-speckle imaging (Fig. 2A). This is comparable to ministroke-induced remapping in sensory systems, where responses at the stroke core were attenuated, but cortical regions farther from the infarct were preserved (Sigler et al., 2008). Immediately after stroke, the average of all responses within motor maps were depressed to 59.1 ± 13.6% (p = 0.063) of baseline, whereas sham animals maintained motor output at 93.4 ± 34.0% of baseline (p = 0.344; Fig. 3B; based on EMG amplitude). The decrease in motor output continued after stroke, reaching 40.2 ± 12.6% (p < 0.001) of baseline by the last mapping session (130–160 min). Motor output in sham animals (n = 7) increased to 184.7 ± 34.7% (p < 0.05) of baseline at the corresponding time point (between groups comparison p < 0.001). Repetitive optogenetic stimulation significantly increased motor output in a time dependent manner in sham animals comparable with previous work (Ayling et al., 2009).
Figure 3.

Assessment of motor output after stroke. A, Motor maps generated from repeated mapping of a (Ai) sham animal and (Aii) one with a targeted stroke. B, The percentage change in the mean of ChR2 evoked EMG responses in the map over time. C, Change in motor map area based on the number of stimulation sites that evoked a motor response (EMG). Rescaled image from 130 to 160 min time point more clearly demonstrating spatial the extent of cortical stimulation regions that yielded motor responses. Error bars in all graphs are SEM. Significant differences #p < 0.05 with respect to baseline. Significant differences *p < 0.05, **p < 0.01, ***p < 0.001 between groups.
Figure 5.
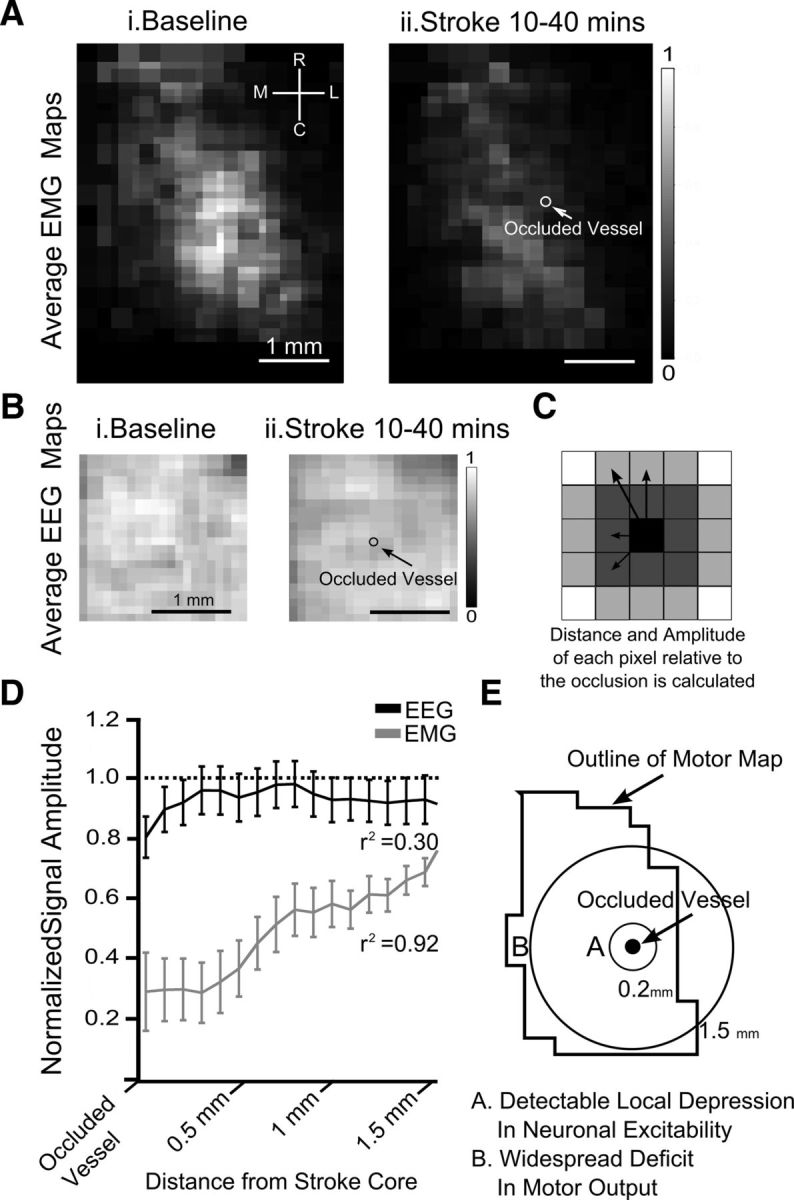
The spatial relationship between changes in neuronal excitability, motor output, and the ministroke for group data. A, Average upsampled ChR-2 stimulated motor maps, (100 × 100 μm pixels) normalized to their respective mean, aligned based the location of the infarct and averaged together. Motor maps (average) at (Ai) baseline and (Aii) motor maps immediately after stroke (10–40 min; n = 6). B, Average upsampled neuronal excitability maps, (100 × 100 μm pixels) normalized to their respective mean, aligned based the location of the infarct and averaged together. ChR-2 stimulated EEG map at (Bi) baseline and (Bii) immediately after stroke (n = 6). C, Schematic of how plots in D were derived, with the amplitude of each map pixel being binned according to its distance to the infarct regardless of direction. D, Motor output (r2 = 0.92; p < 0.001) and neuronal excitability (r2 = 0.30; p = 0.0651) immediately after stroke relative to baseline maps as a function of distance from the occluded vessel. E, Schematic of the spatial changes in neuronal excitability and motor output imparted by targeted ischemia.
In contrast to the deficit observed in motor maps, neuronal excitability as defined by ChR2-evoked EEG signal was relatively preserved across cortex (Fig. 4A,B). Signal amplitude, measured as the peak of the rectified integrated signal over a 50 ms period, was used to generate EEG maps to reflect baseline light-evoked neuronal excitability across cortex. Average neuronal excitability (EEG) values from across cortex within 40 min after stroke onset were 96.6 ± 2.1% of baseline (n = 6). These values were not significantly different from sham animals 90.1 ± 2.3% (n = 7). In maps collected during the final mapping session EEG maps collected from stimulation across the entire 3 × 4 mm cranial window were 73.3 ± 6.0% of baseline in the stroke group and 79.3 ± 2.6% of baseline in sham controls (Fig. 4B; based on EEG amplitude). Presumably, the 20% run-down in map amplitude in the sham control animals was due to time-dependent changes in this acute preparation. Although neuronal excitability was typically lower in stroke animals, no significant differences in the amplitude of the EEG responses were observed between stroke and sham control animals at any time point. Significant differences in neuronal excitability after stroke relative to baseline were reached in maps collected at 70–100 min poststroke (p < 0.05). In maps generated 10–40 min after stroke, a local depression to 80.4 ± 5.0% of baseline was detectable poststroke. This depression in ChR2-evoked EEG was local, as within 400 μm of the occlusion site values of excitability were 95.9 ± 6.8% relative to the baseline map (Fig. 5A–D). As ministroke-induced depression of neuronal excitability was local it did not display a linear correspondence between distance and changes in excitability over millimeter scales (r2 = 0.30, p = 0.0651; Fig. 5D,E).
After averaging ChR2-evoked EEG responses, we observed activity after the initial 50 ms evoked response that typically persisted for 500 ms (Fig. 4C). This activity may represent a cortical response dependent on activity (Lim et al., 2012). Persistent activity decreased to 81.1 ± 5.3% of baseline (p < 0.01) 10–40 min after stroke (n = 6), whereas activity at the same time point in sham animals was maintained at 106.3 ± 8% (n = 7; p < 0.05). Within 130–160 min after stroke, this activity was reduced to 70.5 ± 12.8%, whereas it was preserved at 99.1 ± 15.2% in sham animals (Fig. 4D).
In the cohort of mice in which spinal cord recordings were performed (Fig. 6A–F) blood flow at the target vessel was reduced to 24.7 ± 9.0% (p < 0.05) immediately after stroke (within 10 min), remaining stable (25.8 ± 10.4%) at 40–50 min poststroke (n = 4; Fig. 6C). Vessels targeted for occlusion were 58.3 ± 11.6 μm in diameter (n = 4). Within groups comparison of the surface area of ischemic territories after repeated-measures ANOVA (p < 0.001) demonstrated significant differences between groups (Fig. 6B). Descending spinal potentials evoked from light stimulation at the site of the occluded vessel within cortex were recorded within 10–40 min after stroke (Fig. 6A,D). We observed that cortically evoked (ChR2-mediated) spinal potentials were reduced to 42.3 ± 5.4% of baseline for sites in the stroke core and declined to 56.5 ± 11.6% (n = 4; p < 0.05) when evoked at cortical peri-infarct sites (1.3 ± 0.2 mm away; Fig. 6D,E). The latency of the peak of spinal potentials recorded at the peri-infart site increased to 36.3 ± 1.0 ms from 32.3 ± 2.9 ms (n = 4; p = 0.11). The increase in latency at the stroke core was not significant, 36.1 ± 0.8 ms from a baseline of 29.9 ± 2.23 ms (n = 4; p = 0.059; Fig. 6F). Simultaneous cortical EEG and EMG recordings acquired immediately after stroke confirmed that neuronal cortical excitability was maintained (90.5 ± 12.8%), whereas motor output by EMG was impaired (12.4 ± 1.5%) at the site of the infarct (p < 0.05) and in the stimulated peri-infarct area (83.7 ± 1.0%; 24.7 ± 9.8% p < 0.05; n = 4; Fig. 6E). These finding suggest a progressive loss of excitability as ChR2-evoked activity enters the spinal cord that may account for the relatively larger effect on motor output than direct cortical excitability.
Figure 6.

The effect of stroke on ChR2-mediated and cortically evoked dorsal spinal potentials. A, Distance of the two sites optogentically stimulated, one being the stroke core and the other a hypoperfused peri-infarct region within motor cortex. B, The surface area of cortex with area corresponding to various thresholds of blood flow immediately after stroke (0–10 min; n = 4). Significant differences *p < 0.05, **p < 0.01, ***p < 0.001 for multiple-comparisons between these measures via Bonferroni Post Hoc testing after one-way ANOVA. C, Blood flow at the 76 × 76 μm region of interest at the vessel targeted for occlusion (n = 4). Significant differences # p < 0.05, ##p < 0.01 after t test. D, ChR2-evoked spinal cord potentials from stimulation of motor cortex at the site of the stroke (Di) and within a peri-infarct area (Dii) recorded along the dorsal column superior to the level of the fourth cervical vertebrae. E, ChR2-evoked cortical (EEG), spinal cord dorsum potential (CDP), and muscular (EMG) potentials recorded 10–40 min after stroke demonstrate the progressive attenuation of the motor output after stroke (n = 4). F, Latency to peak spinal response from ChR2 cortical stimulation from each stimulation site; at the stroke core and at the periinfarct site.
Discussion
Localized strokes cause widespread suppression of motor maps
The canonical view of brain injury is that the magnitude of the deficit is proportional to infarct size (Lashley, 1931). In the hours after focal ischemia it is unclear whether this holds, as variable degrees of structural damage are possible depending on local perfusion (Zhang et al., 2005) and there is an inherent nonlinearity of ischemic thresholds (Hossmann, 1994; Baron and Marchal, 1999; Baron, 2001). Ischemia imparts differential consequences on axonal (Enright et al., 2007), dendritic (Johansen et al., 1984), and postsynaptic (Horner et al., 1998) neuronal structures. Remote deficits in connected regions (Mohajerani et al., 2011; Carter et al., 2012a,b) and selective vulnerability of different cell types (Khazipov et al., 1995) and areas of the brain (Zhao and Flavin, 2000) adds further complexity to the effects of focal lesions. Here, we characterized functional changes in optogenetically activated layer 5 neurons, a cell population responsible for motor output from cortex (Anderson et al., 2010). We addressed the differential effects of ischemia on cortical and muscular excitability with the spatial resolution to identify regional changes. The ischemic core, defined as the area with ≥80% reduction blood flow, was restricted to a portion of forelimb motor cortex; however, the functional deficit was apparent at all stimulated sites within motor maps. The infarct core was surrounded by an evolving and substantial amount of hypoperfused tissue. Over time, this developing penumbra expanded across motor cortex. Although the pyramidal tract is unexcitable during proximal middle cerebral occlusion (Bolay et al., 2000), a smaller ischemic region was sufficient to cause a deficit in motor output. The pervasive effect of a small ischemic insult, notably also influencing remote areas of motor cortex during early stages of stroke, is suggestive of a unique vulnerability in the motor system.
Composition of the channelrhodopsin-2 evoked cortical, spinal, and muscular responses
B6.Cg-Tg(Thy1-COP4/EYFP)18Gfng/Jmice express ChR2 predominantly in layer 5 pyramidal neurons. Photoactivation of ChR2 leads to opening of cation channels triggering action potentials (Nagel et al., 2003; Boyden et al., 2005). ChR2-evoked EEG responses may in part reflect action potentials; being depressed after application of TTX and are relatively insensitive to glutamate receptor antagonists (Chen et al., 2012). We treat the initial ChR2-evoked EEG response as a measure of neuronal excitability that reflects a combination of action potentials, photocurrent, from the initial 600–900 μm diameter area of activation (Ayling et al., 2009) and potentially widespread synaptic activity (Lim et al., 2012). EEG activity persisted after the initial ChR2-evoked response, typically lasting for 500 ms, and may represent photocurrent-triggered cortical synaptic activity.
Photostimulation of layer 5 neurons can evoke motor responses (Ayling et al., 2009; Hira et al., 2009) and blocking intracortical glutamatergic synaptic transmission does not significantly affect gross motor output (Ayling et al., 2009). Within the scope of our stimulation parameters, motor output is likely largely independent of intracortical synaptic activity. Stroke-induced deficits in motor output appear to be related to attenuation of corticofugal efferent neuronal signals. This contrasts sensory responses, whose vulnerability to stroke could be due to their dependence on local synaptic function (Mohajerani et al., 2011; Shih et al., 2013). The corticospinal tract is the major corticofugal projection of motor cortex in rodents; with descending axons running primarily within the dorsal columns of the spinal cord (Lemon, 2008). We recorded a local field from the dorsal column of the spinal cord to delineate a motor signal representing successfully generated and propagated action potentials originating from motor cortex. Contrasting measures of neuronal, spinal, and muscular activity facilitates differential study of the effect of stroke on the electrical viability of neurons, their effectiveness in generating and disseminating efferent signals, and their transmission to target muscles.
Neuronal excitability is less affected than spinal potentials and motor output after stroke
Preservation of neuronal excitability is vital for stroke recovery (Clarkson and Carmichael, 2009; Carmichael, 2012). Neurons that surround the irreversibly damaged infarct core (Lo, 2008) can maintain their excitability (Symon et al., 1977; Astrup et al., 1981; Hossmann, 1994) and are the medium of functional remapping (Murphy and Corbett, 2009). Neurons within hypoperfused tissue can have intact membrane potentials while being unable to fire sensation-evoked action potentials (Astrup et al., 1977). By directly depolarizing neurons with photoactivation of ChR2, we revealed that neurons in motor areas subjected to ministrokes are still excitable by averaged EEG yet fail to produce muscle excitation. Our results suggest that cortical excitability may not always be a good predictor of the effects detected within target muscles.
Previous work mapping the spatial relationship between ministroke induced changes in cortical microcirculation and deficits in sensation-evoked responses highlighted the vulnerability of cortical processing (Zhang and Murphy, 2007). Deficits within sensory responses are likely due to depression of local synaptic transmission (Hershkowitz et al., 1993; Rosen and Morris, 1993; Shih et al., 2013), potentially overshadowing other deficits such as impaired axonal conduction (Bolay and Dalkara, 1998) which is pertinent to efferent motor processes. By directly depolarizing neurons through photoactivation of ChR2, we revealed that synaptically silent neurons in sensory-motor areas are excitable, but display a deficit in transmitting motor output to muscles. We also demonstrate a deficit in ChR2-evoked delayed cortical responses (500 ms after photostimulation) as observed with EEG (Fig. 4C). This may represent a deficit in cortical processing dependent on synaptic transmission. Although ischemia induced deficits in synaptic transmission are considered to be detrimental (Hofmeijer and van Putten, 2012), the synaptic terminals required to make motor maps (Ayling et al., 2009) are remote from the sites of cortical ischemia (Lemon, 2008). This suggests vulnerability of processes in addition to cortical synaptic transmission may be responsible for the observed depression of motor maps (Fig. 3) which previous work suggests are evoked largely independently from local synaptic transmission (Ayling et al., 2009). Preservation of ChR2-evoked EEG cortical responses after stroke suggests that cortical neurons have a hyperpolarized membrane potential (Chen et al., 2012). Attenuation of cortically evoked spinal responses was observed (Fig. 6D,E) despite the maintenance of cortical excitability. The profound suppression of EMGs in response to ministrokes may be the result of signal propagation failure within projection axons that may be vulnerable to ischemia (Nukada and Dyck, 1987; Enright et al., 2007; Schafer et al., 2009), This supports the notion that deficits in transmission upstream from synaptic terminals (Hofmeijer and Van Putten, 2012) may be key contributors to forms of ischemic damage (Hinman et al., 2013).
Only relatively minor deficits in ChR2-evoked EEG responses were detected in this ministroke model (Fig. 5B). We caution that the observation of maintained cortical excitability (evoked by photostimulation of ChR2) may not directly reflect action potential propagation in layer 5 neurons. Our recordings within brain and spinal cord are consistent with maintenance of cortical excitability and progressive failure within descending spinal circuits; however, this approach does not cellular resolution to directly assess this. A reduction in basal excitatory synaptic transmission onto inhibitory cells can indirectly increase neuronal excitability (Khazipov et al., 1995). Alternatively, increased inhibition after stroke may be contributing to deficits in motor output (Clarkson et al., 2010), perhaps being responsible for altered motor excitation thresholds (Bolay et al., 2000). These scenarios can lead to selective deficits in motor function, but may not necessarily be reflected in overall excitability (Capaday, 2004; Clarkson et al., 2010). It is likely that several factors contributed to the observed functional deficit. This may reflect a stroke-induced “stunned brain state” (Hinman et al., 2013) where inhibitory and excitatory connections undergo different levels of dysfunction (Wang, 2003). Following focal ministroke, we use ChR2 to directly stimulate cortex and observe preserved cortical EEG activity, but significantly greater depression of motor output. These findings suggest caution when using measures of cortical activity as predictors of functional outcome following stroke.
The integrity of ChR2-evoked EEG responses in the presence of a significant deficit in spinal, and muscular responses demonstrates a deficit in serial processing that occurs downstream of the induced photocurrent. There is a nonlinear relationship between intensity of excitation delivered to motor cortex and muscle activation; thus, small changes in cortical excitability can have large effects on motor output when gated by spinal circuitry (Devanne et al., 1997). Although this may be beneficial for motor control, here we report the severe consequence of a minor alteration in cortical excitability on descending spinal potentials and motor output (Fig. 7).
Figure 7.

Summary diagram showing selective breakdown of poststroke motor cortex output. A, Neurons within motor cortex project along the dorsal column of the spinal cord and synapse ventrally eventually reaching a lower motor neuron and the musculature. B, Effects of ministroke on motor output. The stroke core is represented with black shading with hypoperfused tissue in gray. These neurons are still excitable (when measured with the ChR2-evoked averaged EEG response); however, there is a cumulative depression in the motor signal, with an attenuated signal in the spinal cord and a severe depression in motor output as detected in the muscle. These motor deficits were detectable when stimulation was targeted to cortical areas over a millimeter away from the stroke core, whereas depressed neuronal excitability was only detected at the stroke core.
Focal stroke imparts remote and differential effects on neuronal, spinal, and muscular excitability within the initial hours after stroke. How the integrity of these responses evolves as cell death and cortical rewiring progresses over weeks following stroke is an active area of research (Kleim et al., 2002; Teskey et al., 2003; Benowitz and Carmichael, 2010; Dancause and Nudo, 2011). Motor function can recover over 6–8 weeks from ischemia targeted to areas of similar or larger size as studied here in mouse motor cortex (Harrison et al., 2013). Part of this resilience may be due to effects outlined here, where cortical excitability is relatively preserved, facilitating plasticity. Interestingly, recent work suggests strategies for restoring function based on prosthetic stimulation of surviving cortical areas after focal injury (Guggenmos et al., 2013).
Footnotes
This work was supported by a Canadian Institutes of Health Research (CIHR) Operating Grant MOP-11009, a Heart and Stroke Foundation of BC and Yukon grant in aid, and a Heart and Stroke Foundation of Canada grant in aid. P.A. is supported by a CIHR Postdoctoral Fellowship. We thank Jeffrey Ledue for technical support, and Cindy Jiang and Pumin Wang for their assistance with surgery and animal husbandry.
The authors declare no competing financial interests.
References
- Alaverdashvili M, Whishaw IQ. Compensation aids skilled reaching in aging and in recovery from forelimb motor cortex stroke in the rat. Neuroscience. 2010;167:21–30. doi: 10.1016/j.neuroscience.2010.02.001. [DOI] [PubMed] [Google Scholar]
- Anderson CT, Sheets PL, Kiritani T, Shepherd GM. Sublayer-specific microcircuits of corticospinal and corticostriatal neurons in motor cortex. Nat Neurosci. 2010;13:739–744. doi: 10.1038/nn.2538. [DOI] [PMC free article] [PubMed] [Google Scholar]
- Arenkiel BR, Peca J, Davison IG, Feliciano C, Deisseroth K, Augustine GJ, Feng G. In vivo light-induced activation of neural circuitry in transgenic mice expressing channelrhodopsin-2. Neuron. 2007;54:205–218. doi: 10.1016/j.neuron.2007.03.005. [DOI] [PMC free article] [PubMed] [Google Scholar]
- Astrup J, Symon L, Branston NM, Lassen NA. Cortical evoked potential and extracellular K+ and H+ at critical levels of brain ischemia. Stroke. 1977;8:51–57. doi: 10.1161/01.STR.8.1.51. [DOI] [PubMed] [Google Scholar]
- Astrup J, Siesjö BK, Symon L. Thresholds in cerebral ischemia-the ischemic penumbra. Stroke. 1981;12:723–725. doi: 10.1161/01.STR.12.6.723. [DOI] [PubMed] [Google Scholar]
- Ayling OGS, Harrison TC, Boyd JD, Goroshkov A, Murphy TH. Automated light-based mapping of motor cortex by photoactivation of channelrhodopsin-2 transgenic mice. Nat Methods. 2009;6:219–224. doi: 10.1038/nmeth.1303. [DOI] [PubMed] [Google Scholar]
- Baron JC. Perfusion thresholds in human cerebral ischemia: historical perspective and therapeutic implications. Cerebrovasc Dis. 2001;11:2–8. doi: 10.1159/000049119. [DOI] [PubMed] [Google Scholar]
- Baron JC, Marchal G. Ischemic core and penumbra in human stroke. Stroke. 1999;30:1150–1153. doi: 10.1161/01.STR.30.5.1150. [DOI] [PubMed] [Google Scholar]
- Benowitz LI, Carmichael ST. Promoting axonal rewiring to improve outcome after stroke. Neurobiol Dis. 2010;37:259–266. doi: 10.1016/j.nbd.2009.11.009. [DOI] [PMC free article] [PubMed] [Google Scholar]
- Blinder P, Tsai PS, Kaufhold JP, Knutsen PM, Suhl H, Kleinfeld D. The cortical angiome: an interconnected vascular network with noncolumnar patterns of blood flow. Nat Neurosci. 2013;16:889–897. doi: 10.1038/nn.3426. [DOI] [PMC free article] [PubMed] [Google Scholar]
- Bolay H, Dalkara T. Mechanisms of motor dysfunction after transient MCA occlusion: persistent transmission failure in cortical synapses is a major determinant. Stroke. 1998;29:1988–1993. doi: 10.1161/01.STR.29.9.1988. discussion 1994. [DOI] [PubMed] [Google Scholar]
- Bolay H, Gürsoy-Ozdemir Y, Unal I, Dalkara T. Altered mechanisms of motor-evoked potential generation after transient focal cerebral ischemia in the rat: implications for transcranial magnetic stimulation. Brain Res. 2000;873:26–33. doi: 10.1016/S0006-8993(00)02466-5. [DOI] [PubMed] [Google Scholar]
- Boyden ES, Zhang F, Bamberg E, Nagel G, Deisseroth K. Millisecond-timescale, genetically targeted optical control of neural activity. Nat Neurosci. 2005;8:1263–1268. doi: 10.1038/nn1525. [DOI] [PubMed] [Google Scholar]
- Buchkremer-Ratzmann I, August M, Hagemann G, Witte OW. Electrophysiological transcortical diaschisis after cortical photothrombosis in rat brain. Stroke. 1996;27:1105–1111. doi: 10.1161/01.STR.27.6.1105. [DOI] [PubMed] [Google Scholar]
- Bütefisch CM, Netz J, Wessling M, Seitz RJ, Hömberg V. Remote changes in cortical excitability after stroke. Brain. 2003;126:470–481. doi: 10.1093/brain/awg044. [DOI] [PubMed] [Google Scholar]
- Capaday C. The integrated nat of motor cortical function. Neuroscientist. 2004;10:207–220. doi: 10.1177/107385403262109. [DOI] [PubMed] [Google Scholar]
- Carmichael ST. Brain excitability in stroke: the yin and yang of stroke progression. Arch Neurol. 2012;69:161–167. doi: 10.1001/archneurol.2011.1175. [DOI] [PMC free article] [PubMed] [Google Scholar]
- Carter AR, Shulman GL, Corbetta M. Why use a connectivity-based approach to study stroke and recovery of function? Neuroimage. 2012a;62:2271–2280. doi: 10.1016/j.neuroimage.2012.02.070. [DOI] [PMC free article] [PubMed] [Google Scholar]
- Carter AR, Patel KR, Astafiev SV, Snyder AZ, Rengachary J, Strube MJ, Pope A, Shimony JS, Lang CE, Shulman GL, Corbetta M. Upstream dysfunction of somatomotor functional connectivity after corticospinal damage in stroke. Neurorehabil Neural Repair. 2012b;26:7–19. doi: 10.1177/1545968311411054. [DOI] [PMC free article] [PubMed] [Google Scholar]
- Castro-Alamancos MA, Borrel J. Functional recovery of forelimb response capacity after forelimb primary motor cortex damage in the rat is due to the reorganization of adjacent areas of cortex. Neuroscience. 1995;68:793–805. doi: 10.1016/0306-4522(95)00178-L. [DOI] [PubMed] [Google Scholar]
- Cheng H, Luo Q, Wang Z, Gong H, Chen S, Liang W, Zeng S. Efficient characterization of regional mesenteric blood flow by use of laser speckle imaging. Appl Opt. 2003;42:5759–5764. doi: 10.1364/AO.42.005759. [DOI] [PubMed] [Google Scholar]
- Chen S, Mohajerani MH, Xie Y, Murphy TH. Optogenetic analysis of neuronal excitability during global ischemia reveals selective deficits in sensory processing following reperfusion in mouse cortex. J Neurosci. 2012;32:13510–13519. doi: 10.1523/JNEUROSCI.1439-12.2012. [DOI] [PMC free article] [PubMed] [Google Scholar]
- Clarkson AN, Carmichael ST. Cortical excitability and post-stroke recovery. Biochem Soc Trans. 2009;37:1412–1414. doi: 10.1042/BST0371412. [DOI] [PubMed] [Google Scholar]
- Clarkson AN, Huang BS, Macisaac SE, Mody I, Carmichael ST. Reducing excessive GABA-mediated tonic inhibition promotes functional recovery after stroke. Nature. 2010;468:305–309. doi: 10.1038/nature09511. [DOI] [PMC free article] [PubMed] [Google Scholar]
- Cook DJ, Teves L, Tymianski M. Treatment of stroke with a PSD-95 inhibitor in the gyrencephalic primate brain. Nature. 2012;483:213–217. doi: 10.1038/nature10841. [DOI] [PubMed] [Google Scholar]
- Cramer SC, Shah R, Juranek J, Crafton KR, Le V. Activity in the peri-infarct rim in relation to recovery from stroke. Stroke. 2006;37:111–115. doi: 10.1161/01.STR.0000195135.70379.1f. [DOI] [PubMed] [Google Scholar]
- Dancause N, Nudo RJ. Shaping plasticity to enhance recovery after injury. Prog Brain Res. 2011;192:273–295. doi: 10.1016/B978-0-444-53355-5.00015-4. [DOI] [PMC free article] [PubMed] [Google Scholar]
- Devanne H, Lavoie BA, Capaday C. Input-output properties and gain changes in the human corticospinal pathway. Exp Brain Res. 1997;114:329–338. doi: 10.1007/pl00005641. [DOI] [PubMed] [Google Scholar]
- Dunn AK, Bolay H, Moskowitz MA, Boas DA. Dynamic imaging of cerebral blood flow using laser speckle. J Cereb Blood Flow Metab. 2001;21:195–201. doi: 10.1097/00004647-200103000-00002. [DOI] [PubMed] [Google Scholar]
- Enright LE, Zhang S, Murphy TH. Fine mapping of the spatial relationship between acute ischemia and dendritic structure indicates selective vulnerability of layer V neuron dendritic tufts within single neurons in vivo. J Cereb Blood Flow Metab. 2007;27:1185–1200. doi: 10.1038/sj.jcbfm.9600428. [DOI] [PubMed] [Google Scholar]
- Guggenmos DJ, Azin M, Barbay S, Mahnken JD, Dunham C, Mohseni P, Nudo RJ. Restoration of function after brain damage using a neural prosthesis. Proc Natl Acad Sci U S A. 2013;110:21177–21182. doi: 10.1073/pnas.1316885110. [DOI] [PMC free article] [PubMed] [Google Scholar]
- Harrison TC, Sigler A, Murphy T. Simple and cost-effective hardware and software for functional brain mapping using intrinsic optical signal imaging. J Neurosci Methods. 2009;182:211–218. doi: 10.1016/j.jneumeth.2009.06.021. [DOI] [PubMed] [Google Scholar]
- Harrison TC, Silasi G, Boyd JD, Murphy TH. Displacement of sensory maps and disorganization of motor cortex after targeted stroke in mice. Stroke. 2013;44:2300–2306. doi: 10.1161/STROKEAHA.113.001272. [DOI] [PubMed] [Google Scholar]
- Heiss WD. Ischemic penumbra: evidence from functional imaging in man. J Cereb Blood Flow Metab. 2000;20:1276–1293. doi: 10.1097/00004647-200009000-00002. [DOI] [PubMed] [Google Scholar]
- Hershkowitz N, Katchman AN, Veregge S. Site of synaptic depression during hypoxia: a patch-clamp analysis. J Neurophysiol. 1993;69:432–441. doi: 10.1152/jn.1993.69.2.432. [DOI] [PubMed] [Google Scholar]
- Hill MD, Martin RH, Mikulis D, Wong JH, Silver FL, Terbrugge KG, Milot G, Clark WM, Macdonald RL, Kelly ME, Boulton M, Fleetwood I, McDougall C, Gunnarsson T, Chow M, Lum C, Dodd R, Poublanc J, Krings T, Demchuk AM, et al. Safety and efficacy of NA-1 in patients with iatrogenic stroke after endovascular aneurysm repair (ENACT): a phase 2, randomised, double-blind, placebo-controlled trial. Lancet Neurol. 2012;11:942–950. doi: 10.1016/S1474-4422(12)70225-9. [DOI] [PubMed] [Google Scholar]
- Hinman JD, Rasband MN, Carmichael ST. Remodeling of the axon initial segment after focal cortical and white matter stroke. Stroke. 2013;44:182–189. doi: 10.1161/STROKEAHA.112.668749. [DOI] [PMC free article] [PubMed] [Google Scholar]
- Hira R, Honkura N, Noguchi J, Maruyama Y, Augustine GJ, Kasai H, Matsuzaki M. Transcranial optogenetic stimulation for functional mapping of the motor cortex. J Neurosci Methods. 2009;179:258–263. doi: 10.1016/j.jneumeth.2009.02.001. [DOI] [PubMed] [Google Scholar]
- Hofmeijer J, van Putten MJ. Ischemic cerebral damage: an appraisal of synaptic failure. Stroke. 2012;43:607–615. doi: 10.1161/STROKEAHA.111.632943. [DOI] [PubMed] [Google Scholar]
- Horner CH, Davies HA, Stewart MG. Hippocampal synaptic density and glutamate immunoreactivity following transient cerebral ischaemia in the chick. Eur J Neurosci. 1998;10:3913–3917. doi: 10.1046/j.1460-9568.1998.00435.x. [DOI] [PubMed] [Google Scholar]
- Hossmann KA. Cortical steady potential, impedance and excitability changes during and after total ischemia of cat brain. Exp Neurol. 1971;32:163–175. doi: 10.1016/0014-4886(71)90060-4. [DOI] [PubMed] [Google Scholar]
- Hossmann KA. Viability thresholds and the penumbra of focal ischemia. Ann Neurol. 1994;36:557–565. doi: 10.1002/ana.410360404. [DOI] [PubMed] [Google Scholar]
- Johansen FF, Jørgensen MB, Ekström von Lubitz DK, Diemer NH. Selective dendrite damage in hippocampal CA1 stratum radiatum with unchanged axon ultrastructure and glutamate uptake after transient cerebral ischaemia in the rat. Brain Res. 1984;291:373–377. doi: 10.1016/0006-8993(84)91272-1. [DOI] [PubMed] [Google Scholar]
- Kerr AL, Cheng SY, Jones TA. Experience-dependent neural plasticity in the adult damaged brain. J Commun Disord. 2011;44:538–548. doi: 10.1016/j.jcomdis.2011.04.011. [DOI] [PMC free article] [PubMed] [Google Scholar]
- Khazipov R, Congar P, Ben-Ari Y. Hippocampal CA1 lacunosum-moleculare interneurons: comparison of effects of anoxia on excitatory and inhibitory postsynaptic currents. J Neurophysiol. 1995;74:2138–2149. doi: 10.1152/jn.1995.74.5.2138. [DOI] [PubMed] [Google Scholar]
- Kleim JA, Barbay S, Nudo RJ. Functional reorganization of the rat motor cortex following motor skill learning. J Neurophysiol. 1998;80:3321–3325. doi: 10.1152/jn.1998.80.6.3321. [DOI] [PubMed] [Google Scholar]
- Kleim JA, Barbay S, Cooper NR, Hogg TM, Reidel CN, Remple MS, Nudo RJ. Motor learning-dependent synaptogenesis is localized to functionally reorganized motor cortex. Neurobiol Learn Mem. 2002;77:63–77. doi: 10.1006/nlme.2000.4004. [DOI] [PubMed] [Google Scholar]
- Lashley KS. Mass action in cerebral function. Science. 1931;73:245–254. doi: 10.1126/science.73.1888.245. [DOI] [PubMed] [Google Scholar]
- Lemon RN. Descending pathways in motor control. Ann Rev Neurosci. 2008;31:195–218. doi: 10.1146/annurev.neuro.31.060407.125547. [DOI] [PubMed] [Google Scholar]
- Levin MF, Kleim JA, Wolf SL. What do motor “recovery” and “compensation” mean in patients following stroke? Neurorehabil Neural Repair. 2009;23:313–319. doi: 10.1177/1545968308328727. [DOI] [PubMed] [Google Scholar]
- Lo EH. A new penumbra: transitioning from injury into repair after stroke. Nat Med. 2008;14:497–500. doi: 10.1038/nm1735. [DOI] [PubMed] [Google Scholar]
- Lim DH, Mohajerani MH, Ledue J, Boyd J, Chen S, Murphy TH. In vivo large-scale cortical mapping using channelrhodopsin-2 stimulation in transgenic mice reveals asymmetric and reciprocal relationships between cortical areas. Front Neural Circuits. 2012;6:11. doi: 10.3389/fncir.2012.00011. [DOI] [PMC free article] [PubMed] [Google Scholar]
- Mohajerani MH, Aminoltejari K, Murphy TH. Targeted mini-strokes produce changes in interhemispheric sensory signal processing that are indicative of disinhibition within minutes. Proc Natl Acad Sci U S A. 2011;108:E183–191. doi: 10.1073/pnas.1101914108. [DOI] [PMC free article] [PubMed] [Google Scholar]
- Moon SK, Alaverdashvili M, Cross AR, Whishaw IQ. Both compensation and recovery of skilled reaching following small photothrombotic stroke to motor cortex in the rat. Exp Neurol. 2009;218:145–153. doi: 10.1016/j.expneurol.2009.04.021. [DOI] [PubMed] [Google Scholar]
- Murphy TH. Imaging in neuroscience: a laboratory manual. New York: Cold Spring Harbor; 2011. Two-photon imaging of neuronal structual plasticity in mice during and after ischemia; pp. 949–960. [DOI] [PubMed] [Google Scholar]
- Murphy TH, Corbett D. Plasticity during stroke recovery: from synapse to behaviour. Nat Rev Neurosci. 2009;10:861–872. doi: 10.1038/nrn2735. [DOI] [PubMed] [Google Scholar]
- Nagel G, Szellas T, Huhn W, Kateriya S, Adeishvili N, Berthold P, Ollig D, Hegemann P, Bamberg E. Channelrhodopsin-2, a directly light-gated cation-selective membrane channel. Proc Natl Acad Sci U S A. 2003;100:13940–13945. doi: 10.1073/pnas.1936192100. [DOI] [PMC free article] [PubMed] [Google Scholar]
- Nudo RJ. Mechanisms for recovery of motor function following cortical damage. Curr Opin Neurobiol. 2006;16:638–644. doi: 10.1016/j.conb.2006.10.004. [DOI] [PubMed] [Google Scholar]
- Nudo RJ, Milliken GW, Jenkins WM, Merzenich MM. Use-dependent alterations of movement representations in primary motor cortex of adult squirrel monkeys. J Neurosci. 1996a;16:785–807. doi: 10.1523/JNEUROSCI.16-02-00785.1996. [DOI] [PMC free article] [PubMed] [Google Scholar]
- Nudo RJ, Wise BM, SiFuentes F, Milliken GW. Neural substrates for the effects of rehabilitative training on motor recovery after ischemic infarct. Science. 1996b;272:1791–1794. doi: 10.1126/science.272.5269.1791. [DOI] [PubMed] [Google Scholar]
- Nudo RJ, Plautz EJ, Frost SB. Role of adaptive plasticity in recovery of function after damage to motor cortex. Muscle Nerve. 2001;24:1000–1019. doi: 10.1002/mus.1104. [DOI] [PubMed] [Google Scholar]
- Nukada H, Dyck PJ. Acute ischemia causes axonal stasis, swelling, attenuation, and secondary demyelination. Ann Neurol. 1987;22:311–318. doi: 10.1002/ana.410220306. [DOI] [PubMed] [Google Scholar]
- Ohtsubo J, Asakura T. Velocity measurement of a diffuse object by using time-varying speckles. Opt Quant Elect. 1976;8:523–529. doi: 10.1007/BF00620143. [DOI] [Google Scholar]
- Risher WC, Ard D, Yuan J, Kirov SA. Recurrent spontaneous spreading depolarizations facilitate acute dendritic injury in the ischemic penumbra. J Neurosci. 2010;30:9859–9868. doi: 10.1523/JNEUROSCI.1917-10.2010. [DOI] [PMC free article] [PubMed] [Google Scholar]
- Rosen AS, Morris ME. Anoxic depression of excitatory and inhibitory postsynaptic potentials in rat neocortical slices. J Neurophysiol. 1993;69:109–117. doi: 10.1152/jn.1993.69.1.109. [DOI] [PubMed] [Google Scholar]
- Schafer DP, Jha S, Liu F, Akella T, McCullough LD, Rasband MN. Disruption of the axon initial segment cytoskeleton is a new mechanism for neuronal injury. J Neurosci. 2009;29:13242–13254. doi: 10.1523/JNEUROSCI.3376-09.2009. [DOI] [PMC free article] [PubMed] [Google Scholar]
- Schaffer CB, Friedman B, Nishimura N, Schroeder LF, Tsai PS, Ebner FF, Lyden PD, Kleinfeld D. Two-photon imaging of cortical surface microvessels reveals a robust redistribution in blood flow after vascular occlusion. PLoS Biol. 2006;4:e22. doi: 10.1371/journal.pbio.0040022. [DOI] [PMC free article] [PubMed] [Google Scholar]
- Schmidt S, Bruehl C, Frahm C, Redecker C, Witte OW. Age dependence of excitatory-inhibitory balance following stroke. Neurobiol Aging. 2012;33:1356–1363. doi: 10.1016/j.neurobiolaging.2010.11.019. [DOI] [PubMed] [Google Scholar]
- Shih AY, Blinder P, Tsai PS, Friedman B, Stanley G, Lyden PD, Kleinfeld D. The smallest stroke: occlusion of one penetrating vessel leads to infarction and a cognitive deficit. Nat Neurosci. 2013;16:55–63. doi: 10.1038/nn.3278. [DOI] [PMC free article] [PubMed] [Google Scholar]
- Sigler A, Goroshkov A, Murphy TH. Hardware and methodology for targeting single brain arterioles for photothrombotic stroke on an upright microscope. J Neurosci Methods. 2008;170:35–44. doi: 10.1016/j.jneumeth.2007.12.015. [DOI] [PubMed] [Google Scholar]
- Sigler A, Mohajerani MH, Murphy TH. Imaging rapid redistribution of sensory-evoked depolarization through existing cortical pathways after targeted stroke in mice. Proc Natl Acad Sci U S A. 2009;106:11759–11764. doi: 10.1073/pnas.0812695106. [DOI] [PMC free article] [PubMed] [Google Scholar]
- Symon L, Branston NM, Strong AJ, Hope TD. The concepts of thresholds of ischaemia in relation to brain structure and function. J Clin Pathol Suppl. 1977;11:149–154. doi: 10.1136/jcp.s3-11.1.149. [DOI] [PMC free article] [PubMed] [Google Scholar]
- Tennant KA, Adkins DL, Donlan NA, Asay AL, Thomas N, Kleim JA, Jones TA. The organization of the forelimb representation of the C57BL/6 mouse motor cortex as defined by intracortical microstimulation and cytoarchitecture. Cereb Cortex. 2011;21:865–876. doi: 10.1093/cercor/bhq159. [DOI] [PMC free article] [PubMed] [Google Scholar]
- Tennant KA, Adkins DL, Scalco MD, Donlan NA, Asay AL, Thomas N, Kleim JA, Jones TA. Skill learning induced plasticity of motor cortical representations is time and age-dependent. Neurobiol Learn Mem. 2012;98:291–302. doi: 10.1016/j.nlm.2012.09.004. [DOI] [PMC free article] [PubMed] [Google Scholar]
- Teskey GC, Flynn C, Goertzen CD, Monfils MH, Young NA. Cortical stimulation improves skilled forelimb use following a focal ischemic infarct in the rat. Neurol Res. 2003;25:794–800. doi: 10.1179/016164103771953871. [DOI] [PubMed] [Google Scholar]
- Wang JH. Short-term cerebral ischemia causes the dysfunction of interneurons and more excitation of pyramidal neurons in rats. Brain Res Bull. 2003;60:53–58. doi: 10.1016/S0361-9230(03)00026-1. [DOI] [PubMed] [Google Scholar]
- Watson BD, Dietrich WD, Busto R, Wachtel MS, Ginsberg MD. Induction of reproducible brain infarction by photochemically initiated thrombosis. Ann Neurol. 1985;17:497–504. doi: 10.1002/ana.410170513. [DOI] [PubMed] [Google Scholar]
- Xie Y, Chen S, Murphy T. Dendritic spines and pre-synaptic boutons are stable despite local deep hypothermic challenge and re-warming in vivo. PloS one. 2012;7:e36305. doi: 10.1371/journal.pone.0036305. [DOI] [PMC free article] [PubMed] [Google Scholar]
- Xie Y, Chen S, Anenberg E, Murphy TH. Resistance of optogenetically evoked motor function to global ischemia and reperfusion in mouse in vivo. J Cereb Blood Flow Metab. 2013;33:1148–1152. doi: 10.1038/jcbfm.2013.89. [DOI] [PMC free article] [PubMed] [Google Scholar]
- Xiong W, Jin X. Optogenetic field potential recording in cortical slices. J Neurosci Methods. 2012;210:119–124. doi: 10.1016/j.jneumeth.2012.07.019. [DOI] [PMC free article] [PubMed] [Google Scholar]
- Zhang S, Boyd J, Delaney K, Murphy TH. Rapid reversible changes in dendritic spine structure in vivo gated by the degree of ischemia. J Neurosci. 2005;25:5333–5338. doi: 10.1523/JNEUROSCI.1085-05.2005. [DOI] [PMC free article] [PubMed] [Google Scholar]
- Zhang S, Murphy TH. Imaging the impact of cortical microcirculation on synaptic structure and sensory-evoked hemodynamic responses in vivo. PLoS Biol. 2007;5:e119. doi: 10.1371/journal.pbio.0050119. [DOI] [PMC free article] [PubMed] [Google Scholar]
- Zhao G, Flavin MP. Differential sensitivity of rat hippocampal and cortical astrocytes to oxygen-glucose deprivation injury. Neurosci Lett. 2000;285:177–180. doi: 10.1016/S0304-3940(00)01056-9. [DOI] [PubMed] [Google Scholar]