

Abstract
How does a single brain region participate in multiple behaviors? Here we argue that two separate interneuron circuits in the primary motor cortex (M1) contribute differently to two varieties of physiological and behavioral plasticity. To test this in human brain noninvasively, we used transcranial magnetic stimulation (TMS) of M1 hand area to activate two independent sets of synaptic inputs to corticospinal neurons by changing the direction of current induced in the brain: posterior-to-anterior current (PA inputs) and anterior-to-posterior current (AP inputs). We demonstrate that excitability changes produced by repetitive activation of AP inputs depend on cerebellar activity and selectively alter model-based motor learning. In contrast, the changes observed with repetitive stimulation of PA inputs are independent of cerebellar activity and specifically modulate model-free motor learning. The findings are highly suggestive that separate circuits in M1 subserve different forms of motor learning.
Keywords: motor cortex, motor learning, plasticity, transcranial magnetic stimulation
Introduction
The primary motor cortex (M1) engages in many types of motor behavior and learning (Graziano and Aflalo, 2007; Kalaska, 2009). Recording and imaging of activity reveal representational (Evarts, 1968; Georgopoulos et al., 1986), dynamical (Shenoy et al., 2013), and learning-related responses in M1 neurons (Komiyama et al., 2010), which may be continuously updated in a context-dependent fashion during behavior and/or learning (Capaday et al., 2011; Graziano, 2011). However, the question is how these multiple functions are organized within the circuitry of M1. In other areas of cortex, different types of inhibitory interneuron are known to have relatively well-characterized physiological and behavioral correlates (Lapray et al., 2012; DeFelipe et al., 2013; Kvitsiani et al., 2013), but far less is known about the role of excitatory interneuron circuits in flexible behavior, particularly in M1. In the present experiments, we hypothesized that different excitatory circuits within M1 underpin distinct motor learning mechanisms. We have used noninvasive methods to examine this in the human brain.
We first sought to isolate the physiology of two classes of synaptic inputs to corticospinal neurons (CSNs) in M1 by means of transcranial magnetic stimulation (TMS), a noninvasive method to stimulate cortical neurons in the intact human brain. Although TMS clearly lacks the focality to stimulate isolated synaptic inputs to CSNs, it is known that activation of the CSN in the M1 hand area is influenced by the direction of the electric current induced in the brain: a TMS-induced electric current that flows from posterior-to-anterior (PA) across the central sulcus preferentially evokes highly synchronized corticospinal (CS) activity, whereas stimulation with current flowing in the opposite direction (anterior-to-posterior [AP]) preferentially evokes less synchronized, and often slightly delayed CS activity (Day et al., 1989; Di Lazzaro et al., 2001): these outputs have been assumed to result from activity in independent circuits that have different synaptic input pathways to CSNs (Di Lazzaro and Ziemann, 2013). We termed these as PA-sensitive circuits (PA input) and AP-sensitive circuits (AP input) in the present study. Although the physiological characteristics of PA and AP inputs have been addressed previously (Di Lazzaro and Ziemann, 2013), there is currently no information regarding their functional relevance. In the first part of this paper, we describe experiments using novel procedures to increase the effectiveness of each of these input pathways to CSNs. In the second part, we show that these interventions have independent effects on two forms of motor learning, as an example of behavioral correlates that are subserved by separate M1 interneuron circuits.
Materials and Methods
Subjects
Fifty-three right-handed healthy human volunteers (23 females; mean age ± SD, 28.0 ± 8.4 years, range 18–50 years) and, in addition, a 68-year-old male patient (see below) participated in the study. None of the subjects had contraindications to TMS (Rossi et al., 2009). Experiments 1–4, 6, and 7 were approved by the ethics committee of, and were performed at, the University College London. Experiment 5 was approved by the ethics committee of, and performed at, the Campus Bio-Medico University of Rome. All participants signed an informed consent form before participating in the experiment. The experiments conformed to the guidelines stated in the Declaration of Helsinki.
EMG recordings
Subjects sat comfortably in a chair with both arms resting on a pillow placed on their lap. Surface EMG electrodes (Ag–AgCl) were placed over the right abductor pollicis brevis (APB) in a belly–tendon montage for recording the MEPs. The signals from the EMG electrodes were amplified (gain, 1000), bandpass filtered (20 Hz-3 kHz), digitized at a frequency of 5 kHz, and stored in a laboratory computer for later offline analysis by Signal software and CED 1401 hardware (Cambridge Electronic Design).
Transcranial magnetic stimulation (TMS)
TMS was delivered from a Magstim 2002 stimulator (Magstim) every 4.5–5.5 s. A figure-of-eight coil (outer winding diameter 70 mm) was held tangentially on the scalp at an angle of 45° to the mid-sagittal plane with the handle pointing laterally and posteriorly (i.e., posterior-to-anterior [PA] current in the brain). For the AP current, the position of the coil handle was reversed around the intersection of coil windings. CS excitability was measured as the peak-to-peak amplitude of motor evoked potential (MEP) generated by single-pulse TMS with PA current. TMS was applied to the M1 representation of the right APB muscle. The motor hotspot was defined as the point where a TMS pulse with PA current of slightly suprathreshold intensity consistently elicited an MEP of the highest amplitude. The resting motor threshold (RMT) with PA current was defined to the nearest 1% of maximum stimulator output (maximum stimulator) as the minimum stimulation intensity over the motor hotspot, required to evoke an MEP of ≥50 μV in 5 of 10 trials during complete relaxation of target muscle (Rossi et al., 2009). The active motor threshold (AMT) with PA (AMTpa), as well as with AP currents in Experiment 4 (AMTap), was defined as the lowest intensity to evoke an MEP of ≥200 μV in more than five of 10 consecutive trials while subjects maintained ∼10% of maximum voluntary contraction (MVC).
Muscle state: rest versus voluntary contraction (VC)
According to the definition of RMT and AMT (Rossi et al., 2009), we termed the condition (i.e., muscle state) where participants keep complete relaxation of target APB muscle as “rest,” whereas the condition where subjects maintained ∼5%-10% of MVC in APB muscle as “VC” (or “active” in Experiment 2, see below) in the following text.
Interventions
Paired associative stimulation at rest (PAS) (standard PAS).
Standard PAS consisted of 180 electrical stimuli of the right median nerve at the wrist paired with a single TMS with PA current over the hotspot of right APB muscle at a rate of 0.2 Hz at rest (Hamada et al., 2012; Kačar et al., 2013). Electrical stimulation (constant current square wave pulses; duration, 0.2 ms; cathode proximal) was applied at an intensity of three times the perceptual threshold using a constant current generator (Digitimer). TMS was applied at an intensity required to elicit a 1 mV MEP at rest without electrical stimulation to the median nerve (SI1 mV). The effects of standard PAS given with an interstimulus interval (ISI) of 21.5 ms (PAS21.5), of 25 ms (PAS25), and of 100 ms (PAS100) between peripheral and TMS stimuli were tested. PAS100 was used for control because previous studies showed no MEP changes after PAS100 (Stefan et al., 2000; Jung and Ziemann, 2009; Kang et al., 2011). Subjects were instructed to look at their stimulated hand and count the peripheral electrical stimuli they perceived to maintain a defined level of attention (Stefan et al., 2004).
In all of 48 subjects in whom we tested responses to both standard PAS21.5 and PAS25, 31 fulfilled the double inclusion criteria (i.e., increase of CS excitability, grand average over all time points after PAS > 1; with PAS21.5 and PAS25). A similar percentage of “responders” has been reported in previous studies (Stefan et al., 2006; Müller-Dahlhaus et al., 2008). Indeed, several investigators have also preselected people who respond to a PAS protocol to investigate the mechanisms or behavioral relevance of PAS (Stefan et al., 2006; Heidegger et al., 2010; Korchounov and Ziemann, 2011). Evidence that PAS effects depend on NMDA receptors was only obtained in PAS responders (Stefan et al., 2002). Preselection also reduces the influence of interindividual variability of PAS (Stinear and Hornby, 2005; Bagnato et al., 2006; Fratello et al., 2006; Müller-Dahlhaus et al., 2008; Voytovych et al., 2012). Finally, we can confine data interpretation to an LTP-like process (i.e., increase in CS excitability) in M1.
We also made a pragmatic decision to use fixed intervals of 21.5 and 25 ms in all participants. Although it could be argued that it may have been better to have adjusted all intervals to the individual N20 latency of the median nerve somatosensory evoked potential, we do not think that not having done so is a critical issue. Excitatory PAS effects have been described at ISIs equal to 21.5 ms, N20, and N20 + 2 ms, or 25 ms and N20 + 5 ms (for review, see Müller-Dahlhaus et al., 2010). Because the usual range of N20 latencies in individuals within the normal range of body heights is from 19.0 to 21.0 ms (Chu, 1986; Sonoo et al., 1996), N20 or N20 + 2 correspond to a range of absolute latencies from 19 to 23 ms, very close to our chosen interval of 21.5 ms. Finally, fixed intervals of 21.5 and 25 ms have been frequently used in previous studies in healthy individuals as well as in neurological disease (Müller-Dahlhaus et al., 2010).
PAS with subthreshold intensity during VC (subthreshold PAS).
We used a modified protocol as described by Kujirai et al. (2006). In brief, the median nerve stimulation at an intensity of three times the perceptual threshold was paired with TMS at an intensity of 95% AMT using either PA or AP current in the brain during VC (i.e., 5% MVC of the right APB) (Kujirai et al., 2006). Fifty pairs of stimuli were delivered at a rate of 0.1 Hz. The ISIs of 21.5 and 25 ms were tested. We therefore termed these interventions as PA-sub-PAS21.5, PA-sub-PAS25, AP-sub-PAS21.5, and AP-sub-PAS25. It is important to note that the orientation selectivity of PA versus AP pulses is optimal at low stimulus intensities during VC and disappears at the higher intensities needed to recruit MEPs at rest because they activate a mixture of all synaptic inputs to CSNs (i.e., PA and AP inputs) (Day et al., 1989; Di Lazzaro et al., 1998a, b; Di Lazzaro et al., 2001; Kujirai et al., 2006). Thus, if we observe an increase of MEPs after subthreshold PAS with an AP current, then the effects are likely to originate from repetitive activation of AP inputs (Kujirai et al., 2006) and vice versa for PA inputs.
Cerebellar transcranial direct current stimulation (cDC).
Anodal cDC (Galea et al., 2009) was applied simultaneously with standard PAS at rest as described previously (Hamada et al., 2012). In brief, cDC was delivered with an intensity of 2 mA using a commercially available DC stimulator (Eldith-Electro-Diagnostic & Therapeutic Systems, distributed by Magstim) through saline-soaked surface sponge electrodes (25 cm2). One electrode was centered 3 cm lateral to the inion over the right lateral cerebellum. The other electrode was positioned on the right buccinator muscle. At the onset of all interventions (anodal and sham), current was increased in a ramp-like manner. In the sham session, anodal cDC was applied for 30 s. At the offset of cDC, the current was decreased in a ramp-like manner.
Repetitive thumb acceleration task (Rep task)
The Rep task was adopted from previous studies (Muellbacher et al., 2002; Rosenkranz et al., 2007; Jung and Ziemann, 2009). Subjects were required to make rapid thumb abduction movements of the right hand paced by a brief 1000 Hz tone at a rate of 0.5 Hz. They continued for 4 min, had a 4 min break to prevent fatigue, and then continued the task for an additional 4 min. Thumb acceleration was measured using a uniaxial accelerometer (Entran) mounted on the distal phalanx of the thumb in the abduction–adduction axis. The raw signal was amplified and digitized (rate, 2 kHz; CED 1401; Cambridge Electronic Design) and fed into the laboratory computer for off-line analysis. Subjects received online visual feedback of acceleration during the task and were continuously encouraged by the experimenter to increase acceleration throughout the training. We quantified the learning effect by measuring the increase the mean peak acceleration (ACC) for each set of 10 consecutive movements.
Visuomotor gain adaptation task (Adapt task)
The Adapt task was adopted from previous studies (Ojakangas and Ebner, 1991, 1994; Butler et al., 2000). Subjects were required to make brisk isometric pincer grip contractions between thumb and index finger of the right hand paced by a brief 1000 Hz tone at a rate of 0.5 ± 0.15 Hz. The subject's force was recorded by a force transducer (P200, Biometrics). The raw signal was amplified, filtered (0.53–250 Hz) and digitized (rate, 2 kHz; CED 1401; Cambridge Electronic Design). The force signal was fed back to the subject on a computer screen. The subject's maximum force was first established, and a target force window was defined as a range between 60% and 70% of the individual maximum force displayed as two horizontal lines on the computer screen (i.e., target was set at 65% of maximum force). The display setting was kept constant throughout the experiment. The experimental protocol consisted of 5 blocks of trials (see Fig. 5). Blocks 1 (Pre1), 2 (Pre2), 4 (Post1), and 5 (Post2) involved 120 trials under veridical conditions (no visual perturbation, gain setting, 1). There was ∼1 min break between blocks. The third block (Adapt) consisted of 240 trials during which a gain (i.e., the relationship between the force output and the feedback signal) was set to 30: the feedback signal moved proportionately larger (i.e., 30-fold larger) than the pincer grip force made by subjects. Performance was quantified in each trial using amplitude error, defined as the log-transformed amplitude of peak force normalized to the target force.
Figure 5.
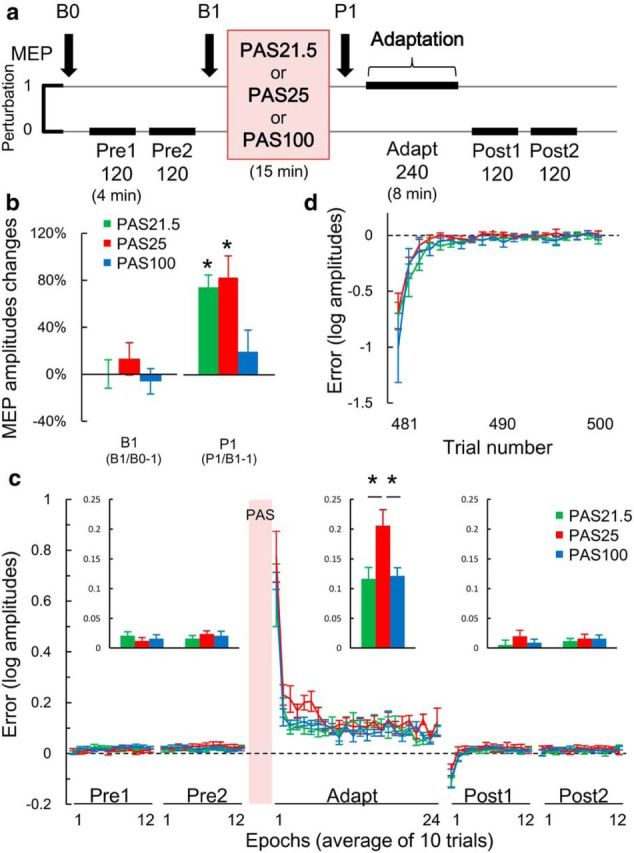
Effects of PAS on model-based learning in a visuomotor gain adaptation task (Adapt task). a, Schematic representation of experiment. The numbers under each block represent the number of trials. Subjects were asked to perform brisk isometric pincer grip contractions with their thumb and index finger. In the third block (Adapt) where the gain was set to 30, the cursor moved proportionally further (i.e., 30-fold larger), and subjects had to reduce their force level to reach the target window (Ojakangas and Ebner, 1994; Butler et al., 2000). Performance was quantified in each trial using amplitude error, defined as the log-transformed amplitude of peak force normalized to the target force. b, Mean ± SEM percentage MEP changes versus baseline (B0). MEPs were unchanged at B1 (left columns: p > 0.3, paired t tests, two-tailed), and increased after PAS21.5 and PAS25, but not after PAS100 (right columns; two-way rmANOVA: interaction PAS × TIME, F(2,14) = 6.007, p = 0.035). **Significant increase of MEP at P1 compared with B1 using absolute MEP amplitude (p < 0.05 with paired t tests, two-tailed). c, Averaged (10 trials per epoch) mean ± SEM error. Histogram inserts represent the mean data over each block, determined for each participant by averaging consecutive epochs (Galea et al., 2011) (see Materials and Methods). The early phase of adaptation was affected by PAS25 but not PAS21.5 compared with PAS100 (two-way rmANOVA: interaction PAS × BLOCK, F(8,56) = 4.162, p = 0.001). *p < 0.05 (Tukey's post hoc tests). No carryover effects were found (Table 8). d, There was no difference in error for each single trial during Post1 among PAS conditions (two-way rmANOVA: PAS, F(2,14) = 0.729, p = 0.499; TRIAL, F(9,63) = 26.203, p < 0.001; PAS × TRIAL, F(18,126) = 0.662, p = 0.842).
Study design
In the first part of this paper (Experiments 1–5), we sought to provide physiological evidence that the effectiveness of two distinct synaptic inputs to CSNs in M1 can be separately increased by standard PAS at two different timings. Our hypothesis was that PA inputs are responsible for standard PAS21.5, whereas AP inputs underlie the response to standard PAS25. In the second part (Experiments 6 and 7), we tested whether and how PAS at these two timings affects two different forms of motor learning.
Table 1 summarizes the PAS parameters in each experiment. All experimental sessions were performed at the same time of day (around 3:00 P.M.). Table 2 summarizes demographic data of participants in each experiment. Some subjects participated in different experiments.
Table 1.
PAS parametersa
| Pairs | IPI (s) | ISI (ms) | Direction | Stimulus intensity | cDC | State | |
|---|---|---|---|---|---|---|---|
| Experiment 1 | |||||||
| Sham-PAS21.5 | 180 | 5 | 21.5 | PA | SI1 mV | Sham | Rest |
| Sham-PAS25 | 180 | 5 | 25 | PA | SI1 mV | Sham | Rest |
| cDC-PAS21.5 | 180 | 5 | 21.5 | PA | SI1 mV | Anodal | Rest |
| cDC-PAS25 | 180 | 5 | 25 | PA | SI1 mV | Anodal | Rest |
| Experiment 3 | |||||||
| PAS21.5 | 180 | 5 | 21.5 | PA | SI1 mV | — | Rest |
| PAS25 | 180 | 5 | 25 | PA | SI1 mV | — | Rest |
| PA-sub-PAS21.5 | 50 | 10 | 21.5 | PA | 95% AMTpa | — | VC |
| PA-sub-PAS25 | 50 | 10 | 25 | PA | 95% AMTpa | — | VC |
| Experiment 4 | |||||||
| PAS21.5 | 180 | 5 | 21.5 | PA | SI1 mV | — | Rest |
| PAS25 | 180 | 5 | 25 | PA | SI1 mV | — | Rest |
| AP-sub-PAS21.5 | 50 | 10 | 21.5 | AP | 95% AMTap | — | VC |
| AP-sub-PAS25 | 50 | 10 | 25 | AP | 95% AMTap | — | VC |
| Experiment 5 | |||||||
| PAS21.5 | 180 | 5 | 21.5 | PA | SI1 mV | — | Rest |
| Experiments 6 and 7 | |||||||
| PAS21.5 | 180 | 5 | 21.5 | PA | SI1 mV | — | Rest |
| PAS25 | 180 | 5 | 25 | PA | SI1 mV | — | Rest |
| PAS100 | 180 | 5 | 100 | PA | SI1 mV | — | Rest |
aDirection, TMS current induced in the brain; IPI, interpair interval; State, state of the target muscle; SI1 mV, stimulus intensity to evoke 1 mV MEP; VC, 5% maximum voluntary contraction.
Table 2.
Demographic data of participants in each experimenta
| No. of subjects | Female | Age (yr) (mean ± SD) | Comments | |
|---|---|---|---|---|
| Experiment 1 | 17 | 7 | 30.3 ± 10.1 | Two subjects participated in Experiment 6 and one in Experiment 7. These 17 subjects were not included in the previous study (Hamada et al., 2012) |
| Experiment 2 | 10 | 4 | 28.4 ± 8.0 | Two subjects participated in Experiments 6 and 7, another two in Experiment 3, and one in Experiment 4 |
| Experiment 3 | 12 | 6 | 30.5 ± 7.2 | Three subjects participated in Experiments 6 and two in Experiment 7 |
| Experiment 4 | 15 | 7 | 25.7 ± 7.3 | Two subjects participated in Experiment 6, two in Experiment 7, and one in Experiment 2 |
| Experiment 5 | 1 | 0 | 68 | |
| Experiment 6 | 10 | 4 | 29.4 ± 9.2 | Two subjects participated in Experiment 1, two in Experiment 2, three in Experiment 3, and two in Experiment 4 |
| Experiment 7 | 9 | 2 | 28.0 ± 8.9 | One subject participated in Experiment 1, two in Experiment 2, two in Experiment 3, and two in Experiment 4 |
aNo subjects participated in other experiment, unless otherwise indicated in the comments.
Experiment 1: concurrent anodal cDC effects on standard PAS.
This experiment was performed to replicate our previous result that concurrent anodal cDC during application of PAS abolished plasticity of standard PAS25, but not PAS21.5 (Hamada et al., 2012). It served to confirm our suggestions that the mechanisms of the standard PAS21.5 and PAS25 aftereffects are not physiologically identical and that PAS25 and PAS21.5 involve plasticity in two separate sets of synapses onto CSNs (Hamada et al., 2012).
We conducted a crossover study, which consisted of four randomly ordered sessions each separated by at least 3 d. We measured CS excitability changes before (baseline) and immediately, 15 and 30 min after interventions (T0, T15, and T30). Interventions were either anodal or sham cDC, which was delivered over the cerebellum for 15 min concurrently with standard PAS21.5 or PAS25 at rest (sham-PAS21.5, sham-PAS25, cDC-PAS21.5, and cDC-PAS25) (Hamada et al., 2012). As a measure of CS excitability, 30 MEPs were recorded with SI1 mV every 4.5–5.5 s with the subject at rest (for mean baseline MEP amplitudes in each experiment, see Table 3). SI1 mV was kept constant throughout the experiment.
Table 3.
Baseline physiological dataa
| RMTpa (%) | RMTap (%) | AMTpa (%) | AMTap (%) | Baseline MEP (mV) | |
|---|---|---|---|---|---|
| Experiment 1 (n = 9) | |||||
| Sham-PAS21.5 | 42.0 ± 2.0 | — | 31.4 ± 1.2 | — | 0.99 ± 0.10 |
| Sham-PAS25 | 42.8 ± 2.4 | — | 32.0 ± 1.3 | — | 0.96 ± 0.10 |
| cDC-PAS21.5 | 41.6 ± 1.9 | — | 31.4 ± 1.3 | — | 0.95 ± 0.09 |
| cDC-PAS25 | 41.4 ± 1.6 | — | 32.0 ± 1.0 | — | 0.95 ± 0.07 |
| Experiment 2 (n = 10) | |||||
| Real (anodal) | 41.3 ± 1.4 | 54.5 ± 1.7 | 32.6 ± 1.7 | 43.9 ± 2.6 | — |
| Sham | 43.0 ± 1.9 | 54.0 ± 1.4 | 33.5 ± 1.7 | 44.6 ± 2.1 | — |
| Experiment 3 (n = 9) | |||||
| PAS21.5 | 42.7 ± 2.7 | — | 32.7 ± 2.1 | — | 0.89 ± 0.08 |
| PAS25 | 44.5 ± 2.9 | — | 33.6 ± 2.2 | — | 0.94 ± 0.11 |
| PA-sub-PAS21.5 | 43.5 ± 2.8 | — | 32.6 ± 2.2 | — | 0.85 ± 0.07 |
| PA-sub-PAS25 | 42.9 ± 2.8 | — | 31.2 ± 2.0 | — | 0.91 ± 0.06 |
| Experiment 4 (n = 9) | |||||
| PAS21.5 | 39.8 ± 1.7 | — | 31.1 ± 1.6 | — | 1.07 ± 0.12 |
| PAS25 | 39.3 ± 1.7 | — | 31.0 ± 1.4 | — | 1.06 ± 0.07 |
| AP-sub-PAS21.5 | 40.6 ± 2.1 | — | 32.2 ± 2.1 | 42.5 ± 2.0 | 1.11 ± 0.10 |
| AP-sub-PAS25 | 39.3 ± 2.0 | — | 30.3 ± 1.8 | 42.1 ± 1.5 | 1.04 ± 0.04 |
| Experiment 6 (n = 10) | |||||
| PAS21.5 | 39.2 ± 2.0 | — | — | — | 1.20 ± 0.13 |
| PAS25 | 38.0 ± 1.8 | — | — | — | 1.09 ± 0.08 |
| PAS100 | 39.7 ± 1.6 | — | — | — | 1.16 ± 0.08 |
| Experiment 7 (n = 8b) | |||||
| PAS21.5 | 40.5 ± 2.3 | — | — | — | 1.10 ± 0.08 |
| PAS25 | 40.0 ± 2.4 | — | — | — | 1.15 ± 0.12 |
| PAS100 | 40.5 ± 2.7 | — | — | — | 1.05 ± 0.11 |
aData are mean ± SEM. Motor thresholds are given in percentage of maximum stimulator output. No differences were found between conditions for a given measure and experiment.
bThe data from one subject were discarded because he did not follow the instructions.
Experiment 2: cDC effects on CS excitability evoked by PA or AP current at rest and during VC.
This experiment was performed to investigate cDC effects on CS excitability in detail, focusing in particular on MEPs during VC that can be evoked by stimulus intensities below RMT. A previous study had found no observable changes in CS excitability tested at rest with PA pulses after cDC (Galea et al., 2009). However, at rest, MEPs result from a mixture of activity in PA and AP inputs, although it is possible to selectively activate PA or AP inputs during VC with the low stimulus intensity around RMT (Day et al., 1989; Di Lazzaro et al., 1998a, b, 2001; Kujirai et al., 2006). To test whether cDC has selective effects on each input, we performed the experiment during VC with low intensity TMS pulses. Given the results of Experiments 3 and 4 below, we predicted that AP inputs, but not PA inputs, would be modulated by anodal cDC. This would explain why cDC abolishes the aftereffect of PAS25 (Hamada et al., 2012): standard PAS25 at rest involves AP inputs (Kujirai et al., 2006; Di Lazzaro et al., 2009), which are modulated by cerebellar activity, whereas standard PAS21.5 at rest involves other (perhaps PA) inputs, which are independent from cerebellar activity.
We conducted a crossover study, which consisted of two randomized ordered sessions, each separated by at least 3 d (anodal and sham cDC), and measured MEP recruitment curves before and during anodal or sham cDC using PA or AP pulses at rest or during VC (i.e., 10% MVC as in the AMT measurements). We termed these conditions as PA rest, AP rest, PA active, and AP active, respectively (see Fig. 1c). Anodal or sham cDC was performed for 25 min, and we waited 5 min after the onset of cDC before making the MEP recruitment curve measurements during cDC. The intensities of the single TMS stimuli were individually expressed relative to each MT at baseline (for threshold values in each experimental session, see Table 3) and 10 MEPs each were recorded at 100%, 120%, 140%, and 160% MT every 4.5–5.5 s. The order of recruitment curve measurements (PA rest, AP rest, PA active, and AP active) was randomized across subjects but kept consistent within subject. For each subject, the MEP peak-to-peak amplitudes were measured on each single trial to calculate the mean amplitude at each stimulus intensity. We also measured the onset latency of MEPs in each condition at baseline as described previously (Hamada et al., 2013) to confirm that AP and PA current were indeed recruiting different inputs to CSNs (Day et al., 1989; Di Lazzaro et al., 1998a, b, 2001; Kujirai et al., 2006). Latencies were measured at 140% RMT at rest and 120% AMT during VC (i.e., active condition) to match the MEP amplitudes (see Fig. 1c). We predicted that MEP latencies should differ during the active condition but not at rest.
Figure 1.
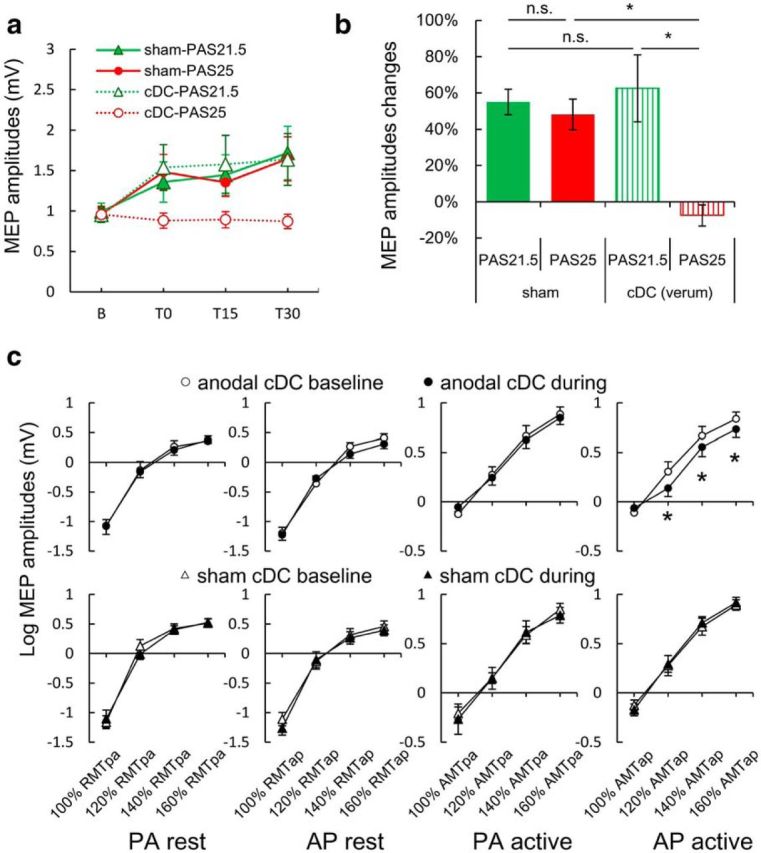
Effects of cerebellar anodal transcranial cDC on standard PAS-induced MEP increase (a, b) and corticospinal excitability (c). a, Mean ± SEM amplitudes of MEPs in the APB muscle before and after standard PAS (T0, T15, and T30). MEPs were significantly increased compared with baseline at T30 by sham-PAS21.5 (green filled triangle), at T0 and T30 by sham-PAS25 (red filled circle), and at T30 by cDC-PAS21.5 (green triangle). In contrast, cDC-PAS25 (red circle) did not result in an MEP increase (Table 5) as reported previously (Hamada et al., 2012). b, Average (over T0, T15, and T30) percentage change in MEP amplitude over baseline in each session. There was no MEP facilitation after cDC-PAS25 (three-way rmANOVA: interaction PAS × cDC, F(1,8) = 13.296, p = 0.007; Table 4). *p < 0.05 (post hoc Turkey's tests). n.s., Not significant. c, Recruitment curves of MEPs to single-pulse TMS of M1 before and during cDC. Top row, Real cDC. Bottom row, Sham cDC. Each column plots data for different coil orientations over M1 (PA or AP) and muscle state (rest or active). Active means weak voluntary contraction of the APB muscle. Real, but not sham, cDC suppressed MEP amplitude evoked by AP pulses during active condition (three-way rmANOVA: interaction cDC × TIME × INTENSITY, F(3,27) = 5.109, p = 0.006; Table 6). *p < 0.05 (post hoc paired t tests, two-tailed). White represents baseline measurements; black represents measurements during cDC. Different MTs were used for each condition (Table 3).
Experiments 3 and 4: comparison of the effects of standard PAS21.5 and PAS25 (PA pulses; suprathreshold TMS at rest) with subthreshold PAS21.5 and PAS25 evoked by PA or AP pulses during VC.
There are two major purposes of these experiments. One is to replicate the study by Kujirai et al. (2006), in which they showed that effects of subthreshold PAS25 require AP, but not PA, current (i.e., AP-sub-PAS25 produced MEP facilitation, whereas PA-sub-PAS25 did not). Another is to test whether the same is true for subthreshold PAS21.5 (i.e., comparison between AP-sub-PAS21.5 vs PA-sub-PAS21.5), which has never been tested so far.
We measured CS excitability at rest before and after PAS interventions. In both experiments, standard PAS21.5 and PAS25 were included to select a “responder” to both protocols. In Experiment 3, we also tested subthreshold PAS at two different timings (21.5 ms vs 25 ms) with PA current during VC (PA-sub-PAS21.5 and PA-sub-PAS25). In Experiment 4, subthreshold PAS21.5 and PAS25 with AP current during VC were tested (AP-sub-PAS21.5 and AP-sub-PAS25) (for the parameters in each protocol, see Table 1). Both Experiments 3 and 4 were a crossover study, which consisted of four randomized ordered sessions, each separated by at least 3 d (Experiment 3, PAS21.5, PAS25, PA-sub-PAS21.5, and PA-sub-PAS25; Experiment 4, PAS21.5, PAS25, AP-sub-PAS21.5, and AP-sub-PAS25). The primary outcome was change in CS excitability measured as in Experiment 1: 30 MEPs were recorded with SI1 mV every 4.5–5.5 s with the subject at rest before (baseline), immediately, 15 and 30 min after intervention (T0, T15, and T30) (for mean baseline MEP amplitudes for each experimental condition, see Table 3), and SI1 mV was kept constant throughout the experiment. Stimulus intensities required to evoke MEPs of ∼1 mV peak to peak amplitudes at rest recruit both AP and PA inputs nonspecifically (Di Lazzaro et al., 1998b, 2001) and can therefore be used to measure the response on either input pathway.
Experiment 5: effects of standard PAS21.5 on CS descending activity.
This experiment was performed to check whether standard PAS21.5 changes CS descending activity as in standard PAS25 (Di Lazzaro et al., 2009). We recorded epidural CS descending activity in a 68-year-old male patient. He had no abnormalities of the CNS at brain and spinal cord level and had an electrode inserted at the high cervical epidural space for control of intractable dorsolumbar pain. The patient was taking neither analgesics nor any other drugs at the time of the experiments. Recordings of descending activity were made 3 d after implantation during the trial screening period when the electrode connections were externalized. Recordings were made simultaneously from the epidural electrode and from the APB. MEPs were recorded with two 9-mm-diameter Ag–AgCl surface electrodes in a belly–tendon montage. MEPs and epidural volleys were amplified and filtered (bandwidth 3 Hz to 3 kHz) by D360 amplifiers (Digitimer). Data were collected on a computer with a sampling rate of 10 kHz per channel and stored for later analysis using a CED 1401 A/D converter and Signal software (Cambridge Electronic Design). TMS was performed with a high-power Magstim 2002 stimulator. A figure-of-eight coil was held over right M1 at the optimal scalp position to elicit MEPs in the contralateral APB with PA current in the brain. To identify the different components of the descending activity, we also performed single-pulse TMS with lateral-medial (LM) induced current in the brain. Using this orientation of the induced current, a direct wave (D-wave) evoked by direct activation of the CS axons is recorded. Before the intervention, we first identified the M1 hotspot of APB and measured D-waves evoked by LM current. We measured 35 MEPs and epidural volleys with PA current at a rate of 0.2 Hz before and 10 min after standard PAS21.5 at rest as in Experiments 1, 3, and 4 (for the details of the PAS parameters, see Table 1).
Experiments 6 and 7: effects of standard PAS21.5 and PAS25 on two forms of motor learning.
The aim of these experiments was to test whether standard PAS21.5 versus PAS25 have distinct effects on two forms of motor learning (model-free vs model-based), as an example of behavioral correlates, which are subserved by separate M1 interneuron circuits. We use adaptation to a change in visuomotor gain (Adapt task) as an example of model-based learning (Ojakangas and Ebner, 1994; Butler et al., 2000). For model-free learning, we examine use-dependent learning in a ballistic acceleration task, which required participants to maximize the initial acceleration of their movement (Rep task) (Muellbacher et al., 2002; Rosenkranz et al., 2007; Jung and Ziemann, 2009). Crucially, visuomotor gain adaptation (model-based) is known to involve both the cerebellum (Krakauer et al., 2005; Shadmehr and Krakauer, 2008) and M1 (Li et al., 2001; Bagce et al., 2013). Indeed, this type of task is accompanied by changes in discharge rate of Purkinje cells during learning (Ojakangas and Ebner, 1994; Butler et al., 2000). In contrast, use-dependent learning (model-free) appears to depend on local M1 networks (Classen et al., 1998; Bütefisch et al., 2000) but not on cerebellum (Li Voti et al., 2014). We hypothesized that standard PAS21.5, but not PAS25, may facilitate model-free learning according to the previous studies (see Discussion) (Jung and Ziemann, 2009; Kang et al., 2011), whereas standard PAS25, but not PAS21.5, may interfere with model-based learning because standard PAS25 as well as AP inputs activity are likely to depend on cerebellar activity (Hamada et al., 2012) (new Experiments 1 and 2).
In this set of experiments, we used standard PAS protocols at rest, not subthreshold PAS during VC, because we reasoned that the higher-intensity TMS pulses would recruit a larger fraction of CS inputs (Di Lazzaro et al., 1998a, b, 2001) and lead to larger behavioral effects. Furthermore, if we had used subthreshold PAS during VC to condition the synaptic inputs to CSNs, we would not have been able to exclude the possibility that any effects were the result of the different stimulus intensities used in the subthreshold PAS during VC (stimulus intensity for AP-sub-PAS was much higher, ∼10% maximum stimulator, than PA-sub-PAS; Table 3). It would not have been possible to reduce the intensity of AP pulses to match that of PA pulses because, at these low intensities (i.e., ∼70% AMTap to match 95% AMTpa), AP pulses do not activate any synaptic inputs to CSNs (Di Lazzaro et al., 1998a, b, 2001). In contrast, using standard PAS with different ISI has the advantage that the only difference is the interval between TMS and median nerve stimulation (Table 1). It is impossible for participants to recognize 3.5 ms interval difference between PAS21.5 and PAS25.
Experiment 6: effects of standard PAS21.5 and PAS25 on Rep task.
We conducted a crossover study, which consisted of three randomized ordered sessions, each separated by at least 2 weeks (PAS21.5, PAS25, and PAS100). In brief, PAS intervention was applied before Rep task (see Fig. 4a) (Jung and Ziemann, 2009; Kang et al., 2011). CS excitability (i.e., 30 MEPs with SI1 mV every 4.5–5.5 s at rest) was measured before (B1) and immediately after intervention (P1). Twenty ACCs were also measured at B1 and P1. After each PAS intervention, subjects performed two sessions of repetitive motor practice (Rep1 and Rep2) with a 4 min break between them, and the peak acceleration during the task was quantified (see data analysis).
Figure 4.
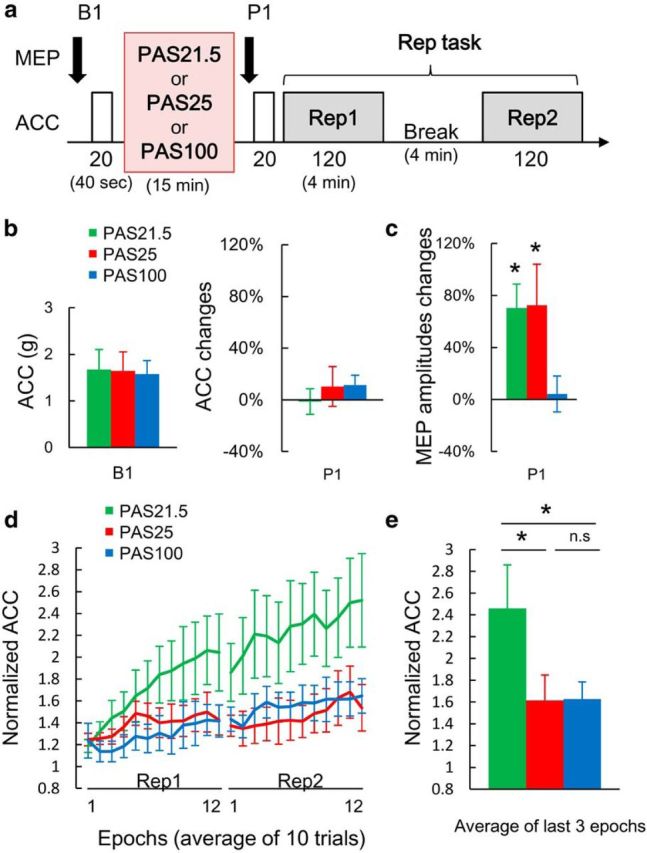
Effects of standard PAS on model-free learning in a repetitive thumb acceleration task (Rep task). a, Schematic representation of experiment. Standard PAS was applied with three different median nerve–TMS intervals (Table 1: PAS21.5, PAS25, or PAS100). Motor learning was assessed by changes in peak acceleration (ACC) of the trained thumb movement. The numbers under each block represent the number of trials, whereas the numbers in parentheses indicate the approximate length of time in minutes for each block. b, Baseline ACC (left) and percentage mean ± SEM changes immediately after PAS (right). There were no significant differences in baseline ACC or baseline MEP among PAS conditions (green represents PAS21.5; red represents PAS25; blue represents PAS100) (Table 3; p > 0.5, paired t tests, two-tailed). After PAS, ACC was unchanged at P1 (right; two-way rmANOVA: PAS, F(2,18) = 0.059, p = 0.943; TIME, F(1,9) = 0.003, p = 0.961; PAS × TIME, F(2,18) = 1.842, p = 0.187). c, Mean ± SEM MEP changes at P1. Both standard PAS21.5 and PAS25, but not PAS100, significantly increased MEP (two-way rmANOVA: interaction PAS × TIME, F(2,18) = 4.960, p = 0.019). *Significant increase of MEP at P1 compared with B1 using absolute MEP amplitude (p < 0.05 with paired t tests, two-tailed). d, Normalized mean ± SEM ACC during Rep task. PAS21.5 facilitated ACC (two-way rmANOVA: interaction PAS × EPOCH, F(46,414) = 2.223, p < 0.001). The observed changes were not the result of carryover effects (Table 8). e, Average fractional change in ACC over baseline of the last 3 epochs (i.e., last 1 min of Rep task) (Rosenkranz et al., 2007). *p < 0.05 (post hoc Turkey's tests). n.s., Not significant.
Experiment 7: effects of standard PAS21.5 and PAS25 on Adapt task.
This experiment was a crossover study, which consisted of three randomized ordered sessions, each separated by at least 2 weeks (PAS21.5, PAS25, and PAS100). Figure 5a showed the time course of experiment as in the previous report (Richardson et al., 2006). First, 30 MEPs at SI1 mV were measured at baseline (B0), after preblocks Pre1 and Pre2 (B1), and immediately after PAS intervention (P1). After intervention, subjects performed 240 trials of pincer grip force measurements with gain setting at 30 (Adapt).
Data analysis and statistics
The baseline physiological data are given in Table 3. These data were tested for possible differences between experimental sessions of a given experiment by using by paired t test (two-tailed).
In Experiment 1, MEP amplitudes normalized to baseline were entered into a three-way repeated-measures ANOVA (rmANOVA) with “PAS” (PAS21.5 and PAS25), “cDC” (real and sham), and “TIME” (T0, T15, and T30) as within-subject factors. In Experiment 2, log-transformed MEP amplitudes were entered into a three-way rmANOVA with “cDC” (sham and real), “TIME” (baseline and during), and “INTENSITY” (100%, 120%, 140%, and 160% MT), as within-subject factors in each condition (PA rest, AP rest, PA active, and AP active). A log transform of the data was required because a large range of MEP amplitudes is involved in constructing recruitment curves, and the data were not distributed normally. We also compared MEP onset latencies in each condition at baseline using paired t tests (two-tailed). For Experiments 3 and 4, MEP amplitudes normalized to baseline were entered into a four-way rmANOVA with “PAS” (PAS21.5 and PAS25), “STATE” (rest and contraction), and “EXPERIMENT” (Experiments 3 and 4) as between-subject factors and “TIME” (T0, T15, and T30) as within-subject factor. Because we found a significant PAS × STATE × EXPERIMENT interaction (Table 4), we conducted a separate two-way rmANOVA in each experiment on a grand average of time points T0 to T30 with “PAS” and “STATE” as within-subject factors (Table 4). Apart from these rmANOVAs, in Experiments 1, 3, and 4, to test whether there are significant increase of MEPs compared with baseline in each PAS condition, separate one-way rmANOVA in each PAS was used with a main factor of “TIME” (baseline, T0, T15, and T30) using absolute MEP values. Dunnett's tests were used for further analysis when the main effect of “TIME” was significant (Table 5).
Table 4.
Results of rmANOVAs conducted for Experiments 1, 3, and 4
| df | Error | F | p | |
|---|---|---|---|---|
| Experiment 1 | ||||
| PAS | 1 | 8 | 6.377 | 0.036 |
| cDC | 1 | 8 | 3.696 | 0.091 |
| TIME | 2 | 16 | 1.020 | 0.383 |
| PAS × cDC | 1 | 8 | 13.296 | 0.007 |
| PAS × TIME | 2 | 16 | 0.401 | 0.676 |
| TIME × cDC | 2 | 16 | 0.595 | 0.563 |
| PAS × cDC × TIME | 2 | 16 | 0.102 | 0.904 |
| Experiment 3 | ||||
| PAS | 1 | 8 | 0.764 | 0.407 |
| STATE | 1 | 8 | 0.764 | 0.407 |
| PAS × STATE | 1 | 8 | 22.518 | 0.001 |
| Experiment 4 | ||||
| PAS | 1 | 8 | 18.889 | 0.002 |
| STATE | 1 | 8 | 16.776 | 0.003 |
| PAS × STATE | 1 | 8 | 6.226 | 0.037 |
| Experiments 3 and 4 (combined) | ||||
| PAS | 1 | 64 | 0.345 | 0.559 |
| STATE | 1 | 64 | 18.020 | <0.001 |
| EXPERIMENT | 1 | 64 | 0.177 | 0.676 |
| TIME | 2 | 128 | 0.533 | 0.588 |
| PAS × STATE | 1 | 64 | 0.017 | 0.898 |
| PAS × EXPERIMENT | 1 | 64 | 21.045 | <0.001 |
| PAS × TIME | 2 | 128 | 1.578 | 0.210 |
| STATE × EXPERIMENT | 1 | 64 | 0.793 | 0.376 |
| STATE × TIME | 2 | 128 | 3.039 | 0.051 |
| EXPERIMENT × TIME | 3 | 27 | 0.595 | 0.623 |
| PAS × STATE × EXPERIMENT | 1 | 64 | 9.044 | 0.004 |
| PAS × STATE × TIME | 2 | 128 | 0.209 | 0.812 |
| PAS × EXPERIMENT × TIME | 2 | 128 | 0.746 | 0.476 |
| STATE × EXPERIMENT × TIME | 2 | 128 | 0.686 | 0.505 |
| PAS × STATE × EXPERIMENT × TIME | 2 | 128 | 1.168 | 0.314 |
Table 5.
Results of one-way rmANOVAs conducted for Experiments 1, 3, and 4
| Intervention | df | Error | F | p |
p values compared with baseline |
||
|---|---|---|---|---|---|---|---|
| T0 | T15 | T30 | |||||
| Experiment 1 | |||||||
| Sham-PAS21.5 | 3 | 24 | 3.683 | 0.026* | 0.257 | 0.125 | 0.009* |
| Sham-PAS25 | 3 | 24 | 5.565 | 0.005* | 0.018* | 0.086 | 0.002* |
| cDC-PAS21.5 | 3 | 24 | 3.002 | 0.044* | 0.077 | 0.055 | 0.033* |
| cDC-PAS25 | 3 | 24 | 0.676 | 0.575 | |||
| Experiment 3 | |||||||
| PAS21.5 | 3 | 24 | 7.511 | 0.001* | 0.037* | 0.005* | <0.001* |
| PAS25 | 3 | 24 | 7.388 | 0.001* | 0.001* | 0.001* | 0.030* |
| PA-sub-PAS21.5 | 3 | 24 | 6.389 | 0.002* | 0.009* | 0.003* | 0.004* |
| PA-sub-PAS25 | 3 | 24 | 2.816 | 0.061 | |||
| Experiment 4 | |||||||
| PAS21.5 | 3 | 24 | 4.020 | 0.019* | 0.035* | 0.027* | 0.004* |
| PAS25 | 3 | 24 | 4.987 | 0.008* | 0.078 | 0.009* | 0.002* |
| AP-sub-PAS21.5 | 3 | 24 | 0.953 | 0.431 | |||
| AP-sub-PAS25 | 3 | 24 | 4.053 | 0.018* | 0.006* | 0.104 | 0.206 |
*p < 0.05 by Dunnett's test.
In Experiment 6, we created epochs by binning 10 consecutive movements. Baseline ACC and MEPs among PAS conditions were tested by paired t tests (two-tailed). Absolute ACC values among PAS conditions at B1 and P1 were entered into a two-way rmANOVA with factors “PAS” (PAS21.5, PAS25, and PAS100) and “TIME.” Peak ACCs during 24 epochs (Rep1 and Rep2) normalized to ACC at P1 were entered into a two-way rmANOVA with factors “PAS” and “EPOCH.” Post hoc tests were performed on the average of ACC in the final three epochs as in one previous report (Rosenkranz et al., 2007). For MEP analysis, we also used a two-way rmANOVA with “PAS” and “TIME” as within-subject factors using absolute MEP amplitude at B1 and P1.
In Experiment 7, the data from one subject were discarded because this subject did not follow the instructions of this experiment. The data from 8 subjects were analyzed using an approach as has been used by others (Krakauer et al., 2005; Galea et al., 2011). Performance was quantified in each trial using amplitude error, defined as the log-transformed amplitude of peak force normalized to the target force. Epochs were created by binning 10 consecutive movements. For each block, the initial amount of error (mean error) was determined by averaging over consecutive epochs; and for all blocks, epochs 2–6 were averaged (Krakauer et al., 2005; Galea et al., 2011). Using mean error as the primary outcome measure, a two-way rmANOVA was performed with factors “PAS” and “BLOCK” (Pre1, Pre2, Adapt, Post1, and Post2). To evaluate carryover effects in Experiments 6 and 7, two-way rmANOVAs were conducted with factors “ORDER” (three levels: first, second, and third) and “EPOCH” (Experiment 6) or “BLOCK” (Experiment 7). The mean error in Adapt block alone was additionally entered into one-way rmANOVA with factor “ORDER” to analyze the carryover effect in detail. For MEP analysis, absolute MEP amplitude at B0 and B1 were compared using paired t tests (two-tailed) in each PAS condition. To check LTP-like effects of PAS, we used a two-way rmANOVA with “PAS” and “TIME” as within-subject factors using absolute MEP amplitude at B1 and P1. In all of the analyses using two- or three-way rmANOVA, the Greenhouse–Geisser correction was used if necessary to correct for nonsphericity and Turkey's post hoc tests were used for further analysis. p values <0.05 were considered significant. Data were analyzed using SPSS software (version 19.0 for Windows; SPSS). All data are given as mean ± SEM.
Results
Experiments 1–5: physiological mechanisms of standard PAS
Standard PAS involves repeated pairing of an electrical stimulus to the median nerve with a TMS pulse given 21.5–25 ms later to the contralateral M1 (Stefan et al., 2000). This increases CS excitability, as indexed by the amplitude of MEPs in the target muscle for the following 30–60 min and is thought to involve synaptic LTP of inputs to CSNs because it is sensitive to drugs that influence NMDA receptor function (Stefan et al., 2002; Wolters et al., 2003). The effective median nerve–TMS interval (∼21.5–25 ms) is thought to reflect the time window for development of spike timing-dependent plasticity at cortical synapses activated by median nerve input and TMS (Stefan et al., 2002; Wolters et al., 2003). In this spike timing-dependent plasticity model, plasticity with an interval of 21.5 ms (PAS21.5) should affect the same set of synapses as an interval of 25 ms (PAS25) (Müller-Dahlhaus et al., 2010). However, recent work suggests that this is not the case. Hamada et al. (2012) found that concurrent anodal transcranial direct current stimulation over the cerebellum (cDC) during application of PAS abolished plasticity of standard PAS25, but not PAS21.5. They argued that this is consistent with the idea that standard PAS25 and PAS21.5 involve plasticity in two separate sets of synapses onto CSNs (Hamada et al., 2012). Our experiments begin by exploring these differences in more detail to test our present hypothesis that PA inputs are responsible for standard PAS21.5, whereas AP inputs involve standard PAS25 (see Study design).
Experiments 1 and 2: cDC effects on standard PAS25 involve modulation of AP inputs
In a new group of naive volunteers, we confirmed here that cDC selectively abolished the response to standard PAS25 but not PAS21.5 at rest as in the previous study (Hamada et al., 2012) (Experiment 1; Fig. 1a,b; Tables 4 and 5). The result again supports our previous hypothesis that the mechanisms of the standard PAS21.5 and PAS25 aftereffects are not physiologically identical (Hamada et al., 2012). We then tested anodal cDC effects on CS excitability in detail because we predicted that cDC may selectively modulate AP inputs, but not PA inputs (see Materials and Methods).
Our results show that anodal cDC reduced MEPs evoked by AP pulses during VC (i.e., active condition), but there were no changes in MEPs evoked by either form of M1 stimulation at rest or with PA pulses during VC (Fig. 1c; Table 6). There was no significant difference at rest in MEP onset latency between PA versus AP pulses (Table 7; paired t test, two-tailed, p = 0.065 in the real cDC sessions; p = 0.541 in the sham cDC sessions). In contrast, when tested during VC, the latency of MEPs evoked by PA pulses was significantly shorter than the latency by AP pulses (Table 7; paired t test, two-tailed, p < 0.000001 in the real cDC sessions; p < 0.000001 in the sham cDC session). The results confirm that we had achieved some selective activation of AP and PA inputs during VC, whereas this was not the case at rest.
Table 6.
Results of three-way rmANOVAs conducted for Experiment 2
| Condition | df | Error | F | p |
|---|---|---|---|---|
| PA rest | ||||
| cDC | 1 | 9 | 5.082 | 0.051 |
| TIME | 1 | 9 | 1.564 | 0.243 |
| INTENSITY | 1.261 | 11.350 | 124.625 | <0.001 |
| cDC × TIME | 1 | 9 | 0.098 | 0.761 |
| cDC × INTENSITY | 1.769 | 15.922 | 2.667 | 0.105 |
| TIME × INTENSITY | 3 | 27 | 2.209 | 0.110 |
| cDC × TIME × INTENSITY | 3 | 27 | 0.361 | 0.782 |
| AP rest | ||||
| cDC | 1 | 9 | 1.367 | 0.272 |
| TIME | 1 | 9 | 1.669 | 0.229 |
| INTENSITY | 1.690 | 15.207 | 199.938 | <0.001 |
| cDC × TIME | 1 | 9 | 0.002 | 0.969 |
| cDC × INTENSITY | 2.061 | 18.546 | 1.512 | 0.247 |
| TIME × INTENSITY | 1.328 | 11.950 | 1.177 | 0.318 |
| cDC × TIME × INTENSITY | 3 | 27 | 0.595 | 0.623 |
| PA active | ||||
| cDC | 1 | 9 | 0.833 | 0.385 |
| TIME | 1 | 9 | 0.789 | 0.397 |
| INTENSITY | 1.293 | 11.640 | 20.787 | <0.001 |
| cDC × TIME | 1 | 9 | 1.314 | 0.281 |
| cDC × INTENSITY | 3 | 27 | 0.500 | 0.686 |
| TIME × INTENSITY | 3 | 27 | 2.675 | 0.067 |
| cDC × TIME × INTENSITY | 3 | 27 | 1.892 | 0.155 |
| AP active | ||||
| cDC | 1 | 9 | 2.012 | 0.190 |
| TIME | 1 | 9 | 10.584 | 0.010 |
| INTENSITY | 1.599 | 14.388 | 150.586 | <0.001 |
| cDC × TIME | 1 | 9 | 6.023 | 0.037 |
| cDC × INTENSITY | 3 | 27 | 2.301 | 0.100 |
| TIME × INTENSITY | 3 | 27 | 0.368 | 0.776 |
| cDC × TIME × INTENSITY | 3 | 27 | 5.109 | 0.006 |
Table 7.
Onset latency of MEP at baseline in each session in Experiment 2a
| PA rest | AP rest | PA active | AP active | |
|---|---|---|---|---|
| Real | 22.8 ± 2.0 | 23.2 ± 2.3 | 20.2 ± 1.7 | 23.2 ± 1.9 |
| Sham | 22.6 ± 2.5 | 22.8 ± 2.2 | 20.8 ± 2.1 | 23.4 ± 1.9 |
aData are mean ± SEM (ms). Onset latency was measured with 140% RMT at rest and 120% AMT in the active condition to match MEP amplitudes (see Fig. 1c).
Experiments 3 and 4: subthreshold PAS21.5 involves PA inputs, whereas PAS25 involves AP inputs
To follow-up on the idea that the standard PAS25 effects depend on AP inputs whereas the standard PAS21.5 effects depend on PA inputs, we compared the effects of standard PAS at rest with subthreshold PAS evoked by PA or AP pulses during VC, as first described by Kujirai et al. (2006) (see Materials and Methods). In the present preselected participants, all responded positively to standard PAS21.5 and PAS25 (i.e., using suprathreshold TMS at rest) (Fig. 2). Further testing with subthreshold PAS during VC confirmed that PAS25 with AP (i.e., AP-sub-PAS25) but not PA pulses (PA-sub-PAS25) facilitated MEPs (Fig. 2a–c; for protocol details, see Table 1), consistent with the previous study showing selective activation of AP inputs are required for the effects of subthreshold PAS25 (Kujirai et al., 2006). The novel finding was that using the same protocol, PA pulses were needed to produce an effect after subthreshold PAS21.5, whereas there was no effect with AP pulses (Fig. 2a–c; Tables 4 and 5).
Figure 2.
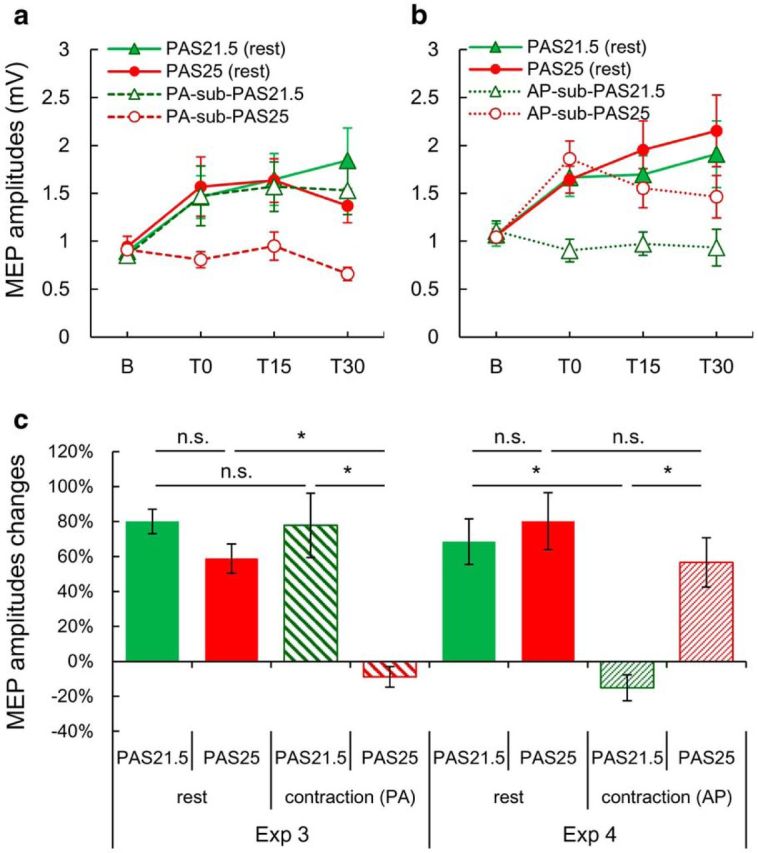
Comparison of the effects of standard PAS21.5 and PAS25 (PA pulses; suprathreshold TMS at rest) with subthreshold PAS21.5 and PAS25 evoked by PA- or AP-TMS pulses during voluntary contraction. a, b, Mean MEP amplitudes before (b) and after (T0, T15, and T30) different PAS protocols. a, Data from Experiment 3. MEPs were significantly increased compared with baseline at all time points by standard PAS21.5 (green filled triangle), PAS25 (red filled circle), and PA-sub-PAS21.5 (green triangle), but not PA-sub-PAS25 (red circle) (two-way rmANOVA: interaction PAS × STATE, F(1,8) = 22.518, p = 0.001; Tables 4 and 5). b, Data from Experiment 4. MEPs were significantly increased over baseline at all time points by standard PAS21.5 (green filled triangle), at T15 and T30 by PAS25 (red filled circle), and at T0 by AP-sub-PAS25 (red circle), but there was no MEP increase after AP-sub-PAS21.5 (green triangle) (two-way rmANOVA: interaction PAS × STATE, F(1,8) = 6.226, p = 0.037; Tables 4 and 5). c, Grand average (over T0, T15, and T30) MEP percentage changes over baseline MEPs in each session. Subthreshold PAS21.5 and PAS25 induced MEP facilitation through the repetitive activation of PA and AP inputs, respectively (four-way rmANOVA on the combined data from Experiments 3 and 4: interaction PAS × STATE × EXPERIMENT, F(1,64) = 9.044, p = 0.004; Table 4). *p < 0.05 (post hoc Turkey's tests). n.s., Not significant.
Experiment 5: PAS21.5 has no measureable effect on descending CS volleys
The results from Experiments 1–4 support the idea that two separate inputs to CSNs in M1 mediate the aftereffects of standard PAS21.5 versus PAS25 at rest (PA inputs for PAS21.5 and AP inputs for PAS25). We next examined whether these differences would be evident in the CS descending volleys evoked by TMS pulses after PAS. Previous recordings of CS volleys from the high cervical epidural space of patients with implanted chronic spinal stimulators showed that standard PAS25 increases the amplitude of late indirect waves (I-waves) (Di Lazzaro et al., 2009). To find out whether standard PAS21.5 had different effects, we took the opportunity in a new patient of recording descending CS volleys before and after standard PAS21.5 (see Materials and Methods). We found that, although standard PAS21.5 at rest increased MEPs (Fig. 3a) (paired t test, two-tailed, p < 0.05), there were no clear effects on the descending CS volleys (paired t test, two-tailed, not significant) (Fig. 3b). This is further supportive evidence that PAS25 versus PAS21.5 have different effects on the inputs to CSNs. One question that remains is how the MEP could increase in amplitude after PAS21.5 even though the descending CS volleys did not change. Indeed, this dissociation is not unusual (Di Lazzaro et al., 2006; Di Lazzaro et al., 2007), and the likely explanation is that there is a change in the amount of descending activity that is not synchronized with the main CS volleys (Di Lazzaro and Ziemann, 2013). Alternatively, increased MEPs in the absence of obvious change in descending CS volleys may reflect changes in the composition of the volley, which itself reflects activity in many other muscles in addition to the target muscle, as we have argued previously (Di Lazzaro et al., 2006, 2007; Di Lazzaro and Ziemann, 2013). Although the result was obtained from only one patient in a single PAS condition and we did not confirm in this particular patient that later I-waves were indeed facilitated after PAS25 as in the previous study (Di Lazzaro et al., 2009), the results lead us to conjecture that the mechanisms of the standard PAS21.5 and PAS25 aftereffects are not physiologically identical.
Figure 3.

MEP and descending CS volleys before (red line) and after PAS21.5 (blue line). Single-pulse TMS with PA pulses in the brain evoked an MEP (a) and four descending CS waves at cervical level (b). The latency of earliest wave was 2.4 ms, which is consistent with direct activation of CSN axons (Di Lazzaro et al., 2009). We termed this volley a D-wave (i.e., direct wave), which indicates direct activation of CSN (Amassian et al., 1987; Di Lazzaro and Ziemann, 2013). It was followed by a series of descending CS volleys that we termed I-waves (i.e., indirect waves), numbered in order of their appearance, representing indirect, trans-synaptic activation of CSN (Amassian et al., 1987; Di Lazzaro and Ziemann, 2013). There was clear facilitation of MEPs after PAS21.5 (a), but no changes in descending CS volleys (b). Calibration: a, 0.1 mV, 5 ms; b, 5 μV, 2 ms.
Experiments 6 and 7: do changes in excitability produced by PA and AP inputs have differential effects on motor learning?
The results from Experiments 1–5 imply that the effects of PAS25 and PAS21.5 are mediated by different mechanisms: AP inputs, which depend on cerebellar activity, are required for PAS25, whereas PA inputs are needed for PAS21.5. Experiments 6 and 7 use standard PAS21.5 and PAS25 to selectively alter the effectiveness of one or other of these inputs to test whether and how these separate synaptic inputs to CSNs are functionally relevant to human motor behavior. We used two forms of tasks (Rep and Adapt task; see Materials and Methods) as an example of model-based and model-free, respectively, both of which are thought to depend on a neuronal network including M1 (Bütefisch et al., 2000; Muellbacher et al., 2002; Diedrichsen et al., 2005; Hadipour-Niktarash et al., 2007; Galea and Celnik, 2009; Galea et al., 2011).
Experiment 6: PAS21.5 modulates model-free (Rep task) motor learning
Figure 4a shows the time course of our experiments in which standard PAS at rest was applied before the Rep task as in previous studies (Jung and Ziemann, 2009; Kang et al., 2011). As expected, both PAS protocols (i.e., standard PAS21.5 and PAS25) but not the PAS100 control protocol increased MEP amplitudes (Fig. 4c). Confirming the previous findings (Jung and Ziemann, 2009), standard PAS21.5 increased peak acceleration (ACC) during the Rep task compared with the PAS100 control condition (Fig. 4d,e); the new result is that, in contrast, standard PAS25 had no effect on ACC during the Rep task compared with the PAS100 control condition (Fig. 4d,e).
Experiments 7: PAS25 modulates model-based (Adapt task) motor learning
In the final experiment, we tested how PAS at different intervals interacts with adaptation to a new visuomotor gain (model-based: Adapt task) (Ojakangas and Ebner, 1994; Butler et al., 2000). Recent evidence found that gain adaptation also induces LTP-like changes in M1 (Li et al., 2001; Bagce et al., 2013). It is therefore possible that modulating M1 with PAS may interfere with this task. Figure 5a shows the experimental protocol in which standard PAS was applied before adaptation (Richardson et al., 2006). Standard PAS25 and PAS21.5, but not the PAS100 control protocol, increased MEP amplitudes (Fig. 5b). The error in the Pre blocks was characterized by relatively stable performance in all PAS conditions (Fig. 5c). Introducing the novel visuomotor gain transformation led to a large initial error in force production in all conditions. Over subsequent trials, all participants adapted, reducing their error values and returning toward baseline performance. During the early phase of adaptation, the PAS25 group had a larger error compared with the PAS21.5 and PAS100 (Fig. 5c). We confirmed that this was not the result of carryover effects (Table 8). Findings show that, even though CS excitability was increased to the same extent by both PAS21.5 and PAS25 (Fig. 5b), only PAS25 changed the early phase of adaptation. Although we did not find any significant differences among PAS conditions during the postperturbation periods (Post1 and Post2), it could be that we missed subtle effects by averaging over 10 trials for each epoch because deadaptation during Post1 and Post2 is very rapid (Fig. 5c). We therefore analyzed the deadaptation period on a single trial basis (Fig. 5d) but again failed to observe differences among the PAS groups.
Table 8.
No carryover effects were found in Experiments 6 and 7
| df | Error | F | p | |
|---|---|---|---|---|
| Experiment 6a | ||||
| ORDER | 2 | 18 | 2.108 | 0.150 |
| EPOCH | 23 | 207 | 7.527 | <0.001 |
| ORDER × EPOCH | 46 | 414 | 0.917 | 0.629 |
| Experiment 7a | ||||
| ORDER | 2 | 14 | 2.444 | 0.123 |
| BLOCK | 4 | 28 | 157.213 | <0.001 |
| ORDER × BLOCK | 8 | 56 | 1.688 | 0.122 |
| Experiment 7b | ||||
| ORDER | 1 | 7 | 4.148 | 0.081 |
aResults of two-way rmANOVA with factors ORDER (three levels: first, second, and third) and EPOCH (Experiment 6) or BLOCK (Experiment 7).
bResults of one-way ANOVA using the mean error (average from epochs 2–6, as in main analysis) in Adapt block with factor ORDER.
Discussion
Physiological mechanisms of PAS
A large body of evidence suggests that AP and PA pulses of the M1 hand area activate different sets of synaptic input to CSNs (Day et al., 1989; Di Lazzaro et al., 2001). A novel conclusion of this study is that these can be separately conditioned by standard PAS21.5 and PAS25. We demonstrated in Experiments 3 and 4 that PA inputs are required for subthreshold PAS21.5, whereas AP inputs participate in subthreshold PAS25. Experiment 2 showed that cDC selectively reduces the response to AP inputs during VC. Because cDC also reduced standard PAS25 at rest, it is likely that the effects of standard PAS25 at rest, like subthreshold PAS25 during VC, depend critically on AP inputs, consistent with the previous study (Kujirai et al., 2006). The cDC experiments imply that inputs responsible for standard PAS21.5 at rest differ from those involved in standard PAS25 at rest. Because PAS25 depends on AP inputs, we suggest that the effects of standard PAS21.5 at rest depend on PA inputs, as they do during VC.
Standard PAS requires TMS intensities large enough to elicit MEPs of ∼1 mV at rest: they activate a mixture of all PA and AP inputs (Di Lazzaro et al., 1998a, b; Di Lazzaro et al., 2001). Our argument is that, even though all volleys are recruited by the TMS pulse during standard PAS at rest with PA pulses, the MEP increase after standard PAS is explained by selective enhancement of PA inputs when the ISI is 21.5 ms (PAS21.5) or AP inputs when the ISI is 25 ms (PAS25). This explains why cDC abolishes the effect of standard PAS25 at rest (via its effect on AP inputs) but does not change the response to standard PAS21.5. If the aftereffects of standard PAS21.5 and PAS25 were due to equal effects on PA and AP inputs, then cDC would decrease both by ∼50% without differentiation. It is therefore likely that two separate inputs to CSNs mediate the aftereffects of standard PAS21.5 versus PAS25.
PAS at different intervals interferes with different forms of motor learning
To link standard PAS at different intervals with independent forms of motor learning, we selected two types of motor tasks (Rep and Adapt task), which represent model-free and model-based motor learning, respectively. We sought to dissociate these two forms of motor learning by applying standard PAS21.5 and PAS25 to engage separate inputs (i.e., PA and AP inputs) to CSNs in M1.
We used the Rep task as an example of model-free learning in which repetition of a particular action leads future movements to be biased toward that action (Classen et al., 1998). Because these experiments do not involve any change in the dynamics of the environment, these biases cannot be explained in the framework of internal models. Instead, they reflect model-free motor learning (Huang et al., 2011). Crucially, specific M1 neural circuits appear important for this form of model-free learning (Bütefisch et al., 2000; Muellbacher et al., 2002; Galea and Celnik, 2009), whereas manipulation of cerebellar activity does not affect this form of learning (Li Voti et al., 2014).
The facilitatory effect of PAS21.5 on Rep task was the same as that described by Jung and Ziemann (2009) using PASN20 + 2. However, in a later experiment from the same group, Kang et al. (2011) observed the opposite effect of PAS25 on Rep task: the learning rate was reduced. Their explanation was that, in their later experiments, PAS25, unlike PASN20 + 2, produced no overall facilitation of the MEP; thus, the presence/absence of an LTP-like process after PAS accounts for the observed difference in subsequent motor learning (Kang et al., 2011). In our experiment, MEPs were facilitated by PAS25 to the same extent as to PAS21.5. If the same logic were applied, we should have seen an increase in learning rate after PAS25 similar to that observed with PAS21.5. However, there was no effect on the rate of learning after PAS25. Although we cannot compare results directly because of differences in the experimental details (number of pairs and rate of application of PAS; and participant age), careful comparison with the previous results (Kang et al., 2011) actually suggests that the two sets of data are remarkably similar. There was an overall suppression of learning rate by PAS25 in Kang et al. (2011), but this was not evident for the initial set of 220 movements that were performed in the first 15 min block and only became evident in a second block of practice. Our protocol only examined performance for 12 min (and 240 movements) in total, and we again observed no effect on learning.
A plausible explanation for the present results is that PA and AP inputs to CSNs have different roles in this model-free learning task. We propose that PA inputs strengthened by PAS21.5 are involved in model-free learning, whereas the AP inputs are not. Importantly, the fact that there were no differences between PAS conditions in ACC at P1 (i.e., before practice) and in the first epochs during practice suggests that PAS21.5 specifically affected the model-free learning process rather than motor performance per se.
In Experiment 7, participants adapted to a visuomotor gain transformation. Model-based learning refers to adaptation; an internal model is learnt that predicts the consequences of motor commands, and is thought to depend on a network that includes the cerebellum and M1 (Diedrichsen et al., 2005), especially in the retention of new memories (Richardson et al., 2006; Hadipour-Niktarash et al., 2007; Galea et al., 2011). Explanations account for this by proposing that the cerebellum uses a copy of the motor output to predict the sensory consequences of movement, which is compared (in cerebellum or parietal cortex) with the actual sensory consequences. The difference is used to update subsequent motor commands. This updated internal model, which accounts for the dynamics of the novel environment, is likely stored in M1 (Shadmehr and Krakauer, 2008).
Our data showed clear effects of PAS25, but not PAS21.5, on model-based learning. The finding may indicate that AP inputs strengthened by PAS25 are involved in model-based learning in a homeostatic manner, whereas the PA inputs are not. However, it is unclear why the early phase of adaptation, but not retention, was affected by PAS25, given that overlapping LTP-like processes have been suggested to be involved in both of them (Cantarero et al., 2013); therefore, this point needs further investigation.
Finally, model-based learning was suppressed by PAS25, whereas model-free was improved by PAS21.5. Why should the two forms of motor learning be affected in the opposite way by PAS? There are several factors to consider, such as different neuronal (Baraduc et al., 2004) and computational mechanisms underpinning each form of learning (Shadmehr and Krakauer, 2008), modulation of GABAergic activity by PAS (Stefan et al., 2002), which plays a substantial role in motor learning (Stagg et al., 2011), and physiological (Kujirai et al., 1993; Di Lazzaro et al., 1998a) and location differences between PA and AP inputs (Amassian et al., 1987; Hamada et al., 2013; Koch et al., 2013). We have no direct evidence that would point to the mechanism of this double dissociation, but we could speculate, for example, that the Rep task may increase recruitment of CSNs projecting to target muscles to generate a burst of activity in synergistic muscles, whereas the Adapt task does not require increased synergistic activity but instead needs to adapt a precisely coordinated pattern of muscle activity (Baraduc et al., 2004). Increasing the excitability of CSNs may help to increase synergic activity during the Rep task, whereas it could interfere with improvement of coordination during the Adapt task. The effect of PAS may be evident only when we condition CSNs through the synaptic inputs that convey information needed for each particular task.
There are several limitations in this study. One is that we did not measure changes in inhibitory circuits. Second, epidural recording was from one patient in single condition. Third, we cannot exclude the possibility that sensory inputs to M1, arriving via transcerebellar route, may contribute to PAS25, but not to PAS21.5 (Hamada et al., 2012), which could potentially explain at least the results of Experiments 1 and 7. Finally, the mechanisms why the two circuits behave differently when assessing interactions between PAS and motor learning are unresolved and will require further study.
Despite these limitations, the present data are highly suggestive that it is possible in the human brain to study how different interneuron circuits contribute to individual behaviors. The implication would be that networks within M1 can operate independently depending on learning context. Our data complement recent evidence in animals that suggests that populations of neurons in a single area of cortex may participate in different behaviors. In the hippocampus (Kvitsiani et al., 2013) and in the prefrontal cortex (Lapray et al., 2012), different inhibitory cell types are conditioned by distinct synaptic inputs and perform separate, but related, functions that are amalgamated at the output stage (DeFelipe et al., 2013). There could be learning-related functional differences in excitatory interneuron circuits in M1, which may be at least partially accessible by modified TMS methods.
Footnotes
This work was supported by the Stroke Association and the European Union (Initial Training Network, “Moving Beyond”). M.H. received Postdoctoral Fellowships for Research Abroad from the Japan Society for the Promotion of Science. We thank Dr. Michael Ridding for constructive comments to an earlier version of this manuscript.
M.H. serves as a medical advisor for Pfizer Japan Inc. U.Z. serves as an advisor for Biogen, Idec GmbH Germany, and CorTec GmbH Germany. The remaining authors declare no competing financial interests.
References
- Amassian VE, Stewart M, Quirk GJ, Rosenthal JL. Physiological basis of motor effects of a transient stimulus to cerebral cortex. Neurosurgery. 1987;20:74–93. [PubMed] [Google Scholar]
- Bagce HF, Saleh S, Adamovich SV, Krakauer JW, Tunik E. Corticospinal excitability is enhanced after visuomotor adaptation and depends on learning rather than performance or error. J Neurophysiol. 2013;109:1097–1106. doi: 10.1152/jn.00304.2012. [DOI] [PMC free article] [PubMed] [Google Scholar]
- Bagnato S, Agostino R, Modugno N, Quartarone A, Berardelli A. Plasticity of the motor cortex in Parkinson's disease patients on and off therapy. Mov Disord. 2006;21:639–645. doi: 10.1002/mds.20778. [DOI] [PubMed] [Google Scholar]
- Baraduc P, Lang N, Rothwell JC, Wolpert DM. Consolidation of dynamic motor learning is not disrupted by rTMS of primary motor cortex. Curr Biol. 2004;14:252–256. doi: 10.1016/S0960-9822(04)00045-4. [DOI] [PubMed] [Google Scholar]
- Bütefisch CM, Davis BC, Wise SP, Sawaki L, Kopylev L, Classen J, Cohen LG. Mechanisms of use-dependent plasticity in the human motor cortex. Proc Natl Acad Sci U S A. 2000;97:3661–3665. doi: 10.1073/pnas.97.7.3661. [DOI] [PMC free article] [PubMed] [Google Scholar]
- Butler EG, Bourke DW, Horne MK. The activity of primate ventrolateral thalamic neurones during motor adaptation. Exp Brain Res. 2000;133:514–531. doi: 10.1007/s002210000355. [DOI] [PubMed] [Google Scholar]
- Cantarero G, Tang B, O'Malley R, Salas R, Celnik P. Motor learning interference is proportional to occlusion of LTP-like plasticity. J Neurosci. 2013;33:4634–4641. doi: 10.1523/JNEUROSCI.4706-12.2013. [DOI] [PMC free article] [PubMed] [Google Scholar]
- Capaday C, van Vreeswijk C, Ethier C, Ferkinghoff-Borg J, Weber D. Neural mechanism of activity spread in the cat motor cortex and its relation to the intrinsic connectivity. J Physiol. 2011;589:2515–2528. doi: 10.1113/jphysiol.2011.206938. [DOI] [PMC free article] [PubMed] [Google Scholar]
- Chu NS. Somatosensory evoked potentials: correlations with height. Electroencephalogr Clin Neurophysiol. 1986;65:169–176. doi: 10.1016/0168-5597(86)90051-1. [DOI] [PubMed] [Google Scholar]
- Classen J, Liepert J, Wise SP, Hallett M, Cohen LG. Rapid plasticity of human cortical movement representation induced by practice. J Neurophysiol. 1998;79:1117–1123. doi: 10.1152/jn.1998.79.2.1117. [DOI] [PubMed] [Google Scholar]
- Day BL, Dressler D, Maertens de Noordhout A, Marsden CD, Nakashima K, Rothwell JC, Thompson PD. Electric and magnetic stimulation of human motor cortex: surface EMG and single motor unit responses. J Physiol. 1989;412:449–473. doi: 10.1113/jphysiol.1989.sp017626. [DOI] [PMC free article] [PubMed] [Google Scholar]
- DeFelipe J, López-Cruz PL, Benavides-Piccione R, Bielza C, Larrañaga P, Anderson S, Burkhalter A, Cauli B, Fairén A, Feldmeyer D, Fishell G, Fitzpatrick D, Freund TF, González-Burgos G, Hestrin S, Hill S, Hof PR, Huang J, Jones EG, Kawaguchi Y, et al. New insights into the classification and nomenclature of cortical GABAergic interneurons. Nat Rev Neurosci. 2013;14:202–216. doi: 10.1038/nrn3444. [DOI] [PMC free article] [PubMed] [Google Scholar]
- Diedrichsen J, Hashambhoy Y, Rane T, Shadmehr R. Neural correlates of reach errors. J Neurosci. 2005;25:9919–9931. doi: 10.1523/JNEUROSCI.1874-05.2005. [DOI] [PMC free article] [PubMed] [Google Scholar]
- Di Lazzaro V, Ziemann U. The contribution of transcranial magnetic stimulation in the functional evaluation of microcircuits in human motor cortex. Front Neural Circuits. 2013;7:18. doi: 10.3389/fncir.2013.00018. [DOI] [PMC free article] [PubMed] [Google Scholar]
- Di Lazzaro V, Restuccia D, Oliviero A, Profice P, Ferrara L, Insola A, Mazzone P, Tonali P, Rothwell JC. Magnetic transcranial stimulation at intensities below active motor threshold activates intracortical inhibitory circuits. Exp Brain Res. 1998a;119:265–268. doi: 10.1007/s002210050341. [DOI] [PubMed] [Google Scholar]
- Di Lazzaro V, Restuccia D, Oliviero A, Profice P, Ferrara L, Insola A, Mazzone P, Tonali P, Rothwell JC. Effects of voluntary contraction on descending volleys evoked by transcranial stimulation in conscious humans. J Physiol. 1998b;508:625–633. doi: 10.1111/j.1469-7793.1998.625bq.x. [DOI] [PMC free article] [PubMed] [Google Scholar]
- Di Lazzaro V, Oliviero A, Saturno E, Pilato F, Insola A, Mazzone P, Profice P, Tonali P, Rothwell JC. The effect on corticospinal volleys of reversing the direction of current induced in the motor cortex by transcranial magnetic stimulation. Exp Brain Res. 2001;138:268–273. doi: 10.1007/s002210100722. [DOI] [PubMed] [Google Scholar]
- Di Lazzaro V, Pilato F, Oliviero A, Dileone M, Saturno E, Mazzone P, Insola A, Profice P, Ranieri F, Capone F, Tonali PA, Rothwell JC. Origin of facilitation of motor-evoked potentials after paired magnetic stimulation: direct recording of epidural activity in conscious humans. J Neurophysiol. 2006;96:1765–1771. doi: 10.1152/jn.00360.2006. [DOI] [PubMed] [Google Scholar]
- Di Lazzaro V, Thickbroom GW, Pilato F, Profice P, Dileone M, Mazzone P, Insola A, Ranieri F, Tonali PA, Rothwell JC. Direct demonstration of the effects of repetitive paired pulse transcranial magnetic stimulation at I-wave periodicity. Clin Neurophysiol. 2007;118:1193–1197. doi: 10.1016/j.clinph.2007.02.020. [DOI] [PubMed] [Google Scholar]
- Di Lazzaro V, Dileone M, Pilato F, Profice P, Oliviero A, Mazzone P, Insola A, Capone F, Ranieri F, Tonali PA. Associative motor cortex plasticity: direct evidence in humans. Cereb Cortex. 2009;19:2326–2330. doi: 10.1093/cercor/bhn255. [DOI] [PubMed] [Google Scholar]
- Evarts EV. Relation of pyramidal tract activity to force exerted during voluntary movement. J Neurophysiol. 1968;31:14–27. doi: 10.1152/jn.1968.31.1.14. [DOI] [PubMed] [Google Scholar]
- Fratello F, Veniero D, Curcio G, Ferrara M, Marzano C, Moroni F, Pellicciari MC, Bertini M, Rossini PM, De Gennaro L. Modulation of corticospinal excitability by paired associative stimulation: reproducibility of effects and intraindividual reliability. Clin Neurophysiol. 2006;117:2667–2674. doi: 10.1016/j.clinph.2006.07.315. [DOI] [PubMed] [Google Scholar]
- Galea JM, Celnik P. Brain polarization enhances the formation and retention of motor memories. J Neurophysiol. 2009;102:294–301. doi: 10.1152/jn.00184.2009. [DOI] [PMC free article] [PubMed] [Google Scholar]
- Galea JM, Jayaram G, Ajagbe L, Celnik P. Modulation of cerebellar excitability by polarity-specific noninvasive direct current stimulation. J Neurosci. 2009;29:9115–9122. doi: 10.1523/JNEUROSCI.2184-09.2009. [DOI] [PMC free article] [PubMed] [Google Scholar]
- Galea JM, Vazquez A, Pasricha N, de Xivry JJ, Celnik P. Dissociating the roles of the cerebellum and motor cortex during adaptive learning: the motor cortex retains what the cerebellum learns. Cereb Cortex. 2011;21:1761–1770. doi: 10.1093/cercor/bhq246. [DOI] [PMC free article] [PubMed] [Google Scholar]
- Georgopoulos AP, Schwartz AB, Kettner RE. Neuronal population coding of movement direction. Science. 1986;233:1416–1419. doi: 10.1126/science.3749885. [DOI] [PubMed] [Google Scholar]
- Graziano MS. Cables vs. networks: old and new views on the function of motor cortex. J Physiol. 2011;589:2439. doi: 10.1113/jphysiol.2011.209767. [DOI] [PMC free article] [PubMed] [Google Scholar]
- Graziano MS, Aflalo TN. Mapping behavioral repertoire onto the cortex. Neuron. 2007;56:239–251. doi: 10.1016/j.neuron.2007.09.013. [DOI] [PubMed] [Google Scholar]
- Hadipour-Niktarash A, Lee CK, Desmond JE, Shadmehr R. Impairment of retention but not acquisition of a visuomotor skill through time-dependent disruption of primary motor cortex. J Neurosci. 2007;27:13413–13419. doi: 10.1523/JNEUROSCI.2570-07.2007. [DOI] [PMC free article] [PubMed] [Google Scholar]
- Hamada M, Strigaro G, Murase N, Sadnicka A, Galea JM, Edwards MJ, Rothwell JC. Cerebellar modulation of human associative plasticity. J Physiol. 2012;590:2365–2374. doi: 10.1113/jphysiol.2012.230540. [DOI] [PMC free article] [PubMed] [Google Scholar]
- Hamada M, Murase N, Hasan A, Balaratnam M, Rothwell JC. The role of interneuron networks in driving human motor cortical plasticity. Cereb Cortex. 2013;23:1593–1605. doi: 10.1093/cercor/bhs147. [DOI] [PubMed] [Google Scholar]
- Heidegger T, Krakow K, Ziemann U. Effects of antiepileptic drugs on associative LTP-like plasticity in human motor cortex. Eur J Neurosci. 2010;32:1215–1222. doi: 10.1111/j.1460-9568.2010.07375.x. [DOI] [PubMed] [Google Scholar]
- Huang VS, Haith A, Mazzoni P, Krakauer JW. Rethinking motor learning and savings in adaptation paradigms: model-free memory for successful actions combines with internal models. Neuron. 2011;70:787–801. doi: 10.1016/j.neuron.2011.04.012. [DOI] [PMC free article] [PubMed] [Google Scholar]
- Jung P, Ziemann U. Homeostatic and nonhomeostatic modulation of learning in human motor cortex. J Neurosci. 2009;29:5597–5604. doi: 10.1523/JNEUROSCI.0222-09.2009. [DOI] [PMC free article] [PubMed] [Google Scholar]
- Kaèar A, Filipoviæ SR, Kresojeviæ N, Milanoviæ SD, Ljubisavljeviæ M, Kostiæ VS, Rothwell JC. History of exposure to dopaminergic medication does not affect motor cortex plasticity and excitability in Parkinson's disease. Clin Neurophysiol. 2013;124:697–707. doi: 10.1016/j.clinph.2012.09.016. [DOI] [PubMed] [Google Scholar]
- Kalaska JF. From intention to action: motor cortex and the control of reaching movements. Adv Exp Med Biol. 2009;629:139–178. doi: 10.1007/978-0-387-77064-2_8. [DOI] [PubMed] [Google Scholar]
- Kang JS, Terranova C, Hilker R, Quartarone A, Ziemann U. Deficient homeostatic regulation of practice-dependent plasticity in writer's cramp. Cereb Cortex. 2011;21:1203–1212. doi: 10.1093/cercor/bhq204. [DOI] [PubMed] [Google Scholar]
- Koch G, Ponzo V, Di Lorenzo F, Caltagirone C, Veniero D. Hebbian and anti-Hebbian spike-timing-dependent plasticity of human cortico-cortical connections. J Neurosci. 2013;33:9725–9733. doi: 10.1523/JNEUROSCI.4988-12.2013. [DOI] [PMC free article] [PubMed] [Google Scholar]
- Komiyama T, Sato TR, O'Connor DH, Zhang YX, Huber D, Hooks BM, Gabitto M, Svoboda K. Learning-related fine-scale specificity imaged in motor cortex circuits of behaving mice. Nature. 2010;464:1182–1186. doi: 10.1038/nature08897. [DOI] [PubMed] [Google Scholar]
- Korchounov A, Ziemann U. Neuromodulatory neurotransmitters influence LTP-like plasticity in human cortex: a pharmaco-TMS study. Neuropsychopharmacology. 2011;36:1894–1902. doi: 10.1038/npp.2011.75. [DOI] [PMC free article] [PubMed] [Google Scholar]
- Krakauer JW, Ghez C, Ghilardi MF. Adaptation to visuomotor transformations: consolidation, interference, and forgetting. J Neurosci. 2005;25:473–478. doi: 10.1523/JNEUROSCI.4218-04.2005. [DOI] [PMC free article] [PubMed] [Google Scholar]
- Kujirai T, Caramia MD, Rothwell JC, Day BL, Thompson PD, Ferbert A, Wroe S, Asselman P, Marsden CD. Corticocortical inhibition in human motor cortex. J Physiol. 1993;471:501–519. doi: 10.1113/jphysiol.1993.sp019912. [DOI] [PMC free article] [PubMed] [Google Scholar]
- Kujirai K, Kujirai T, Sinkjaer T, Rothwell JC. Associative plasticity in human motor cortex during voluntary muscle contraction. J Neurophysiol. 2006;96:1337–1346. doi: 10.1152/jn.01140.2005. [DOI] [PubMed] [Google Scholar]
- Kvitsiani D, Ranade S, Hangya B, Taniguchi H, Huang JZ, Kepecs A. Distinct behavioural and network correlates of two interneuron types in prefrontal cortex. Nature. 2013;498:363–366. doi: 10.1038/nature12176. [DOI] [PMC free article] [PubMed] [Google Scholar]
- Lapray D, Lasztoczi B, Lagler M, Viney TJ, Katona L, Valenti O, Hartwich K, Borhegyi Z, Somogyi P, Klausberger T. Behavior-dependent specialization of identified hippocampal interneurons. Nat Neurosci. 2012;15:1265–1271. doi: 10.1038/nn.3176. [DOI] [PMC free article] [PubMed] [Google Scholar]
- Li CS, Padoa-Schioppa C, Bizzi E. Neuronal correlates of motor performance and motor learning in the primary motor cortex of monkeys adapting to an external force field. Neuron. 2001;30:593–607. doi: 10.1016/S0896-6273(01)00301-4. [DOI] [PubMed] [Google Scholar]
- Li Voti P, Conte A, Rocchi L, Bologna M, Khan N, Leodori G, Berardelli A. Cerebellar continuous theta-burst stimulation affects motor learning of voluntary arm movements in humans. Eur J Neurosci. 2014;39:124–131. doi: 10.1111/ejn.12391. [DOI] [PubMed] [Google Scholar]
- Muellbacher W, Ziemann U, Wissel J, Dang N, Kofler M, Facchini S, Boroojerdi B, Poewe W, Hallett M. Early consolidation in human primary motor cortex. Nature. 2002;415:640–644. doi: 10.1038/nature712. [DOI] [PubMed] [Google Scholar]
- Müller-Dahlhaus F, Ziemann U, Classen J. Plasticity resembling spike-timing dependent synaptic plasticity: the evidence in human cortex. Front Synaptic Neurosci. 2010;2:34. doi: 10.3389/fnsyn.2010.00034. [DOI] [PMC free article] [PubMed] [Google Scholar]
- Müller-Dahlhaus JF, Orekhov Y, Liu Y, Ziemann U. Interindividual variability and age-dependency of motor cortical plasticity induced by paired associative stimulation. Exp Brain Res. 2008;187:467–475. doi: 10.1007/s00221-008-1319-7. [DOI] [PubMed] [Google Scholar]
- Ojakangas CL, Ebner TJ. Scaling of the metrics of visually-guided arm movements during motor learning in primates. Exp Brain Res. 1991;85:314–323. doi: 10.1007/BF00229409. [DOI] [PubMed] [Google Scholar]
- Ojakangas CL, Ebner TJ. Purkinje cell complex spike activity during voluntary motor learning: relationship to kinematics. J Neurophysiol. 1994;72:2617–2630. doi: 10.1152/jn.1994.72.6.2617. [DOI] [PubMed] [Google Scholar]
- Richardson AG, Overduin SA, Valero-Cabré A, Padoa-Schioppa C, Pascual-Leone A, Bizzi E, Press DZ. Disruption of primary motor cortex before learning impairs memory of movement dynamics. J Neurosci. 2006;26:12466–12470. doi: 10.1523/JNEUROSCI.1139-06.2006. [DOI] [PMC free article] [PubMed] [Google Scholar]
- Rosenkranz K, Kacar A, Rothwell JC. Differential modulation of motor cortical plasticity and excitability in early and late phases of human motor learning. J Neurosci. 2007;27:12058–12066. doi: 10.1523/JNEUROSCI.2663-07.2007. [DOI] [PMC free article] [PubMed] [Google Scholar]
- Rossi S, Hallett M, Rossini PM, Pascual-Leone A. Safety, ethical considerations, and application guidelines for the use of transcranial magnetic stimulation in clinical practice and research. Clin Neurophysiol. 2009;120:2008–2039. doi: 10.1016/j.clinph.2009.08.016. [DOI] [PMC free article] [PubMed] [Google Scholar]
- Shadmehr R, Krakauer JW. A computational neuroanatomy for motor control. Exp Brain Res. 2008;185:359–381. doi: 10.1007/s00221-008-1280-5. [DOI] [PMC free article] [PubMed] [Google Scholar]
- Shenoy KV, Sahani M, Churchland MM. Cortical control of arm movements: a dynamical systems perspective. Annu Rev Neurosci. 2013;36:337–359. doi: 10.1146/annurev-neuro-062111-150509. [DOI] [PubMed] [Google Scholar]
- Sonoo M, Kobayashi M, Genba-Shimizu K, Mannen T, Shimizu T. Detailed analysis of the latencies of median nerve somatosensory evoked potential components: 1. Selection of the best standard parameters and the establishment of normal values. Electroencephalogr Clin Neurophysiol. 1996;100:319–331. doi: 10.1016/0168-5597(96)95035-2. [DOI] [PubMed] [Google Scholar]
- Stagg CJ, Bachtiar V, Johansen-Berg H. The role of GABA in human motor learning. Curr Biol. 2011;21:480–484. doi: 10.1016/j.cub.2011.01.069. [DOI] [PMC free article] [PubMed] [Google Scholar]
- Stefan K, Kunesch E, Cohen LG, Benecke R, Classen J. Induction of plasticity in the human motor cortex by paired associative stimulation. Brain. 2000;123:572–584. doi: 10.1093/brain/123.3.572. [DOI] [PubMed] [Google Scholar]
- Stefan K, Kunesch E, Benecke R, Cohen LG, Classen J. Mechanisms of enhancement of human motor cortex excitability induced by interventional paired associative stimulation. J Physiol. 2002;543:699–708. doi: 10.1113/jphysiol.2002.023317. [DOI] [PMC free article] [PubMed] [Google Scholar]
- Stefan K, Wycislo M, Classen J. Modulation of associative human motor cortical plasticity by attention. J Neurophysiol. 2004;92:66–72. doi: 10.1152/jn.00383.2003. [DOI] [PubMed] [Google Scholar]
- Stefan K, Wycislo M, Gentner R, Schramm A, Naumann M, Reiners K, Classen J. Temporary occlusion of associative motor cortical plasticity by prior dynamic motor training. Cereb Cortex. 2006;16:376–385. doi: 10.1093/cercor/bhi116. [DOI] [PubMed] [Google Scholar]
- Stinear JW, Hornby TG. Stimulation-induced changes in lower limb corticomotor excitability during treadmill walking in humans. J Physiol. 2005;567:701–711. doi: 10.1113/jphysiol.2005.090654. [DOI] [PMC free article] [PubMed] [Google Scholar]
- Voytovych H, Kriváneková L, Ziemann U. Lithium: a switch from LTD- to LTP-like plasticity in human cortex. Neuropharmacology. 2012;63:274–279. doi: 10.1016/j.neuropharm.2012.03.023. [DOI] [PubMed] [Google Scholar]
- Wolters A, Sandbrink F, Schlottmann A, Kunesch E, Stefan K, Cohen LG, Benecke R, Classen J. A temporally asymmetric Hebbian rule governing plasticity in the human motor cortex. J Neurophysiol. 2003;89:2339–2345. doi: 10.1152/jn.00900.2002. [DOI] [PubMed] [Google Scholar]