

Abstract
Tight coupling between Ca2+ channels and the sensor for vesicular transmitter release at the presynaptic active zone (AZ) is crucial for high-fidelity synaptic transmission. It has been hypothesized that a switch from a loosely coupled to a tightly coupled transmission mode is a common step in the maturation of CNS synapses. However, this hypothesis has never been tested at cortical synapses. We addressed this hypothesis at a representative small cortical synapse: the synapse connecting mouse cerebellar cortical parallel fibers to Purkinje neurons. We found that the slow Ca2+ chelator EGTA affected release significantly stronger at immature than at mature synapses, while the fast chelator BAPTA was similarly effective in both groups. Analysis of paired-pulse ratios and quantification of release probability (pr) with multiple-probability fluctuation analysis revealed increased facilitation at immature synapses accompanied by reduced pr. Cav2.1 Ca2+ channel immunoreactivity, assessed by quantitative high-resolution immuno-electron microscopy, was scattered over immature boutons but confined to putative AZs at mature boutons. Presynaptic Ca2+ signals were quantified with two-photon microscopy and found to be similar between maturation stages. Models adjusted to fit EGTA dose–response curves as well as differential effects of the Ca2+ channel blocker Cd2+ indicate looser and less homogenous coupling at immature terminals compared with mature ones. These results demonstrate functionally relevant developmental tightening of influx-release coupling at a single AZ cortical synapse and corroborate developmental tightening of coupling as a prevalent phenomenon in the mammalian brain.
Keywords: calcium channels, calcium chelators, coupling, presynaptic calcium, release probability, short-term plasticity
Introduction
Synaptic transmission has a supralinear dependency on the intracellular Ca2+ concentration ([Ca2+]i; Dodge and Rahamimoff, 1967), making the coupling distance between voltage-gated Ca2+ channels (Cavs) and release sensor a critical determinant of timing and probability of transmitter release (Neher, 1998b; Wadel et al., 2007; Bucurenciu et al., 2008; Neher and Sakaba, 2008; Eggermann et al., 2012; Kim et al., 2013; Südhof, 2013). Despite its functional importance, little is known about the regulation of coupling (Eggermann et al., 2012). For the glutamatergic calyx of Held synapse in the brainstem a developmental regulation of coupling has been suggested, switching an immature loose coupling to a more mature tight coupling (Fedchyshyn and Wang, 2005; Wang et al., 2008; Leão and von Gersdorff, 2009). However, direct evidence from other synapses, in particular small cortical synapses, for such regulation is lacking (Eggermann et al., 2012). Moreover, recent reports of tight coupling at the GABAergic synapse connecting neighboring Purkinje neurons (PNs) in the immature cerebellar cortex (Bornschein et al., 2013) and of loose coupling at the glutamatergic synapse connecting mossy fibers (MFs) to CA3 pyramidal neurons in mature hippocampus (Vyleta and Jonas, 2014) may indicate differential, synapse-specific development of coupling. However, the developmental profile of coupling has not been assessed at PN-to-PN or at MF-to-CA3 synapses. The PN-to-PN synapse is developmentally transient (Orduz and Llano, 2007; Watt et al., 2009) and may have reached a tight coupling operation mode already early during postnatal development. The finding of loose coupling (∼75 nm) at mature MF-to-CA3 synapses does not rule out that immature synapses operate at an even larger coupling distance. Thus, the question if developmental tightening of coupling is indeed a critical step in cortical synapse maturation is unresolved.
To address this question, we focused on the most frequent synapse in the cerebellar cortex, the parallel fiber (PF)-to-PN synapse. This synapse is remarkably different from the large calyx or MF type synapses, harboring typically a single active zone (AZ) only (Xu-Friedman et al., 2001). It operates in tight coupling mode in mature mice (∼24 nm; Schmidt et al., 2013), but it is unknown if coupling changes developmentally. The defining feature distinguishing loose from tight coupling is that the fast exogenous Ca2+ chelator BAPTA exerts similar effects on release in both coupling regimes, while the slow but similarly affine chelator EGTA is far more effective at loosely coupled than at tightly coupled synapses (Adler et al., 1991; Ohana and Sakmann, 1998; Neher, 1998a; Hefft and Jonas, 2005; Bucurenciu et al., 2008; Eggermann et al., 2012; Schmidt et al., 2013; Vyleta and Jonas, 2014).
Here we report that EGTA was much more effective in interfering with release at young PF synapses than at adult ones, while the fast chelator BAPTA was similarly effective in both age groups. These data suggest that the Ca2+ influx-release coupling undergoes substantial tightening during postnatal PF maturation. Consistently, Cav2.1 immunoreactivity became confined to the AZ during development, while presynaptic Ca2+ signals were not different between age groups. During development, pr increased and paired-pulse ratio (PPR) decreased, which is remarkably opposite to functional developmental alterations reported for the calyx of Held and neocortical synapse (Feldmeyer and Radnikow, 2009).
Materials and Methods
Slice preparation and electrophysiology
C57BL/6 mice of either sex (P8–P10 or P21–P24) were decapitated under deep isoflurane (Curamed) inhalation anesthesia; the cerebellar vermis region was excised rapidly and placed in cooled (0−4°C) artificial cerebro-spinal fluid (ACSF) containing the following (in mm): 125 NaCl, 2.5 KCl, 1.25 NaH2PO4, 25.6 NaHCO3,1 MgCl2, 2 CaCl2, and 20 glucose, equilibrated with 95% O2 and 5% CO2, pH 7.3–7.4. Parasagittal slices (150 μm thick) were prepared with an HM 650 V vibratome (Microm) and slices were stored at 35°C for 30 min. Subsequently, they were transferred to a recording chamber continuously perfused at 3 ml/min by ACSF supplemented with 10 μm gabazine (SR-95531). Recordings were performed at 33 ± 2°C. Unless stated otherwise, chemicals were from Sigma-Aldrich.
Patch pipettes were prepared from borosilicate glass (Hilgenberg) with a PC-10 puller (Narishige) and had final resistances of ∼5 MΩ for whole-cell recordings from PNs and ∼8MΩ for recordings form granule cells (GCs). The pipette solution contained the following (in mm): 150 K-gluconate, 10 NaCl, 3 Mg-ATP, 0.3 Na-GTP, 0.05 EGTA, and 10 HEPES, dissolved in purified water. The pH was adjusted to 7.3 with KOH.
Whole-cell patch-clamp recordings were performed under optical control (BX51WI; Olympus), using an EPC10 amplifier and Patchmaster 2.69 software (HEKA). EPSCs were recorded from PNs at a holding potential (Vhold) of −80 mV (corrected for the liquid junction potential), filtered at 5 kHz, and sampled at 10 kHz. Series resistance (Rs) and holding current (Ihold) were monitored continuously. Experiments were rejected if Rs (typically in the range of 10–25 MΩ; 50% compensation) exceeded 30 MΩ or if Ihold fell below −400 pA. Extracellular PF stimulation (150 μs bipolar pulse) was performed with ACSF-filled theta glass pipettes using an ISO-Stim 01 DPI (NPI Electronics).
EPSCs were evoked every 10 s for 50 min by extracellular stimulation of PF tracts (Fig. 1). For chelator-acetoxymethyl-ester (AM) experiments stimulus strength was adjusted to yield initial EPSC amplitudes of ∼400 pA. The faster decay kinetics of somatically recorded EPSCs in young PNs (Fig. 1B,C) is most probably a result of better space-clamp conditions arising from smaller dendritic trees of immature PNs (Roth and Häusser, 2001). The time courses of chelator effects on EPSC amplitudes (Fig. 1B–D) were analyzed by binning EPSC amplitudes within 2 min intervals of recording time to average amplitude.
Figure 1.

Ca2+ chelator effects suggest developmental tightening of coupling. A, Recording scheme: EPSCs were evoked in whole-cell patch-clamped PNs by extracellular stimulation of PF tracts in acute slices. B, Examples of recordings from PF-PN connections in young slices (2 min binning). Following baseline recordings (10 min), slices were incubated for 30 min (bars) in 10 μm EGTA-AM (blue), 10 μm BAPTA-AM (red), or ACSF supplemented only with DMSO/Pluronic (control, black). Incubation was followed by a 10 min washout. Insets, Average EPSCs during baseline and washout. C, As in B but for adult connections. D, Average data (mean ± SEM) recorded from young and adult connections. Data were normalized to the average EPSC amplitude during baseline. E, Summary of chelator-AM-induced EPSC reductions. EPSC amplitudes from D were averaged over the 10 min washout period and normalized to the average control amplitude (n as in D).
We used the established approach of reducing transmitter release with the Ca2+ chelators EGTA [KD 70 nm, kon 107 m−1 s−1 (Nägerl et al., 2000) or KD 180 nm, kon 2.7*106 m−1 s−1 (Naraghi, 1997)] and BAPTA [KD 220 nm, kon 4*108 m−1 s−1 (Naraghi and Neher, 1997) or KD 176 nm, kon 4.5*108 m−1 s−1 (Naraghi, 1997)]. PF synapses were loaded with the exogenous chelators by bath application of their membrane-permeant AM variants (Atluri and Regehr, 1996; Matsui and Jahr, 2003; Hefft and Jonas, 2005). Following 10 min of baseline recordings in normal ACSF, the bath solution was exchanged for ACSF containing either 0.1% DMSO and 0.01% Pluronic (control solution) or EGTA-AM in DMSO/Pluronic or BAPTA-AM in DMSO/Pluronic for 30 min (incubation period) and thereafter replaced by normal ACSF again for another 10 min (test period). After the 30 min incubation time, the intracellular chelator concentration will substantially exceed the bath concentration due to continuous intracellular accumulation (Tsien, 1981; Atluri and Regehr, 1998). Final BAPTA-AM solubility was limited to ∼10 μm (Invitrogen) at near physiological temperature. Attempts to prepare higher concentrated solutions resulted in precipitations, identified as small crystals by microscopic inspection. Use of higher concentrations of DMSO (0.5%) and Pluronic (0.05%) did not result in increased solubility, and use of BAPTA-AM solutions with precipitations did not lead to further EPSC amplitude reductions than observed with 10 μm BAPTA-AM.
Estimating quantal synaptic parameters
Quantal synaptic parameters were determined from EPSCs recorded at different [Ca2+]e (1–8 mm, ≥30 repetitions per concentration) with a 5 s or 10 s interval between successive stimulations (Schmidt et al., 2013). In young animals 2 mm tetraethylammonium (TEA) was added to the bath in some experiments to maximize action potential (AP)-evoked Ca2+ influx and transmitter release. To reduce possible effects of postsynaptic receptor saturation (Foster et al., 2005), the ACSF routinely contained 2 mm of the low-affinity AMPA receptor antagonist γ-d-glutamylglycine (γ-DGG; Abcam).
For multiple-probability fluctuation analysis (MPFA), which assumes general applicability of binominal statistics and corrects for nonuniform quantal size (Quastel, 1997; Silver et al., 1998; Clements and Silver, 2000; Scheuss et al., 2002; Silver, 2003; Saviane and Silver, 2006), variances (σ2) were plotted against mean EPSC amplitudes (I) and fitted by a parabola of the form:
 |
with q being the quantal size, N a binominal parameter indicating the number of release sites or releasable vesicles, and CVI and CVII the coefficients of intrasite and intersite quantal variability, assumed to be 0.3 (Clements and Silver, 2000). It was previously shown that variation of the CV values over a broad range has only minor effects on the estimate of pr at PF synapses (Valera et al., 2012; Schmidt et al., 2013). MPFA data were analyzed with custom-written routines in Igor Pro 6 (WaveMetrics) and are shown as variance versus mean with the variance of the variance as error bars.
SDS-digested freeze-fracture replica immunolabeling and quantitative analysis
SDS-digested freeze-fracture replica immunolabeling.
Immunolabeling of freeze-fractured replicas was performed as described previously (Kulik et al., 2006). Six wild-type mice were used (n = 4, P8; n = 2, P21). Care and handling of the animals before and during experimental procedures followed European Union regulations and were approved by the animal care and use committees of the authors' institutions. Animals were anesthetized by isoflurane (Forene; AbbVie) and their brains were quickly removed and incubated overnight at 4°C in a fixative containing 2% paraformaldehyde and 15% picric acid in 0.1 m phosphate buffer, pH 7.4. Using a vibratome (VT1000S; Leica), sections of cerebella were cut transversally at a thickness of 110 μm. Slices were cryoprotected in a solution containing 30% glycerol and then frozen by a high-pressure freezing device (HPM 100l Leica). Frozen samples were fractured in a double-replica table at −130°C and replicated by rotating carbon deposition (5 nm thick), stationary platinum (2 nm), and rotating carbon (18 nm) in a freeze-fracture replica system (BAF 060; BAL-TEC). Replicas were then incubated in a digestion buffer containing 2.5% SDS and 20% sucrose in 15 mm Tris-HCl, pH 8.3, at 80°C for 18 h. Replicas were washed in 50 mm TBS containing 0.05% BSA (Roth) and 0.1% Tween 20 (Tw20; Roth) and then incubated in a blocking solution containing 5% BSA and 0.1% Tw20 diluted in 50 mm TBS for 1 h. Subsequently, replicas were incubated in one of the following mixtures of primary antibodies: (1) Cav2.1 [guinea pig (Gp); 5.5 μg/ml] and RIM1/2 [Rabbit (Rb); 1 μg/ml; Synaptic System], (2) Cav2.1 (Gp) and VGluT1 (Rb; 3 μg/ml), and (3) Cav2.1 (Gp) and VGluT2 (Rb; 0.9 μg/ml) made up in 50 mm TBS containing 1% BSA and 0.1% Tw20 overnight (O/N) at room temperature. After several washes, replicas were reacted with a mixture of gold-coupled 10 nm goat anti-guinea pig IgG and 15 nm goat anti-rabbit IgG secondary antibodies (1:30; BioCell Research Laboratories) made up in 50 mm TBS containing 5% BSA O/N at 15°C. The labeled replicas were examined using a transmission electron microscope (Philips CM100) and VGluT1-positive (P21) or VGluT2-positive (P8) varicosities were photographed at a magnification of 8900×. Putative presynaptic active zones were assessed by a high density of intramembrane particles on the protoplasmic face of the examined profiles and/or by a clear invagination of the membrane area.
Quantitative analysis.
Based on the location of the Cav2.1 channels in relation to putative synaptic membranes, double-labeled PF varicosities (Cav2.1-VGluT2, n = 182 or Cav2.1-VGluT1, n = 242) were grouped into synaptic (within the AZ), extrasynaptic (outside AZ), and synaptic–extrasynaptic categories. Statistics is based on two animals in each age group.
Fluorescence imaging
Ca2+ imaging experiments of PF boutons were performed as described previously (Schmidt et al., 2013). GCs were filled for 20 min with EGTA-free, Fluo-5F, and Alexa 594-containing (200 and 50 μm, respectively; Invitrogen) pipette solution via somatic whole-cell patch pipettes. Experiments were performed between 20 and 40 min whole-cell time. Presynaptic fluorescence transients were elicited by somatically induced APs (50–120 pA, 1 ms current injection; bridge mode, Vmem −70 to −80 mV, Ihold < 50 pA) and recorded in line scans with a custom-built two-photon microscope based on a FluoView 300 scanner (Olympus); a 60×/0.9 NA objective; a mode-locked Ti:sapphire laser (Tsunami; Newport-Spectra Physics, set to a center wavelength of 810 nm); and a Pockels cell (350–80 KDP*; Conoptics). Each bouton was recorded three times. The fluorescence signals were filtered (HC647/75; Semrock HC525/50, 720-SP, AHF), detected by two external PMT modules (H7422-40, Hamamatsu; PMT-02M/PMM-03, NPI Electronics; monitoring epifluorescence and transfluorescence, respectively), and digitized with the FluoView system. The Ca2+-dependent green fluorescence was normalized to the Ca2+-insensitive red fluorescence and expressed as background-corrected ΔG/R (Sabatini et al., 2002).
Loading of slices with calcein-AM (Invitrogen) dissolved in ACSF, 0.1% DMSO, and 0.01% Pluronic was performed as described above for chelator-AM compounds, except that during the 30 min incubation no continuous perfusion was performed. Instead the bathing solution was directly gassed. Following incubation, calcein-containing bath solution was exchanged for normal ACSF and fluorescence z-stacks were taken with the above-described instruments from two regions of interest per slice with 2 μm steps.
Analytical model
Effects of exogenous Ca2+ chelators on release ratio (R) were simulated (Mathematica 9.0; Wolfram Research) using steady-state solutions to the linearized reaction-diffusion equations for (1) vesicles coupled to a single influx site (Model 1), (2) vesicles embedded in a cluster of channels (Model 2), or (3) two vesicle pools coupled at different distances to influx sites (Model 3; Neher, 1998a):
 |
 |
 |
 |
 |
where d (all models) is the coupling distance between a vesicle and its closest channel, r1, is the spacing between channels (Model 2) and r2 the radius of the channel cluster (Model 2). DCa is the diffusion coefficient of Ca2+ of 223 μm2/s (Allbritton et al., 1992) and λ is the diffusion length constant for control (λC) or with exogenous buffer added (λB). BPC = kon BC is the buffer product in the absence of added chelator, assuming that calretinin (CR) is the dominating endogenous buffer (Schmidt et al., 2013) with an apparent kon = (kon,T kon,R)1/2 of 2.36 107 m−1 s−1 (Faas et al., 2007), concentration BC of 84 μm, and a buffer capacitance (κ) of 60 (Brenowitz and Regehr, 2007). KD is the dissociation constant of added EGTA or BAPTA (see above). In Model 3 the parameters a and (1 − a) represent the fractions of vesicles coupled with d1 or d2 to channels, respectively. The equations are based on several standard assumptions, including constant concentrations of free buffers due to rapid diffusion (Neher, 1998a). The parameter n captures the power-law dependency of release on Ca2+ and was set to four (Dodge and Rahamimoff, 1967).
The models have previously proven valuable in describing buffer effects on transmitter release and for estimating coupling distances (Neher, 1998b; Bucurenciu et al., 2008; Schmidt et al., 2013). They require estimates of intracellular Ca2+ chelator concentrations that were derived as follows: the coupling distance in adults is homogenous and well described by models with a coupling distance of 24 nm (Schmidt et al., 2013), a situation reflected by Model 1. The parameter d was set to 24 nm and the adult EGTA dose–response curve was fitted by Model 1 with the extracellular EGTA concentration as an independent variable multiplied by a loading factor (LF; representing the loading efficacy of extracellularly applied AM esters) as fit parameter (Fig. 7C). The fit estimate for this LF was 15 or 42 for kon,EGTA = 107 m−1 s−1, KD,EGTA = 70 nm (Nägerl et al., 2000) or kon,EGTA = 2.7*106 m−1 s −1, KD,EGTA 180 nm (Naraghi, 1997), respectively. Subsequently, EGTA-induced release reductions recorded from young synapses were plotted against the estimated intracellular EGTA concentration, assuming that loading is similar to the adult, an assumption that appears justified in light of the experiments with calcein-AM (Fig. 2). Subsequently these data were fitted with Models 1–3 with d and r values as fitting parameters. A free fit of Model 2 or Model 3 (Fig. 7) yielded good descriptions of the data but required values for r2 or d2, respectively, that were larger than the physical size of the AZ (Fig. 5), indicating that at young synapses channels outside the AZ contributed to release. Constraining r2 or d2 in Model 2 or Model 3, respectively, to 250 nm (compare Figs. 5, Fig. 8, calretinin, constrained models) still yielded better descriptions of the data than the homogenous coupling model, with Model 3 giving the best fit. Fit parameters are given in Figures 7 and 8.
Figure 7.
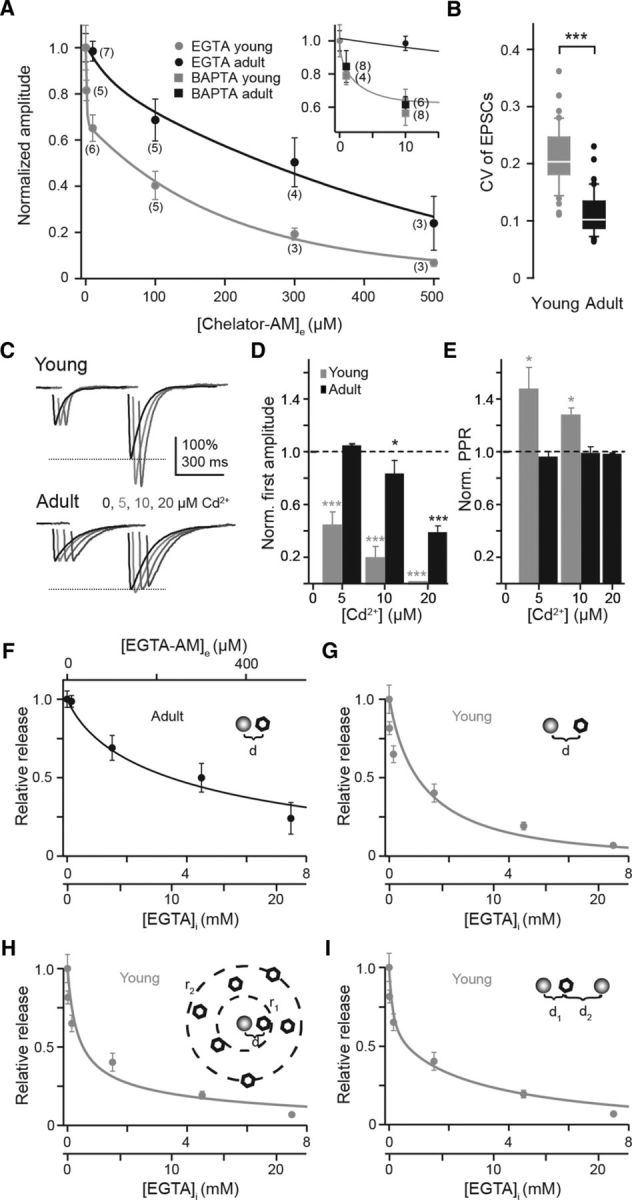
Chelator-AM dose–response curves quantify looser coupling at young PF terminals. A, EGTA-AM (circles) dose–response curves (mean ± SEM) of young (gray) and adult (black) connections. Data points were calculated from EPSCs recorded during the 10 min washout period following 30 min of chelator-AM application (compare Fig. 1). Lines represent exponential (black) or biexponential (gray) fits. Inset, Expanded curves with BAPTA-AM data (squares) included. B, CV of EPSC amplitudes in adult (black, n = 42) and young (gray, n = 40). C, Example EPSCs (average of 10 traces each) recorded from a young (top) or adult (bottom) PN during PF paired-pulse stimulation (50 ms ISI) showing the effect of the indicated concentrations of extracellularly applied Cd2+ (different shades of gray; 0 = control, black; traces were offset in time to each other for clarity) on the PPR. EPSCs are normalized to the first amplitude. The dashed line indicates the amplitude of the second EPSC recorded under control conditions. Note that the PPR increased in the presence of Cd2+ in the young cell but remained unaltered in the adult one. D, E, Bar graphs summarizing the effect of Cd2+ on the amplitude of the first EPSC (D) and the PPR (E) in young (gray; n = 6; EPSCs: ***p < 0.001; PPR: *p = 0.013 or 0.041) and adult (black; n = 4; EPSCs: *p = 0.04, ***p < 0.001; PPR: p = 0.91). Values (mean ± SE) were normalized to control values (dashed lines). EPSCs were completely blocked by 20 μm Cd2+ in the young, preventing the calculation of PPR for this concentration. F, Data from the adult from A fitted (black) by Model 1 with d set to 24 nm and an EGTA-AM LF as variable. The bottom x-axis has a dual scale according to estimates of intracellular EGTA concentrations obtained with different LFs of 15 or 42 that result from different published values for kon,EGTA and KD,EGTA (see Materials and Methods). G, Data from young animals in A were plotted against estimated intracellular EGTA concentration (cf. text and F) and fitted (gray) by Model 1 with d as a variable. The fit gave an estimate for d of 60 nm. With the two different EGTA-dependent LFs the fit curves completely overlapped with identical estimates of d. H, Data from the young as in G fitted with a channel-cluster model (Model 2; d = 23 nm, r1 = 176 nm, r2 = 1.3 μm). I, As in G but for a two-vesicle pool model (Model 3; d1 = 35 nm, d2 = 570 nm, a = 0.48 or 0.61 for LF = 15 or 42, respectively).
Figure 2.

Comparable AM-based loading in young and adult tissue. Background-corrected fluorescence intensities (ADU, arbitrary digital units) versus depth from slice surface in the molecular layer from young and adult mice (gray and black, respectively; mean and 95% confidence intervals, n = 6 each, p = 1.0). Slices were incubated for 30 min with the fluorescent dye calcein-AM (10 μm). Fluorescence measurements were performed 10 min after washout of the dye.
Figure 5.
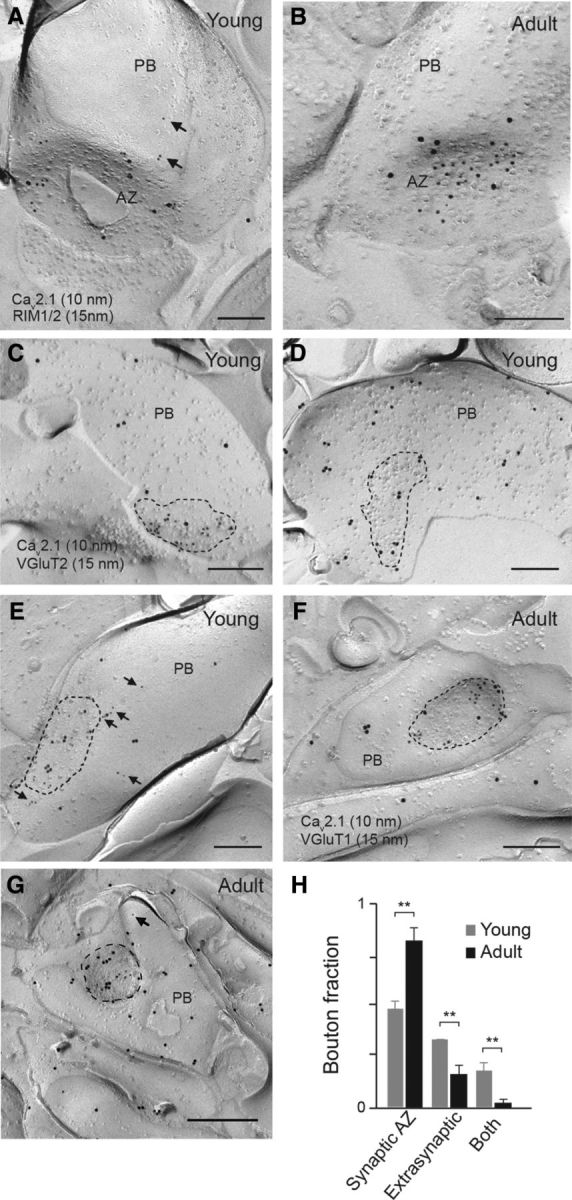
Developmental focusing of Cav2.1 immunoreactivity to the AZ of parallel fiber boutons. A, B, Electron micrographs showing the colocalization of Cav2.1 (10 nm gold particles) and the presynaptic AZ proteins RIM1/2 (15 nm particles) in the presynaptic plasma membrane of parallel fiber boutons (PB) from young (P8, A) and adult (P21, B) mice, as assessed by the SDS-FRL. Cav2.1 labeling was observed mostly at the presynaptic membrane specialization, i.e., at putative AZs (A, B) and, in the case of young animals, also outside the AZ (A, arrows). C–G, Immunolabeling for Cav2.1 (10 nm particles) and VGluT1 (adult) or VGluT2 (young; 15 nm particles) on the protoplasmic face of young (C–E) and adult (F, G) PB. Clusters (C) or isolated (D) immunoparticles for Cav2.1 were observed at putative AZs (dashed lines) but also outside (E, arrows) of AZs in young mice, whereas in adult boutons (F, G) virtually all Cav2.1 channels were detected at AZs and particles were only rarely seen extrasynaptically (arrow in G). H, Fractions of VGluT-positive young (gray, n = 182, 2 animals) and adult (black, n = 242, 2 animals) boutons showing Cav2.1 immunoreactivity exclusively inside (synaptic AZ; p = 0.003), outside (extrasynaptic; p = 0.004), or inside and outside (both; p = 0.002) of putative AZs. Note that the AZ fraction substantially increased with synapse maturation. Scale bars: A–G, 200 nm.
Figure 8.

Model variants show looser coupling in young animals. Fits of Models 1–3 to the EGTA dose–response data (Fig. 7) from young connections. The model conditions were varied as indicated in the left column by using calretinin alone, or calretinin plus an unknown buffer (Schmidt et al., 2013), or only an unidentified buffer (Sabatini and Regehr, 1998) as endogenous Ca2+ buffer (cf. Material and Methods for buffer parameters). The intracellular EGTA concentrations were estimated by first deriving the AM LF by fitting data from the adult as in Figure 7F. Models were either run unconstrained or using the estimated size of 250 nm of the AZ as constraint. The lower row shows a summary of the best-fit parameters derived by Models 1 (left), 2 (middle, open symbols show results from constrained fits), or 3 (right; for clarity only results obtained with the parameters for EGTA given by Nägerl et al. (2000) are shown). Note that regardless of model details increased distances are predicted for at least a fraction of release-relevant channel to vesicle distances.
The steady-state buffer capacity [κ = (KD,EGTA*[EGTA]/(Ca + KD,EGTA)2] (Neher and Augustine, 1992) of added EGTA was estimated for Ca2+ concentrations (Ca) at rest and at the peak of an AP (45 and 200 nm, respectively; Schmidt et al., 2013). The total intracellular EGTA concentrations ([EGTA]) were estimated as the product of LF and EGTA-AM concentration.
We tested variations of the unconstrained and constrained models (Fig. 8) by including a buffer with kon of 5*108 m−1 s−1 and κ of 30 and reducing the CR concentration correspondingly to keep total κ at 60 (“calretinin + unknown buffer”; Brenowitz and Regehr, 2007; Schmidt et al., 2013) or by replacing CR by a single endogenous buffer species with kon of 1*108 m−1 s−1, free concentration BWT of 2 mm and κ of 40 (“unidentified buffer”; Sabatini and Regehr, 1998). These variations yielded higher estimates of intracellular EGTA (LF of 17.8 or 71.8, respectively) but otherwise qualitatively similar results with respect to the conclusion about coupling distances and inhomogeneity in young synapses.
Statistics
Unless stated otherwise, data are presented as box-and-whisker plots with outliers. Boxes show median and interquartile ranges (IQRs). Whiskers show the 90 and 10% percentiles. Normally distributed data were compared with the t test (two groups) or an ANOVA (more than two groups). Non-normally distributed data were compared with the Wilcoxon–Mann–Whitney rank sum test (two groups) or an ANOVA on ranks (more than two groups). If datasets consisted of preapplication and postapplication data from the same cells the paired t test, signed rank sum test, or ANOVA repeated-measures were used. *p ≤ 0.05, **p ≤ 0.01, or ***p ≤ 0.001, respectively. Statistics were performed with Sigma Plot 11.0 (Dundas Software).
Results
Exogenous chelators differentially affect release at young and adult synapses
If coupling changes from loose to tight during PF-PN synapse maturation, one would expect BAPTA and EGTA to affect release from young boutons to the same extent, whereas release from more mature boutons should be affected predominantly by BAPTA and substantially less by EGTA. Indeed we observed that at young (P8–P10) connections a 30 min application of 10 μm membrane-permeant EGTA-AM or BAPTA-AM was similarly effective in significantly reducing the amplitudes of EPSCs (by 32 ± 5%, mean ± SEM and 40 ± 7%, respectively, p = 0.3 for EGTA vs BAPTA; p = 0.002 or <0.001 for EGTA or BAPTA vs control, respectively; Fig. 1). In contrast, at more mature synaptic connections (P21–P24, “adult”), 10 μm EGTA-AM had no effect on EPSC amplitudes compared with control (p = 0.9) while BAPTA-AM caused a significant amplitude reduction (by 33 ± 4%; p = 0.001) similar to that seen in young connections.
Comparing AM-based loading in young and adult tissue assumes that the loading efficacy is comparable at both age groups. We analyzed the time courses of chelator effects in both age groups by fitting exponential functions to the EPSC amplitudes. In young synapses, EPSC reductions reached a stable plateau with time constants (τ) of 6.2 ± 1.2 and 6.9 ± 2.4 min in the presence of 10 μm BAPTA-AM and 10 μm EGTA-AM (p = 0.75), respectively. At adult synapses τ was not different from these values (7.2 ± 1.6 min for 10 μm BAPTA-AM; p = 0.64), indicating that chelator concentrations reached saturating levels in equal times in both age groups. To further address this point slices were loaded with the dye calcein-AM. This dye only becomes fluorescent upon intracellular cleavage of its ester group making it an ideal indicator for AM-based accumulation in the cytosol (Chiu and Haynes, 1977). Fluorescence intensities sampled in the molecular layer were indistinguishable for young and adult slices in all imaging depths (0 to 60 μm; n = 6 each; p = 1.0; Fig. 2). These findings indicate that AM-based loading and de-esterification were indeed comparable for P8–P10 and P21–P24 slices, both with respect to the loading time course and the final intrasynaptic chelator concentration. Consequently, the observed differential effects of EGTA and BAPTA on EPSC amplitudes are in line with tight coupling in adult boutons (Schmidt et al., 2013) and suggest a significantly looser coupling in young boutons.
Developmental tightening of coupling is associated with altered short-term plasticity and release probability
Functionally a larger channel to sensor distance predicts a reduced pr at immature as compared with mature synapses. The EPSC PPR (PPR = EPSC2/EPSC1) comprises information about pr since, provided quantal size (q) remains unaltered, PPR is given by pr2/pr1 if vesicle replenishment is complete between pulses or otherwise by pr2/pr1 (1 − pr1 + F pr1) if fraction F is replenished (Valera et al., 2012). The PPR at young connections (2.2 (1.9–2.6)) was found to be indeed significantly larger than in adults (1.9 (1.8– 2.0); p = 0.003; Fig. 3A,B). The slopes of linear fits to the steady-state phases of cumulative EPSC amplitude plots from 100 Hz trains of synaptic activations (4 mm [Ca2+]e) were used to estimate replenishment rates. The extrapolated y-axis intercept of these fits is an index of the initial size of the ready-releasable pool (RRP) of vesicles (Schneggenburger et al., 1999). Following normalization to the amplitude of the first EPSC, these y-axis intercepts contain information related to the size of the RRP also in compound stimulations (Valera et al., 2012). We found that the slopes of the fits were not different between maturation stages [slopeadult = 0.09 ± 0.003 ms−1 (n = 11), slopeyoung = 0.09 ± 0.009 ms−1 (n = 9); p = 0.54; Fig. 3C–E], while their extrapolated y-intercept values were smaller for mature than for immature synapses (y-interceptadult = 4.7 ± 0.5, y-interceptyoung = 9.9 ± 1.1, p = 0.004). The estimates of slopes and y-intercepts are in line with previous estimates at PF synapses (Valera et al., 2012). The slope estimates indicate that altered replenishment is not responsible for increased PPR at young connections. The y-intercepts at young synapses well match with the approximately eight docked vesicles found at single AZs of young PF synapses (Xu-Friedman et al., 2001). At mature synapse the y-intercept value is consistent with the binominal parameter N of ∼3 reported for adult PF synapses (Schmidt et al., 2013). These findings indicate that the size of the RRP declines during development, which is different from the maturation of the calyx of Held, where the 100 Hz train y-axis intercept increases developmentally (Taschenberger and von Gersdorff, 2000).
Figure 3.
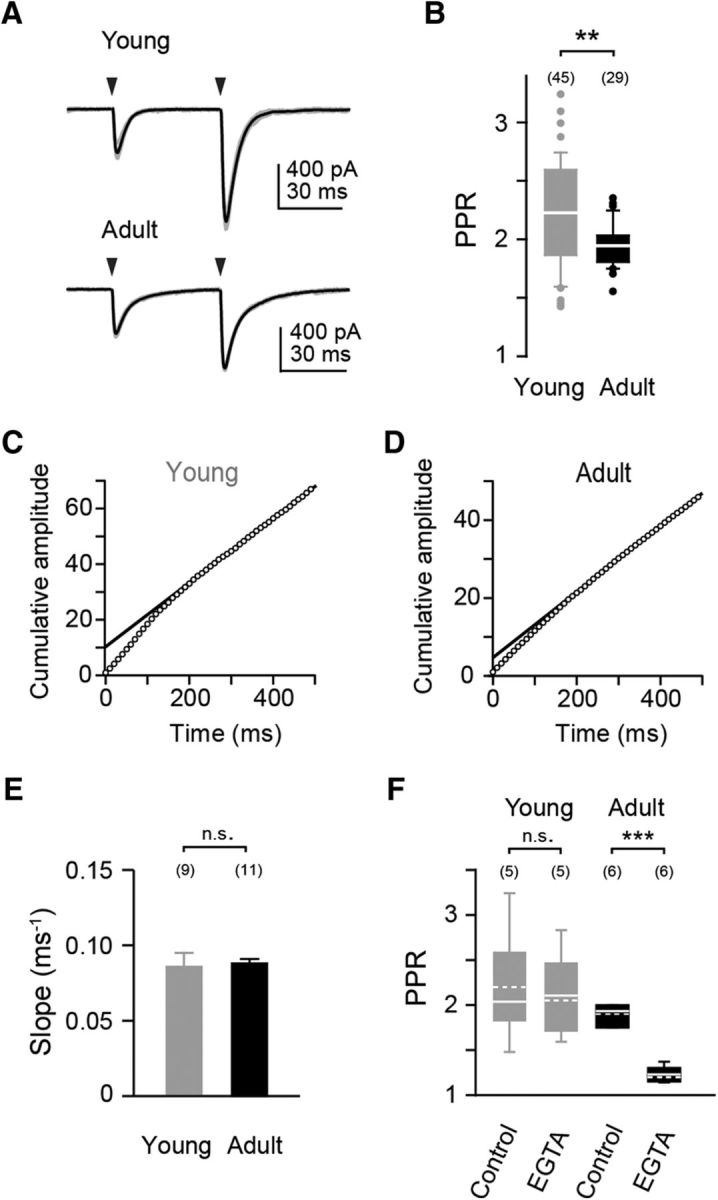
Short-term plasticity and vesicle replenishment in young and adult PF synapses. A, Examples of PPF in young and adult synapses [averages (black) of five repeats (gray)]. The arrowhead denotes the time point of stimulation. B, Box-and-whisker plot summarizing the PPR data. Median and IQR, outliers are denoted by points. The number of cells is denoted in parentheses. C, Cumulative EPSC amplitudes during a 100 Hz train of synaptic activation. Example recording from a young mouse. Data were normalized to the amplitude of the first EPSC. The solid line represents a linear fit to the steady-state phase (200–500 ms; slope = 0.1, y-intercept = 10) of the cumulative current. D, Same as in C but in a recording from an adult mouse (slope = 0.08, y-intercept = 5). E, Bar graph of slope values in young (n = 9, gray) and adult (n = 11, black) mice. F, Bar graph summarizing PPRs in recordings from young and adult mice before (control) and after application of 100 μm EGTA-AM (***p < 0.001). Solid and dashed lines indicate median and mean values, respectively.
Incubation with EGTA-AM significantly reduced the PPR at adult (from 1.9 ± 0.05 to 1.2 ± 0.04, preapplication and postapplication recordings; p < 0.001) but not at young synapses (2.2 ± 0.29 to 2.1 ± 0.22; p = 0.9; Fig. 3F). This suggests that the mechanisms of PPF and/or the Ca2+ channel topologies driving facilitation differ between young and adult PF boutons (cf. below). It indicates that due to tighter coupling in the adult only the facilitation of EPSC2 was affected, whereas in the young EGTA affected both EPSCs.
MPFA (Clements and Silver, 2000) of EPSC amplitudes recorded at different extracellular Ca2+ concentrations ([Ca2+]e) in the presence of the rapidly dissociating antagonist γ-DGG was used to directly estimate quantal release parameters (Fig. 4). In both age groups q was similar (adult, 1.7 (1.1–2.0) pA, n = 5; young, 2.4 (1.4–4.9) pA, n = 8; p = 0.17). For adult synapses pr was 0.21 ± 0.03 in 2 mm [Ca2+]e (Fig. 4C), consistent with previous estimates at mature PF terminals (Sims and Hartell, 2005; Valera et al., 2012; Schmidt et al., 2013). At young synapses, increasing [Ca2+]e or the additional use of TEA (Bornschein et al., 2013) was not sufficient to raise pr above 0.5, i.e., to permit the parabolic MPFA fit (Fig. 4D). This indicates that pr at young synapses is lower than at adult ones (Clements and Silver, 2000), which is consistent with the increased PPR at young synapses. In accordance with this, at PF synapses of young rats pr has been estimated previously to be smaller than the above estimates for adult synapses (Foster et al., 2005). Thus, age-dependent tightening of coupling is functionally associated with a decrease in short-term facilitation and an increase in pr.
Figure 4.
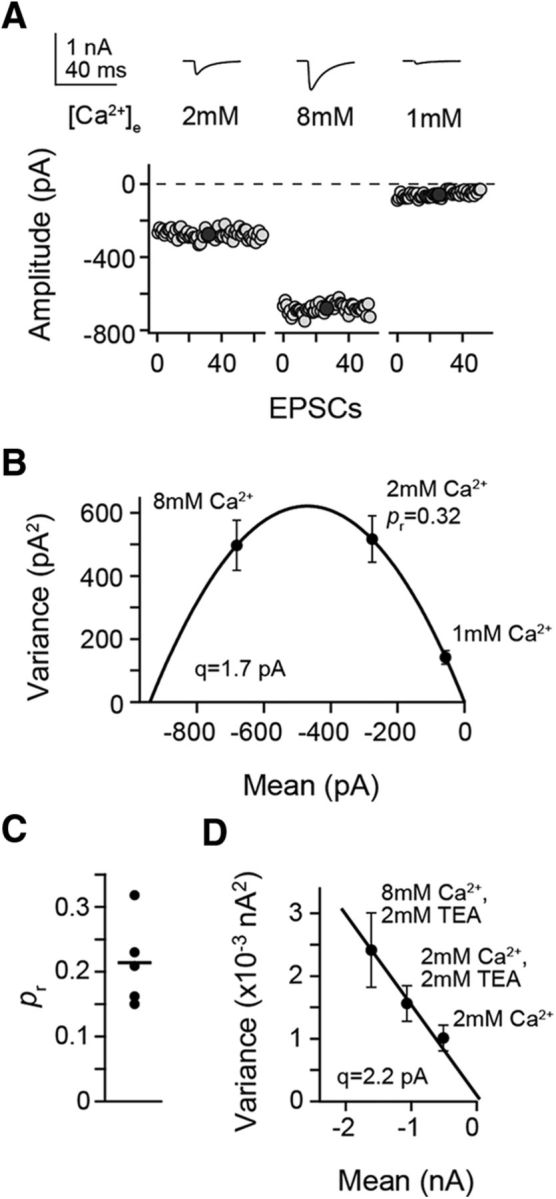
Developmental changes in release probability. A, Fluctuation of EPSC amplitudes recorded at the indicated [Ca2+]e from an adult PN during PF stimulation. B, Variance-mean plot of the EPSCs in A fitted by a parabola, yielding the quantal parameters q and pr. C, Summary of pr in the adult (n = 5). The line indicates the mean value. D, As in B but in a young animal. Data fit to a straight line due to very low pr (Foster et al., 2005).
Developmental focusing of Cav2.1 immunoreactivity to the active zone
Release from PF boutons is triggered with highest efficacy by Cav2.1 (P/Q) Ca2+ channels (Mintz et al., 1995; Myoga and Regehr, 2011), which are concentrated at PF varicosities (Kulik et al., 2004). We investigated the distribution of immunoparticles labeling Cav2.1 at young and adult PF boutons identified by VGluT2 (P8) or VGluT1 (P21) staining (Miyazaki et al., 2003), respectively, using SDS-digested freeze-fracture replica labeling (FRL) immunoelectron microscopy. AZs were identified by the clusters of intramembrane particles, which show immunoreactivity for the presynaptic AZ proteins RIM 1/2 (Fig. 5A,B). This high-resolution immunolabeling analysis revealed that in young tissue Cav2.1 immunoreactivity was frequently scattered over the entire varicosity (Fig. 5C–E). On the contrary, in adult tissue it was essentially restricted to putative AZs (Fig. 5F–H). This suggests that a developmental redistribution of Cav2.1 immunoreactivity occurred between P8 and P21. Such focusing of Cav2.1 channels to the AZ is consistent with a tight channel-sensor association at mature synapses (Bucurenciu et al., 2008).
Presynaptic Ca2+ signaling is not altered developmentally
Interpreting our results directly as being caused by differences in coupling requires that differences in global presynaptic Ca2+ signals between maturation stages do not significantly contribute to the differential chelator sensitivity. This would need to be the case despite differences in Cav2.1 localization. To probe this, we performed two-photon Ca2+ imaging on young and adult PF boutons (Fig. 6A,B), using the low-affinity Ca2+ dye Fluo-5F and the red, Ca2+-insensitive dye Alexa 594. Ca2+ signals (expressed as ΔG/R; Sabatini et al., 2002) induced by single, somatically evoked APs had an amplitude of 0.079 (0.07–0.1) ΔG/R in adult boutons and decayed with a time constant of 114 (90–160) ms. Values from young boutons were not different from these values (0.074 (0.05–0.09) ΔG/R, p = 0.14; 108 (84–140) ms, p = 0.4; Fig. 6C,D), indicating that differences in [Ca2+]i were indeed not responsible for the unequal chelator effects. Furthermore, presynaptic Ca2+ signals were not facilitated in young or in adult boutons (Fig. 6E), which for the adult boutons agrees with previous reports of high reliability and linear summation of AP-mediated Ca2+ signals in PF boutons (Brenowitz and Regehr, 2007; Schmidt et al., 2013). These results indicate that altered pr and PPF at young synapses do not result from differences in Ca2+ signaling or from buffer saturation (Rozov et al., 2001) but from looser coupling.
Figure 6.

Presynaptic Ca2+ signals were not altered during development. A, Two-photon image of a young GC loaded via a somatic patch pipette (dashed lines) containing 200 μm Fluo-5F and 50 μm Alexa 594. Inset, Somatically evoked AP. B, Top, PF bouton outlined in A from which single AP-mediated fluorescence signals were recorded in the line scan mode. Bottom, ΔG/R signals from three individual recordings (gray) from the bouton and their average (black). C, ΔG/R signals averaged across individual young (n = 21) and adult (n = 28) boutons (gray) and their grand averages (black). D, Amplitudes (ΔG/R) and decay constants (τ) of Ca2+ signals in young and adult boutons. E, PPR of ΔG/R signals (20 Hz). Top, Averages of individual boutons (gray) and grand averages (black). The decay of the first transient was extrapolated and the second amplitude was measured to the decay of the first. Bottom, Amplitudes of the first and the second Ca2+ signal normalized to the first amplitude.
Quantitative estimates of coupling topographies from EGTA dose–response curves
We analyzed effects of different EGTA-AM concentrations at young and adult connections (1–500 μm) following the above-described procedure (Fig. 1). The average τ of AM-based loading was similar for all concentrations between young and adult slices (τyoung = 9.6 ± 2.2 min; τadult = 10.9 ± 2.9 min; p = 0.29).
The resulting dose–response relationships revealed a significantly higher susceptibility of release from young than from adult synapses for all EGTA concentrations (p < 0.001). The dose–response curve in adults was exponential, while the curve was biexponential in the young (Fig. 7A), indicating that coupling in young synapses is both less tight and less homogenous than in adult ones (Meinrenken et al., 2002). Consistently, the CVs of EPSCs were significantly higher in recordings from young than from adult connections (0.2 (0.18–0.25) and 0.1 (0.09–0.13), respectively, p < 0.001; Fig. 7B; Meinrenken et al., 2002). This contrasts results from small excitatory synapses in the cerebral neocortex, where the EPSC CV (and PPR) increased during early postnatal development (Feldmeyer and Radnikow, 2009), which may indicate that these synapses develop a mature AZ configuration differing from that of PF synapses.
To further probe the hypothesis that functionally relevant Ca2+ channel-to-vesicle distances in young PF terminals are more heterogeneous than in adult terminals, we analyzed the effects of subsaturating concentrations of the slowly dissociating Ca2+ channel blocker Cd2+ (koff ≈ 33 s−1; Chow, 1991) on PPR in both age windows (Fig. 7C–E). Due to its slow dissociation from Ca2+ channels, Cd2+ blocks individual channels in an “all-or-none” manner during an AP, leading to reduced EPSC amplitudes (Scimemi and Diamond, 2012). Following the arguments and evidence provided by Scimemi and Diamond (2012) for glutamatergic hippocampal synapses, the PPR should be differentially affected, depending on whether release is triggered by a single channel or by a group of distributed channels. In the former case (“one channel–one vesicle”) PPR should remain unchanged compared with control conditions because a vesicle that does not sense Ca2+ during the first AP will not be released or facilitated. In the latter scenario (“several channels–one vesicle”) the PPR could increase due to the reduced pr during the first AP. Thus, one might predict PPR to increase in the presence of Cd2+ at young synapses but to remain unaltered at adult ones. Application of Cd2+ reduced EPSC amplitudes in a concentration-dependent manner in both age groups, with stronger effects at young synapses (Fig. 7D). Remarkably, the PPR increased in the presence of Cd2+ at young synapses (p = 0.03), while it remained unaltered in the adult (p = 0.91; Fig. 7C,E). These results are consistent with a scenario in which in mature terminals vesicles are tightly coupled to a single Ca2+ channel and in immature terminals to a group of channels with heterogeneity in the coupling distances.
BAPTA-AM solubility was limited to ∼10 μm (see Materials and Methods), preventing acquisition of effects induced by high BAPTA concentrations. However, for 1 μm BAPTA-AM the reduction of EPSC amplitudes was similar for young and adult animals (by 19 ± 5 and 13 ± 8%, respectively; p = 0.6), and in young animals 1 μm EGTA and BAPTA had similar effects (p = 0.7; Fig. 7A). This agrees perfectly with the results obtained with 10 μm of the chelators and further substantiates the notion of looser coupling at young boutons. Furthermore, it indicates that Ca2+ sensor affinities are similar between age groups and do not contribute to the differential chelator effects (cf. Discussion).
To derive quantitative estimates about the ontogenetic changes in coupling, we fitted analytical models (Neher, 1998a) to the EGTA dose–response data (Fig. 7F–I; models with variations, e.g., in the properties of endogenous buffers are shown in Fig. 8). Intracellular EGTA concentrations were estimated by first fitting the adult data with a fixed homogenous coupling distance (d) of 24 nm (Schmidt et al., 2013) and an AM-LF as variable (Model 1). Subsequently, data from young synapses were plotted against the estimated intracellular EGTA concentrations (= [EGTA-AM] * LF) and fitted with d as a variable, resulting in d of 60 nm in the young (Model 1; LF = 15 or 42, depending on the Ca2+ binding kinetics and affinity used for EGTA in the model; Fig. 7; see Materials and Methods). The fit was not ideal presumably because of inhomogeneous coupling in young boutons (Meinrenken et al., 2002). A channel-cluster or a two-vesicle pool model (Models 2 and 3, respectively) gave better descriptions of the data, indicating that a fraction of vesicles (∼0.4–0.6) was already close to channels (∼23–35 nm) while other sensor-channel distances were still large (∼176–1300 nm). The use of different published Ca2+ binding kinetics and affinities for EGTA (Naraghi, 1997; Nägerl et al., 2000) resulted in different estimates for the LF and the fraction a of tightly coupling vesicles in Model 3 (slower kinetics and smaller affinity resulted in larger LF and larger a). Importantly, however, identical estimates for the coupling distance in young terminals were obtained for each simulation (Figs. 7, 8). This indicates that a slower binding kinetics of an exogenous buffer can be compensated for by an increase in its concentration, even in a tightly coupling Ca2+ influx-release regime (Ishiyama et al., 2014). Consistent with this notion, at adult synapses, e.g., 10 μm BAPTA-AM and 100 μm EGTA-AM reduced EPSC amplitudes to approximately the same extent (Fig. 7A). This is reflected by the dependency of λ on the product of kon and buffer concentration (Neher, 1998a). Thus, regardless of model details, a larger coupling distance was predicted for at least a fraction of release-relevant vesicles at young synapses that may even include channels outside the AZ (Fig. 5H).
Discussion
Our results demonstrate developmental tightening of Ca2+ influx-release coupling at a typical cortical synapse. Tightening of coupling converted the immature PF synapse into a reliable mature synapse with significantly increased pr.
The release rate of synaptic vesicles is governed by the size and kinetics of the Ca2+ signal, the intrinsic Ca2+ sensitivity of the release sensor, and the distance between synaptic vesicles and Cavs. Direct measurement of local, release-driving Ca2+ signals has not yet been accomplished in brain slices. We quantified amplitudes and time courses of global presynaptic Ca2+ signals in immature and mature PF boutons, serving as a reference of the local Ca2+. An inherent problem of imaging experiments under whole-cell conditions is the washout of endogenous Ca2+ buffers. However, buffer washout in our experiments is unlikely to have been complete. First, the major endogenous buffer CR is slowly mobile in GCs and partly immobilized (Arendt et al., 2013). Second, under similar imaging conditions, significant differences in PF Ca2+ signals between wild-type and CR-deficient mice were detected (Schmidt et al., 2013). Since we used a low-affinity indicator dye in the present study the Ca2+ imaging experiments would have revealed substantial differences in the volume-averaged Ca2+. Since no such differences were evident this indicates that it is essentially the distribution of Ca2+ channels that was different between age groups and not the size of the total Ca2+ influx. In addition, the endogenous buffer capacity (κ) of GCs in an age window similar to that analyzed here is moderate, being only ∼60 on average (Brenowitz and Regehr, 2007). κ added by EGTA during our experiments, on the other hand, was in the range of 150 to >70,000, which will have effectively leveled out smaller differences in the expression of endogenous Ca2+ buffers. Thus, it is unlikely that differences in amplitude and/or kinetics of Ca2+ signals are the major source of the differential chelator effects observed between young and adult terminals.
Alterations in the intrinsic Ca2+ sensitivity of the release sensor could have contributed to the observed effects if its on-rate and/or affinity would have increased during development. Contrary to this scenario, however, at the calyx of Held, the only synapse at which this issue has been addressed in a developmental context, it was found that vesicles in young synapses were even more sensitive to inflowing Ca2+ (Wang et al., 2008; Kochubey et al., 2009), which in itself would make EGTA less effective in interfering with release. However, at the calyx (Fedchyshyn and Wang, 2005; Leão and von Gersdorff, 2009), as in our experiments, the effectiveness of EGTA was enhanced in younger animals, favoring the classical interpretation that the differential EGTA effects are predominantly attributable to alterations in the physical coupling between channels and the release sensor (Adler et al., 1991; Augustine et al., 1991; Ohana and Sakmann, 1998; Hefft and Jonas, 2005; Bucurenciu et al., 2008; Schmidt et al., 2013; Vyleta and Jonas, 2014). Moreover, we found that BAPTA exerted almost identical effects on release from young and adult PF terminals. This latter result can hardly be reconciled with any substantial differences in sensor affinity between young and adult PF synapses. Thus, the differential chelator effects at differentially aged synapses will have resulted from differences in the physical distance between channels and sensor and not from differences in the Ca2+ sensitivity of the release apparatus.
Several lines of evidence support our conclusion of coupling tightening and postnatal reorganization of the PF AZ. First, we found that Cav 2.1 immunoreactivity became restricted to the AZ during development. Second, the developmental shift from biexponential to exponential EGTA dose–response dependence of EPSC reductions accompanied by a reduction in EPSC CV argues for more inhomogeneous vesicle to Cav distances in young terminals (Meinrenken et al., 2002). Third, PPR was reduced by EGTA at adult PF synapses but unaffected at young ones, indicating that at adult synapses Cav cooperativity is lower than at young ones such that individual channels drive both the release and a more distant facilitation process (Atluri and Regehr, 1996; Neher and Sakaba, 2008). Consistently, application of Cd2+ increased PPR at young but not at adult PF synapses, indicating that Cav cooperativity in the control of vesicles is indeed lower at adult than at young synapses (Scimemi and Diamond, 2012). Finally, while a homogenous coupling model could describe the EGTA dose–response data at mature synapses, at young synapses models with distributed vesicle to Cav distances gave better descriptions.
Different proteins at the AZ were implicated in the localization of Cavs to the AZ and in the regulation of channel to vesicle distances (Eggermann et al., 2012; Südhof, 2012). Septin5 has been suggested to operate as a developmentally downregulated “spacer” between vesicles and Cavs in the calyx (Yang et al., 2010), i.e., its removal is permissive to tight coupling. Coupling distances of 20–30 nm, on the other hand, are consistent with the idea of additional mediator proteins of coupling (Eggermann et al., 2012).
The two t-SNAREs, syntaxin and SNAP-25, were indicated to bind to the synprint site of different Cavs (Catterall, 1999), which would physically link vesicles and Cavs. However, the t-SNAREs are also present in loose coupling and other mediators will be required in addition. Deletion of RIM1 and 2 resulted in reduced number of release-relevant Cavs and a reduction in the RRP size accompanied by decreased, decelerated, and desynchronized transmitter release, indicating that the coupling between the remaining Cavs and vesicles also was impaired (Han et al., 2011; Kaeser et al., 2011). At PF synapses loss of the RIM1α resulted in reduced pr and increased PPR (Kintscher et al., 2013). This phenotype resembles the young PF synapse, making RIM1α an interesting candidate as a developmental regulator of coupling. However, deletion of RIM proteins, including RIM1α at PF synapses, resulted in reduced presynaptic Ca2+ signals, whereas in our experiments Ca2+ signals were not different between age groups.
At the Drosophila neuromuscular junction Bruchpilot is a prime candidate for a mediator of coupling since in Bruchpilot mutants the synaptic efficacy is reduced, accompanied by increased PPR and sensitivity to EGTA-AM (Kittel et al., 2006), which is reminiscent of our findings. Yet, Bruchpilot is not evolutionarily conserved and contains domains that appear to mediate mammalian ELKS- and Bassoon-like functions in a single protein (Wagh et al., 2006; Südhof, 2012). Deletion of ELKS2, the AZ ELKS, had only a moderate effect on excitatory synaptic function (Kaeser et al., 2009). Bassoon, on the other hand, has been suggested to be involved in both the tethering of vesicles at the AZ (Hallermann et al., 2010) and the localization of Cav2.1 to the AZ (Davydova et al., 2014), albeit without affecting pr (Hallermann et al., 2010). It appears that the combined action of several AZ proteins is required for mediating tight coupling.
Functionally, postnatal tightening of coupling at PF synapses was associated with an increase in synaptic reliability, reflected by a reduced EPSC CV and increased pr, and accompanied by a reduction in PPR. On the contrary, postnatal maturation of different small excitatory synapses in the cerebral cortex is accompanied by markedly different functional alterations. At these synapses, the CVs and PPRs of EPSCs increase rather than decrease with maturation (for review, see Feldmeyer and Radnikow, 2009). Whether these opposite developmental changes are associated with altered coupling is to our knowledge not known (Eggermann et al., 2012).
At the calyx of Held the presynaptic AP and Ca2+ influx become briefer with maturation, resulting in decreased pr and increased PPR (Taschenberger and von Gersdorff, 2000; Iwasaki and Takahashi, 2001). In addition, vesicles become less sensitive to Ca2+ (see above). Despite this, synaptic fidelity increases developmentally, which is achieved by an increase in the RRP (Taschenberger and von Gersdorff, 2000; Iwasaki and Takahashi, 2001) and by tightening of coupling with maturation (Fedchyshyn and Wang, 2005; Wang et al., 2008; Leão and von Gersdorff, 2009). Also CA3-to-CA1 connections show a developmental increase in PPR (Feldmeyer and Radnikow, 2009). Yet, the AZ of mature CA3-CA1 synapses also harbors tightly coupled vesicles (Scimemi and Diamond, 2012). Thus, since EPSC amplitudes result from a complex interplay between exocytosis and availability of releasable vesicles (Neher and Sakaba, 2008), opposing plastic alterations can develop while coupling tightens.
Information entering the cerebellar cortex via a single MF is distributed onto several hundred GCs at the input layer (Dean et al., 2010). Precisely timed transmission will be required for proper integration of this information at the PN output stage, first at MF-GC connections (Chadderton et al., 2004; Rancz et al., 2007) and subsequently at PF-PN synapses. The developmental switch in coupling we describe here will enhance the temporal precision of MF-driven spiking patterns that are considered central for motor coordination and learning. In concert with results from the calyx of Held (Fedchyshyn and Wang, 2005; Wang et al., 2008; Leão and von Gersdorff, 2009), our data suggest that developmental tightening of coupling is a defining feature of broad-bandwidth CNS synapses.
Footnotes
This work was supported by a faculty scholarship to D.B., BIOSS-2 Project A6 of A.K., and a Deutsche Forschungsgemeinschaft Grant to H.S. (SCHM1838/1-1). We thank Stefan Hallermann and Christian Wilms for discussion of this manuscript, Gudrun Bethge for technical assistance, and Natalie Callies for her support with tissue preparation for the SDS-FRL.
The authors declare no competing financial interests.
References
- Adler EM, Augustine GJ, Duffy SN, Charlton MP. Alien intracellular calcium chelators attenuate neurotransmitter release at the squid giant synapse. J Neurosci. 1991;11:1496–1507. doi: 10.1523/JNEUROSCI.11-06-01496.1991. [DOI] [PMC free article] [PubMed] [Google Scholar]
- Allbritton NL, Meyer T, Stryer L. Range of messenger action of calcium ion and inositol 1,4,5-trisphosphate. Science. 1992;258:1812–1815. doi: 10.1126/science.1465619. [DOI] [PubMed] [Google Scholar]
- Arendt O, Schwaller B, Brown EB, Eilers J, Schmidt H. Restricted diffusion of calretinin in cerebellar granule cell dendrites implies Ca2+-dependent interactions via its EF-hand 5 domain. J Physiol. 2013;591:3887–3899. doi: 10.1113/jphysiol.2013.256628. [DOI] [PMC free article] [PubMed] [Google Scholar]
- Atluri PP, Regehr WG. Determinants of the time course of facilitation at the granule cell to Purkinje cell synapse. J Neurosci. 1996;16:5661–5671. doi: 10.1523/JNEUROSCI.16-18-05661.1996. [DOI] [PMC free article] [PubMed] [Google Scholar]
- Atluri PP, Regehr WG. Delayed release of neurotransmitter from cerebellar granule cells. J Neurosci. 1998;18:8214–8227. doi: 10.1523/JNEUROSCI.18-20-08214.1998. [DOI] [PMC free article] [PubMed] [Google Scholar]
- Augustine GJ, Adler EM, Charlton MP. The calcium signal for transmitter secretion from presynaptic nerve terminals. Ann N Y Acad Sci. 1991;635:365–381. doi: 10.1111/j.1749-6632.1991.tb36505.x. [DOI] [PubMed] [Google Scholar]
- Bornschein G, Arendt O, Hallermann S, Brachtendorf S, Eilers J, Schmidt H. Paired-pulse facilitation at recurrent Purkinje neuron synapses is independent of calbindin and parvalbumin during high-frequency activation. J Physiol. 2013;591:3355–3370. doi: 10.1113/jphysiol.2013.254128. [DOI] [PMC free article] [PubMed] [Google Scholar]
- Brenowitz SD, Regehr WG. Reliability and heterogeneity of calcium signaling at single presynaptic boutons of cerebellar granule cells. J Neurosci. 2007;27:7888–7898. doi: 10.1523/JNEUROSCI.1064-07.2007. [DOI] [PMC free article] [PubMed] [Google Scholar]
- Bucurenciu I, Kulik A, Schwaller B, Frotscher M, Jonas P. Nanodomain coupling between Ca2+ channels and Ca2+ sensors promotes fast and efficient transmitter release at a cortical GABAergic synapse. Neuron. 2008;57:536–545. doi: 10.1016/j.neuron.2007.12.026. [DOI] [PubMed] [Google Scholar]
- Catterall WA. Interactions of presynaptic Ca2+ channels and snare proteins in neurotransmitter release. Ann N Y Acad Sci. 1999;868:144–159. doi: 10.1111/j.1749-6632.1999.tb11284.x. [DOI] [PubMed] [Google Scholar]
- Chadderton P, Margrie TW, Häusser M. Integration of quanta in cerebellar granule cells during sensory processing. Nature. 2004;428:856–860. doi: 10.1038/nature02442. [DOI] [PubMed] [Google Scholar]
- Chiu VC, Haynes DH. High and low affinity Ca2+ binding to the sarcoplasmic reticulum: use of a high-affinity fluorescent calcium indicator. Biophys J. 1977;18:3–22. doi: 10.1016/S0006-3495(77)85592-6. [DOI] [PMC free article] [PubMed] [Google Scholar]
- Chow RH. Cadmium block of squid calcium currents. Macroscopic data and a kinetic model. J Gen Physiol. 1991;98:751–770. doi: 10.1085/jgp.98.4.751. [DOI] [PMC free article] [PubMed] [Google Scholar]
- Clements JD, Silver RA. Unveiling synaptic plasticity: a new graphical and analytical approach. Trends Neurosci. 2000;23:105–113. doi: 10.1016/S0166-2236(99)01520-9. [DOI] [PubMed] [Google Scholar]
- Davydova D, Marini C, King C, Klueva J, Bischof F, Romorini S, Montenegro-Venegas C, Heine M, Schneider R, Schröder MS, Altrock WD, Henneberger C, Rusakov DA, Gundelfinger ED, Fejtova A. Bassoon specifically controls presynaptic P/Q-type Ca2+ channels via RIM-binding protein. Neuron. 2014;82:181–194. doi: 10.1016/j.neuron.2014.02.012. [DOI] [PubMed] [Google Scholar]
- Dean P, Porrill J, Ekerot C-F, Jörntell H. The cerebellar microcircuit as an adaptive filter: experimental and computational evidence. Nat Rev Neurosci. 2010;11:30–43. doi: 10.1038/nrn2756. [DOI] [PubMed] [Google Scholar]
- Dodge FA, Jr, Rahamimoff R. Co-operative action a calcium ions in transmitter release at the neuromuscular junction. J Physiol. 1967;193:419–432. doi: 10.1113/jphysiol.1967.sp008367. [DOI] [PMC free article] [PubMed] [Google Scholar]
- Eggermann E, Bucurenciu I, Goswami SP, Jonas P. Nanodomain coupling between Ca2+ channels and sensors of exocytosis at fast mammalian synapses. Nat Rev Neurosci. 2012;13:7–21. doi: 10.1038/nrn3125. [DOI] [PMC free article] [PubMed] [Google Scholar]
- Faas GC, Schwaller B, Vergara JL, Mody I. Resolving the fast kinetics of cooperative binding: Ca2+ buffering by calretinin. PLoS Biol. 2007;5:e311. doi: 10.1371/journal.pbio.0050311. [DOI] [PMC free article] [PubMed] [Google Scholar]
- Fedchyshyn MJ, Wang LY. Developmental transformation of the release modality at the calyx of Held synapse. J Neurosci. 2005;25:4131–4140. doi: 10.1523/JNEUROSCI.0350-05.2005. [DOI] [PMC free article] [PubMed] [Google Scholar]
- Feldmeyer D, Radnikow G. Developmental alterations in the functional properties of excitatory neocortical synapses. J Physiol. 2009;587:1889–1896. doi: 10.1113/jphysiol.2009.169458. [DOI] [PMC free article] [PubMed] [Google Scholar]
- Foster KA, Crowley JJ, Regehr WG. The influence of multivesicular release and postsynaptic receptor saturation on transmission at granule cell to Purkinje cell synapses. J Neurosci. 2005;25:11655–11665. doi: 10.1523/JNEUROSCI.4029-05.2005. [DOI] [PMC free article] [PubMed] [Google Scholar]
- Hallermann S, Fejtova A, Schmidt H, Weyhersmüller A, Silver RA, Gundelfinger ED, Eilers J. Bassoon speeds vesicle reloading at a central excitatory synapse. Neuron. 2010;68:710–723. doi: 10.1016/j.neuron.2010.10.026. [DOI] [PMC free article] [PubMed] [Google Scholar]
- Han Y, Kaeser PS, Südhof TC, Schneggenburger R. RIM determines Ca2+ channel density and vesicle docking at the presynaptic active zone. Neuron. 2011;69:304–316. doi: 10.1016/j.neuron.2010.12.014. [DOI] [PMC free article] [PubMed] [Google Scholar]
- Hefft S, Jonas P. Asynchronous GABA release generates long-lasting inhibition at a hippocampal interneuron-principal neuron synapse. Nat Neurosci. 2005;8:1319–1328. doi: 10.1038/nn1542. [DOI] [PubMed] [Google Scholar]
- Ishiyama S, Schmidt H, Cooper BH, Brose N, Eilers J. Munc13-3 superprimes synaptic vesicles at granule cell-to-basket cell synapses in the mouse cerebellum. J Neurosci. 2014;34:14687–14696. doi: 10.1523/JNEUROSCI.2060-14.2014. [DOI] [PMC free article] [PubMed] [Google Scholar]
- Iwasaki S, Takahashi T. Developmental regulation of transmitter release at the calyx of Held in rat auditory brainstem. J Physiol. 2001;534:861–871. doi: 10.1111/j.1469-7793.2001.00861.x. [DOI] [PMC free article] [PubMed] [Google Scholar]
- Kaeser PS, Deng L, Chávez AE, Liu X, Castillo PE, Südhof TC. ELKS2alpha/CAST deletion selectively increases neurotransmitter release at inhibitory synapses. Neuron. 2009;64:227–239. doi: 10.1016/j.neuron.2009.09.019. [DOI] [PMC free article] [PubMed] [Google Scholar]
- Kaeser PS, Deng L, Wang Y, Dulubova I, Liu X, Rizo J, Südhof TC. RIM proteins tether Ca2+ channels to presynaptic active zones via a direct PDZ-domain interaction. Cell. 2011;144:282–295. doi: 10.1016/j.cell.2010.12.029. [DOI] [PMC free article] [PubMed] [Google Scholar]
- Kim MH, Li GL, von Gersdorff H. Single Ca2+ channels and exocytosis at sensory synapses. J Physiol. 2013;591:3167–3178. doi: 10.1113/jphysiol.2012.249482. [DOI] [PMC free article] [PubMed] [Google Scholar]
- Kintscher M, Wozny C, Johenning FW, Schmitz D, Breustedt J. Role of RIM1alpha in short- and long-term synaptic plasticity at cerebellar parallel fibres. Nat Commun. 2013;4:2392. doi: 10.1038/ncomms3392. [DOI] [PubMed] [Google Scholar]
- Kittel RJ, Wichmann C, Rasse TM, Fouquet W, Schmidt M, Schmid A, Wagh DA, Pawlu C, Kellner RR, Willig KI, Hell SW, Buchner E, Heckmann M, Sigrist SJ. Bruchpilot promotes active zone assembly, Ca2+ channel clustering, and vesicle release. Science. 2006;312:1051–1054. doi: 10.1126/science.1126308. [DOI] [PubMed] [Google Scholar]
- Kochubey O, Han Y, Schneggenburger R. Developmental regulation of the intracellular Ca2+ sensitivity of vesicle fusion and Ca2+-secretion coupling at the rat calyx of Held. J Physiol. 2009;587:3009–3023. doi: 10.1113/jphysiol.2009.172387. [DOI] [PMC free article] [PubMed] [Google Scholar]
- Kulik A, Nakadate K, Hagiwara A, Fukazawa Y, Luján R, Saito H, Suzuki N, Futatsugi A, Mikoshiba K, Frotscher M, Shigemoto R. Immunocytochemical localization of the alpha subunit of the P/Q-type calcium channel in the rat cerebellum. Eur J Neurosci. 2004;19:2169–2178. doi: 10.1111/j.0953-816X.2004.03319.x. [DOI] [PubMed] [Google Scholar]
- Kulik A, Vida I, Fukazawa Y, Guetg N, Kasugai Y, Marker CL, Rigato F, Bettler B, Wickman K, Frotscher M, Shigemoto R. Compartment-dependent colocalization of Kir3.2-containing K+ channels and GABAB receptors in hippocampal pyramidal cells. J Neurosci. 2006;26:4289–4297. doi: 10.1523/JNEUROSCI.4178-05.2006. [DOI] [PMC free article] [PubMed] [Google Scholar]
- Leão RM, von Gersdorff H. Synaptic vesicle pool size, release probability and synaptic depression are sensitive to Ca2+ buffering capacity in the developing rat calyx of Held. Braz J Med Biol Res. 2009;42:94–104. doi: 10.1590/S0100-879X2009000100014. [DOI] [PMC free article] [PubMed] [Google Scholar]
- Matsui K, Jahr CE. Ectopic release of synaptic vesicles. Neuron. 2003;40:1173–1183. doi: 10.1016/S0896-6273(03)00788-8. [DOI] [PubMed] [Google Scholar]
- Meinrenken CJ, Borst JG, Sakmann B. Calcium secretion coupling at calyx of held governed by nonuniform channel-vesicle topography. J Neurosci. 2002;22:1648–1667. doi: 10.1523/JNEUROSCI.22-05-01648.2002. [DOI] [PMC free article] [PubMed] [Google Scholar]
- Mintz IM, Sabatini BL, Regehr WG. Calcium control of transmitter release at a cerebellar synapse. Neuron. 1995;15:675–688. doi: 10.1016/0896-6273(95)90155-8. [DOI] [PubMed] [Google Scholar]
- Miyazaki T, Fukaya M, Shimizu H, Watanabe M. Subtype switching of vesicular glutamate transporters at parallel fibre-Purkinje cell synapses in developing mouse cerebellum. Eur J Neurosci. 2003;17:2563–2572. doi: 10.1046/j.1460-9568.2003.02698.x. [DOI] [PubMed] [Google Scholar]
- Myoga MH, Regehr WG. Calcium microdomains near R-type calcium channels control the induction of presynaptic long-term potentiation at parallel fiber to Purkinje cell synapses. J Neurosci. 2011;31:5235–5243. doi: 10.1523/JNEUROSCI.5252-10.2011. [DOI] [PMC free article] [PubMed] [Google Scholar]
- Nägerl UV, Novo D, Mody I, Vergara JL. Binding kinetics of calbindin-D28k determined by flash photolysis of caged Ca2+ Biophys J. 2000;79:3009–3018. doi: 10.1016/S0006-3495(00)76537-4. [DOI] [PMC free article] [PubMed] [Google Scholar]
- Naraghi M. T-jump study of calcium binding kinetics of calcium chelators. Cell Calcium. 1997;22:255–268. doi: 10.1016/S0143-4160(97)90064-6. [DOI] [PubMed] [Google Scholar]
- Naraghi M, Neher E. Linearized buffered Ca2+ diffusion in microdomains and its implications for calculation of [Ca2+] at the mouth of a calcium channel. J Neurosci. 1997;17:6961–6973. doi: 10.1523/JNEUROSCI.17-18-06961.1997. [DOI] [PMC free article] [PubMed] [Google Scholar]
- Neher E. Vesicle pools and Ca2+ microdomains: new tools for understanding their roles in neurotransmitter release. Neuron. 1998a;20:389–399. doi: 10.1016/S0896-6273(00)80983-6. [DOI] [PubMed] [Google Scholar]
- Neher E. Usefulness and limitations of linear approximations to the understanding of Ca++ signals. Cell Calcium. 1998b;24:345–357. doi: 10.1016/S0143-4160(98)90058-6. [DOI] [PubMed] [Google Scholar]
- Neher E, Augustine GJ. Calcium gradients and buffers in bovine chromaffin cells. J Physiol. 1992;450:273–301. doi: 10.1113/jphysiol.1992.sp019127. [DOI] [PMC free article] [PubMed] [Google Scholar]
- Neher E, Sakaba T. Multiple roles of calcium ions in the regulation of neurotransmitter release. Neuron. 2008;59:861–872. doi: 10.1016/j.neuron.2008.08.019. [DOI] [PubMed] [Google Scholar]
- Ohana O, Sakmann B. Transmitter release modulation in nerve terminals of rat neocortical pyramidal cells by intracellular calcium buffers. J Physiol. 1998;513:135–148. doi: 10.1111/j.1469-7793.1998.135by.x. [DOI] [PMC free article] [PubMed] [Google Scholar]
- Orduz D, Llano I. Recurrent axon collaterals underlie facilitating synapses between cerebellar Purkinje cells. Proc Natl Acad Sci U S A. 2007;104:17831–17836. doi: 10.1073/pnas.0707489104. [DOI] [PMC free article] [PubMed] [Google Scholar]
- Quastel DM. The binomial model in fluctuation analysis of quantal neurotransmitter release. Biophys J. 1997;72:728–753. doi: 10.1016/S0006-3495(97)78709-5. [DOI] [PMC free article] [PubMed] [Google Scholar]
- Rancz EA, Ishikawa T, Duguid I, Chadderton P, Mahon S, Häusser M. High-fidelity transmission of sensory information by single cerebellar mossy fibre boutons. Nature. 2007;450:1245–1248. doi: 10.1038/nature05995. [DOI] [PMC free article] [PubMed] [Google Scholar]
- Roth A, Häusser M. Compartmental models of rat cerebellar Purkinje cells based on simultaneous somatic and dendritic patch-clamp recordings. J Physiol. 2001;535:445–472. doi: 10.1111/j.1469-7793.2001.00445.x. [DOI] [PMC free article] [PubMed] [Google Scholar]
- Rozov A, Burnashev N, Sakmann B, Neher E. Transmitter release modulation by intracellular Ca2+ buffers in facilitating and depressing nerve terminals of pyramidal cells in layer 2/3 of the rat neocortex indicates a target cell-specific difference in presynaptic calcium dynamics. J Physiol. 2001;531:807–826. doi: 10.1111/j.1469-7793.2001.0807h.x. [DOI] [PMC free article] [PubMed] [Google Scholar]
- Sabatini BL, Regehr WG. Optical measurement of presynaptic calcium currents. Biophys J. 1998;74:1549–1563. doi: 10.1016/S0006-3495(98)77867-1. [DOI] [PMC free article] [PubMed] [Google Scholar]
- Sabatini BL, Oertner TG, Svoboda K. The life cycle of Ca2+ ions in dendritic spines. Neuron. 2002;33:439–452. doi: 10.1016/S0896-6273(02)00573-1. [DOI] [PubMed] [Google Scholar]
- Saviane C, Silver RA. Errors in the estimation of the variance: implications for multiple-probability fluctuation analysis. J Neurosci Methods. 2006;153:250–260. doi: 10.1016/j.jneumeth.2005.11.003. [DOI] [PubMed] [Google Scholar]
- Scheuss V, Schneggenburger R, Neher E. Separation of presynaptic and postsynaptic contributions to depression by covariance analysis of successive EPSCs at the calyx of held synapse. J Neurosci. 2002;22:728–739. doi: 10.1523/JNEUROSCI.22-03-00728.2002. [DOI] [PMC free article] [PubMed] [Google Scholar]
- Schmidt H, Brachtendorf S, Arendt O, Hallermann S, Ishiyama S, Bornschein G, Gall D, Schiffmann SN, Heckmann M, Eilers J. Nanodomain coupling at an excitatory cortical synapse. Curr Biol. 2013;23:244–249. doi: 10.1016/j.cub.2012.12.007. [DOI] [PubMed] [Google Scholar]
- Schneggenburger R, Meyer AC, Neher E. Released fraction and total size of a pool of immediately available transmitter quanta at a calyx synapse. Neuron. 1999;23:399–409. doi: 10.1016/S0896-6273(00)80789-8. [DOI] [PubMed] [Google Scholar]
- Scimemi A, Diamond JS. The number and organization of Ca2+ channels in the active zone shapes neurotransmitter release from Schaffer collateral synapses. J Neurosci. 2012;32:18157–18176. doi: 10.1523/JNEUROSCI.3827-12.2012. [DOI] [PMC free article] [PubMed] [Google Scholar]
- Silver RA. Estimation of nonuniform quantal parameters with multiple-probability fluctuation analysis: theory, application and limitations. J Neurosci Methods. 2003;130:127–141. doi: 10.1016/j.jneumeth.2003.09.030. [DOI] [PubMed] [Google Scholar]
- Silver RA, Momiyama A, Cull-Candy SG. Locus of frequency-dependent depression identified with multiple- probability fluctuation analysis at rat climbing fibre-Purkinje cell synapses. J Physiol. 1998;510:881–902. doi: 10.1111/j.1469-7793.1998.881bj.x. [DOI] [PMC free article] [PubMed] [Google Scholar]
- Sims RE, Hartell NA. Differences in transmission properties and susceptibility to long-term depression reveal functional specialization of ascending axon and parallel fiber synapses to Purkinje cells. J Neurosci. 2005;25:3246–3257. doi: 10.1523/JNEUROSCI.0073-05.2005. [DOI] [PMC free article] [PubMed] [Google Scholar]
- Südhof TC. The presynaptic active zone. Neuron. 2012;75:11–25. doi: 10.1016/j.neuron.2012.06.012. [DOI] [PMC free article] [PubMed] [Google Scholar]
- Südhof TC. A molecular machine for neurotransmitter release: synaptotagmin and beyond. Nat Med. 2013;19:1227–1231. doi: 10.1038/nm.3338. [DOI] [PubMed] [Google Scholar]
- Taschenberger H, von Gersdorff H. Fine-tuning an auditory synapse for speed and fidelity: developmental changes in presynaptic waveform, EPSC kinetics, and synaptic plasticity. J Neurosci. 2000;20:9162–9173. doi: 10.1523/JNEUROSCI.20-24-09162.2000. [DOI] [PMC free article] [PubMed] [Google Scholar]
- Tsien RY. A non-disruptive technique for loading calcium buffers and indicators into cells. Nature. 1981;290:527–528. doi: 10.1038/290527a0. [DOI] [PubMed] [Google Scholar]
- Valera AM, Doussau F, Poulain B, Barbour B, Isope P. Adaptation of granule cell to Purkinje cell synapses to high-frequency transmission. J Neurosci. 2012;32:3267–3280. doi: 10.1523/JNEUROSCI.3175-11.2012. [DOI] [PMC free article] [PubMed] [Google Scholar]
- Vyleta NP, Jonas P. Loose coupling between Ca2+ channels and release sensors at a plastic hippocampal synapse. Science. 2014;343:665–670. doi: 10.1126/science.1244811. [DOI] [PubMed] [Google Scholar]
- Wadel K, Neher E, Sakaba T. The coupling between synaptic vesicles and Ca2+ channels determines fast neurotransmitter release. Neuron. 2007;53:563–575. doi: 10.1016/j.neuron.2007.01.021. [DOI] [PubMed] [Google Scholar]
- Wagh DA, Rasse TM, Asan E, Hofbauer A, Schwenkert I, Dürrbeck H, Buchner S, Dabauvalle MC, Schmidt M, Qin G, Wichmann C, Kittel R, Sigrist SJ, Buchner E. Bruchpilot, a protein with homology to ELKS/CAST, is required for structural integrity and function of synaptic active zones in Drosophila. Neuron. 2006;49:833–844. doi: 10.1016/j.neuron.2006.02.008. [DOI] [PubMed] [Google Scholar]
- Wang LY, Neher E, Taschenberger H. Synaptic vesicles in mature calyx of Held synapses sense higher nanodomain calcium concentrations during action potential-evoked glutamate release. J Neurosci. 2008;28:14450–14458. doi: 10.1523/JNEUROSCI.4245-08.2008. [DOI] [PMC free article] [PubMed] [Google Scholar]
- Watt AJ, Cuntz H, Mori M, Nusser Z, Sjöström PJ, Häusser M. Traveling waves in developing cerebellar cortex mediated by asymmetrical Purkinje cell connectivity. Nat Neurosci. 2009;12:463–473. doi: 10.1038/nn.2285. [DOI] [PMC free article] [PubMed] [Google Scholar]
- Xu-Friedman MA, Harris KM, Regehr WG. Three-dimensional comparison of ultrastructural characteristics at depressing and facilitating synapses onto cerebellar Purkinje cells. J Neurosci. 2001;21:6666–6672. doi: 10.1523/JNEUROSCI.21-17-06666.2001. [DOI] [PMC free article] [PubMed] [Google Scholar]
- Yang YM, Fedchyshyn MJ, Grande G, Aitoubah J, Tsang CW, Xie H, Ackerley CA, Trimble WS, Wang LY. Septins regulate developmental switching from microdomain to nanodomain coupling of Ca2+ influx to neurotransmitter release at a central synapse. Neuron. 2010;67:100–115. doi: 10.1016/j.neuron.2010.06.003. [DOI] [PMC free article] [PubMed] [Google Scholar]