

Abstract
The thalamic reticular nucleus is an important structure governing the recurrent interactions between the thalamus and cortex that may provide a substrate for unified perception. Despite the importance of the TRN, its activity has been scarcely investigated in vivo in animal models, and never in humans. Here we anatomically identify the human TRN using multiple registered and averaged proton density-weighted structural MRI scans and drive its functional activity with a dual phase-encoded stimulus. We characterize the retinotopic and temporal response properties in the visual sector of the TRN and measured an inhibitory relationship with the contralateral LGN. These observations provide a basis for further gross characterizations of the role of the TRN in human behavior.
Keywords: lateral geniculate nucleus, oscillations, retinotopy, temporal response, thalamic reticular nucleus, thalamus
Introduction
The thalamic reticular nucleus (TRN) is a thin layer of γ-aminobutyric acid-releasing cells wrapping the dorsolateral and anterior segments of the thalamus that modulates both thalamocortical and corticothalamic communication in the brain (Jones, 1975). It is divided into modality-specific sectors, each respecting the topographic organization of the associated thalamic and cortical regions (Pinault, 2004), and its position in the brain is ideal for synchronizing the activities of disjoint thalamic and cortical processes (Crabtree and Isaac, 2002; McAlonan et al., 2008). It achieves this in part by mediating low-frequency coherence between particular regions (Contreras et al., 1997; Steriade, 1997; Bazhenov et al., 1999; Long et al., 2004). These properties are most apparent during sleep but are also observed during vigilance (Steriade, 1997).
Because of its size and location in the brain, in vivo studies of the TRN are uncommon. The TRN has long been thought to function as a spatial filter, or attentional “spotlight” (Crick, 1984), and the available studies support this claim. TRN neurons maintain integrative properties over wide voltage ranges and respond to deviations in stimulus properties (Yu et al., 2009; Muñoz and Fuentealba, 2012). These responses modulate the receptive field properties of the thalamus (Cotillon-Williams et al., 2008), a candidate mechanism for attention allocation across the sensory map. The visual TRN responds more vigorously when attending to a visual stimulus within its receptive field in the presence of an auditory distractor than in the opposite situation (McAlonan et al., 2006), and lesions of the TRN abolish any reaction time benefit normally observed with the presentation of a cue/target pair in the contralateral hemifield (Weese et al., 1999).
No studies have investigated the human TRN. Here we show that it is possible to identify the human TRN on the basis of multiple, averaged proton density scans of the thalamus. We show further that, within the anatomically defined TRN, there are at least two visual representations: one in the ventral portion of the TRN, which mainly represents the contralateral lower visual field, and another located more dorsally, which appears to bilaterally represent mainly the upper visual field. Furthermore, we show that some representations in the ventral TRN are driven maximally by flicker frequencies much higher than those typically used in visual mapping studies, and that these regions of the TRN tend to be antagonistic to the ipsilateral LGN, suggesting the TRN participants in interhemispheric inhibition.
Materials and Methods
Subjects.
Six subjects (1 female, 1 left handed), 24–30 years of age, participated, all with normal or corrected to normal vision. The subjects provided informed written consent under a protocol approved by the York University Human Participants Review Committee and were compensated for their participation in three separate 1 h sessions.
Stimuli and procedure.
The visual stimulus (see Fig. 2A) consisted of a high-contrast checkerboard with a radius of 15° of visual angle from the central fixation point on a mean gray background. The checkerboard rotated counterclockwise with a period of 21 s, for 10 cycles per scan. The checkerboard also reversed contrast with a flicker frequency that modulated through time with a period of 30 s (see Fig. 2B). Each of the 7 flicker cycles per scan consisted of 3 s each of 10 different flicker frequencies (1, 2.5, 5, 7.5, 10, 12, 15, 20, 30, and 60 Hz, defined as a full period contrast-reversal cycle). An additional 10 s of the stimulus, identical to the last 10 s of each scan, was added to the beginning of each scan to allow the hemodynamics to reach a steady state. These data were discarded.
Figure 2.

Retinotopy. A, The stimulus was a rotating, flickering hemifield checkerboard pattern. B, The flicker frequency of the stimulus modulated at a rate of 7 cycles per scan, and the rotation period was 10 cycles per scan. The rotation period is depicted as a sine wave, the color of which at a point in time indicates the flicker frequency. The shade in the bottom corresponds to the flicker frequency in the top. C, Two subjects (S1 and S6) are shown. Color labels indicate the polar angle in the visual field to which each activated voxel is most responsive, as illustrated in the legend inset: upper visual field (U), lower visual field (D), left visual field (L), and right visual field (R). Red boxes represent the left and right hemisphere sections that are shown in panels to the right and left. MNI coordinates in the anterior–posterior direction are indicated at the top of each panel. Left (L) and right (R) hemispheres are labeled in the anatomical brain underlays. D, Polar angle distributions for all voxels across all subjects are shown for the LGN and ventral (vTRN) and dorsal (dTRN) subregions of the TRN. Dotted lines indicate the range of 250 voxels per bin for the LGN and 50 voxels for the TRN. The distributions are grouped by hemisphere, as indicated by the shading, and the visual field labels are as in C, above. Right, Small pie charts of each distribution indicate the proportions of voxels attributed to each subject (S1–S6).
The stimuli were generated on an iMac computer (Apple Computer) using MATLAB software (MathWorks) and Psychophysics Toolbox 3 functions (Brainard, 1997; Pelli, 1997). The stimuli were back-projected from outside the scanner room onto a small translucent screen in the scanner bore by an InFocus IN112 3D DLP projector (InFocus) with a 120 Hz refresh rate. The stock lens on the projector allowed an ∼100 × 100 pixel area of its full image field to be presented, and the rest of the field was masked.
Subjects viewed the screen at a total path length of 38 cm through a mirror attached to the head coil. The subjects were instructed to fixate and passively view the stimuli while remaining as still as possible. Each subject viewed 23–30 runs over the course of two scanning sessions on separate days, as a very large number of averages were required to detect the weak signals arising from the TRN.
Structural imaging.
All MRI data were collected at the York University Neuroimaging Laboratory with a Siemens 3T Trio MRI scanner using a 32-channel head coil. A T1-weighted 3D MPRAGE anatomical image was collected from each subject to facilitate coregistration (TR = 1900 ms; TE = 2.52 ms; flip angle = 9°; 256 × 256 matrix; 1 mm3 isotropic voxels; GRAPPA acceleration factor = 2). Multiple high-resolution proton density-weighted images (94 for Subject S1, 40 for Subjects S2–S6) were collected for each participant during initial scanning sessions, on separate days from the functional runs (Devlin et al., 2006). Each image consisted of 30 coronal slices, 1 mm thick, no gap, covering the entire thalamus (512 × 512 matrix for S1, 256 × 256 matrix for S2-S6, with a 192 mm field of view, yielding a voxel resolution of 0.375 × 0.375 × 1 mm3 for S1 and 0.75 × 0.75 × 1 mm3 for S2–S6; TR = 3 s; TE = 22 ms; flip angle = 120°; GRAPPA acceleration factor = 2). The lower resolution scans were each 90 s long, and higher resolution scans were each 167 s long. These images were coregistered and averaged; the lower-resolution images were first interpolated to twice the resolution in each dimension. Anatomical ROIs for the LGN and TRN were manually traced on these images using a human brain atlas as reference (Fig. 1) (Mai et al., 2007). Proton density imaging allowed us to identify regions of the brain with high and low density of cell bodies per volume (Devlin et al., 2006). In this case, the images served to delineate between the denser LGN, pulvinar, and TRN, and the regions immediately surrounding them that are populated with axons and dendrites. The TRN masks were subdivided into two approximately equally sized dorsal and ventral ROIs, representing the regions adjacent to the dorsal pulvinar and LGN, respectively. Most subjects underwent the less demanding proton density scanning protocol for efficiency's sake: the resolution obtained with the 256 × 256 acquisition matrix was sufficient to delineate the LGN, TRN, and pulvinar and required fewer averages and shorter acquisition time. The image displayed for S1 took ∼8 h of scanner time to produce, whereas the lower-resolution images took only 1 h. For the purposes of structurally identifying the TRN, we did not find any substantial advantage to using the higher-resolution acquisition.
Figure 1.

High-resolution proton density images of the human thalamus. A, Left and right top, Regions of the thalamus in Subject S1 are labeled in two individual slices. The putamen (Pu), TRN, LGN, MGN, pulvinar (Pul), superior colliculus (SC), and intergeniculate pulvinar (IGPul) are shown. The right (R) and left (L) sides of the images are labeled. Scale bar, 10 mm. B, Image with arrows pointing to the TRN and LGN. C, Labeled TRN, LGN, and pulvinar regions from the same slice as in B. D, E, Both single images and the mean of multiple images. D, Images were acquired with a 256 × 256 matrix, with the mean image upsampled to twice the resolution in each dimension. E, Images were acquired with a 512 × 512 matrix. Arrows indicate the LGN and TRN.
Functional imaging.
Functional images were acquired with an EPI sequence (TR = 1250 ms; TE = 41 ms; flip angle = 90°; bandwidth = 752 Hz/px) consisting of 12 coronal interleaved slices covering the posterior thalamus and brainstem, with a 128 × 128 matrix, 192 mm field of view, 2 mm slice thickness and no gap between slices, resulting in a voxel resolution of 1.5 × 1.5 × 2 mm3. Because of the very low signal obtained from the TRN, a large number of averages were obtained from each participant (23–30). A partial Fourier factor of 7/8 was used to acquire an asymmetric fraction of k-space to reduce the acquisition time, and parallel imaging (GRAPPA) was used with an acceleration factor of 2. A whole-head EPI volume with 100 slices and TR = 10.104 s, but otherwise identical to the previous scans, was also acquired to facilitate coregistration to the T1-weighted anatomical image.
Data analysis.
Functional data were preprocessed in AFNI (Cox, 1996). For each time series, the EPI data were slice timing corrected, motion corrected and coregistered with the T1 anatomical image (Saad et al., 2009), and resliced to twice the resolution in each dimension. Linear transforms from each participant's anatomical and the MNI brain were calculated and used to approximate the location of TRN activity in the thalamus across participants. Large, nonphysiologically relevant spikes were removed through L1 regression, and the linear and quadratic trends were removed, as were components correlated with any of the six rigid body head motion parameters. The data for each voxel were converted to units of percentage signal change by subtracting and dividing by the mean of each time series. Each run was spatially smoothed with a 2 mm FWHM Gaussian kernel only within the anatomically defined ROI masks. The time series were then bandpassed, producing two distinct datasets: one retaining 0.009–0.4 Hz, and the other retaining 0.009–0.08 Hz, with a dual-pass bidirectional digital FIR Kaiser filter (β = 2.5). The multiple scanning runs were then averaged, excluding a small number (mean = 22.3) of time points associated with instantaneous head motions ≥0.25 mm. A mean flicker cycle was also created from the individual runs by folding at the flicker modulation frequency (7 cycles/scan). The time series of each voxel was cycled backwards in time by 5 s (4 TRs) to approximately account for BOLD lag. Time points that extended beyond time 0 were wrapped to the end of the run.
A Fourier analysis was performed on the nonbandpassed data to detect voxels modulating at the rotation frequency (Engel et al., 1997). A local spectral test (Wei and Craigmile, 2010) was used to compare the fundamental frequencies of each modulation with the noise, as estimated by the average of spectral bins, excluding the fundamentals (7 and 10 cycles/scan) and their first two harmonics. The spectral density was estimated was using an adaptive multitaper method with three orthogonal windows (Thomson, 1982), and the resulting F-statistic was corrected for multiple comparisons using the false discovery rate (FDR) procedure and a q = 0.05 (Benjamini and Hochberg, 1995). For each activated voxel within the anatomically defined TRN ROI, a correlation coefficient was calculated between its mean bandpassed time series and that of each of the other voxels in the sample. In addition, correlations were calculated between the mean flicker cycles for each voxel.
Results
Anatomical ROIs
The TRN and adjacent thalamic nuclei were visible and could be manually traced on the registered and averaged multiple proton density-weighted images (Fig. 1). The TRN was 2.10 ± 0.24 mm and 2.27 ± 0.32 mm thick (mean ± SEM) immediately adjacent to the midpoint of the right and left respective LGN. It was also measured to be 3.15 ± 0.28 mm and 3.49 ± 0.31 mm at its thickest point adjacent to the juncture between the TRN and right and left respective pulvinar. For the measurements taken from each participant, see Table 1.
Table 1.
Structural measurements of the thickness (in mm) of the TRN for dorsal and ventral portions of the TRN for each hemisphere in each subject
| Ventral right | Dorsal right | Ventral left | Dorsal left | |
|---|---|---|---|---|
| S1 | 1.99 | 2.98 | 2.49 | 3.98 |
| S2 | 1.59 | 4.24 | 2.12 | 3.18 |
| S3 | 2.12 | 2.65 | 1.59 | 2.12 |
| S4 | 2.12 | 2.65 | 2.12 | 3.71 |
| S5 | 3.18 | 3.71 | 3.71 | 4.24 |
| S6 | 1.59 | 2.65 | 1.59 | 3.71 |
| Mean | 2.10 ± 0.26 | 3.15 ± 0.30 | 2.27 ± 0.35 | 3.49 ± 0.34 |
Retinotopy of the LGN and TRN
The statistical map derived from the retinotopic frequency was thresholded to q[FDR] = 0.05, resulting in critical p values ranging from 0.0057 to 0.014 across participants; nonsurviving voxels were masked out of all following analysis. Representative slices from two participants for both polar angle retinotopy and preferred flicker frequency are shown in Figures 2C and 3A, respectively. These data show the expected retinotopic organization in the LGN (Schneider et al., 2004; Schneider and Kastner, 2005, 2009; Schneider, 2011). Of note, the significantly modulated voxels were slightly left-lateralized, highlighting an asymmetry of the strength of retinotopic drive in the thalamus as previously reported (Schneider et al., 2004). The TRN generally showed retinotopic drive in two locations: immediately dorsolateral to the LGN and in the most dorsal regions adjacent to the pulvinar. For this reason, we report retinotopy for the ventral and dorsal TRN separately, splitting the data around the middle of the pulvinar. The distribution of visual field representations and flicker preferences demonstrate two properties of the TRN: a full representation of the visual field in each hemisphere (Fig. 2D) and a broad flicker frequency tuning (Fig. 3B). To determine whether this broad flicker tuning in the TRN was attributable to the smoothing applied to the data, we produced a second set of analyses using identical ROIs but unsmoothed time series. The results (data not shown) were not qualitatively different from the smoothed data, probably because the 2 mm FWHM smoothing kernel was only marginally larger than the acquisition voxel size of 1.5 × 1.5 × 2 mm3. The unsmoothed data were not used for any subsequent analyses. Regions of the TRN adjacent to the LGN preferred high flicker frequencies. TRN findings were generally patchy and, like the LGN, favored a single hemisphere in each participant. This apparent preference is likely due to the extremely weak signal arising from the TRN, with only the stronger hemisphere producing enough signal to be captured by our method. These activated regions were found in MNI space ∼−24 ± 2 mm in the anterior–posterior coordinate. It is worth highlighting that the quality of linear registration in the thalamus is variable in the millimeter range when working with functional data acquired at 1.5 × 1.5 × 2 mm3, so these coordinates should be interpreted accordingly.
Figure 3.

Flicker response. A, The panels are arranged and labeled similarly as in Figure 2C. The color codes for each activated voxel indicate the flicker frequency that elicited the largest response. B, The distribution of preferred flicker frequency is shown for all voxels across subjects. Conventions are as in Figure 2D.
Correlation analysis
The hemispheric LGN affinity of each TRN voxel, defined as the hemisphere containing the highest positively correlated LGN voxel, in two representative participants is shown in Figure 4A. This analysis demonstrates the bilateral functional connectivity in each hemisphere of the TRN.
Figure 4.

Laterality. A, LGN affinity. Color code represents the hemisphere location of the LGN whose mean activity of each TRN voxel is more highly correlated. Other conventions are as in Figure 2C. B, Seed-based correlations of the TRN. All six subjects are shown, one per row. Left panel in each subject shows the TRN seed region, circled in red. The color of each voxel in the right two panels illustrates the correlations between that voxel and the mean of the TRN seed, using the entire run (middle panel) or the mean flicker cycle (right panel) in which retinotopy is averaged out. Color bar represents the sign and magnitude of each color. The anatomical coordinate labels are as described in Figure 2C. C, Each set of histograms is the distribution across all TRN voxels in all subjects with either the ipsilateral or contralateral LGN. Top histograms represent the correlations when using the full run. Bottom histrograms represent the correlations using the mean flicker cycle over the run, to average out the retinotopy contribution.
To determine whether this affinity is indicative of a consistent correlation pattern with each LGN, a follow-up seed-based correlation analysis was performed by correlating single TRN voxels with both LGN. This allowed us to visualize the correlation of single locations within the TRN with both LGN volumes. Because the TRN signal was sometimes completely lateralized in participants, we did not produce seed-correlation maps from both hemispheres in each participant, but it is worth noting that contralateral affinity was recorded in all significantly driven ventral TRN samples in our population, as seen in Figure 4A,B. In all participants with bilateral TRN activity, there is evidence that this pattern is largely consistent within each hemisphere. The location of the seeds required to produce this effect is fairly consistent among participants. Generally, these seeds fall just dorsolateral to the LGN and are within 1–3 mm of the dorsal edge of the anatomically defined LGN, and are found at MNI anterior–posterior coordinate, −24 ± 2 mm. No seeds produced this effect that were located further than the junction where the TRN meets the lateral pulvinar. In all cases, the mean run produced a positive correlation with the contralateral ROI, whereas the correlation of flicker profiles produced mostly negative correlations with both LGN (Fig. 4B,C). The distribution of correlations for the contralateral and ipsilateral LGN were found to be significantly different both cases, with the contralateral LGN expressing more positive correlations in both tests (two-sample Kolmogorov–Smirnov test run: Dn = 0.64, p = 2.2 × 10−308, Kolmogorov–Smirnov test cycle: Dn = 0.094, p = 3.0 × 10⁻¹⁰), although it should be stressed that the difference between distributions are orders of magnitude higher in the case of run correlations.
Flicker frequency responses
In light of the negative correlation found between the flicker cycles of the TRN seeds and the bilateral LGN ROIs, we computed the mean flicker cycle of the seed voxels. The mean flicker cycle from the TRN and LGN ROIs, which represent the relative activation observed in each over the presentation of the different flicker frequencies, shows a consistent negative correlation between them with the presentation of 20–60 Hz flicker (Fig. 5). This effect is consistent across participants, even in the presence of BOLD lag variability, which was not corrected due to the nature of the stimulus. Furthermore, the TRN activity was maximally depressed with the presentation of 10 Hz flicker. We conducted a series of two-sample t tests to determine where in the flicker cycle the subject's mean LGN and TRN response are different. After correcting for multiple comparisons (Bonferroni correction, critical p = 0.0021), the TRN was seen to be significantly depressed relative to the LGN during the TRs spanning 10–12 Hz, and the LGN was seen to be significantly depressed relative to the TRN during the TRs spanning 20–60 Hz. The data suggest that the TRN preferentially gates the transmission of the flickering stimulus to the visual cortex in the 10–12 Hz range and acts to inhibit the transmission of flicker frequencies between 20 and 60 Hz. The top 50% of ventral TRN voxels (those falling close to the LGN and intergeniculate pulvinar) also expressed a contralateral affinity, although it is less apparent, suggesting that flicker frequency alone does not determine this effect. Spatial proximity to the LGN also likely plays a role. The flicker responses of the LGN are as expected from previous literature, including a higher flicker frequency preference near the medial edge of the LGN, as would be expected from preferential drive of a magnocellular population (Derrington and Lennie, 1984; Mukherjee and Kaplan, 1995; Hughes et al., 2004).
Figure 5.
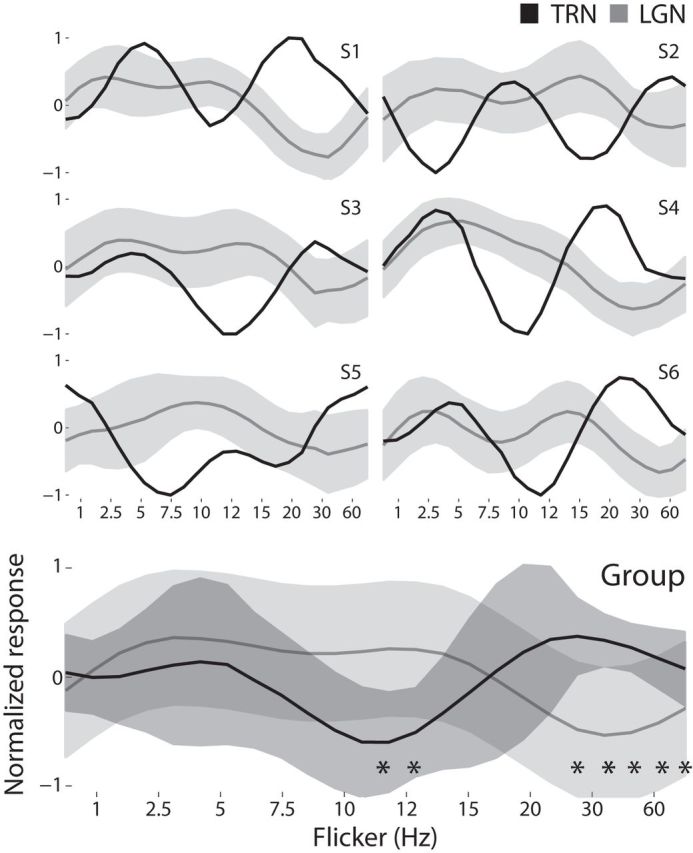
Comparison of flicker frequency response profiles for the TRN and LGN. Flicker profiles of the seed TRN voxels are plotted against the mean and SD of the ipsilateral LGN, for all six subjects. Bottom, Group average. Asterisks indicate the flicker frequencies where the LGN and TRN responses differ significantly, p < 0.0021. All time series are normalized.
Discussion
Retinotopy
In the present study, we set out to define the topographic properties of the human TRN using a flicker-modulated retinotopic stimulus. To the best of our knowledge, this is the first functional topographic map of the TRN produced in any species. The findings in the LGN were consistent with previous work (Schneider et al., 2004) showing a well-defined map of the contralateral visual field in each LGN, with an under-representation of the vertical meridian. The ventral TRN ROI retinotopy revealed a distinct preference for the lower visual field, which may be due to its receiving preferential inputs from the dorsal LGN and could functionally suggest that the ventral TRN participates more in tasks involving peripersonal space (Previc, 1990).
Because the resolution limits of our stimulus, the foveal visual field of both the TRN and LGN were not likely mapped with any specificity. This did not produce any obvious omissions in the output of our analysis, as the full extent of the fovea in each LGN was mapped in all participants (Schneider et al., 2004), it is possible that a more accurate retinotopic map of the TRN would be produced with a higher-resolution stimulus, as the visual TRN is known to have receptive fields with spatial acuity <1° in nonhuman primates (McAlonan et al., 2006). We were also limited in this respect with our ability to perform eccentricity mapping due to our stimulus resolution: future studies may want to supplement these findings with them.
Flicker
We demonstrated that a flicker-modulated visual stimulus can be used to map the resonances of multiple structures using fMRI, despite its temporal limitations. However, variability among participants is significant and may not be wholly attributable to hemodynamic lag: for instance, the optimal resonant frequency of 16 cat LGN were found to fall somewhere between 2 and 8 Hz, consistent with the present results (Mukherjee and Kaplan, 1995). The source of variability between participants in this experiment may therefore be physiological or neural in nature. A future study of flicker-driven resonance mapping using both BOLD and EEG may shed important light on the source of the variability.
Nonetheless, the present study suggests an interesting relationship between the LGN and TRN mediated by flicker resonance. The flicker frequency commonly used to drive visual activity in the visual system, ∼10 Hz (e.g., Engel et al., 1997; Schneider et al., 2004), was also the frequency where we observed the greatest suppression of TRN activity. The LGN and TRN appear to be coactive when the retina is presented with low-frequency flicker. The most striking negative correlation between the seed TRN and mean LGN flicker cycle across participants was between 20 and 60 Hz, flicker frequencies not often investigated in visual mapping studies. TRN activity is most associated with cortical spindle-frequency activity, and the 10 Hz cortical signal is a well-understood thalamocortical phenomenon in the visual system (Halassa et al., 2011). Previous work has shown a spindle-like resonance signal in the cortex in response to flicker frequencies that are multiples of 10 (Herrmann, 2001): one interpretation of the present results is that these flicker frequencies >10 Hz are driving the TRN in some way to produce these spindle-like phenomena. The route this communication would have taken is not clear. The multisensory nature of the TRN makes it difficult to determine whether activity seen in the TRN is due to cortical activity in the recorded region, instead of some distant regions, or whether the cortical activity itself is driven by the TRN via the thalamus. For example, stimulation of the TRN with 500 Hz trains also evokes topographically matched γ activity in the somatosensory and auditory cortex (Macdonald et al., 1998). No studies have looked for such an effect in the visual TRN.
A possible explanation for our findings is that driving the retina at these frequencies entrains nonvisual cortical regions resonant at those frequencies. The TRN is implicated in cross-modal filtering in response to ongoing attention demands (Crabtree and Isaac, 2002; McAlonan et al., 2006). The TRN is proposed to prevent irrelevant incoming sensory information from interrupting an ongoing process. In this case, 20–60 Hz flicker may be driving a nonsense signal in the nonvisual cortex, mimicking an ongoing process and entraining the TRN to inhibit visual input to the LGN.
Generally, the activation of the TRN by the visual stimuli was substantially weaker than that of the LGN. There are three reasons to expect this. First, the TRN, unlike the LGN, is not primarily a visual relay structure. Although the LGN receives 90% top-down innervation, its BOLD activity is modulated only 5%–10% (O'Connor et al., 2002; Schneider and Kastner, 2009) by top-down influence (spatial attention). The TRN, on the other hand, is primarily a modulatory structure, and its visual activations are perhaps only due to its topographic modulatory activity. The task used in this study was purely passive, with no top-down component. Second, the TRN is a very thin structure, with its full extent contained within a small number of voxels, and thus extremely susceptible to partial volume effects. The precise anatomy was also quite variable among subjects. Third, the TRN is a wholly GABAergic structure, which should have considerably reduced metabolic demands (10–15%) compared with the typical mixed glutamatergic and GABAergic neural populations sampled using MRI (Buzsáki et al., 2007). Although it remains untested whether this translates to the BOLD signal as measured here, future fMRI studies of the TRN could be used to study the unique contribution of GABAergic neurons to the BOLD signal. Nonetheless, our findings are highly consistent among subjects, who exhibited highly similar temporal frequency response profiles, and the activations among subjects were typically constrained within anatomical zones with respect to the LGN.
Correlation analysis
In contrast to the hemisphere-specific LGN, the TRN appears to contain a patchy representation of the contralateral hemifield. The functional significance of this finding is not clear from this experiment alone but does suggest that the TRN participates in a contralateral inhibitory circuit analogous to that seen arising from layer V of the cortex (Palmer et al., 2012), and the BOLD response recorded here may be driven by cortical-thalamic projections from this very circuit. Such an interpretation is consistent with recent findings in the walking cat (Marlinski et al., 2012), in which profound TRN modulation in the somatosensory sector was observed when the contralateral hemisphere received sensory input during stance. Our data are consistent with such a mechanism in the human brain, and also evidence that this effect can be observed in the passive state. Future studies should address whether this 20–60 Hz signal recorded in the TRN arises from the cortex, and if so, whether it participates in an interhemispheric circuit.
Conclusion
Here we describe a method for localizing the human TRN using high-resolution structural and functional MRI and a novel stimulus that permits access to the resonance properties of neural populations despite the temporal limitations of fMRI. We provide evidence that the TRN participates in a contralateral inhibitory circuit analogous to that between the two cortical hemispheres. Finally, we show that the TRN suppresses the transmission of visual flicker >20 Hz.
Footnotes
This work was supported by Natural Sciences and Engineering Research Council of Canada Discovery Grant to K.A.S.
The authors declare no competing financial interests.
References
- Bazhenov M, Timofeev I, Steriade M, Sejnowski TJ. Self-sustained rhythmic activity in the thalamic reticular nucleus mediated by depolarizing GABAA receptor potentials. Nat Neurosci. 1999;2:168–174. doi: 10.1038/5729. [DOI] [PubMed] [Google Scholar]
- Benjamini Y, Hochberg Y. Controlling the false discovery rate: a practical and powerful approach to multiple testing. J R Stat Soc B. 1995;57:289–300. [Google Scholar]
- Brainard DH. The Psychophysics Toolbox. Spat Vis. 1997;10:433–436. doi: 10.1163/156856897X00357. [DOI] [PubMed] [Google Scholar]
- Buzsáki G, Kaila K, Raichle M. Inhibition and brain work. Neuron. 2007;56:771–783. doi: 10.1016/j.neuron.2007.11.008. [DOI] [PMC free article] [PubMed] [Google Scholar]
- Contreras D, Destexhe A, Sejnowski TJ, Steriade M. Spatiotemporal patterns of spindle oscillations in cortex and thalamus. J Neurosci. 1997;17:1179–1196. doi: 10.1523/JNEUROSCI.17-03-01179.1997. [DOI] [PMC free article] [PubMed] [Google Scholar]
- Cotillon-Williams N, Huetz C, Hennevin E, Edeline JM. Tonotopic control of auditory thalamus frequency tuning by reticular thalamic neurons. J Neurophysiol. 2008;99:1137–1151. doi: 10.1152/jn.01159.2007. [DOI] [PubMed] [Google Scholar]
- Cox RW. AFNI: software for analysis and visualization of functional magnetic resonance neuroimages. Comput Biomed Res. 1996;29:162–173. doi: 10.1006/cbmr.1996.0014. [DOI] [PubMed] [Google Scholar]
- Crabtree JW, Isaac JT. New intrathalamic pathways allowing modality-related and cross-modality switching in the dorsal thalamus. J Neurosci. 2002;22:8754–8761. doi: 10.1523/JNEUROSCI.22-19-08754.2002. [DOI] [PMC free article] [PubMed] [Google Scholar]
- Crick F. Function of the thalamic reticular complex: the searchlight hypothesis. Proc Natl Acad Sci U S A. 1984;81:4586–4590. doi: 10.1073/pnas.81.14.4586. [DOI] [PMC free article] [PubMed] [Google Scholar]
- Derrington AM, Lennie P. Spatial and temporal contrast sensitivities of neurones in lateral geniculate nucleus of macaque. J Physiol. 1984;357:219–240. doi: 10.1113/jphysiol.1984.sp015498. [DOI] [PMC free article] [PubMed] [Google Scholar]
- Devlin JT, Sillery EL, Hall DA, Hobden P, Behrens TE, Nunes RG, Clare S, Matthews PM, Moore DR, Johansen-Berg H. Reliable identification of the auditory thalamus using multi-modal structural analyses. Neuroimage. 2006;30:1112–1120. doi: 10.1016/j.neuroimage.2005.11.025. [DOI] [PMC free article] [PubMed] [Google Scholar]
- Engel SA, Glover GH, Wandell BA. Retinotopic organization in human visual cortex and the spatial precision of functional MRI. Cereb Cortex. 1997;7:181–192. doi: 10.1093/cercor/7.2.181. [DOI] [PubMed] [Google Scholar]
- Halassa MM, Siegle JH, Ritt JT, Ting JT, Feng G, Moore CI. Selective optical drive of thalamic reticular nucleus generates thalamic bursts and cortical spindles. Nat Neurosci. 2011;14:1118–1120. doi: 10.1038/nn.2880. [DOI] [PMC free article] [PubMed] [Google Scholar]
- Herrmann CS. Human EEG responses to 1–100 Hz flicker: resonance phenomena in visual cortex and their potential correlation to cognitive phenomena. Exp Brain Res. 2001;137:346–353. doi: 10.1007/s002210100682. [DOI] [PubMed] [Google Scholar]
- Hughes SW, Lörincz M, Cope DW, Blethyn KL, Kékesi KA, Parri HR, Juhász G, Crunelli V. Synchronized oscillations at alpha and theta frequencies in the lateral geniculate nucleus. Neuron. 2004;42:253–268. doi: 10.1016/S0896-6273(04)00191-6. [DOI] [PubMed] [Google Scholar]
- Jones EG. Some aspects of the organization of the thalamic reticular complex. J Comp Neurol. 1975;162:285–308. doi: 10.1002/cne.901620302. [DOI] [PubMed] [Google Scholar]
- Long MA, Landisman CE, Connors BW. Small clusters of electrically coupled neurons generate synchronous rhythms in the thalamic reticular nucleus. J Neurosci. 2004;24:341–349. doi: 10.1523/JNEUROSCI.3358-03.2004. [DOI] [PMC free article] [PubMed] [Google Scholar]
- Macdonald KD, Fifkova E, Jones MS, Barth DS. Focal stimulation of the thalamic reticular nucleus induces focal gamma waves in cortex. J Neurophysiol. 1998;79:474–477. doi: 10.1152/jn.1998.79.1.474. [DOI] [PubMed] [Google Scholar]
- Mai JK, Paxinos G, Voss T. Atlas of the human brain. Ed 3. San Diego: Academic; 2007. [Google Scholar]
- Marlinski V, Sirota MG, Beloozerova IN. Differential gating of thalamocortical signals by reticular nucleus of thalamus during locomotion. J Neurosci. 2012;32:15823–15836. doi: 10.1523/JNEUROSCI.0782-12.2012. [DOI] [PMC free article] [PubMed] [Google Scholar]
- McAlonan K, Cavanaugh J, Wurtz RH. Attentional modulation of thalamic reticular neurons. J Neurosci. 2006;26:4444–4450. doi: 10.1523/JNEUROSCI.5602-05.2006. [DOI] [PMC free article] [PubMed] [Google Scholar]
- McAlonan K, Cavanaugh J, Wurtz RH. Guarding the gateway to cortex with attention in visual thalamus. Nature. 2008;456:391–394. doi: 10.1038/nature07382. [DOI] [PMC free article] [PubMed] [Google Scholar]
- Mukherjee P, Kaplan E. Dynamics of neurons in the cat lateral geniculate nucleus: in vivo electrophysiology and computational modeling. J Neurophysiol. 1995;74:1222–1243. doi: 10.1152/jn.1995.74.3.1222. [DOI] [PubMed] [Google Scholar]
- Muñoz F, Fuentealba P. Dynamics of action potential initiation in the GABAergic thalamic reticular nucleus in vivo. PLoS One. 2012;7:e30154. doi: 10.1371/journal.pone.0030154. [DOI] [PMC free article] [PubMed] [Google Scholar]
- O'Connor DH, Fukui MM, Pinsk MA, Kastner S. Attention modulates responses in the human lateral geniculate nucleus. Nat Neurosci. 2002;5:1203–1209. doi: 10.1038/nn957. [DOI] [PubMed] [Google Scholar]
- Palmer LM, Schulz JM, Murphy SC, Ledergerber D, Murayama M, Larkum ME. The cellular basis of GABA(B)-mediated interhemispheric inhibition. Science. 2012;335:989–993. doi: 10.1126/science.1217276. [DOI] [PubMed] [Google Scholar]
- Pelli DG. The VideoToolbox software for visual psychophysics: transforming numbers into movies. Spat Vis. 1997;10:437–442. doi: 10.1163/156856897X00366. [DOI] [PubMed] [Google Scholar]
- Pinault D. The thalamic reticular nucleus: structure, function and concept. Brain Res Brain Res Rev. 2004;46:1–31. doi: 10.1016/j.brainresrev.2004.04.008. [DOI] [PubMed] [Google Scholar]
- Previc FH. Functional specialization in the lower and upper visual fields in humans: its ecological origins and neurophysiological implications. Behav Brain Sci. 1990;13:519–542. doi: 10.1017/S0140525X00080018. [DOI] [Google Scholar]
- Saad ZS, Glen DR, Chen G, Beauchamp MS, Desai R, Cox RW. A new method for improving functional-to-structural MRI alignment using local Pearson correlation. Neuroimage. 2009;44:839–848. doi: 10.1016/j.neuroimage.2008.09.037. [DOI] [PMC free article] [PubMed] [Google Scholar]
- Schneider KA. Subcortical mechanisms of feature-based attention. J Neurosci. 2011;31:8643–8653. doi: 10.1523/JNEUROSCI.6274-10.2011. [DOI] [PMC free article] [PubMed] [Google Scholar]
- Schneider KA, Kastner S. Visual responses of the human superior colliculus: a high-resolution functional magnetic resonance imaging study. J Neurophysiol. 2005;94:2491–2503. doi: 10.1152/jn.00288.2005. [DOI] [PubMed] [Google Scholar]
- Schneider KA, Kastner S. Effects of sustained spatial attention in the human lateral geniculate nucleus and superior colliculus. J Neurosci. 2009;29:1784–1795. doi: 10.1523/JNEUROSCI.4452-08.2009. [DOI] [PMC free article] [PubMed] [Google Scholar]
- Schneider KA, Richter MC, Kastner S. Retinotopic organization and functional subdivisions of the human lateral geniculate nucleus: a high-resolution functional magnetic resonance imaging study. J Neurosci. 2004;24:8975–8985. doi: 10.1523/JNEUROSCI.2413-04.2004. [DOI] [PMC free article] [PubMed] [Google Scholar]
- Steriade M. Synchronized activities of coupled oscillators in the cerebral cortex and thalamus at different levels of vigilance. Cereb Cortex. 1997;7:583–604. doi: 10.1093/cercor/7.6.583. [DOI] [PubMed] [Google Scholar]
- Thomson DJ. Spectrum estimation and harmonic analysis. Proc IEEE. 1982;70:1055–1096. doi: 10.1109/PROC.1982.12433. [DOI] [Google Scholar]
- Weese GD, Phillips JM, Brown VJ. Attentional orienting is impaired by unilateral lesions of the thalamic reticular nucleus in the rat. J Neurosci. 1999;19:10135–10139. doi: 10.1523/JNEUROSCI.19-22-10135.1999. [DOI] [PMC free article] [PubMed] [Google Scholar]
- Wei L, Craigmile PF. Global and local spectral-based tests for periodicities. Biometrika. 2010;97:223–230. doi: 10.1093/biomet/asp079. [DOI] [Google Scholar]
- Yu XJ, Xu XX, He S, He J. Change detection by thalamic reticular neurons. Nat Neurosci. 2009;12:1165–1170. doi: 10.1038/nn.2373. [DOI] [PubMed] [Google Scholar]