

Abstract
Perceptual phase entrainment improves speech intelligibility by phase-locking the brain's high-excitability and low-excitability phases to relevant or irrelevant events in the speech input. However, it remains unclear whether phase entrainment to speech can be explained by a passive “following” of rhythmic changes in sound amplitude and spectral content or whether entrainment entails an active tracking of higher-level cues: in everyday speech, rhythmic fluctuations in low-level and high-level features always covary. Here, we resolve this issue by constructing novel speech/noise stimuli with intelligible speech but without systematic changes in sound amplitude and spectral content. The probability of detecting a tone pip, presented to human listeners at random moments during our speech/noise stimuli, was significantly modulated by the rhythmic changes in high-level information. Thus, perception can entrain to the speech rhythm even without concurrent fluctuations in sound amplitude or spectral content. Strikingly, the actual entrainment phase depended on the tone-pip frequency, with tone pips within and beyond the principal frequency range of the speech sound modulated in opposite fashion. This result suggests that only those neural populations processing the actually presented frequencies are set to their high-excitability phase, whereas other populations are entrained to the opposite, low-excitability phase. Furthermore, we show that the perceptual entrainment is strongly reduced when speech intelligibility is abolished by presenting speech/noise stimuli in reverse, indicating that linguistic information plays an important role for the observed perceptual entrainment.
Keywords: entrainment, envelope, high-level, oscillation, phase, speech
Introduction
Speech is intrinsically rhythmic. The brain makes use of this rhythmicity (Schroeder and Lakatos, 2009) by entraining its neural oscillations so their high-excitability phase matches informative features, increasing speech intelligibility (Ahissar et al., 2001; Luo and Poeppel, 2007; Kerlin et al., 2010; Ding and Simon, 2013), while the phase of low excitability is aligned with irrelevant information. It has been shown repeatedly that the neural phase is correlated with auditory perception (Henry and Obleser, 2012; Ng et al., 2012; but see Zoefel and Heil, 2013). Neural phase entrainment (between ∼2 and 8 Hz) is an integral part of many current theories of speech perception (Poeppel, 2003; Ghitza, 2011, 2012, 2013; Giraud and Poeppel, 2012). However, in normal speech sounds (Fig. 1A, top), the ongoing rhythmic modulations simultaneously affect all aspects of the signal, from low-level acoustic features (sound amplitude, spectral content) to higher-level phonetic ones (Fig. 1A, bottom). Neural phase entrainment to speech, therefore, can take place at all stages of auditory processing, even the earliest ones, such as the cochlea, in which neurons respond selectively to certain sound frequencies. This raises the possibility that much of the previously reported speech entrainment phenomena could merely derive from the rhythmic activation of the very input to the auditory system. In other words, speech entrainment could well reflect a passive, low-level process having little to do with phonetic information processing, or speech per se. Indeed, it is well known that phase entrainment can happen with rather low-level stimuli, such as pure tones [the basic mechanism for the auditory steady-state response (ASSR); Galambos et al., 1981], and that intelligibility is not required for entrainment to speech sound (Howard and Poeppel, 2010; Stefanics et al., 2010; Luo and Poeppel, 2012; Peelle et al., 2013). Logically, rhythmic activation of the cochlea must thus be sufficient to induce at least some forms of phase entrainment to speech, a conclusion that we do not question in this study. The specific question we ask is, rather, whether such low-level rhythmic activation is a necessary condition for phase entrainment to speech.
Figure 1.

Overview of the experimental approach. A, In normal speech sound (top), low-level features (such as slow amplitude fluctuations, here labeled as signal envelope and shown as the black signal, bottom) and fluctuations in high-level features (including, but not restricted to phonetic information; gray signal, bottom) covary. B, We constructed speech/noise snippets in which spectral energy is comparable across phases of the original signal envelope (A, bottom, black signal). To do so, original speech and complementary noise were summed, with the spectral content of the noise matched to counterbalance spectral differences between phases of the signal envelope of the original speech (see Materials and Methods; Fig. 2). Consequently, a hypothetical phase entrainment to the constructed stimuli could not be due to a mere “following” of low-level stimulus properties as the global signal envelope of the constructed snippets (and the underlying spectral content) did not show systematic fluctuations anymore (B, bottom, black signal; Fig. 3). However, high-level features of the constructed snippets (B, bottom, gray signal) still fluctuated with the rhythm of the original signal envelope. We were thus able to disentangle phase entrainment to low-level (fluctuations in amplitude and spectral content) and high-level (e.g., fluctuations in phonetic information) stimulus properties. Note that we equalize original signal envelope with high-level features (A, bottom) for the sake of convenience and illustrational purposes (as no quantitative measure is available in the literature). For our paradigm, it is enough to assume that the two quantities are positively related.
One way to demonstrate the existence of genuine high-level phase entrainment to phonetic information would be to create artificial speech stimuli in which only phonetic information, but no other aspect of the signal, fluctuates rhythmically. This strategy appears problematic, however, particularly as phonetic information is a rather ill-defined notion. Here, we took the complementary approach of designing speech stimuli in which the lowest-level information (sound amplitude and spectral content, corresponding to information processed in the cochlea) does not fluctuate along with the rhythm of speech (see Materials and Methods and Discussion). In short, we constructed speech/noise hybrid stimuli (Fig. 1B, top) with spectral content comparable across phases of the original signal envelope (see Fig. 3). Higher-level features still fluctuated rhythmically (Fig. 1B, bottom) and speech remained intelligible, providing potential means for (high-level) phase entrainment. Entrainment was assessed by presenting tone pips at auditory threshold at random moments during our stimuli. Can phase entrainment still happen without rhythmic fluctuations in the lowest-level acoustic signals? Answering this question has critical implications for current theories of speech perception.
Figure 3.

A, B, Amplitude spectra for original (A) and constructed snippets (B) as a function of different (binned) phases of the original signal envelope. Amplitudes are shown either as the color of a phase–frequency plot or as a family of curves where each trace represents the amplitude spectrum for one-phase bin. Note that amplitude spectra differ markedly across phase bins for the original snippets (A) whereas amplitude spectra are similar across phase bins for the constructed snippets (B). The spectral locations of the tone pips used in Experiments 1 (red) and 2 (gray) with respect to the entraining speech/noise stimuli are shown as dashed lines.
Materials and Methods
Stimulus overview.
As the heart of this study, we developed novel speech/noise stimuli without systematic fluctuations in amplitude and spectral content. Here we give a short overview, while the detailed procedure of stimulus construction is provided below. Original speech snippets were recorded (sampling rate, 44,100 Hz) of a male native-English speaker reading parts of a novel. Experimental stimuli were constructed by merging original speech with noise. Critically, spectral content and energy of the stimuli constructed in this way were designed to be statistically comparable at all phases of the original signal envelope. In normal speech sound, both spectral content and energy are not constant but fluctuate over time. Thus, when merging original speech snippets with noise, spectral content and energy of the noise had to be specifically adapted to the instantaneous characteristics (i.e., envelope phase; Fig. 1A, bottom) of the original speech. To do so, for each of the original speech snippets, a complementary noise was constructed: when spectral energy (the specific distribution of power across sound frequencies) of the original speech was high, that of the noise was low and vice versa. As spectral energy in the original speech fluctuated rhythmically (∼2–8 Hz), the perception of speech and noise in the constructed snippets also alternated rhythmically by construction. Importantly, the perception of speech was driven by high-level features and not by changes in sound amplitude or spectral content, as the latter was kept statistically comparable by stimulus construction (Fig. 1B, bottom, black line).
Use of terms and definitions.
To avoid ambiguity of some critical terms, we will shortly describe the usage of the most important expressions in the context of this study.
We defined “signal envelope” as the weighted sum of the instantaneous energy of the signal across frequencies. “Weighted” refers to the fact that frequency sensitivity is not constant in the auditory system, and energy at some frequencies is amplified more strongly by the system than energy at other frequencies (see Stimulus construction). Our choice of envelope definition was motivated by an observation from Ghitza (2001) stating that degraded envelope cues can be recovered by cochlear filtering. For instance, frequency-modulated stimuli with flat broadband (full-signal) envelopes can exhibit amplitude fluctuations at the cochlear output level (Ghitza et al., 2012). Importantly, here we aimed to avoid this confound by (1) extracting the signal envelope by wavelet transformation (which can be seen as a filtering of the speech signal into many narrow frequency bands); (2) spacing those “frequency bands” on a logarithmic scale (Ding and Simon, 2013), thus mimicking the spectral organization of the cochlea; and (3) weighing each of those frequency bands by the cochlear sensitivity at this particular frequency (see Stimulus construction). In fact, running original speech snippets through a bank of gammatone filters (a well known alternative method for simulating cochlear processing; Immerseel and Peeters, 2003) before calculating their envelope (as the sum of energy across frequencies) resulted in envelope phases that were strikingly similar to those obtained by our method (see Fig. 7C).
Figure 7.

Control experiments/analyses to rule out alternative explanations for the observed high-level modulation of click detection. A, B, Results of a control experiment in which subjects were asked to detect (A, 2400 Hz; B, 100 Hz) tone pips that were embedded in different noises. The noises were designed to have the average spectral content of the constructed speech/noise snippets either at the peak (Fig. 3B, phase 0) or the trough (Fig. 3B, phase ±π) of the original signal envelope (∼500 tone pips for each pip frequency and noise spectrum). As tone-pip detection probability did not differ between the two spectra, our effect cannot be explained by small residual spectral differences across original envelope phases in our constructed speech/noise stimuli. SEM across subjects is shown by error bars. C, Correlation of original envelope phases extracted as the sum of power across frequencies, either obtained by wavelet transformation (using 304 logarithmically spaced frequencies in the range between 0.59 and 21,345 Hz) and weighted by the cochlear sensitivity (x-axis), or by gammatone filtering (y-axis; 64 gammatone filters in the frequency range between 80 and 8020 Hz). Note that phases were divided into bins. The color bar shows the proportion (in percentage) of phase pairs (i.e., the phase obtained by wavelet transformation and cochlear weights paired with the corresponding phase obtained by gammatone filtering) falling into each phase bin. The similarity between the two methods for phase extraction is evident in that essentially all phase pairs lie on the diagonal, indicating that our method (wavelet transformation and cochlear weights) is essentially equivalent to that using cochlear (gammatone) filtering (see Materials and Methods).
Low-level and high-level features of speech are not well defined in the literature. In this study, speech/noise stimuli were constructed so that they could not passively entrain the lowest levels of auditory processing (such as the cochlear level, where speech and noise would excite the same cells to the same extent). Based on this, we term as “low-level” those speech features that are equated in our stimuli: sound amplitude and spectral content. Logically, then, we term the remaining features as “high level,” as they enable the listener to distinguish speech and noise on a processing level beyond the cochlea; and we emphasize that our high-level features include (but might not be restricted to) phonetic information.
When using the term “frequency,” we always refer to sound frequency (i.e., to speech sound or click frequency; the latter explicitly stated as such) and not, for instance, to the frequency of a brain oscillation. When using the term “phase,” we always refer to the (Hilbert) phase of the signal envelope (and not, for instance, to the spectral phase of the speech sound).
Participants.
Eleven participants volunteered in Experiments 1 and 2 (see below). Two participants were excluded from further analyses, one because of poor speech comprehension in the speech-attended condition task (see Experimental paradigm; d′ of −0.35), which was far below the average performance of the 11 subjects (0.71 ± 0.50), and the other because of missed button presses in 89% of the trials during the same task. Both reasons might have prevented proper phase entrainment. Nine subjects remained in the analyses of Experiments 1 and 2 (seven female; mean age, 27.8 years). Ten participants volunteered in Experiment 3 (four of whom had already participated in the other two experiments). One participant was excluded from further analyses due to an inability to differentiate forward and backward speech/noise sound, indicated by a poor performance in the associated perceptual task (see below; 51.7% correct) that was significantly worse (p < 0.001; Student's t test) than the mean performance of the other participants (on average, 81.5% correct). Nine subjects remained in the analyses of Experiment 3 (four female; mean age, 28.1 years). Participants of all experiments were fluent in English, reported normal hearing, and gave written informed consent. The experimental protocol was approved by the relevant ethical committee at Centre National de la Recherche Scientifique.
Stimulus construction.
The detailed procedure of stimulus construction is shown in Figure 2 and is described step by step as follows (the numbers correspond to those in Fig. 2): (1) The signal envelope env was extracted for each individual original snippet s as the sum of the instantaneous energy e (or amplitude; extracted by wavelet transformation for 304 logarithmically spaced frequencies in the range between 0.59 and 21,345 Hz) at each time point t of the signal across frequencies F, weighted by the cochlear sensitivity w (ISO 226 Equal-Loudness-Contour Signal for Matlab, J. Tackett) to correct for differences in frequency sensitivity in the auditory system according to the following equation:
 |
The envelope was then bandpass filtered between 2 and 8 Hz (second-order Butterworth filter). (2) A “target spectrum” (spectrumtarget) was computed from all original snippets. Here, the average amplitude spectrum [spectrumspeech(ϕ, f)] was extracted separately for different phases ϕ (divided into 12 nonoverlapping phase bins of width π/6) of the original signal envelope [i.e., for each envelope phase bin, spectra (spectruminst) were averaged across all instances I of the respective phase bin and across all snippets S] as follows:
 |
For each frequency f, spectrumtarget was twice the maximal amplitude across phase bins (this was necessary to leave enough “room” for additional noise at all time points of the original speech snippets) as expressed in the following equation: spectrumtarget (f) = 2 * max−π≤ϕ≤π spectrumspeech (ϕ, f). (3) To build the experimental stimuli, for each time point and each original snippet, the amplitude spectrum of the noise (individually generated for s and t) was constructed as the difference between spectrumtarget and spectrumspeech (i.e., the average amplitude spectrum across original snippets) for phase ϕ of the individual signal envelope of snippet s at time point t. Note that this difference depends on ϕ. This is thus a critical step to render spectral content comparable across all instances of ϕ: spectrumnoise (s, t) = spectrumtarget − spectrumspeech (ϕ(s, t)), where ϕ(s, t) = angle(hilbert[env(s, t)]). Note also that, for a given phase of the envelope, this difference is the same for all snippets, whereas the individual spectra at different instances of this phase might slightly differ from each other. This results in small random signal fluctuations that remain with each snippet and differ between individually constructed snippets (these random fluctuations can be seen, for instance, in panel 4 of Fig. 2, showing 1 s of a single constructed speech/noise snippet in the time–frequency domain). However, and importantly, these “residues” do not systematically depend on the phase of the original signal envelope, as they disappear upon averaging the spectral content for different envelope phases across snippets (Fig. 3). Spectrally matched noises were constructed by multiplying, for each time point, white noise (Fig. 2, rand) by spectrumnoise (s, t) in the wavelet domain. (4) Original snippets and constructed noises were added in the wavelet domain (note that the original speech remains intact, it is only “hidden” by the noise in various degrees, depending on the instantaneous phase of the original signal envelope). (5) Finally, this sum of original speech and constructed noise was transferred back into the real domain by inverse wavelet transform. Due to the overcomplete nature of our wavelet time–frequency decomposition (i.e., the fact that wavelets at neighboring frequencies significantly overlap in the frequency domain), this step produced residual errors: when expressed back into the wavelet domain, the resulting stimuli differed slightly from the intended time–frequency signal. However, this difference could be minimized by applying the desired wavelet amplitude to each wavelet coefficient and transforming again into the real domain. We iterated this correction procedure 100 times, yielding the final constructed snippets.
Figure 2.

Construction of the speech/noise stimuli that were used in this study. Original speech snippets and complementary noise (based on the instantaneous envelope phase of the individual snippet and the average original spectral content at the respective phase; see Materials and Methods for details) were added, yielding speech snippets with conserved high-level features (fluctuating in the frequency range of ∼2–8 Hz) but comparable spectral content across envelope phases. Parts processed in the real domain are specified in blue and as a signal in time. Parts processed in the wavelet domain are specified in red and are represented as a time–frequency signal.
The result of our stimulus construction procedure is shown in Figure 3: here, for both original and constructed speech snippets, the average amplitude spectrum is shown as a function of the envelope phase of the original speech snippets. As is clearly visible in Figure 3, different phases of the envelope differ markedly in both their spectral content and energy, as far as the original snippets are concerned. Yet, by processing the stimuli as described above, we were able to remove these fluctuations: both spectral content and energy of the constructed snippets are now, on average, comparable across phases of the original signal envelope. Thus, although systematic spectral energy fluctuations are removed by our stimulus processing (the circular correlation between envelope phases of original and constructed snippets is r = −0.042), speech sound is still intelligible and high-level features (e.g., phonetic information) still fluctuate rhythmically at ∼2–8 Hz, providing potential means for oscillatory phase entrainment.
Samples of several stages of stimulus processing (original speech snippet, constructed noise, final constructed speech snippet, reversed constructed speech snippet) are presented in Movie 1.
Experimental paradigm.
Phase entrainment to our constructed stimuli was assessed in three psychophysical experiments (tested on 3 separate days). For all experiments, one trial consisted of the presentation of a 6 s stimulus that was randomly chosen from all concatenated constructed snippets (total length, ∼10 min). Signals between concatenated snippets were interpolated to avoid artificial clicks that could potentially have influenced the subjects' performance. In 90% of the trials, between one and three (equal probability) tone pips were presented at threshold level at random moments during our speech/noise snippets. The remaining 10% of the trials were catch trials, where no tone pips were presented. It has been shown before that phase entrainment is frequency-specific: neural oscillations were entrained to their high-excitability phase only in those parts of monkey primary auditory cortex actually processing the sound frequency of the entraining stimulus, whereas in remaining areas oscillations were entrained to their low-excitability phase (O'Connell et al., 2011; Lakatos et al., 2013). Thus, we “probed” entrainment at two different sound frequencies. In Experiments 1 and 3, tone pips had a duration of 2.9 ms and a carrier frequency of 2.4 kHz, which was beyond the principal frequency range of our speech stimuli. In Experiment 2, tone pips had a duration of 30 ms and a frequency of 100 Hz, which was within the principal frequency range of our speech stimuli. The spectral location of the tone pips with respect to the spectral content of the entraining speech/noise stimuli is shown as dashed lines in Figure 3. The minimum interval between tone pips was 1 s. Subjects were asked to press a button whenever they detected such a tone pip. A tone pip was considered as detected, and the response classified as a hit, if the subjects pressed the response button within 1 s following tone-pip onset, otherwise as a miss. The amplitude of the tone pip was adapted constantly (based on the performance of the preceding 100 trials) so that tone-pip detection had a mean probability of 50%.
In Experiment 1, subjects were tested in two experimental conditions. In one (“speech-unattended”) condition, subjects were asked to attend only the tone pips and to ignore the speech sound. In the other (“speech-attended”) condition, subjects were asked to attend both tone pips and speech sound. In the latter condition, attention to speech was tested by an additional task in which subjects were presented with a word after each trial. Subjects had to indicate by a button press whether that word was or was not present in the previous trial (true on average in 63.7 ± 3.8% of the trials; mean and SD across subjects). The button press had to occur within 1 s after word presentation, increasing task difficulty. If subjects did not press any button during a given trial, their response was counted as a “word absent” press. Subjects completed 300 trials (on average 552 tone pips in the speech-attended condition and 537 tone pips in the speech-unattended condition) for both conditions.
In Experiment 2, subjects were asked to press a button for each detected tone pip, but to pay attention to both speech sound and tone pips. As we did not find differences between the two experimental conditions in the first experiment (data not shown), we did not include an attentional manipulation in this experiment. Subjects completed 600 trials (on average 1078 tone pips).
There is a current debate of whether intelligibility is important for phase entrainment to speech sound (Peelle and Davis, 2012; Ding and Simon, 2014), and there are studies supporting the view that speech comprehension is relevant (Gross et al., 2013; Peelle et al., 2013) and others indicating that it is not (Howard and Poeppel, 2010; Luo and Poeppel, 2012). In Experiment 3, we tackled this question by presenting our speech/noise snippets either forwards (“forward condition”) or backwards (“backward condition”), randomly determined from trial to trial. Only 2400 Hz tone pips were presented and subjects were asked to press a button for each detected tone pip. Additionally, subjects were asked to indicate by a button press after each trial whether the speech sound was played forwards or backwards. This was done to ensure that subjects indeed perceived the modulation in intelligibility. Subjects completed 300 trials for each condition (on average 531 and 546 tone pips for forward and backward condition, respectively).
Stimuli were presented diotically via loudspeakers (Logitech Z130). Subjects were seated 55 cm away from the loudspeakers, with their head position fixed by a chin rest. Sound level was adjusted to 75 dB SPL at the position of the chin rest for all subjects. The Psychophysics Toolbox for Matlab (Brainard, 1997) was used for stimulus presentation.
Data analyses.
To evaluate (perceptual) phase entrainment to our stimuli, the probability of detecting a tone pip was analyzed as a function of the phase of the original signal envelope of the snippets. Note that the signal envelope of the original snippet (computed using low-level features, i.e., instantaneous spectral energy) covaries with high-level features of both the original and the constructed speech sounds (e.g., phonetic information is highest at the peak of the envelope and lowest at its trough). The phase of the original signal envelope at each moment before and after the tone pip was divided into 40 overlapping π-wide bins. We used overlapping bins to smooth the outcome of our analyses without affecting the actual results (Fiebelkorn et al., 2013). Results were similar with nonoverlapping bins and different bin widths, including those used for stimulus construction (i.e., 12 non-overlapping bins; data not shown).
If there were phase entrainment to our speech/noise stimuli, detection of tone pips would depend on the phase of the original signal envelope. Also, this dependence would not necessarily be restricted to the time of the tone pip. Therefore, we fitted a sine wave to the average performance (tone-pip detection as a function of phase) across subjects, separately for each time point (downsampled to 100 Hz) in a time window of 1.6 s centered on tone-pip onset. The amplitude of this fitted sine wave reflects the magnitude of performance modulation by the phase of the original signal envelope (or equivalently, by rhythmic fluctuations in high-level information in the constructed speech/noise stimuli). For Experiments 1 and 2, as we found phase entrainment for both experiments (Fig. 4A), the two amplitudes obtained for both experiments were averaged. To test whether this modulation was significant for any time point around tone-pip onset, we used a permutation test to construct surrogate distributions for each time point. Here, hits and misses were shuffled for each subject separately before recalculating the amplitude values described above. This procedure was repeated 1,000,000 times. Thus, it was possible to obtain a range of amplitude values that can be observed under the null hypothesis that the original signal envelope does not affect detection of tone pips. p values were obtained for the recorded data by comparing “real” amplitude values with the surrogate distribution for each respective time point. p values were corrected for multiple comparisons using the false discovery rate (FDR) procedure. Here, a significance threshold is computed that sets the expected rate of falsely rejected null hypotheses at 5% (Benjamini and Hochberg, 1995).
Figure 4.

Perception entrains to speech rhythm in the absence of spectral energy fluctuations. A, Tone-pip detection probability as a function of the original signal envelope at different time points (offset in 2 rows). Note the sinusoidal modulation of performance for ∼250 ms before tone-pip onset. This modulation differs in phase between the two tone-pip frequencies (black: Experiment 1, tone-pip frequency 2400 Hz; gray: Experiment 2, tone-pip frequency 100 Hz), reflecting frequency-specific phase entrainment. Non-significant time windows of pooled data are shaded gray. SEM is shown by contours around the lines. B, Statistical significance of the phase entrainment shown above, pooled across experiments. Significance threshold is FDR corrected and shown as a dotted line.
A similar permutation procedure was used to compare effects for the two (speech-attended and speech-unattended) conditions in Experiment 1. Here, instead of shuffling hits and misses, the assignment of trials to both conditions was shuffled separately for each subject before recalculating the amplitude values described above. This procedure was repeated 100,000 times to obtain surrogate distributions for each time point under the null hypothesis that sine fit amplitudes do not differ across conditions.
All analyses were performed in Matlab. The Circular Statistics Toolbox for Matlab (Berens, 2009) was used for circular statistics.
Results
We constructed speech/noise stimuli without systematic fluctuations in sound amplitude and spectral content (Fig. 3) while keeping high-level features (including phonetic information) intact, fluctuating at ∼2–8 Hz (Fig. 1B, bottom). Stimuli were constructed by summing original speech snippets and their individually constructed, complementary noise, with the noise spectrally matched (i.e., having a phase-specific spectrum) to counterbalance differences in spectral content across phases of the original signal envelope (example sound files for stimulus construction are presented in Movie 1; see Materials and Methods). During certain phases of the original signal envelope (e.g., at its peak; Fig. 3A), when spectral energy of the original speech was already high, that of the added noise was low. Consequently, the perception of speech predominated that of noise. Vice versa, when spectral energy of the original speech was low (e.g., at its trough), that of the added noise was high and the perception of noise predominated that of speech (see Materials and Methods; Fig. 2). Phase entrainment to the generated speech/noise snippets was tested psychophysically by presenting tone pips at auditory threshold at random moments during the presentation of these stimuli (N = 9 subjects in all experiments). A dependence of tone-pip detection on the original signal envelope (which in our constructed speech/noise stimuli reflects high-level information) would indicate perceptual phase entrainment (note that we call this entrainment “high-level,” as it cannot take place on the lowest level of auditory processing, the cochlear level; see Introduction, Materials and Methods, and Discussion). As previous studies showed frequency-specific entrainment (O'Connell et al., 2011; Lakatos et al., 2013; see Materials and Methods), we “probed” entrainment by tone pips at two different frequencies (Fig. 3, dashed lines): one beyond the principal frequency range of our speech/noise stimuli (tone pip at 2400 Hz; Experiment 1) and one within the principal frequency range of our speech/noise stimuli (tone pip at 100 Hz; Experiment 2). In Experiment 1, the role of attention was tested in two experimental conditions (see Materials and Methods): subjects were given an additional task related to the content of the speech stimulus (after each trial, subjects had to decide whether a given word was present in the previous trial or not) or were told to ignore the speech sound. For the analysis of phase entrainment, as results did not differ between conditions (data not shown), trials have been pooled across conditions. In Experiment 2, subjects were told to attend to both speech and tone pips, but no additional task was given. In Experiment 3, the role of intelligibility was tested by presenting speech/noise stimuli either forwards or backwards. As in the other two experiments, subjects had to indicate tone-pip detection (only 2400 Hz) by a button press. In addition, to assure that subjects indeed perceived the modulation in intelligibility, they had to indicate after each trial whether the speech was played backwards or not.
Movie 1.
Speech/noise stimuli were constructed in this study by summing original speech snippets and their individually constructed, complementary noise, with the noise spectrally matched to counterbalance differences in spectral content across phases of the original signal envelope. Samples of several stages of stimulus processing (original speech snippet, constructed noise, final constructed speech snippet, reversed constructed speech snippet) are presented in this movie.
Behavioral results
As expected from our staircase procedure, subjects detected approximately half of the tone pips in all experiments (mean and SD: 51.8 ± 4.0% and 50.4 ± 0.8% in the speech-attended and speech-unattended conditions of Experiment 1, 50.7 ± 2.1% in Experiment 2, and 51.0 ± 1.6% in Experiment 3). In Experiment 1, both mean adjusted amplitude of the tone pips and median reaction time were slightly higher in the speech-attended (tone-pip amplitude: 0.154 ± 0.030 AU; reaction time: median, 0.53 s) than in the speech-unattended condition (tone-pip amplitude: 0.146 ± 0.029 AU; reaction time: median, 0.51 s), but not significantly different (tone-pip amplitude p = 0.59, Student's t test; reaction time p = 0.23, Kruskal-Wallis test). Median reaction time was 0.57 s in Experiment 2 and 0.58 s in Experiment 3. The adjusted tone-pip amplitude was higher in Experiment 2 than the mean of Experiments 1 and 3 (0.693 ± 0.351 vs 0.144 ± 0.034 AU; p < 0.001, Student's t test), most likely because the energy of the speech/noise signal was higher at that frequency. In all experiments, tone-pip amplitude did not differ between phase bins used for further analyses (p > 0.97; one-way ANOVA). False alarm probability (as the percentage of button presses in all nonoverlapping 1 s windows not following a tone pip) was on average 4.3 ± 2.1% and 3.5 ± 2.1% in the speech-attended and speech-unattended condition of Experiment 1, 3.8 ± 1.6% in Experiment 2, and 5.7 ± 3.0% in Experiment 3. The additional speech comprehension task in the speech-attended condition of Experiment 1 (see Materials and Methods) was rather difficult, but above chance level: on average, subjects completed the task with a d′ (a measurement of sensitivity to the task, combining both hits and false alarms; a d′ of 0 reflects performance at chance level) of 0.82 ± 0.40, significantly above 0 (p < 0.001). The performance in the additional task of Experiment 3 (see Materials and Methods) indicated that subjects did perceive the modulation of intelligibility: on average, the speech sound was correctly classified (forwards vs backwards) in 81.5 ± 13.1% of the cases.
Perception selectively entrains to speech rhythm in the absence of spectral energy fluctuations
Mean probability of tone-pip detection as a function of the original signal envelope at different time points around tone-pip onset is shown in Figure 4A for Experiments 1 and 2. In both cases, a sinusoidal modulation of performance by the original signal envelope is visible before tone-pip onset. Note that the same phase bins were used in Figures 3 and 4A. Our modulatory effect thus cannot be influenced by low-level features (i.e., amplitude fluctuations in specific frequency bands) as they have been made comparable across phase bins (Fig. 3B). However, higher-level features were still present in the constructed snippets and still fluctuated rhythmically as a function of the phase of the original signal envelope (Fig. 1, bottom). Consequently, the dependence of tone-pip detection probability on the phase of the original signal envelope can only be explained by an entrainment to the preserved rhythmic fluctuations in high-level features of the presented speech/noise sounds.
Strikingly, the actual phase of modulation clearly differed between the two experiments: a peak of the original signal envelope (phase 0; when the least amount of noise was added) ∼50 ms before tone-pip onset was favorable for detecting a 2400 Hz pip (Experiment 1), but, in stark contrast, was disadvantageous for detecting a 100 Hz pip (Experiment 2). A video of this frequency-specific entrainment effect, unfolding over time, is presented as Movie 2. To statistically evaluate phase entrainment to our stimuli, for each experiment a sine wave was fitted to the mean performance (detection of tone pip as a function of original signal envelope, averaged across subjects) at each time point around tone-pip onset, and its amplitude (averaged across the two experiments) was compared with surrogate distributions (see Materials and Methods). Results of this statistical test are shown in Figure 4B. Perceptual phase entrainment is significant between −250 and −30 ms with respect to click onset.
Movie 2.
Average performance (mean tone-pip detection probability as a function of phase of the original signal envelope) in time (−800 to +800 ms with respect to tone-pip onset), separately for the two tone-pip frequencies (2400 Hz, Experiment 1: black line and dark gray contour as mean and SEM, respectively; 100 Hz, Experiment 2: dark gray line and light gray contour). The contours change color (2400 Hz: red; 100 Hz: blue) during all significant time points of the pooled data (Fig. 4B). Note the phase opposition of the modulatory effect shortly before tone-pip onset, reflecting frequency-specific phase entrainment.
As mentioned above, we found perceptual phase entrainment in both experiments, but the actual phase of the modulatory effect seemed to depend on tone-pip frequency. Therefore, to quantify this effect, for each time point, we compared the phases of the sine waves that were fitted to the performance of single subjects (thus obtaining nine phases for each time point and tone-pip frequency; Watson-William test: tests whether two phase distributions have a different mean). The results of this test are shown in Figure 5, indicating that the modulatory phases of the two experiments significantly differed in a time window of ∼220 ms before tone-pip onset. The distribution of phase differences (Fig. 5, inset) at the time of maximal significance (at ∼−50 ms with respect to tone-pip onset) is strongly biased toward ±π, indicating a phase opposition of the modulatory effect at that time (Fig. 4A, compare respective time panels).
Figure 5.

Statistical significance (Watson-William test) of the circular difference between modulatory phases for the two tone-pip frequencies. A significant test value would indicate a modulation of tone-pip detection by the phase of the original signal envelope whose direction (e.g., favorable or disadvantageous) depends on tone-pip frequency. Note the similarity of the time window of significance to Figure 4B. The distribution of phase differences across subjects is shown as an inset for the time point of maximal significance. Note that this phase distribution is strongly biased toward ±π, indicating a phase opposition of the modulatory effect at that time. The FDR-corrected significance threshold is shown by a dotted line.
Perceptual phase entrainment depends on speech intelligibility
It is still under debate whether speech comprehension is critical for phase entrainment to speech sound (Peelle and Davis, 2012; Ding and Simon, 2014). Thus, we ran a third experiment in order to test the role of intelligibility for the observed phase entrainment. Again, subjects were asked to detect (2400 Hz) tone pips. However, the entraining speech/noise sound was presented either forwards or backwards. Obviously, if intelligibility played an important role for phase entrainment, one would expect a modulation of tone-pip detection by the original envelope phase only in the forward (but not in the backward) condition. Indeed, we were able to replicate the perceptual modulation observed in Experiment 1 (Fig. 6). Note that p values (corresponding to Fig. 4B) are smaller for the forward condition of Experiment 3 (Fig. 6A, blue line) than those for Experiment 1 (Fig. 6A, black line) due to a higher number of tone pips in Experiment 1 (1089 vs 531). However, both the magnitude and phase of the actual perceptual modulation (as visible in Fig. 6B for the time point of −230 ms with respect to tone-pip onset; corresponding to Fig. 4A) are very similar. Importantly, the effect is abolished for the backward condition (Fig. 6, red line), suggesting that the observed perceptual phase entrainment depends on speech intelligibility.
Figure 6.
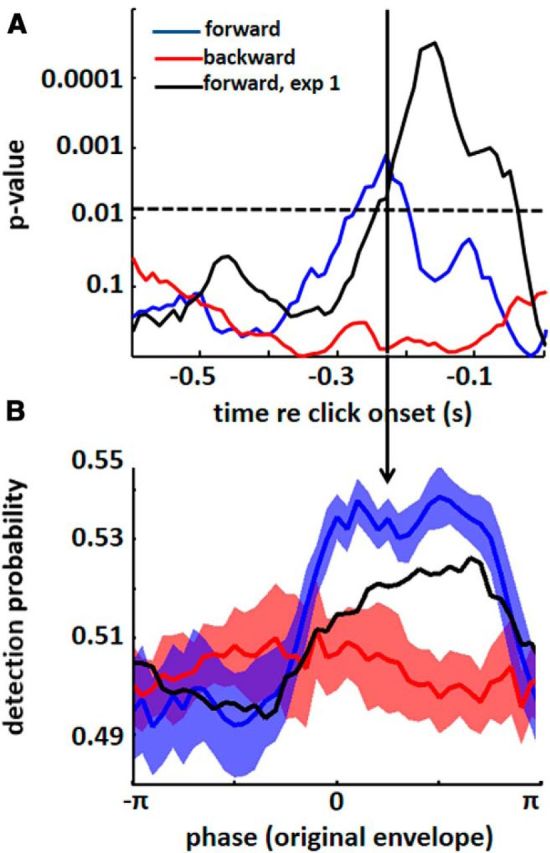
Perceptual phase entrainment depends on intelligibility. A, Statistical significance of perceptual phase entrainment in Experiment 3, corresponding to Figure 4B (for ease of comparison, results from Experiment 1 are also shown). The modulation of click detection by original envelope phase is significant (between 280 and 200 ms before tone-pip onset) for the forward condition (blue line; replicating the effect from Experiment 1, shown in black), but not for the backward condition (red line), indicating that the observed perceptual phase entrainment depends on intelligibility. Significance threshold is FDR-corrected and shown as a dotted line. B, Tone-pip detection probability as a function of the original signal envelope at −230 ms with respect to tone-pip onset. Note the sinusoidal modulation of performance for the forward condition, which is absent for the backward condition. This modulation has a similar degree and a similar phase as in Experiment 1, indicating that the effect could indeed be replicated. SEM is shown by contours around the lines.
In short, the presented findings demonstrate a frequency-specific high-level phase entrainment to speech sound that is tightly linked to intelligibility. These findings are as follows: (1) whether a tone pip is detected or not depends on the timing of high-level features before the tone pip is presented; (2) the direction of this dependence depends on the location of the tone pip with respect to the frequency content of the entraining stimuli (the detection of a tone pip located beyond or within the principal frequency range of the speech sound is modulated by preceding high-level features in an opposite fashion); and (3) the effect is abolished when speech/noise snippets are presented in reverse, indicating an important role of intelligibility for perceptual phase entrainment.
The observed effects are not due to small residual spectral differences during stimulus construction
One might argue that small residual spectral differences across original envelope phases in our stimuli could have been sufficient to produce the results presented here. Indeed, our stimulus construction method is based on iterative convergence toward a phase-equalized spectrum (see Materials and Methods), and small residual spectral differences can therefore not be totally excluded. To control for this, we designed noise stimuli displaying the average spectral content of our constructed speech/noise snippets either at the peak (Fig. 3B, phase 0) or the trough (Fig. 3B, phase ±π) of the original signal envelope, without any rhythmic modulation. We had seven subjects listen to these steady noise stimuli. We asked them to report the detection of embedded tone pips (same tone-pip frequencies as in Experiments 1/3 and 2) presented at random moments. The amplitude of the tone pips was determined in a pre-experiment such that ∼50% of the tone pips were detected when embedded in noise, presenting a spectrum equal to the average of the two spectra. During the control experiment, the tone-pip amplitude was kept constant. Importantly, detection of the tone pips did not differ between the two types of noise [on average, 52.2 vs 53.4% (2400 Hz pips; Fig. 7A) and 44.0 vs 45.0% (100 Hz pips; Fig. 7B) for peak vs trough, not significantly different: p = 0.79 (2400 Hz pips) and p = 0.81 (100 Hz pips), Student's t test]. This result suggests that our phase entrainment results cannot be explained by small residual spectral differences across original envelope phases. A related concern is whether momentary remaining fluctuations in the envelope of our constructed stimuli might influence perception as well (such momentary fluctuations are due to the fact that it is only the average spectral content that is comparable across original envelope phases). To test for this, we computed the modulation of tone-pip detection by the signal envelope of the constructed snippets (corresponding to Fig. 4B, which shows results from the same analysis, but with respect to the signal envelope of the original snippets). However, p values did not reach significance (same FDR-corrected significance threshold as for Fig. 4B), indicating that those remaining random fluctuations did not affect tone-pip detection (data not shown).
Discussion
Many studies showing phase entrainment to speech (Ahissar et al., 2001; Luo and Poeppel, 2007; Nourski et al., 2009; Kerlin et al., 2010; Horton et al., 2013; Millman et al., 2013; Zion Golumbic et al., 2013a, 2013b) did not fully disentangle low-level effects of fluctuations in sound amplitude or spectral content (corresponding to information processed in the cochlea) and covarying high-level effects (i.e., phase entrainment beyond the cochlear level). Theoretically, their findings could thus involve a passive phase locking of the auditory system to amplitude changes in the signal envelope (VanRullen et al., 2014). In particular, peaks and troughs in the signal envelope could systematically reset ongoing oscillations (Gross et al., 2013; Doelling et al., 2014), possibly resulting in regular repetitions of evoked potentials (i.e., ASSR)—and an apparent alignment between brain oscillations and speech sound. A conclusive answer to the question whether phase entrainment entails an active component was still lacking. Although the term “envelope tracking” is commonly used in the literature to describe the adjustment of oscillations to the regularity of speech sound (Giraud and Poeppel, 2012), the implied active mechanism has never been directly shown. Potential evidence for an active mechanism would be the demonstration that phase entrainment to speech entails a high-level process, such as phase locking to speech sound in the absence of systematic low-level fluctuations. Indeed, in this study, we provide evidence for an active, high-level process in phase entrainment to speech sound. We do so by controlling for differences in low-level properties (fluctuations in sound amplitude and spectral content) in speech sound while keeping both high-level information and intelligibility intact (Fig. 1B, bottom; Fig. 3).
An increasing number of recent studies have investigated the phenomenon of phase entrainment to speech, some of them highly relevant for the question mentioned above. In Doelling et al. (2014), each peak in the signal envelope was replaced by a peak of uniform height and shape (i.e., a pulse train was centered at envelope peaks, reflecting the stimulus rhythm), leaving only envelope cues but severely reducing high-level information. Although they found a drastic reduction of intelligibility, phase locking between brain oscillations and speech stimuli was not abolished, clearly underlining the importance of low-level features for phase entrainment. On the other hand, evidence for a high-level influence in phase entrainment to speech was reported by Peelle and colleagues (2013) and confirmed by Gross et al. (2013). They showed that, although neural oscillations did entrain to unintelligible sentences, phase locking was enhanced when intelligibility of speech was restored (Luo and Poeppel, 2007, their Fig. S2). Complementary to our study, Ding et al. (2013) reduced spectrotemporal fine structure of speech without strongly affecting the signal envelope. This manipulation resulted in an impaired phase locking to the signal envelope, indicating a role of high-level features in phase entrainment to speech. However, these reports of a high-level component in phase entrainment are still indirect, as they measure high-level modulations (e.g., by attention: Peelle et al., 2013; Zion Golumbic et al., 2013b; or intelligibility: Gross et al., 2013) of a phase entrainment that may still be primarily driven by low-level features of speech sound. Indeed, the existing literature remains compatible with the notion that low-level fluctuations are necessary for phase entrainment, and that this entrainment is merely upregulated or downregulated by high-level factors, such as attention or intelligibility. By contrast, the technique presented here allowed us, for the first time, to isolate high-level fluctuations in speech sound: we could demonstrate that low-level features of speech are not necessary to induce phase entrainment, and thus that this entrainment truly entails a high-level process.
Furthermore, the role of intelligibility in phase entrainment is currently under debate: on the one hand, intelligibility is not required for entrainment to speech sound (Howard and Poeppel, 2010; Luo and Poeppel, 2012; Peelle et al., 2013); on the other hand, phase entrainment is enhanced in intelligible compared with nonintelligible sentences (Gross et al., 2013; Peelle et al., 2013). Here, we were able to show that high-level perceptual phase entrainment depends on intelligibility (Fig. 6), indicating that comprehension is indeed an important factor for the brain's adjustment to speech sound.
Again, we note that low-level and high-level features of speech are not well defined in the literature. For instance, phonemes are normally defined in terms of what is perceived than in terms of acoustic patterns, and auditory processing beyond the cochlear level is complex and not well understood (Moore, 2003; Nelken, 2008). Because all phases were equalized with respect to their amplitude and spectral content, the underlying rhythm cannot passively entrain the lowest (i.e., cochlear) level of auditory processing, where every rhythmic phase should normally excite the same cells to the same extent. We do not want to discount the possibility, however, that part of the remaining auditory fluctuations may entail “low-level” features, as this directly depends on one's specific definition of low-level versus high-level speech information. What we can argue, nonetheless, is that some of the most basic low-level properties of speech (fluctuations in sound amplitude and spectral content) are not strictly necessary for phase entrainment—something that had not been shown before.
It was recently demonstrated that phase entrainment of neural oscillations can be frequency specific: Lakatos et al. (2013) and O'Connell et al. (2011) presented regular trains of clicks while recording in different regions of monkey A1, whose response properties either matched the frequency of the click [“best frequency” (BF) regions] or did not match the frequency of the click (non-BF regions). They found that only BF regions entrained their high-excitability phase to the expected click onset whereas entrainment of low-excitability phase was found in non-BF regions, indicating a suppression of neuronal responses in regions not tuned to the respective frequencies. This property of phase entrainment can be described as a spectrotemporal amplifier–attenuator system: important events are aligned with periodically reoccurring “windows of opportunity” (Buzsáki and Draguhn, 2004) for stimulus processing, but only in brain regions processing the concerned frequencies, resulting in an alignment of the high-excitability phase with and an amplification of the expected events. Critically, these “windows” are closed in brain regions processing irrelevant frequencies, resulting in an alignment of low-excitability phase with and an attenuation of unexpected or irrelevant events (Lakatos et al., 2013). In our study, we show for the first time that frequency-specific entrainment can also be found in humans and that it directly affects perception. Whereas we found perceptual phase entrainment in both experiments, reflected by a modulation of tone-pip detection by the phase of the original envelope, the actual phase of the modulatory effect depended on the frequency of the tone pip and was different for tone pips beyond and within the principal frequency content of the speech stimuli, respectively.
Although a logical next step could be to combine these psychophysical data with electrophysiological recordings, for instance using electroencephalography (EEG), we argue that our present demonstration of phase entrainment at the perceptual (rather than the neural) level is, in this case, even more sensitive. Our results must imply that at least some neuronal population is tracking the rhythm of high-level features. On the other hand, this population's activity may or may not be sufficiently high to be visible in EEG. Further studies are necessary to clarify this issue. Furthermore, in the present study, we constructed speech/noise stimuli such that the average activity profile in the cochlea does not differ across original signal envelope phases. However, it is possible that for some phases the cochlear activity deviates around the mean (across different envelope cycles) more than for others. Similarly, we did not equalize instantaneous spectral entropy across original envelope phases. Thus, as a next step, it would be interesting to use stimuli where not only the mean spectral content is made comparable across envelope phases (a first-order control), but also its temporal variability and/or spectral entropy (a second-order control).
In this study, entrainment to speech sound lasted only one cycle of the signal envelope (200–250 ms; Fig. 4). Based on previous reports in vision, this finding might seem surprising at first glance: it has been shown that visual stimuli influence the visual system for a much longer time (VanRullen and Macdonald, 2012). One reason for this discrepancy between visual and auditory processing might originate from the need for flexible sampling of the auditory system, which, in contrast to the visual system, relies heavily on temporal, continuously changing information (Thorne and Debener, 2014). Whereas a visual scene might be stable for a relatively long time, acoustic stimuli are fluctuating by nature. Consequently, temporal predictions (reflected by phase entrainment) about the “auditory world” might only be possible for the near future; predictions that reach too far ahead might easily turn out to be wrong and could even be disruptive for auditory processing (VanRullen et al., 2014). In line with our finding, Lalor and Foxe (2010) showed that the signal envelope of speech sound is reflected in EEG data for a period corresponding to ∼1 envelope cycle (200–250 ms).
In conclusion, as it was demonstrated here, perceptual phase entrainment in the auditory system is possible in the absence of spectral energy fluctuations. Our results indicate that, even in response to nontrivially rhythmic stimuli (not containing any obvious rhythmic fluctuations in their lowest-level features), the brain actively generates predictions about upcoming input by using stimulus features on a relatively high cognitive level (which is necessary when differentiating speech from noise). These predictions depend on intelligibility of the underlying speech sound and have frequency-specific consequences on stimulus processing in the auditory system, opening “windows of opportunity” for relevant frequencies, but closing them for others.
Footnotes
This work was supported by a Studienstiftung des deutschen Volkes (German National Academic Foundation) scholarship to B.Z. and a European Young Investigator Award to R.V. The authors thank Daniel Pressnitzer and Jesko Verhey for helpful comments and discussions.
The authors declare no competing financial interests.
References
- Ahissar E, Nagarajan S, Ahissar M, Protopapas A, Mahncke H, Merzenich MM. Speech comprehension is correlated with temporal response patterns recorded from auditory cortex. Proc Natl Acad Sci U S A. 2001;98:13367–13372. doi: 10.1073/pnas.201400998. [DOI] [PMC free article] [PubMed] [Google Scholar]
- Benjamini Y, Hochberg Y. Controlling the false discovery rate: a practical and powerful approach to multiple testing. J R Stat Soc Ser B Methodol. 1995;57:289–300. [Google Scholar]
- Berens P. CircStat: A Matlab toolbox for circular statistics. J Stat Softw. 2009;31:1–21. [Google Scholar]
- Brainard DH. The psychophysics toolbox. Spat Vis. 1997;10:433–436. doi: 10.1163/156856897X00357. [DOI] [PubMed] [Google Scholar]
- Buzsáki G, Draguhn A. Neuronal oscillations in cortical networks. Science. 2004;304:1926–1929. doi: 10.1126/science.1099745. [DOI] [PubMed] [Google Scholar]
- Ding N, Simon JZ. Adaptive temporal encoding leads to a background-insensitive cortical representation of speech. J Neurosci. 2013;33:5728–5735. doi: 10.1523/JNEUROSCI.5297-12.2013. [DOI] [PMC free article] [PubMed] [Google Scholar]
- Ding N, Simon JZ. Cortical entrainment to continuous speech: functional roles and interpretations. Front Hum Neurosci. 2014;8:311. doi: 10.3389/fnhum.2014.00311. [DOI] [PMC free article] [PubMed] [Google Scholar]
- Ding N, Chatterjee M, Simon JZ. Robust cortical entrainment to the speech envelope relies on the spectro-temporal fine structure. Neuroimage. 2013;88C:41–46. doi: 10.1016/j.neuroimage.2013.10.054. [DOI] [PMC free article] [PubMed] [Google Scholar]
- Doelling KB, Arnal LH, Ghitza O, Poeppel D. Acoustic landmarks drive delta-theta oscillations to enable speech comprehension by facilitating perceptual parsing. Neuroimage. 2014;85:761–768. doi: 10.1016/j.neuroimage.2013.06.035. [DOI] [PMC free article] [PubMed] [Google Scholar]
- Fiebelkorn IC, Snyder AC, Mercier MR, Butler JS, Molholm S, Foxe JJ. Cortical cross-frequency coupling predicts perceptual outcomes. Neuroimage. 2013;69:126–137. doi: 10.1016/j.neuroimage.2012.11.021. [DOI] [PMC free article] [PubMed] [Google Scholar]
- Galambos R, Makeig S, Talmachoff PJ. A 40-Hz auditory potential recorded from the human scalp. Proc Natl Acad Sci U S A. 1981;78:2643–2647. doi: 10.1073/pnas.78.4.2643. [DOI] [PMC free article] [PubMed] [Google Scholar]
- Ghitza O. On the upper cutoff frequency of the auditory critical-band envelope detectors in the context of speech perception. J Acoust Soc Am. 2001;110:1628–1640. doi: 10.1121/1.1396325. [DOI] [PubMed] [Google Scholar]
- Ghitza O. Linking speech perception and neurophysiology: speech decoding guided by cascaded oscillators locked to the input rhythm. Front Psychol. 2011;2:130. doi: 10.3389/fpsyg.2011.00130. [DOI] [PMC free article] [PubMed] [Google Scholar]
- Ghitza O. On the role of theta-driven syllabic parsing in decoding speech: intelligibility of speech with a manipulated modulation spectrum. Front Psychol. 2012;3:238. doi: 10.3389/fpsyg.2012.00238. [DOI] [PMC free article] [PubMed] [Google Scholar]
- Ghitza O. The theta-syllable: a unit of speech information defined by cortical function. Front Psychol. 2013;4:138. doi: 10.3389/fpsyg.2013.00138. [DOI] [PMC free article] [PubMed] [Google Scholar]
- Ghitza O, Giraud AL, Poeppel D. Neuronal oscillations and speech perception: critical-band temporal envelopes are the essence. Front Hum Neurosci. 2012;6:340. doi: 10.3389/fnhum.2012.00340. [DOI] [PMC free article] [PubMed] [Google Scholar]
- Giraud AL, Poeppel D. Cortical oscillations and speech processing: emerging computational principles and operations. Nat Neurosci. 2012;15:511–517. doi: 10.1038/nn.3063. [DOI] [PMC free article] [PubMed] [Google Scholar]
- Gross J, Hoogenboom N, Thut G, Schyns P, Panzeri S, Belin P, Garrod S. Speech rhythms and multiplexed oscillatory sensory coding in the human brain. PLoS Biol. 2013;11:e1001752. doi: 10.1371/journal.pbio.1001752. [DOI] [PMC free article] [PubMed] [Google Scholar]
- Henry MJ, Obleser J. Frequency modulation entrains slow neural oscillations and optimizes human listening behavior. Proc Natl Acad Sci U S A. 2012;109:20095–20100. doi: 10.1073/pnas.1213390109. [DOI] [PMC free article] [PubMed] [Google Scholar]
- Horton C, D'Zmura M, Srinivasan R. Suppression of competing speech through entrainment of cortical oscillations. J Neurophysiol. 2013;109:3082–3093. doi: 10.1152/jn.01026.2012. [DOI] [PMC free article] [PubMed] [Google Scholar]
- Howard MF, Poeppel D. Discrimination of speech stimuli based on neuronal response phase patterns depends on acoustics but not comprehension. J Neurophysiol. 2010;104:2500–2511. doi: 10.1152/jn.00251.2010. [DOI] [PMC free article] [PubMed] [Google Scholar]
- Immerseel LV, Peeters S. Digital implementation of linear gammatone filters: comparison of design methods. Acoust Res Lett Online. 2003;4:59–64. doi: 10.1121/1.1573131. [DOI] [Google Scholar]
- Kerlin JR, Shahin AJ, Miller LM. Attentional gain control of ongoing cortical speech representations in a “cocktail party.”. J Neurosci. 2010;30:620–628. doi: 10.1523/JNEUROSCI.3631-09.2010. [DOI] [PMC free article] [PubMed] [Google Scholar]
- Lakatos P, Musacchia G, O'Connel MN, Falchier AY, Javitt DC, Schroeder CE. The spectrotemporal filter mechanism of auditory selective attention. Neuron. 2013;77:750–761. doi: 10.1016/j.neuron.2012.11.034. [DOI] [PMC free article] [PubMed] [Google Scholar]
- Lalor EC, Foxe JJ. Neural responses to uninterrupted natural speech can be extracted with precise temporal resolution. Eur J Neurosci. 2010;31:189–193. doi: 10.1111/j.1460-9568.2009.07055.x. [DOI] [PubMed] [Google Scholar]
- Luo H, Poeppel D. Phase patterns of neuronal responses reliably discriminate speech in human auditory cortex. Neuron. 2007;54:1001–1010. doi: 10.1016/j.neuron.2007.06.004. [DOI] [PMC free article] [PubMed] [Google Scholar]
- Luo H, Poeppel D. Cortical oscillations in auditory perception and speech: evidence for two temporal windows in human auditory cortex. Front Psychol. 2012;3:170. doi: 10.3389/fpsyg.2012.00170. [DOI] [PMC free article] [PubMed] [Google Scholar]
- Millman RE, Prendergast G, Hymers M, Green GG. Representations of the temporal envelope of sounds in human auditory cortex: can the results from invasive intracortical “depth” electrode recordings be replicated using non-invasive MEG “virtual electrodes”? Neuroimage. 2013;64:185–196. doi: 10.1016/j.neuroimage.2012.09.017. [DOI] [PubMed] [Google Scholar]
- Moore BCJ. An introduction to the psychology of hearing. Amsterdam: Academic; 2003. [Google Scholar]
- Nelken I. Processing of complex sounds in the auditory system. Curr Opin Neurobiol. 2008;18:413–417. doi: 10.1016/j.conb.2008.08.014. [DOI] [PubMed] [Google Scholar]
- Ng BS, Schroeder T, Kayser C. A precluding but not ensuring role of entrained low-frequency oscillations for auditory perception. J Neurosci. 2012;32:12268–12276. doi: 10.1523/JNEUROSCI.1877-12.2012. [DOI] [PMC free article] [PubMed] [Google Scholar]
- Nourski KV, Reale RA, Oya H, Kawasaki H, Kovach CK, Chen H, Howard MA, 3rd, Brugge JF. Temporal envelope of time-compressed speech represented in the human auditory cortex. J Neurosci. 2009;29:15564–15574. doi: 10.1523/JNEUROSCI.3065-09.2009. [DOI] [PMC free article] [PubMed] [Google Scholar]
- O'Connell MN, Falchier A, McGinnis T, Schroeder CE, Lakatos P. Dual mechanism of neuronal ensemble inhibition in primary auditory cortex. Neuron. 2011;69:805–817. doi: 10.1016/j.neuron.2011.01.012. [DOI] [PMC free article] [PubMed] [Google Scholar]
- Peelle JE, Davis MH. Neural oscillations carry speech rhythm through to comprehension. Front Psychol. 2012;3:320. doi: 10.3389/fpsyg.2012.00320. [DOI] [PMC free article] [PubMed] [Google Scholar]
- Peelle JE, Gross J, Davis MH. Phase-locked responses to speech in human auditory cortex are enhanced during comprehension. Cereb Cortex. 2013;23:1378–1387. doi: 10.1093/cercor/bhs118. [DOI] [PMC free article] [PubMed] [Google Scholar]
- Poeppel D. The analysis of speech in different temporal integration windows: cerebral lateralization as “asymmetric sampling in time.”. Speech Commun. 2003;41:245–255. [Google Scholar]
- Schroeder CE, Lakatos P. Low-frequency neuronal oscillations as instruments of sensory selection. Trends Neurosci. 2009;32:9–18. doi: 10.1016/j.tins.2008.09.012. [DOI] [PMC free article] [PubMed] [Google Scholar]
- Stefanics G, Hangya B, Hernádi I, Winkler I, Lakatos P, Ulbert I. Phase entrainment of human delta oscillations can mediate the effects of expectation on reaction speed. J Neurosci. 2010;30:13578–13585. doi: 10.1523/JNEUROSCI.0703-10.2010. [DOI] [PMC free article] [PubMed] [Google Scholar]
- Thorne JD, Debener S. Look now and hear what's coming: on the functional role of cross-modal phase reset. Hear Res. 2014;307:144–152. doi: 10.1016/j.heares.2013.07.002. [DOI] [PubMed] [Google Scholar]
- VanRullen R, Macdonald JS. Perceptual echoes at 10 Hz in the human brain. Curr Biol. 2012;22:995–999. doi: 10.1016/j.cub.2012.03.050. [DOI] [PubMed] [Google Scholar]
- VanRullen R, Zoefel B, Ilhan B. On the cyclic nature of perception in vision versus audition. Philos Trans R Soc Lond B Biol Sci. 2014;369:20130214. doi: 10.1098/rstb.2013.0214. [DOI] [PMC free article] [PubMed] [Google Scholar]
- Zion Golumbic E, Cogan GB, Schroeder CE, Poeppel D. Visual input enhances selective speech envelope tracking in auditory cortex at a “cocktail party.”. J Neurosci. 2013a;33:1417–1426. doi: 10.1523/JNEUROSCI.3675-12.2013. [DOI] [PMC free article] [PubMed] [Google Scholar]
- Zion Golumbic EM, Ding N, Bickel S, Lakatos P, Schevon CA, McKhann GM, Goodman RR, Emerson R, Mehta AD, Simon JZ, Poeppel D, Schroeder CE. Mechanisms underlying selective neuronal tracking of attended speech at a “cocktail party.”. Neuron. 2013b;77:980–991. doi: 10.1016/j.neuron.2012.12.037. [DOI] [PMC free article] [PubMed] [Google Scholar]
- Zoefel B, Heil P. Detection of near-threshold sounds is independent of EEG phase in common frequency bands. Front Psychol. 2013;4:262. doi: 10.3389/fpsyg.2013.00262. [DOI] [PMC free article] [PubMed] [Google Scholar]