Abstract
EphB1, expressed in Müller cells, and ephrinB2, expressed in both Müller cells and retinal ganglion cells (RGCs), constitute an EphB/ephrinB reverse signaling in RGCs. Whether and how this reverse signaling is involved in RGC apoptosis in a rat chronic ocular hypertension (COH) model was investigated. In the COH model, both EphB1 and ephrinB2 were significantly increased and the reverse signaling was activated, which was accompanied by increased protein levels of phosphorylated (p) src, GluA2, and p-GluA2. Intravitreal injection of EphB2-Fc, an activator of ephrinB2, induced an increase in TUNEL-positive signals in normal retinae. A coimmunoprecipitation assay demonstrated direct interactions among ephrinB2, p-src, and GluA2. Moreover, in COH rats the expression of GluA2 proteins on the surface of retinal cells was decreased. Such GluA2 endocytosis could be prevented by preoperational intravitreal injection of 4-amino-3-(4-chlorophenyl)-1-(t-butyl)-1H-pyrazolo [3,4-d] pyrimidine (PP2), an inhibitor of src family tyrosine kinases, and possibly involved the protein interacting with C kinase 1 and phosphorylation of GluA2. In normal rats, intravitreal injection of EphB2-Fc caused changes in these protein levels similar to those observed in COH rats, which all could be avoided by preinjection of PP2. Patch-clamp experiments further showed that the current–voltage relationship of AMPA receptor-mediated EPSCs of RGCs exhibited stronger inward rectification in EphB2-Fc-injected rats. Furthermore, preinjection of PP2 or N-[3-[[4-[(3-aminopropyl)amino]butyl]amino]propyl]-1-naphthaleneacetamide trihydrochloride) (Naspm), a Ca2+-permeable GluA2-lacking AMPA receptor inhibitor, remarkably inhibited RGC apoptosis in either EphB2-Fc-injected or COH rats. Together, elevated GluA2 trafficking induced by activated EphB2/ephrinB2 reverse signaling likely contributes to RGC apoptosis in COH rats.
Keywords: AMPA receptor trafficking, apoptosis, EphB/ephrinB reverse signaling, glaucoma, GluA2, retinal ganglion cell
Introduction
Erythropoietin-producing hepatocyte receptors (Ephs), which consist of 16 structurally related transmembrane receptor tyrosine kinases (EphA1–A10 and EphB1–B6), are activated by their corresponding ligands, ephrinA (A1–A5) and ephrinB (B1–B3; Pasquale, 2008). Ephs and ephrins exist in two neighboring cells respectively, showing a reciprocal expression pattern. The ephrin/Eph signaling system is characterized by generating bidirectional signals that exert actions on both receptor-expressing cells (forward signaling) and ephrin-expressing cells (reverse signaling; Murai and Pasquale, 2004; Pasquale, 2008). Both types of signaling play important roles in modulating a variety of physiological and pathological processes (Kullander and Klein, 2002; Yamaguchi et al., 2004; Pasquale, 2005, 2008; Egea and Klein, 2007; Himanen et al., 2007; Klein, 2009; Lai and Ip, 2009; Chen et al., 2012; Hruska and Dalva, 2012). In the CNS, there is much evidence indicating that ephrinB/EphB signaling may be involved in excitotoxic neuronal death by directly interacting with NMDA receptors and/or metabotropic glutamate receptors (mGluR1; Dalva et al., 2000; Takasu et al., 2002; Grunwald et al., 2004; Calò et al., 2005a,b). In rat cultured cortical neurons, for instance, the treatment with EphB1-Fc, an activator of ephrinB reverse signaling, amplified the potentiation of NMDA toxicity mediated by mGlu1 receptors (Calò et al., 2005a), thus contributing to excitotoxic neuronal death (Grunwald et al., 2004; Calò et al., 2006).
Ephrin/Eph signaling is also implicated in retinal activity. Specifically, in experimental glaucomatous animals, EphB2, EphB3, and ephrinB3 mRNAs are upregulated at the optic nerve head (ONH), as demonstrated by in situ hybridization and RT-PCR techniques (Du et al., 2007; Fu et al., 2010). This result is consistent with observations in monkeys and human glaucomatous patients (Schmidt et al., 2007). Furthermore, the application of EphB2-Fc, an activator of ephrinB2, to the ONHs of spontaneous glaucomatous DBA/2J mice caused an elevation in intracellular Ca2+ concentrations in single retinal ganglion cell (RGC) axons, suggesting that EphB/ephrinB reverse signaling may contribute to the axon loss in these animals (Du et al., 2007; Fu et al., 2010). More recently, it has been reported that more serious degeneration was found in optic neuronal axons in an experimental glaucomatous model conducted in EphB2−/− and EphB3−/− mice, and the application of EphB2-Fc enhanced axonal survival in EphB2−/− and EphB3−/− glaucomatous mice (Fu and Sretavan, 2012). All of these results suggest that the activation of ephrinB/EphB signaling, both forward and reverse, is closely related to RGC axon survival in glaucoma. The present study was undertaken with the aim of exploring whether and how EphB/ephrinB signaling contributes to RGC apoptosis in experimental glaucomatous animals. We show that EphB/ephrinB reverse signaling is activated in a chronic ocular hypertension (COH) rat model, which leads to a significant increase in RGC apoptosis. We further demonstrate that elevated trafficking of Ca2+-impermeable GluA2-containing AMPA receptors in RGCs, induced by the activation of EphB/ephrinB reverse signaling, contributes to RGC apoptosis in COH rats.
Materials and Methods
Animals and rat COH model.
All experimental procedures described here were performed in accordance with the National Institutes of Health Guide for the Care and Use of Laboratory Animals and the guidelines of Fudan University on the ethical use of animals. During this study, all efforts were made to minimize the number of animals used and their suffering. Male Sprague Dawley rats, weighing 100–250 g, obtained from Shanghai Laboratory Animal Center Laboratory Animal Co., Ltd., were housed on a 12 h light/dark schedule, with standard food and water provided ad libitum.
COH rats were reproduced following the procedure previously described in detail (Wu et al., 2010; Chen et al., 2011; Ji et al., 2012). Briefly, in anesthetized rats three episcleral veins of the left eyes were ligated or cauterized. A sham operation, following a similar procedure (except for not occluding the vines), was conventionally performed on the eyes of other rats. Intraocular pressure (IOP) was measured using a handheld digital tonometer (Tonolab, TioLat) under general and local anesthesia as described above. The average value of five consecutive measurements with a deviation of <5% was accepted. All measurements were performed in the morning to avoid possible circadian differences. The IOPs of both eyes were measured before surgery (baseline), immediately after surgery (day 0), the day after surgery (day 1), the third and seventh days after surgery (day 3 and 1 week), and weekly afterward.
Intravitreal injection.
The procedure for intravitreal injection refers to a previous study (Ji et al., 2012). When the pupil of the anesthetized eye was dilated with tropicamide drops, 4-amino-3-(4-chlorophenyl)-1-(t-butyl)-1H-pyrazolo [3,4-d] pyrimidine (PP2; 100 μm), EphB2-Fc (2 μg), or N-[3-[[4-[(3-aminopropyl)amino]butyl]amino]propyl]-1-naphthaleneacetamide trihydrochloride (Naspm; 10 μm) dispersed in 2 μl of 0.9% saline was injected into the vitreous space through a postlimbus spot using a microinjector (Hamilton) under a stereoscopic microscope (Carl Zeiss). A 30-gauge needle was inserted 2 mm behind the temporal limbus and directed toward the optic nerve. Eyes that received only an injection of saline or human Ig-Fc in the same manner served as a vehicle or negative control (Ctr).
Retrograde labeling of RGCs.
Retrograde labeling of RGCs was previously described in detail (Zhao et al., 2010; Ji et al., 2011). Briefly, 1% cholera toxin B subunit (CTB; List Biological Laboratories) was injected into the superior colliculus bilaterally (6.0 mm posterior and 2.0 mm lateral to the bregma, and 4–5 mm deep from the cortical surface).
Immunohistochemistry.
As described in previous studies (Chen et al., 2011; Ji et al., 2011, 2012), with some modifications, retinal sections were immunohistochemically examined. Rats were anesthetized and transcardially perfused with 4% paraformaldehyde (PFA; in 0.1 m PB, pH 7.4). The eyeballs were post-fixed in 4% PFA for 2–4 h and then dehydrated with graded sucrose solutions at 4°C (4 h in 20% and overnight in 30% solutions). The retinae were vertically sectioned at a thickness of 14 μm (Leica), and the sections were mounted on chrome-alum-gelatin-coated slides (Fisher Scientific). The sections were blocked for 2 h in 6% normal donkey serum, 1% bovine serum (for EphB1 immunostaining, adding 0.2% Triton X-100), dissolved in PBS at room temperature, and then incubated with the following primary antibodies at 4°C for 48 h: monoclonal mouse anti-EphB1 (1:50 dilution; R&D Systems), polyclonal goat anti-EphB2 (1:50 dilution; R&D Systems) or polyclonal rabbit anti-EphB2 (1:300 dilution; Santa Cruz Biotechnology), polyclonal goat anti-ephrinB1 (1:50 dilution; R&D Systems), polyclonal goat anti-ephrinB2 (1:50 dilution; R&D Systems), polyclonal rabbit anti-glutamine synthetase (GS; 1:2000 dilution; Abcam), polyclonal goat anti-CTB (1:2000 dilution; List Biological Laboratories), monoclonal mouse anti-GFAP (1:400 dilution; Sigma-Aldrich), monoclonal mouse anti-Brn-3a (1:100 dilution; Santa Cruz Biotechnology), and polyclonal rabbit anti-GluA2 (1:200 dilution; Alomone Labs). Binding sites of the primary antibodies were visualized by incubating with Cy3/Alexa Fluor 488-conjugated donkey anti-rabbit, anti-mouse, or anti-goat IgG (1:400 dilution; Sigma-Aldrich) for 2 h at room temperature. The sections were visualized and photographed with a Leica SP2 confocal laser-scanning microscope. To avoid any possible reconstruction stacking artifact, double labeling was precisely evaluated by sequential scanning on single-layer optical sections at intervals of 1.0 μm.
Western blot analysis.
Western blot analysis was conducted as previously described with some modifications (Chen et al., 2011; Ji et al., 2011, 2012; Miao et al., 2012). For whole-cell protein extraction, retinae were homogenized in RIPA lysis buffer supplemented with protease and phosphatase inhibitor cocktail (Roche). For retinal plasma membrane protein extraction, we followed the protocol provided for the Plasma Membrane Protein Extraction Kit (BioVision). The concentration of total proteins was measured using a standard bicinchoninic acid assay kit (Pierce Biotechnology). The extracted whole protein samples (50 μg) or membrane protein samples (10 μg) were resolved by 8% SDS-PAGE gel and electroblotted onto PVDF membranes (Immobilon-P, Millipore) using Mini-PROTEAN 3 Electrophoresis System and Mini Trans-Blot Electrophoretic Transfer System (Bio-Rad). After blocking in 5% nonfat milk (for a nonphosphorylated antibody) or 5% bovine serum albumin (for a phosphorylated antibody) at room temperature for 1.5 h, the membranes were incubated overnight at 4°C with the following primary antibodies: monoclonal mouse anti-β-actin (1:3000 dilution; Sigma-Aldrich), monoclonal mouse anti-EphB1 (1:300 dilution; R&D Systems), polyclonal goat anti-EphB2 (1:500 dilution; R&D Systems), polyclonal goat anti-ephrinB1 (1:500 dilution; R&D Systems), polyclonal goat anti-ephrinB2 (1:500 dilution; R&D Systems), polyclonal rabbit anti-phospho-ephrinB (Tyr 314; 1:1000 dilution; R&D Systems), polyclonal rabbit anti-src (1:1000 dilution; Cell Signaling Technology), polyclonal rabbit anti-phospho-src (Tyr 418; Sigma-Aldrich), polyclonal rabbit anti-GluA2 (1:200 dilution; Alomone Labs), polyclonal rabbit anti-phospho-GluA2 (Tyr 876; 1:200 dilution; Cell Signaling Technology). After washing in Tris-buffered saline–Tween 20, the membranes were incubated with IRDye 700CW donkey anti-mouse IgG and IRDye 800CW Donkey anti-goat or rabbit IgG (1:10,000; LI-COR Biosciences) for 1.5 h at room temperature, and then scanned using an Odyssey near- infrared imaging scanner (Gene Company).
Coimmunoprecipitation.
To test the possible interactions among ephrinB2, src, and GluA2, coimmunoprecipitation (co-IP) experiments were performed using a co-IP kit (catalog #23600, Pierce Biotechnology) following the manufacturer instructions. Briefly, ephrinB2-Fc (R&D Systems), monoclonal mouse anti-phospho-tyrosine (4G10) antibody (Millipore), polyclonal rabbit anti-GluA2 antibody, and the normal mouse or rabbit IgG (negative control) was added to rat retinal sample supernatants [lysis buffer containing the following (in mm): Tris-HCl 50, pH 8.0, 1% (w/v) NP-40, EDTA 20, sodium orthovanadate 1, NaF 1, 10 mg/ml leupeptin, and 10 mg/ml aprotinin], which was incubated overnight at 4°C. Then the binding beads washed in IP buffer (50 mm Tris 7.5, 150 mm NaCl) were added to the antibody–antigen complex and incubated for 4 h at 4°C. After washing with the IP buffer, the immunoprecipitated complexes were recovered in 20 μl 2× sample buffer and boiled for 5 min, followed by an analysis of immunoblotting probed with polyclonal rabbit anti-phospho-src (Tyr 418), polyclonal goat anti-ephrinB2, polyclonal rabbit anti-GluA2, and monoclonal mouse anti-phospho-tyrosine.
Assay of cell apoptosis.
To detect cell apoptosis, terminal deoxynucleotidyl transferase-mediated biotinylated UTP nick end labeling (TUNEL) assay (Gavrieli et al., 1992; Chen et al., 2011) was performed on whole flat-mounted retinae, using the DeadEnd Fluorometric TUNEL System G3250 kit (Promega) and following the manufacturer instructions. TUNEL signals were visualized with a confocal laser scanning microscope through a 20× objective (FluoView 1000, Olympus). The retina was mounted with the ganglion cell layer (GCL) upturned, and serial deep scanning was performed only in the GCL according to the DAPI staining results. All TUNEL-positive signals that merged well with DAPI in each retina were counted.
Preparation of retinal slices.
Eyes were quickly enucleated in deeply anesthetized and decapitated rats, and immersed in ice-cold, oxygenated sucrose cutting solution (0–4°C) containing the following (in mm): 124 sucrose, 3 KCl, 26 NaHCO3, 1.25 NaH2PO4, 3 sodium pyruvate, 10 glucose, 0.2 CaCl2, and 3.8 MgCl2, pH 7.4. Isolated retinae were embedded in low-melting agarose [4% in artificial CSF (ACSF)], and slices (200 μm) were made using a vibrotome (VT1000s, Leica) and transferred to a holding chamber where they were completely submerged in ACSF containing (in mm) 125 NaCl, 3 KCl, 26 NaHCO3, 1.25 NaH2PO4, 2 CaCl2, 1 MgCl2, and 15 glucose, pH 7.4; were bubbled continuously with 95% O2 and 5% CO2; and were maintained at room temperature (21–23°C) for 40 min before recording.
Whole-cell recording.
Whole-cell voltage-clamp recordings were performed using standard techniques, as described previously (Yang et al., 2011). Individual slices were transferred to a chamber, which was continuously superfused with oxygenated ACSF at a rate of 1–2 ml/min at room temperature. RGCs in retinal slices were identified by their location and morphology with the help of an infrared-differential interference contrast video microscopy (Olympus), and were further identified by intracellular injection of Lucifer yellow dye. Patch pipettes were made by pulling BF150-86-10 glass (Sutter Instrument) on a P-97 Flaming/Brown micropipette puller (Sutter Instrument) and fire polished (model MF-830, Narishige) before recording. The pipette resistance was typically 4–8 MΩ after being filled with the following internal solution (in mm): 120 CsMeSO3, 5 NaCl, 0.1 spermine, 3 QX-314, 5 phosphocreatine, 5 HEPES, 2 EGTA, 0.6 GTP-Na, and 2 ATP-Mg, pH 7.2 adjusted with CsOH, 280–290 mOsm/L. For evoked AMPA receptor-mediated current recordings, the test stimuli were delivered at a frequency of 0.05 Hz through a patch pipette filled with ACSF placed on the inner nuclear layer (INL) or the inner plexiform layer (IPL), and the slices were continuously perfused with ACSF containing d-APV (50 μm), bicuculline (10 μm), and strychnine (5 μm) to block NMDA, GABAA, and glycine receptors, respectively. Whole-cell membrane currents were recorded from the RGCs voltage clamped at −60 to +40 mV (adjusted liquid junction potential) using a patch amplifier (Axopatch 700B, Molecular Devices) with Digidata 1440A data acquisition board and pClamp version 10.0 software. Analog signals were sampled at 10 kHz, filtered at 1 kHz, and stored for further analysis.
Data analysis.
Data analysis was performed using Clampfit version 8.0 (Molecular Devices) and Igor version 4.0 (WaveMetrics). For Western blot experiments, the level of a protein was first normalized to its corresponding actin for each sample, and the relative levels were then averaged for all the samples; and the averaged data, obtained at different postoperational times, were normalized to the averaged one obtained under the control condition. Data are presented as the means ± SEM. A one-way ANOVA with Bonferroni's post hoc test (multiple comparisons), Mann–Whitney test (comparisons between two groups), or t test (paired data) was used as appropriate. A p value of <0.05 was considered significant.
Results
Changes in EphB/ephrinB expression in retinae with COH
The rat COH model was successfully reproduced with the IOP changes of operated eyes being similar to those reported previously (Chen et al., 2011; Ji et al., 2012). The average IOP of operated eyes was kept at higher levels (25.3 ± 0.1 to 30.0 ± 0.2 mmHg, n = 15–119), which were significantly higher than that of unoperated eyes (19.6 ± 0.3 mmHg, n = 15–119) and sham-operated eyes (19.4 ± 0.1 mmHg, n = 50; all p < 0.001).
We first examined whether protein levels of EphB1 and B2, and ephrinB1 and B2 may be changed as a function of time in retinae of rats with COH, using Western blot analysis. As shown in the summary data (Fig. 1B,C), the average densities of both EphB1 and ephrinB2 were increased with postoperational time, but in different time courses. That is, the protein level of EphB1, as shown in Figure 1B, was increased to 159.8 ± 6.1% of control even on day 1 (G1d; n = 6, p = 0.029), and further to 202.3 ± 3.8% of control on G3d (n = 6, p < 0.001). The EphB1 level thereafter remained at this higher level until week 4 (G4w) and then declined slightly to 135.5 ± 0.9% of control in G6w (n = 6, p < 0.001). The ephrinB2 level did not change in the initial period of time (before G2w) and started increasing in G2w (143.2 ± 9.4%; n = 6, p = 0.008; Fig. 1C). This higher level of ephrinB2 was maintained until G6w. In contrast, the levels of EphB2 and ephrinB1 showed no significant change during the whole postoperational period (Fig. 1A).
Figure 1.
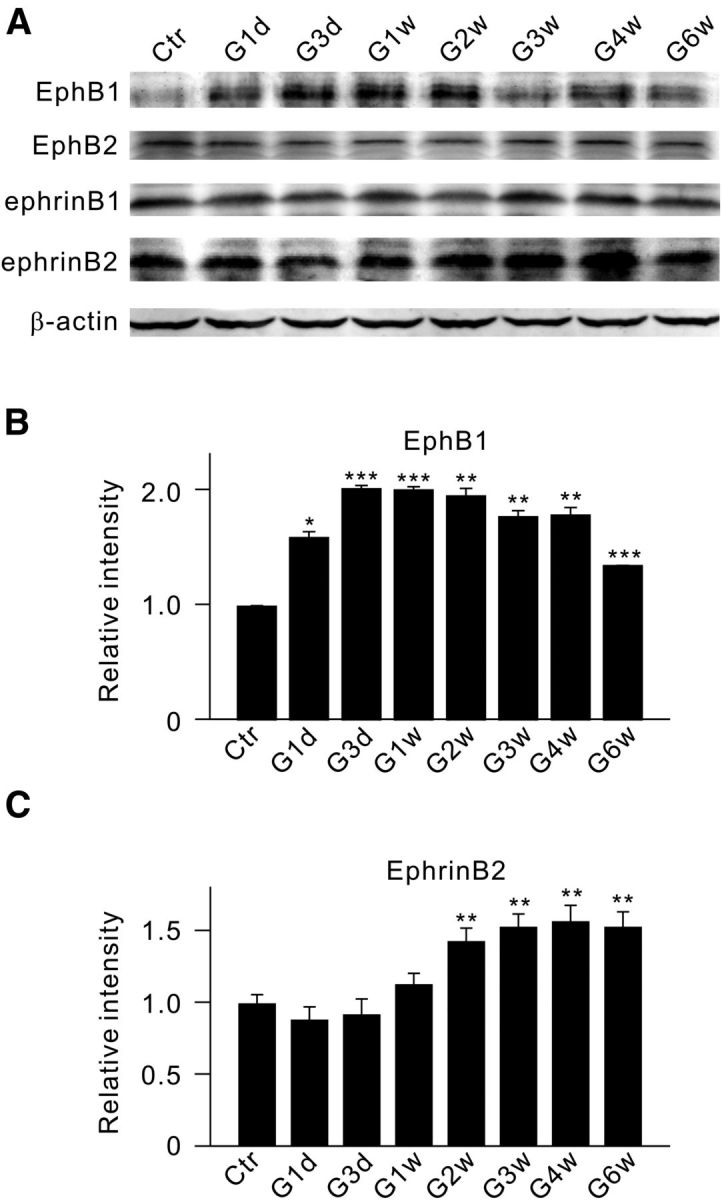
Changes in protein levels of EphB1, EphB2, ephrinB1, and ephrinB2 in retinae of rats with COH. A, Representative immunoblots showing the changes in EphB1, EphB2, ephrinB1, and ephrinB2 expression in sham-operated (Ctr) and COH retinal extracts at different postoperational times (G1d, G3d, G1w, G2w, G3w, G4w, and G6w). B, C, Bar charts summarizing the average densitometric quantification of immunoreactive bands of EphB1 (B) and ephrinB2 (C) expression at different postoperational times. All the data are normalized to control. n = 6 for all groups. *p < 0.05, **p < 0.01, and ***p < 0.001 vs Ctr.
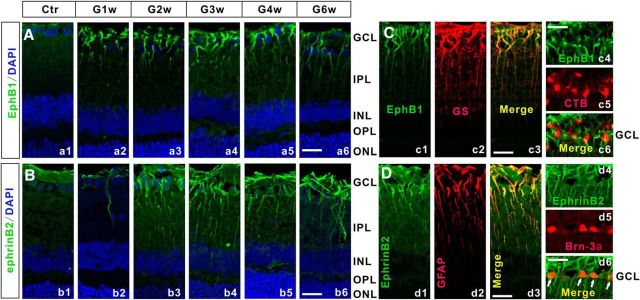
The increased expression of EphB1 and ephrinB2 in COH rats was further demonstrated by immunohistochemistry. Figure 2Aa1 shows that the expression of EphB1 was weak and appeared to be restricted in the end feet of Müller cells in the sham-operated retinal section (Ctr). The EphB1 expression exhibited a remarkable increase in the COH rat retinal section even just on G1d, which is consistent with the result yielded by Western blotting (Fig. 1A). Again, this higher expression level was maintained thereafter throughout the 6 weeks after the operation (G1w to G6w; Fig. 2Aa2–Aa6). The expression of ephrinB2 in the control section (Fig. 2Bb1) was mainly localized to the end feet of Müller cells and cells in the GCL. A significant increase in ephrinB2 expression was detected in the COH retinal section in G2w, and the increased ephrinB2 expression level remained thereafter. This result is reminiscent of that observed in the Western blot experiments (Fig. 1A,C).
Figure 2.
EphB1 and ephrinB2 expression in Müller cells and RGCs of COH rats. A, Immunofluorescence labeling showing EphB1 expression profiles in rat retinal vertical slices taken from sham-operated retinae (Ctr; a1) and those obtained at different postoperational times (G1w, G2w, G3w, G4w, and G6w; a2–a6). B, Immunofluorescence labeling showing ephrinB2 expression profiles in rat retinal vertical slices taken from Ctr (b1) and those obtained at different postoperational times (b2–b6). C, Double-immunofluorescence labeling showing the expression of EphB1 in a COH retinal slice in G2w (c1) and GS (c2) labeling. c3, Merged image of c1 and c2. c4 and c5 show EphB1 and CTB labeling of COH retinal slice in G2w. c6, Merged image of c4 and c5. Note that EphB1 is colocalized with GS, but not with CTB. D, Double-immunofluorescence labeling showing the expression of ephrinB2 in a COH retinal slice in G2w (d1) and a GFAP-labeled slice (d2). d3, Merged image of d1 and d2. d4 and d5 show ephrinB2- and Brn-3a-labeled COH retinal slices in G2w. d6, Merged image of d4 and d5. Note that ephrinB2 is colocalized with both GFAP (d3) and Brn-3a (d6; arrows). Scale bar, 20 μm. OPL, Outer plexiform layer; ONL, outer nuclear layer.
Double labeling was performed to determine the cellular localization of EphB1 and ephrinB2 in COH rats in G2w, given the elevated expression levels of these two proteins at this time point. As shown in Figure 2C, EphB1-labeled cells (Fig. 2Cc1,c4) were well double labeled by anti-GS (Fig. 2Cc2), a Müller cell marker, in the retinal section (also see Fig. 2Cc3). EphB1 labeling (Fig. 2Cc4) was not colocalized to RGCs (Fig. 2Cc5) retrogradely labeled by CTB (also see Fig. 2Cc6). Labeling for ephrinB2 was found in Müller cells (Fig. 2Cd2,d3) stained by GFAP, another Müller cell marker, and in RGCs stained by anti-Brn-3a (Fig. 2Cd5,d6), another RGC marker. In mice, Brn-3a is expressed in RGCs projecting to superior colliculus, but not in RGCs of the accessory optic, pretectal, and hypothalamic pathways (Quina et al., 2005). It is known, however, that a large part of the RGC population (>95%) projects to the superior colliculus contralaterally in rodents (Dräger and Olsen, 1980; Linden and Perry, 1983; Dreher et al., 1985; Hofbauer and Dräger, 1985; Salinas-Navarro et al., 2009a,b). Since almost all of the RGCs labeled retrogradely by Fluoro-Gold are Brn-3a positive (Nadal-Nicolás et al., 2009, 2012), it is reasonable to deduce that the vast majority of RGCs (>95%) are Brn-3a positive. In other words, increased ephrinB2 expression actually occurred in almost all RGCs.
Activation of EphB/ephrinB reverse signaling in retinae with COH
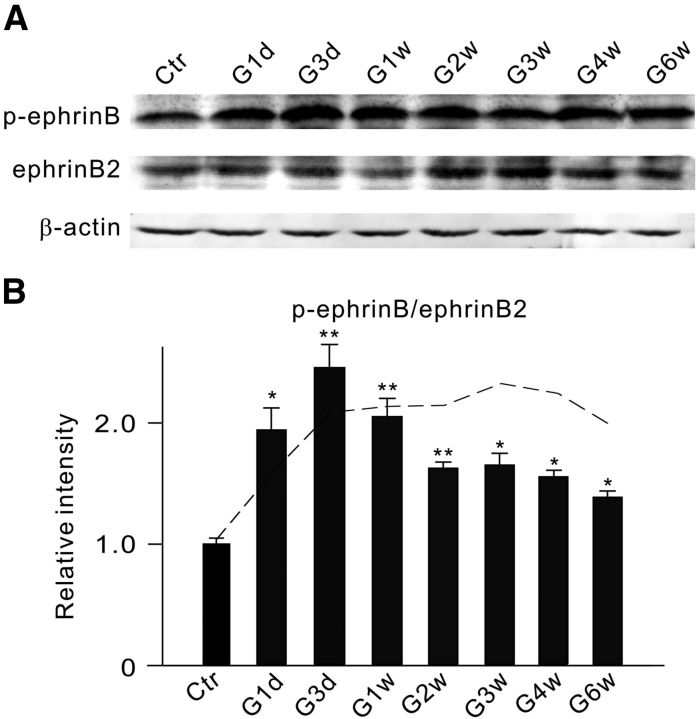
Since EphB1 and ephrinB2 were respectively expressed in Müller cells and RGCs, we then tested whether EphB1/ephrinB2 reverse signaling may be activated in retinae of COH rats so as to affect RGCs. Because phosphorylation of ephrinB increases the enzymatic activity of ephrinB (Palmer et al., 2002; Lim et al., 2008), increased phosphorylated ephrinB (p-ephrinB) is often regarded as a sign of ephrinB activation. As illustrated in the representative Western blot results in Figure 3A, the p-ephrinB level was increased with postoperational time, and the increased extent was clearly larger than that for the ephrinB2 level. Figure 3B shows the changes in the average p-ephrinB/ephrinB2 ratio as a function of postoperational time. The ratio was considerably increased to 194.2 ± 18.2% of control (n = 5, p = 0.046) on G1d, further to 245.5 ± 19.2% (n = 5, p = 0.006) on G3d, but showed a decline thereafter. The reason for the decline of the ratio during the period from G2w to G6w was obviously due to the increased ephrinB2 levels during that period (Fig. 1C). When corrections were made for all the data obtained at different postoperational times, the absolute p-ephrinB amounts, obtained during the period from G3d to G6w, were actually maintained at a higher level (dashed line). These results suggest that EphB/ephrinB reverse signaling was indeed activated in retinae of rats with COH.
Figure 3.
IOP elevation induces an increase in p-ephrinB levels. A, Representative immunoblots showing the changes in p-ephrinB and ephrinB2 levels in sham-operated (Ctr) and COH retinal extracts at different postoperational times (G1d, G3d, G1w, G2w, G3w, G4w, and G6w). B, Bar chart summarizing the average p-ephrinB/ephrinB2 ratios at different postoperational times. All of the data are normalized to Ctr. n = 5 for all groups. *p < 0.05 and **p < 0.01 vs Ctr. The dashed line shows the ratios for different postoperational times, which were modified by a correction factor derived on the basis of the assumption that the ephrinB2 levels at these times were not different from the control level.
Activation of EphB2/ephrinB2 reverse signaling induces RGC apoptosis in normal retinae
Before further exploring how activated EphB/ephrinB reverse signaling could affect the survival of RGCs in retinae with COH, we examined whether activation of this signaling by intravitreal injection of EphB2-Fc induces RGC apoptosis in normal rats. The reason for choosing EphB2-Fc, instead of EphB1-Fc, was twofold. First, EphB2-Fc not only activates ephrinB reverse signaling, but also suppresses EphB2 forward signaling simultaneously (Ethell et al., 2001). Second, EphB1 and EphB2 share the same ligand ephrinBs (Grunwald et al., 2001; Liebl et al., 2003; Lim et al., 2008). In Figure 4A, the binding of EphB2-Fc on RGCs, observed on day 7 after the injection (2 μl, 1 μg/μl), is compared with that obtained in Ctr-Fc-injected retinae, using the anti-human Fc antibody. While no detectable positive signals in the GCL were found in the Ctr-Fc-injected retinal section (Fig. 4Aa1–a3), strong immunofluorescent signals were seen in many cells in the GCL in the EphB2-Fc-injected section (Fig. 4Aa4–a6). Western blot experiments revealed a significant increase in p-ephrinB levels in the EphB2-Fc-injected retinae (Fig. 4B), with the average ratio p-ephrinB/ephrinB2 being 153.3 ± 2.8% of that in the Ctr-Fc-injected retinae (n = 6, p < 0.001; Fig. 4C). This result demonstrates that EphB2/ephrinB2 reverse signaling is indeed activated by injecting EphB2-Fc. Figure 4D shows representative results, illustrating RGC apoptosis states seen in flat-mounted retinae at the same angle (0°; Chen et al., 2011) under different experimental conditions. Sparse TUNEL-positive signals were detected on day 7 after Ctr-Fc injection [Fig. 4Dd1,d2 (corresponding DAPI images of d1 and d3: merged image of d1 and d2)], which was in sharp contrast with numerous TUNEL-positive signals seen in the EphB2-Fc-injected retinae [Fig. 4Dd4,d5 (corresponding DAPI images of d4 and d6: merged image of d4 and d5)]. On average, the total number of TUNEL-positive cells in whole EphB2-Fc-injected retinae was 517.4 ± 21.7 (n = 12), which is much higher than the number in Ctr-Fc-injected retinae (8.8 ± 1.7, n = 6, p < 0.001). For comparison, we also determined the average number of TUNEL-positive cells in retinae with COH in G2w, which (366.0 ± 8.2, n = 6) was comparable to that reported in our previous work (Chen et al., 2011). These results suggest that the activation of EphB2/ephrinB2 reverse signaling indeed induces RGC apoptosis.
Figure 4.
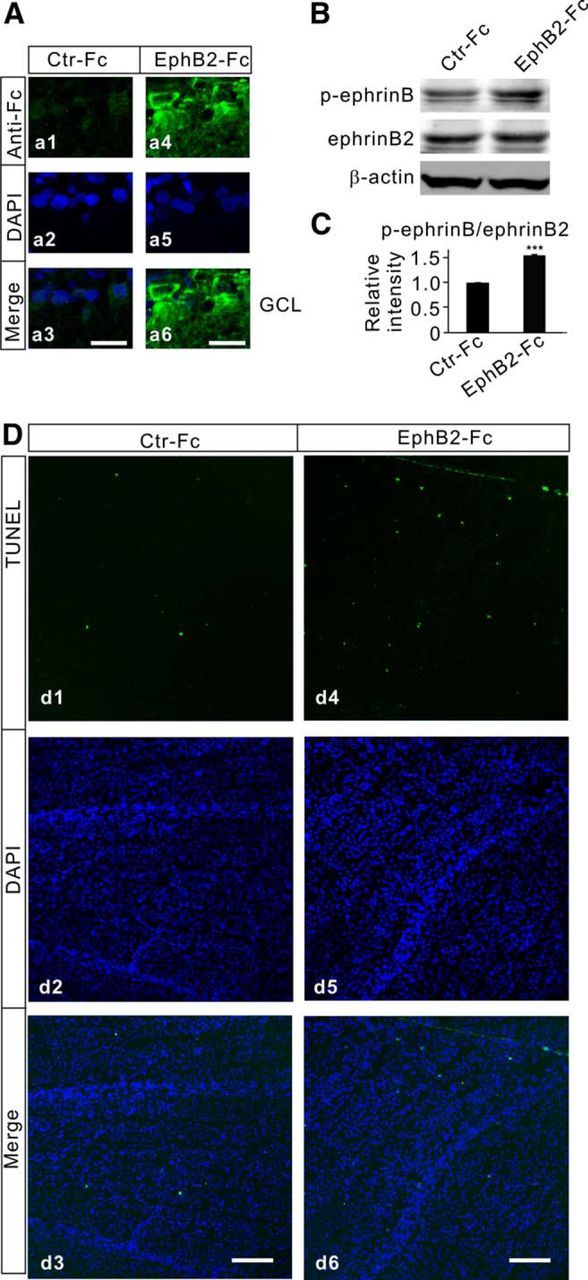
Activation of EphB/ephrinB reverse signaling induces RGC apoptosis. A, Immunofluorescence labeling showing the binding of EphB2-Fc on RGCs in retinal sections obtained from Ctr-Fc-injected (a1) and EphB2-Fc-injected (a4) retinae on day 7 after the injections. a2, a5, DAPI images. a3, a6, Merged images of a1 and a2 (a3) and a4 and a5 (a6). Note that no positive signals in the GCL were detected in the Ctr-Fc-injected retinal section (a3), while strong immunofluorescent signals were seen in cells localized in the GCL in the EphB2-Fc-injected retinal section (a6). B, Representative immunoblots showing the changes in p-ephrinB and ephrinB2 levels in Ctr-Fc- and EphB2-Fc-injected retinae. C, Bar chart summarizing the average ratios (p-ephrinB/ephrinB2) in Ctr-Fc- and EphB2-Fc-injected retinae. n = 6 for each group. ***p < 0.001 vs Ctr-Fc. D, TUNEL staining detection of RGC apoptosis in Ctr-Fc-injected (d1) and EphB2-Fc-injected (d4) retinae on day 7 after the injections in the regions at angle 0° taken from whole flat-mounted retinal preparations. d2, d5, Counterstained images with DAPI (blue). d3, d6, Merged images of corresponding TUNEL and DAPI images. Note that only sparse TUNEL-positive signals were detected in the Ctr-Fc-injected retinae, but the signals became numerous in the EphB2-Fc-injected retinae. Scale bar, 50 μm.
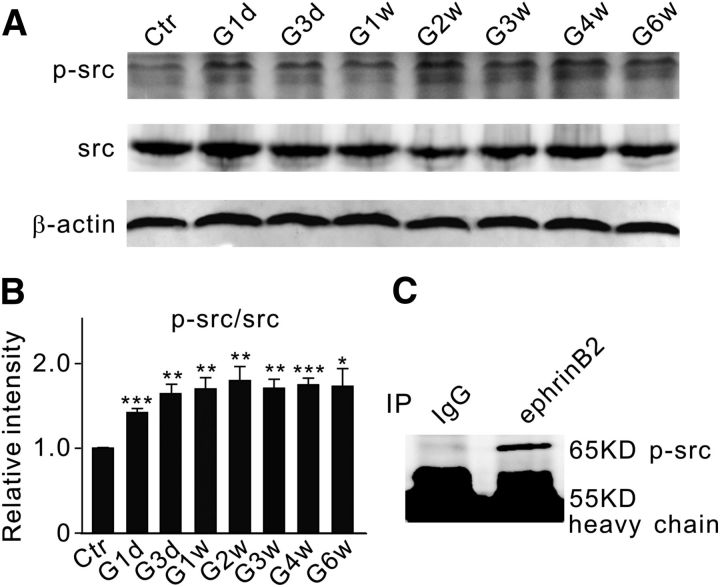
There is evidence that EphB2-Fc may promote phosphotyrosine-mediated reverse signaling by causing the activation of src family kinases (SFKs; Palmer et al., 2002). The involvement of several SFK members in cell apoptosis has been demonstrated (Simon et al., 1998; Szabò et al., 1998; Reinehr et al., 2004, 2005). Since phosphorylation of src (p-src) at the site of tyrosine 418 increases the enzymatic activity of src (Osusky et al., 1995; Stover et al., 1996), we studied changes in the p-src/src ratio as a function of postoperational time in retinae with COH. As shown in Figure 5, A and B, the ratio immediately jumped to 142.1 ± 4.9% of control (n = 6, p < 0.001) on G1d and then it steadily increased to ∼170% of control in the first 2 weeks. The data obtained during the next 4 weeks fluctuated around this higher level. Co-IP experiments further showed no binding between the antibody against p-src and the immunoprecipitate derived using the antibody against IgG, but revealed a band at the location corresponding to p-src (65 kDa) in the immunoprecipitate derived using the antibody against ephrinB2 (Fig. 5C). It is likely that p-src may directly cause the phosphorylation of ephrinB2.
Figure 5.
Changes in protein levels of p-src and src in COH rat retinae. A, Representative immunoblots showing the changes in p-src and src protein expression in sham-operated (Ctr) and COH retinal extracts at different postoperational times (G1d, G3d, G1w, G2w, G3w, G4w, and G6w). B, Bar chart summarizing the average ratios (p-src/src) at different postoperational times. All of the data are normalized to Ctr. n = 6 for all groups. *p < 0.05, **p < 0.01, and ***p < 0.001 vs Ctr. C, Co-IP analysis of ephrinB2 and p-src using normal retinae. A band of p-src at the location corresponding to 65 kDa was detected in the immunoprecipitates derived using the antibody against ephrinB2.
The effects of inhibiting the activity of tyrosine kinases by PP2, a selective inhibitor of src family tyrosine kinases, on RGC apoptosis induced by EphB2-Fc injection/IOP elevation were also studied. PP2 (100 μm, 2 μl) was injected intravitreally 3 d before the operation or EphB2-Fc injection (2 μl, 1 μg/μl), which remarkably reduced the average number of TUNEL-positive cells to 82.5 ± 6.3 (n = 5, p < 0.001) from 517.4 ± 21.7 (n = 12; for EphB2-Fc-injected rats), and to 50.0 ± 4.4 (n = 5, p < 0.001) from 366.0 ± 8.2 (n = 5) in rats with COH, respectively.
Activation of EphB2/ephrinB2 reverse signaling modulates trafficking of AMPA receptors
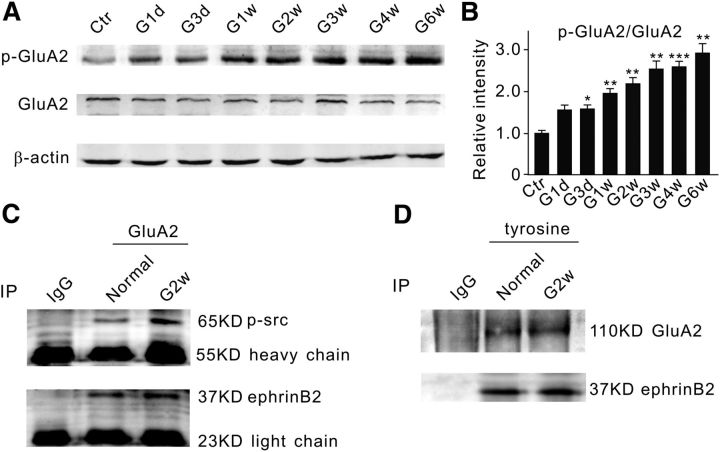
It is known that ephrin/Eph signaling may interact with glutamate receptors, thus contributing to the pathophysiology of neuronal degeneration (Dalva et al., 2000; Takasu et al., 2002; Grunwald et al., 2004; Calò et al., 2005a, b; Pasquale, 2008). We therefore tried to explore whether AMPA receptors may be involved in EphB/ephrinB reverse signaling-induced RGC apoptosis. Actually, Ca2+-permeable, GluA2-lacking AMPA receptors have been implicated in ischemia-induced neuronal excitotoxic injury (Liu et al., 2006; Liu and Zukin, 2007). There is increasing evidence indicating that neuronal insults may induce a long-lasting switch from GluA2-containing AMPA receptors to GluA2-lacking receptors (Pellegrini-Giampietro et al., 1992; Gorter et al., 1997; Opitz et al., 2000; Calderone et al., 2003; Liu et al., 2004; Noh et al., 2005). This could be caused by GluA2-containing AMPA receptor endocytosis, which is induced by tyrosine phosphorylation of the GluA2 subunit (Ahmadian et al., 2004; Fox et al., 2007). We therefore speculated whether the increased activity of tyrosine kinases in rats with COH or EphB2-Fc-injected rats may promote the phosphorylation of GluA2-containing AMPA receptors, thereby increasing Ca2+ influx through GluA2-lacking AMPA receptors that are redistributed on the cell membrane. Figure 6, A and B, shows that the protein level of phosphorylated GluA2 at the site of tyrosine 876 (p-GluA2), represented as the p-GluA2/GluA2 ratio, steadily increased from 153.3 ± 11.5% of control on G1d (n = 6, p = 0.05) to 288.9 ± 22.6% on G6w (n = 6, p = 0.003) in rats with COH. Direct interactions among p-src, ephrinB, and GluA2 were further examined by co-IP assay. As shown in Figure 6C, p-src was detected in the immunoprecipitates of the anti-GluA2 antibody in retinal extracts from both normal and COH rats in G2w. Similar results were obtained when the antibody against ephrinB2 was used instead. In addition, GluA2 and ephrinB2 were also detected in the immunoprecipitates in retinal extracts from both normal rats and those with COH, which were derived using the phosphorylated antibody against tyrosine (Fig. 6D). The reason for using anti-phosphotyrosine antibody, instead of p-ephrinB antibody, was that the p-ephrinB antibody did not work for co-IP experiments. The phosphotyrosine antibody could pull down both GluA2 and ephrinB2 from retinal extracts of either normal rats or those with COH, suggesting that GluA2 and ephrinB2 could be phosphorylated by the phosphotyrosine antibody. This result, together with the result that the anti-GluA2 antibody could pull down ephrinB2 in normal and COH retinal extracts (Fig. 6C), suggests that GluA2 could be directly phosphorylated by p-ephrinB2 and p-src. Similarly, the p-src/src and p-GluA2/GluA2 ratios were also increased in normal retinae when intravitreal injection of EphB2-Fc (2 μl, 1 μg/μl) was made. The ratios obtained from 2 weeks after the injection were respectively 165.9 ± 8.7% of control (n = 6, p = 0.02, for p-src/src ratio) and 158.5 ± 5.7% of control (n = 6, p = 0.02, for p-GluA2/GluA2 ratio).
Figure 6.
Increase in p-GluA2 protein levels in COH rat retinae. A, Representative immunoblots showing the changes in p-GluA2 and GluA2 protein expression in sham-operated (Ctr) and COH retinal extracts at different postoperational times (G1d, G3d, G1w, G2w, G3w, G4w, and G6w). B, Bar chart shows that the average p-GluA2/GluA2 ratio steadily increased with postoperational time. All of the data are normalized to Ctr. n = 6 for all groups. *p < 0.05, **p < 0.01, and ***p < 0.001 vs Ctr. C, Co-IP experiments showing the interactions between GluA2 and p-src, GluA2 and ephrinB2 in normal retinae and retinae with COH. Bands of p-src at the location corresponding to 65 kDa (top) and bands of ephrinB2 at 37 kDa (bottom) were detected in the immunoprecipitates derived using the antibody against GluA2 both in normal and COH retinal extracts (G2w). D, Co-IP experiments showing the interactions of phosphorylated tyrosine with GluA2, and with ephrinB2 in normal retinae and retinae with COH. A band of GluA2 at 110 kDa (top) and of ephrinB2 at 37 kDa (bottom) were detected in the immunoprecipitates derived using a phosphorylated antibody directly against tyrosine in both normal and COH retinal extracts.
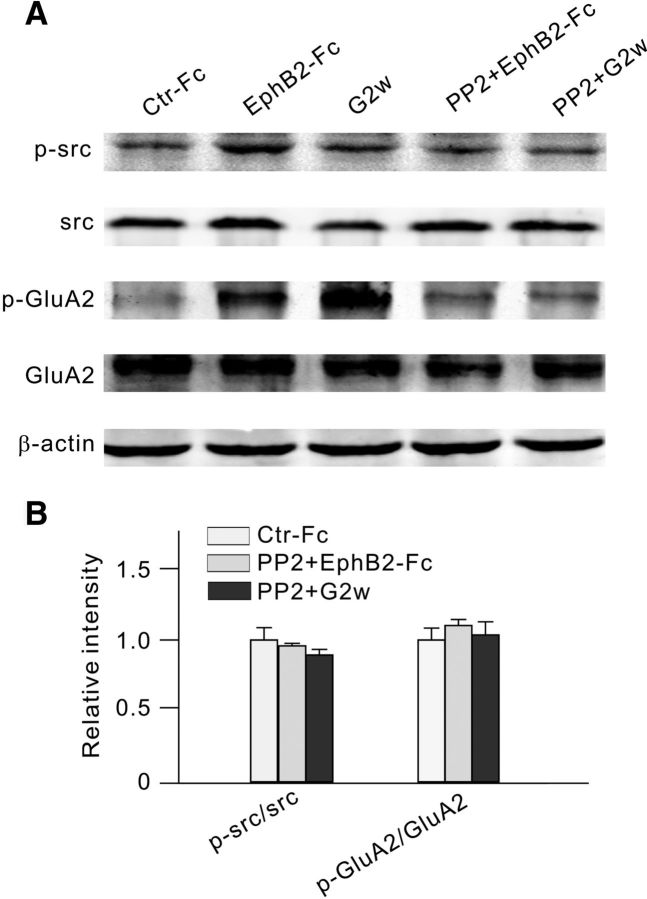
Whether the changes in GluA2 levels might be a consequence of activated EphB/ephrinB signaling was tested by blocking the phosphorylation of ephrinB. There is no specific blocker for ephrinB phosphorylation now available. While ephrinB-Fc is commonly used to block the phosphorylation of ephrinB, we did not use it because ephrinB-Fc may also activate ephrinB/EphB forward signaling in RGCs by binding to EphB2 that is abundantly expressed in these cells. Therefore, we used PP2 as an EphB/ephrinB reverse signaling blocker. Preinjection of PP2 (2 μl, 100 μm), 3 d before the injection of EphB2-Fc, prevented the elevation of the ratios (96.0 ± 1.7% of control for p-src/src ratio, n = 6; 110.1 ± 4.2% of control for p-GluA2/GluA2 ratio, n = 6). Similarly, no increase in p-src/src and p-GluA2/GluA2 ratios was found in G2w in rats with COH when PP2 was preinjected (89.5 ± 3.9% of control for p-src/src ratio, n = 6; 103.6 ± 9.2% of control for p-GluA2/GluA2 ratio, n = 6; p > 0.05; Fig. 7A,B). All of these results suggest that the activation of EphB/ephrinB reverse signaling resulted in changes in GluA2 levels. Since there are direct interactions among ephrinB2, p-src, and GluA2 (Figs. 5C, 6C), it seems likely that PP2 may directly inhibit src activity, which in turn attenuates ephrinB phosphorylation and tyrosine phosphorylation-dependent signaling, thus reducing the phosphorylation of GluA2. In addition, p-src may also directly phosphorylate GluA2.
Figure 7.
Intravitreal injection of PP2 reduces p-src and p-GluA2 levels in EphB2-Fc-injected retinae and retinae with COH. A, Representative immunoblots showing the changes in protein levels of p-src, src, and p-GluA2; and in levels of GluA2 in Ctr-Fc-injected retinae, EphB2-Fc-injected retinae, and retinae with COH (G2w), with or without the addition of PP2. B, Bar chart summarizing the average ratios of p-src/src and p-GluA2/GluA2 under different conditions. All of the data are normalized to control (Ctr-Fc). n = 6 for all the groups.
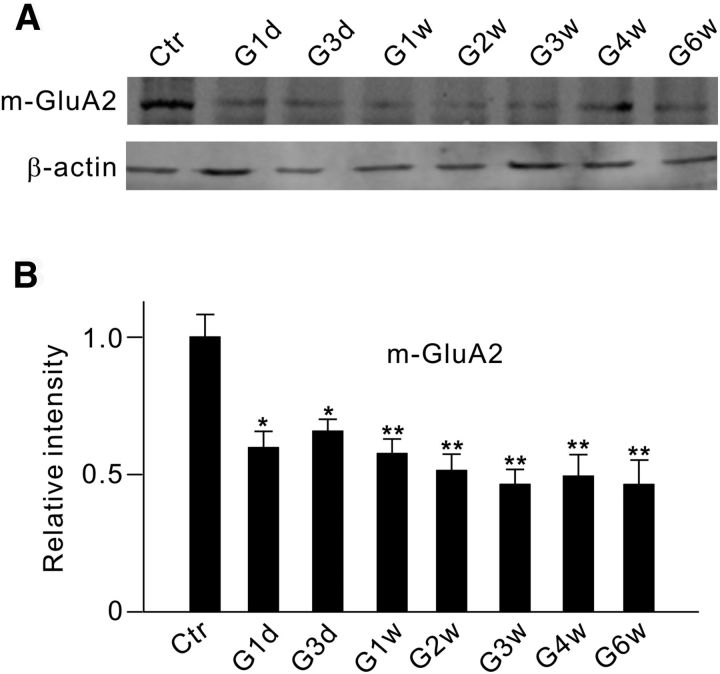
We then examined whether IOP elevation may induce changes in GluA2 protein levels in the membrane component (m-GluA2) of rats with COH. As shown in Figure 8A, m-GluA2 protein levels, assayed by Western blotting, were indeed reduced in retinal extracts from COH rats. On average, the m-GluA2 protein level was significantly reduced even on G1d (59.7 ± 10.4% of control; n = 6, p = 0.013), followed by a further decrease in consecutive days with a trough in G3w (65.8 ± 5.8% of control on G3d, n = 6, p = 0.016; 57.6 ± 7.2% of control in G1w, n = 6, p = 0.008; 51.4 ± 8.1% of control in G2w, n = 6, p = 0.005; 46.3 ± 7.4% of control in G3w, n = 6, p = 0.003). The expression then maintained at this lower level until G6w (49.4 ± 10.5% of control on G4w, n = 6, p = 0.008; 46.3 ± 11.4% of control on G6w, n = 6, p = 0.007; Fig. 8B). Such changes were comparable to the changes of p-ephrinB2, p-src, and p-GluA2 in time courses.
Figure 8.
Changes in membrane GluA2 protein expression in retinae with COH. A, Representative immunoblots showing the changes in GluA2 protein levels in the cell membrane component (m-GluA2) in sham-operated (Ctr) and COH retinal extracts at different postoperational times (G1d, G3d, G1w, G2w, G3w, G4w, and G6w). B, Bar chart summarizing the average densitometric quantification of immunoreactive bands of m-GluA2 at different times. All of the data are normalized to Ctr. n = 6. *p < 0.05 and **p < 0.01 vs Ctr.
An immunohistochemical assay was also used to assess changes in GluA2 protein expression in RGCs in both retinae with COH and EphB2-Fc-injected retinae, using the antibody against the extracellular domain of GluA2. In these experiments, the retinal sections were incubated in a blocking solution without Triton X-100. Therefore, the antibody can only bind to GluA2 proteins in cell membranes. As shown in Figure 9Aa1, GluA2 proteins were abundantly expressed in the IPL and the GCL in the Ctr-Fc-injected retinae. The GluA2-positive cells in the GCL were clearly colabeled by Brn-3a (Fig. 9Aa2,a3). GluA2 expression showed a remarkable reduction in retinal sections obtained respectively from an EphB2-Fc-injected rat 2 weeks after the injection (Fig. 9Bb1–b3) and a COH rat in G2w (Fig. 9Cc1–c3). With intravitreal injection of PP2 (2 μl, 100 μm), made 3 d before EphB2-Fc injection (2 μl, 1 μg/μl) or the operation, there was no significant difference in GluA2 expression among Ctr-Fc-injected retinae (Fig. 9A), EphB2-Fc-injected retinae (Fig. 9D), and retinae with COH (Fig. 9E). Consistent with this result, total m-GluA2 proteins extracted from EphB2-Fc-injected retinae and retinae with COH (in G2w), as evaluated by Western blotting, were also reduced to 68.8 ± 6.2% (n = 5, p = 0.005) and 76.7 ± 5.0% of control (n = 5, p = 0.010), respectively (Fig. 9F,G). Again, the changes in m-GluA2 levels were prevented by preinjection of PP2 (2 μl, 1 μg/μl) in both EphB2-Fc-injected retinae (101.4 ± 10.3% of control, n = 4, p = 0.993) and retinae with COH (106.9 ± 7.4% of control, n = 5, p = 0.589; Fig. 9F,G).
Figure 9.
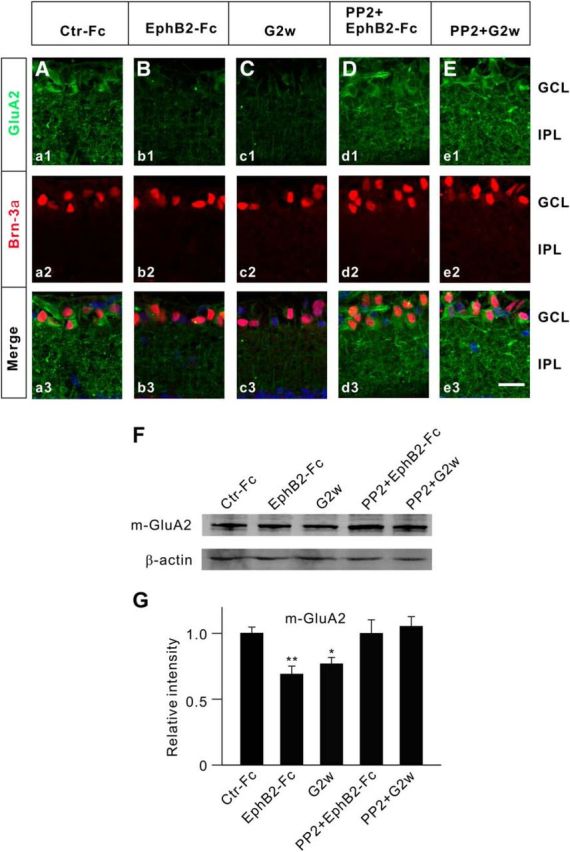
Changes in membrane GluA2 protein expression in EphB2-Fc-injected retinae and retinae with COH. A–C, Immunofluorescence labeling showing GluA2 expression profiles (green) in rat retinal vertical slices taken from Ctr-Fc-injected (a1) and EphB2-Fc-injected (b1) retinae 2 weeks after the injection, and from retinae with COH in G2w (c1). a2, b2, and c2, Brn-3a-labeled images (red). a3, b3, and c3, Merged images. D, E, GluA2 expression profiles (green) in rat retinal slices taken from EphB2-Fc-injected retinae, obtained 2 weeks after the injection (Dd1), and from retinae with COH, obtained in G2w (Ee1), when these preparations were intravitreally preinjected with PP2 (100 μm, 2 μl) 3 d before the operation or EphB2-Fc injection. d2, e2, Brn-3a-labeled images (red). d3, e3, Corresponding merged images. Scale bar, 20 μm. F, Representative immunoblots showing the changes in protein levels of m-GluA2 in retinae obtained under different conditions. G, Bar chart showing the average densitometric quantification of immunoreactive bands of m-GluA2 under different conditions. Note that EphB2-Fc injection/IOP elevation induced a significant decrease in m-GluA2 protein levels; preinjection of PP2 reversed the changes. All of the data are normalized to Ctr-Fc. n = 6 for all groups. *p < 0.05 and **p < 0.01 vs Ctr-Fc.
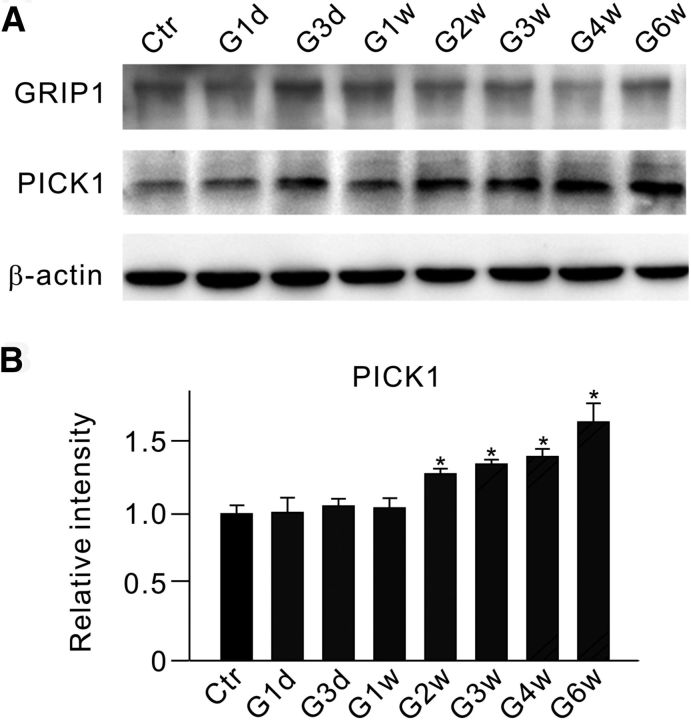
Glutamate receptor-interacting protein 1 (GRIP1) and protein interacting with C kinase 1 (PICK1) may interact with GluA2 and other AMPA receptor subunits, thus influencing AMPA receptor expression on the cell surface (Perez et al., 2001; Lu and Ziff, 2005; Guo and Wang, 2007; Dixon et al., 2009). Since EphB/ephrinB proteins could also interact with the PDZ domains of GRIP1 and PICK1 (Dong et al., 1997, 1999; Torres et al., 1998; Brückner et al., 1999), we tested a possibility that the activation of EphB/ephrinB reverse signaling-induced GluA2 endocytosis in retinae with COH may be mediated by GRIP1 and/or PICK1. Western blot experiments (Fig. 10A) showed that PICK1, but not GRIP1, protein levels steadily increased during the period from G2w to G6w (Fig. 10B).
Figure 10.
Changes in protein levels of GRIP and PICK1 in retinae with COH. A, Representative immunoblots showing the changes in GRIP and PICK1 protein levels in sham-operated (Ctr) and COH retinal extracts at different postoperational times (G1d, G3d, G1w, G2w, G3w, G4w, and G6w). B, Bar chart summarizing the average densitometric quantification of immunoreactive bands of PICK1 at different times. All of the data are normalized to Ctr. n = 4. *p < 0.05 vs Ctr.
Decreased m-GluA2 expression implies a reduction in the number of functional GluA2-containing AMPA receptors in RGCs. This was supported by results obtained using whole-cell patch clamping. A series of evoked EPSCs (eEPSCs), mediated by AMPA receptors, were recorded at different holding potentials (−60 to +40 mV) from RGCs in retinal slices obtained from Ctr-Fc-injected and EphB2-Fc-injected rats 5–7 d after the injections. As shown in Figure 11A, the peak outward current of the cell recorded at +40 mV in EphB2-Fc-injected retinae was significantly smaller in amplitude than that in Ctr-Fc-injected retinae, but the inward currents of the two cells were comparable. Thus, the reduced ratio I (+40/−60 mV) was found in EphB2-Fc-injected retinae (vs that in Ctr-Fc-injected retinae; Fig. 11C). As a negative control, we recorded eEPSCs using an internal solution without spermine (Fig. 11B). Ratio I (+40/−60 mV) was 0.46 ± 0.04 (n = 5) in EphB2-Fc-injected retinae, which was not significantly different from that in Ctr-Fc-injected retinae (0.49 ± 0.05, n = 6, p = 0.738; Fig. 11C).
Figure 11.
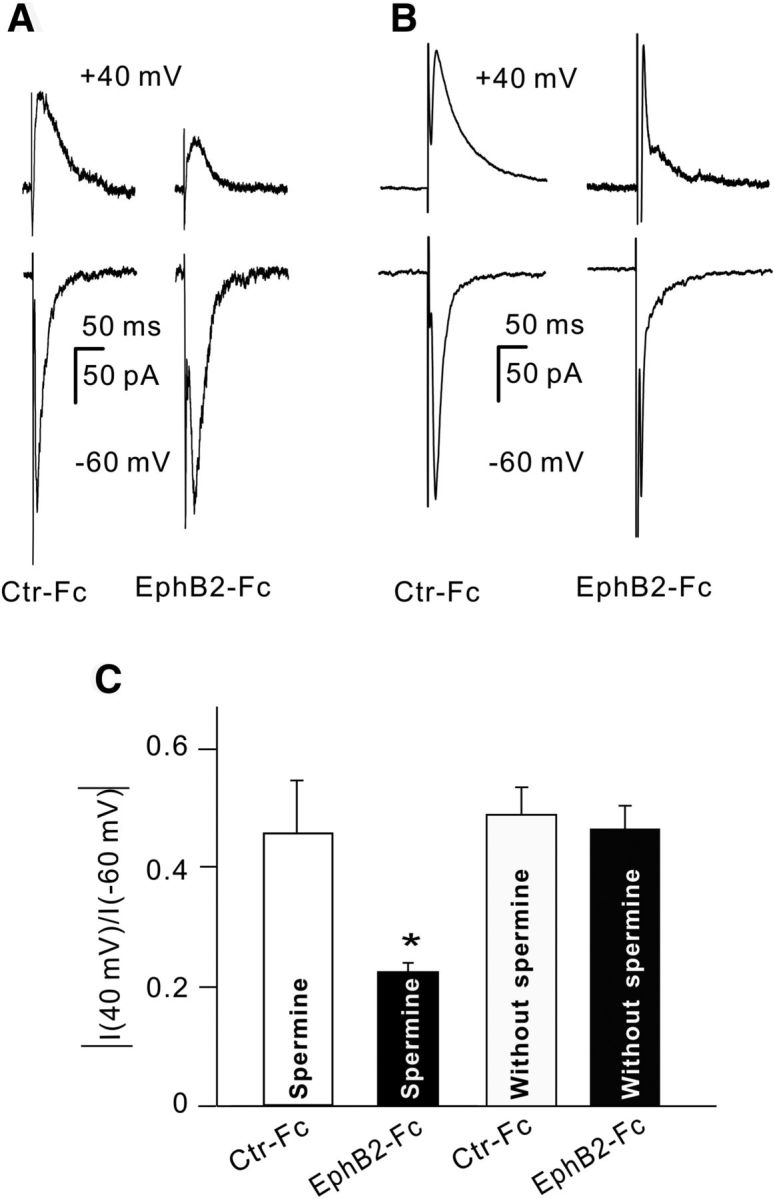
Activation of EphB2/ephrinB2 reverse signaling induces GluA2-containing AMPA receptor trafficking. A, B, Representative traces showing the changes in amplitude of evoked EPSCs, mediated by AMPA receptors, recorded from four different RGCs in retinal slices at holding potentials of +40 and −60 mV with (A) or without (B) spermine in the pipette solution. The eyes were intravitreally injected respectively with control-Fc (Ctr-Fc) and EphB2-Fc (2 μl, 1 μg/μl), and the recordings were made 5–7 d after the injections. The current amplitudes were all normalized to that of Ctr-Fc at −60 mV. C, Bar chart showing the average ratios of current amplitudes at +40/−60 mV in RGCs obtained from Ctr-Fc- and EphB2-Fc-injected retinae with or without spermine in the pipette solution. *p < 0.05 vs Ctr-Fc.
Finally, we studied the effects of blocking Ca2+-permeable AMPA receptors on RGC apoptosis induced by EphB2-Fc injection. RGC apoptosis was detected by a using TUNEL staining technique in whole flat-mounted retinae obtained from rats 7 d after EphB2-Fc injection. Naspm (2 μl,10 μm), a selective antagonist of Ca2+-permeable AMPA receptors, was injected intravitreally 3 d before the EphB2-Fc injection (2 μl, 1 μg/μl). Preinjection of Naspm remarkably reduced the TUNEL-positive signals (Fig. 12A–C), with the average number of TUNEL-positive cells being reduced to 235.7 ± 43.8 (n = 7, p < 0.001) from a value of 517.4 ± 21.7 (n = 12) in EphB2-Fc-injected rats (Fig. 12D).
Figure 12.
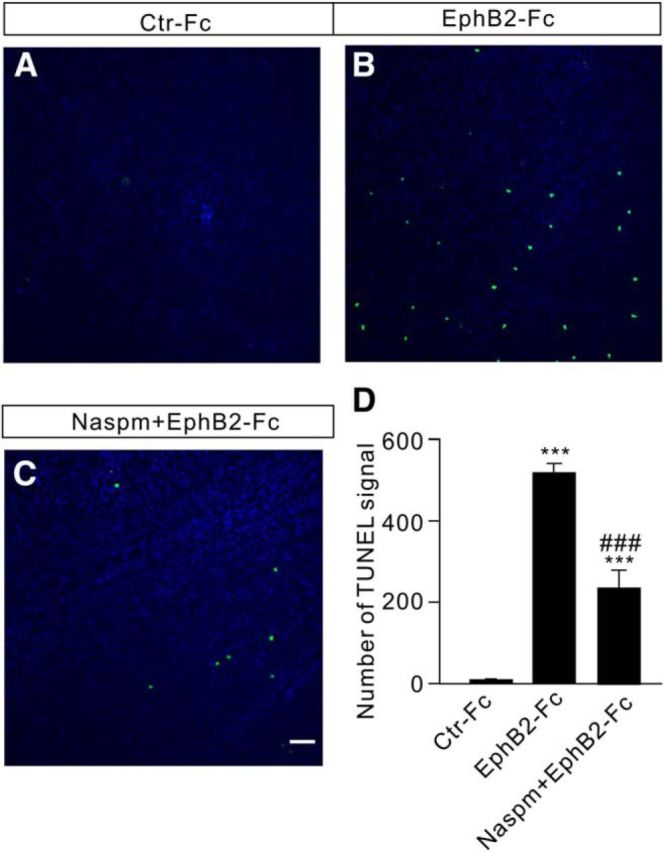
Intravitreal injection of Naspm reduces RGC apoptosis in EphB2-Fc-injected retinae. A–C, TUNEL staining detection of RGC apoptosis in Ctr-Fc-injected (A), EphB2-Fc-injected (B), and EphB2-Fc plus Nasmp-injected (C) whole flat-mounted retinae on day 7 after the injections in the regions at angle 0°. Scale bar, 50 μm. D, Bar chart showing the average number of TUNEL-positive cells in whole flat-mounted retinae under different conditions. Naspm (10 μm, 2 μl) was preinjected 3 d before control-Fc and EphB2-Fc injections (2 μl, 1 μg/μl). ***p < 0.001 vs Ctr-Fc; ###p < 0.001 vs EphB2-Fc.
Discussion
Activation of EphB1/ephrinB2 reverse signaling contributes to RGC apoptosis in retinae of rats with COH
There is much evidence that demonstrates the expression of various members of the ephrin/Eph system, such as ephrinB1/B2 and EphB1/B2, in glial and neuronal elements in the retina. In the present work, we showed, using an immunohistochemical assay, that EphB1 is localized to Müller cells, and ephrinB2 is abundantly expressed in RGCs (in addition to Müller cells) in rat retinae, thus revealing the existence of a EphB1/ephrinB2 reverse signaling in RGCs. The expression of both EphB1 in Müller cells and ephrinB2 in RGCs was upregulated, though with somewhat different time courses, in our COH rat model. While the EphB1 level in Müller cells was elevated on G1d, the elevation of the ephrinB2 level in RGCs (and Müller cells) occurred with much delay, and the level was almost unchanged until G2w. Upregulated expression of ephrinB/EphB signaling at the ONH was also found in laser-induced experimental glaucomatous mice, which were localized to glial cells, including astrocytes, microglia, and NG2+ cells, but not RGC axons (Du et al., 2007, Fu et al., 2010). In monkey, there is an increase in ephrinB1 and EphB1 expression in mild-to-moderate glaucoma (Schmidt et al., 2007). Moreover, in cultured ONH astrocytes obtained from human glaucomatous patients, ephrinB1 and EphB1 are upregulated (Schmidt et al., 2007). Therefore, the upregulation of ephrinB/EphB signaling in the retina may be common in experimental and clinical glaucoma. It is of interest that in glaucomatous DBA/2J mice the expression of EphB2 and ephrinB2 is upregulated at the ONH beginning at 9–10 months of age. Considering the fact that progressive IOP elevation starts from 6 months of age in these mice, the upregulation of ephrinB/EphB signaling seems to be closely related to the IOP elevation.
A major finding in the present work is that the reverse EphB1/ephrinB2 signaling is activated in COH rat retinae, as evidenced by a significant steady increase in p-ephrinB/ephrinB2 during the whole period of elevated IOP. There was a possibility that EphB/ephrinB activation in RGCs, which is known to be related to neuronal survival (Calò et al., 2006; Du et al., 2007; Pasquale, 2008; Klein, 2009; Hruska and Dalva, 2012), may be one of the factors causing RGC apoptosis in retinae with COH. This possibility was strengthened by the result that considerable RGC apoptosis was induced by intravitreal injection of EphB2-Fc, which greatly increased the p-ephrinB/ephrinB2 ratio. In DBA/2J glaucomatous mice, the upregulation of EphB2/ephrinB2 expression at the ONH was restricted to the areas of RGC axon damage, which was coincident with the onset of RGC axon loss, and EphB2-Fc protein induced an elevation of intracellular Ca2+ transient in single RGC axons (Du et al., 2007). Furthermore, a transient increase of p-ephrinB reverse signaling was observed in RGC axons, microglia, and astrocytes at the ONH, coinciding with the initial morphological signs of RGC axon damage (Fu et al., 2010). It is therefore reasonable to deduce that EphB2/ephrinB2 reverse signaling activation could contribute to RGC apoptosis and axon loss in glaucoma, and that attenuation of the strength of EphB/ephrinB reverse signaling in an appropriate manner may be an effective way for preventing the loss of RGCs in glaucoma. However, it should be indicated that there are other studies (Schmidt et al., 2007) claiming that EphB/ephrinB may contribute to RGC axon survival at the ONH, and that the upregulated Eph/ephrin pathway may play a protective role by limiting axonal damage and inflammatory cell invasion due to the activation of Eph/ephrin signaling in astrocytes. This apparent inconsistency may be, at least in part, due to the dependence of actions of EphB/ephrinB signaling on the stage of glaucoma. Indeed, stronger expression of ephrinB1/EphB1 was found at the ONH in monkey eyes with mild-to-moderate glaucomatous damage, but these proteins were barely detectable in eyes with advanced glaucoma (Schmidt et al., 2007).
Since the antibody against p-ephrinB2 is not available, we examined the change in p-ephrinB levels, instead of p-ephrinB2 levels, to evaluate the activation of ephrinB2/EphB2 reverse signaling. Changes in p-ephrinB may largely reflect the activation of ephrinB2/EphB2 reverse signaling for three reasons. First, the expression of ephrinB2, but not ephrinB1, was significantly increased in retinae with COH, and the expression of ephrinB1 was barely detectable in the GCL in retinal sections from either sham-operated rats or rats with COH. Second, intravitreal injection of EphB2-Fc induced a significant increase in p-ephrinB levels, and strong immunofluorescent signals were seen in lots of cells in the GCL. Third, ephrinB2 was detected in immunoprecipitates in retinal extracts from both normal rats and rats with COH, using the phosphorylated antibody against tyrosine (Fig. 6D). Certainly, we cannot exclude the possibility that the change in p-ephrinB could partially occur in p-ephrinB1.
RGC apoptosis induced by EphB/ephrinB reverse signaling activation may be mediated by GluA2-containing AMPA receptor trafficking
Activated EphB2/ephrinB2 reverse signaling may result in a reduction in number of functional GluA2-containing AMPA receptors expressed on RGC membranes in retinae with COH. The evidence for supporting this deduction is threefold. First, co-IP experiments revealed that there was a direct interaction among p-ephrinB2, p-src, and GluA2 (Figs. 5, 6), which caused an elevation of GluA2 tyrosine phosphorylation. Second, both immunohistochemical assay and Western blotting demonstrated that either IOP elevation (in retinae with COH) or injection of EphB2-Fc (in normal retinae) attenuated GluA2 expression on cell membranes in the GCL (Figs. 8, 9). Such changes in GluA2 expression were a consequence of the activation of EphB2/ephrinB2 reverse signaling because they could be prevented by preinjection of PP2. It has been reported that mutations in GluA2 tyrosine phosphorylation sites result in impaired processes of GluA2 endocytosis (Ahmadian et al., 2004; Irie et al., 2005). Third, electrophysiological recordings of eEPSCs of RGCs in normal retinae confirmed that the number of functional GluA2-containing AMPA receptors in these cells was reduced by EphB2-Fc injection. Even though the involvement of ephrin/Eph signaling in neuronal injury in other central regions by directly interacting with glutamate receptors (NMDA receptors and mGluR1; Calò et al., 2005a, 2006; Pasquale, 2008), this is the first work, to our knowledge, that links EphB/ephrinB reverse signaling with AMPA receptors in glaucoma. The subunit composition and Ca2+ permeability of AMPA receptors are dynamically remodeled in response to neuronal insults (Pellegrini-Giampietro et al., 1992; Gorter et al., 1997; Takuma et al., 1999; Opitz et al., 2000; Calderone et al., 2003; Liu et al., 2004; Kwak and Kawahara, 2005; Noh et al., 2005; Liu et al., 2006; Liu and Zukin, 2007). It was reported, for instance, that ischemic insults could result in a switch from GluA2-containing to GluA2-lacking AMPA receptors that are Ca2+ permeable. It is therefore possible that more GluA2-lacking AMPA receptors are distributed on RGC cell membranes, thus contributing to RGC apoptosis in experimental glaucoma due to the high Ca2+ permeability of their receptors (Liu and Zukin, 2007). This possibility is supported by the result that Naspm significantly reduced the number of TUNEL-positive cells in EphB2-Fc-injected retinae.
It is noteworthy that the injection of Naspm only partially (54%) reduced TUNEL-positive signals induced by EphB2-Fc injection, suggesting that, in addition to reducing Ca2+-impermeable, GluA2-containing AMPA receptors, the activation of EphB2/ephrinB2 reverse signaling may also contribute to RGC apoptosis through other pathways in experimental glaucoma. For instance, activated EphB2/ephrinB2 reverse signaling may cause RGC apoptosis by modulating NMDA receptors and mGluRs, as demonstrated in cultured cortical neurons (Grunwald et al., 2004; Calò et al., 2005a,b, 2006). It has been reported that ephrinB2 binding to EphB induces a direct interaction between the extracellular domain of both the EphB and NR1 subunit of NMDA receptors (Dalva et al., 2000), promoting clustering of NMDA receptors at synapses (Yamaguchi and Pasquale, 2004). Moreover, activation of src family kinases, downstream of ephrinB2/EphB2 signaling, causes the phosphorylation of NMDA receptors, which results in an increase in Ca2+ influx (Takasu et al., 2002).
It seems unlikely that GRIP1, which facilitates the surface accumulation of AMPA receptors by association with the GluA2 subunit (Dong et al., 1997; Osten et al., 2000; Setou et al., 2002), could be involved in GluA2-containing AMPA receptor endocytosis caused by tyrosine phosphorylation of GluA2, because GRIP1 expression was hardly changed in retinae with COH (Fig. 10). On the other hand, PICK1 expression was remarkably increased even though the change was at a slower rate compared with that of m-GluA2 expression (Fig. 8). This is suggestive of the involvement of PICK1, as PICK1 is known to decrease the surface expression of GluA2 by promoting receptor internalization (Perez et al., 2001; Song and Huganir, 2002), and in the heterologous expression system it was further shown that PICK1 induces coclustering of EphB/ephrinB and undergoes tyrosine phosphorylation when complexed with EphB2 receptors (Torres et al., 1998). It should be noted that the increase of PICK1 levels started in G2w, while the decrease of m-GluA2 occurred as early as on G1d. A possible explanation for this inconsistency is that GluA2 internalization following IOP elevation may be primarily induced by the phosphorylation of GluA2, which is lately further promoted by increased PICK1 levels.
Footnotes
This work was supported by the National Program of Basic Research of China (Grants 2013CB835100 and 2011CB504602), the National Natural Science Foundation of China (Grants 31271173, 31470054, and 81430007), and the Key Research Program of Science and Technology Commissions of Shanghai Municipality (Grants 11JC1401200 and 13DJ1400302).
The authors declare no competing financial interests.
References
- Ahmadian G, Ju W, Liu L, Wyszynski M, Lee SH, Dunah AW, Taghibiglou C, Wang Y, Lu J, Wong TP, Sheng M, Wang YT. Tyrosine phosphorylation of GluA2 is required for insulin-stimulated AMPA receptor endocytosis and LTD. EMBO J. 2004;23:1040–1050. doi: 10.1038/sj.emboj.7600126. [DOI] [PMC free article] [PubMed] [Google Scholar]
- Brückner K, Pablo Labrador J, Scheiffele P, Herb A, Seeburg PH, Klein R. EphrinB ligands recruit GRIP family PDZ adaptor proteins into raft membrane microdomains. Neuron. 1999;22:511–524. doi: 10.1016/S0896-6273(00)80706-0. [DOI] [PubMed] [Google Scholar]
- Calderone A, Jover T, Noh KM, Tanaka H, Yokota H, Lin Y, Grooms SY, Regis R, Bennett MV, Zukin RS. Ischemic insults derepress the gene silencer REST in neurons destined to die. J Neurosci. 2003;23:2112–2121. doi: 10.1523/JNEUROSCI.23-06-02112.2003. [DOI] [PMC free article] [PubMed] [Google Scholar]
- Calò L, Bruno V, Spinsanti P, Molinari G, Korkhov V, Esposito Z, Patanè M, Melchiorri D, Freissmuth M, Nicoletti F. Interactions between ephrin-B and metabotropic glutamate 1 receptors in brain tissue and cultured neurons. J Neurosci. 2005a;25:2245–2254. doi: 10.1523/JNEUROSCI.4956-04.2005. [DOI] [PMC free article] [PubMed] [Google Scholar]
- Calò L, Spillantini M, Nicoletti F, Allen ND. Nurr1 co-localizes with EphB1 receptors in the developing ventral midbrain, and its expression is enhanced by the EphB1 ligand, ephrinB2. J Neurochem. 2005b;92:235–245. doi: 10.1111/j.1471-4159.2004.02853.x. [DOI] [PubMed] [Google Scholar]
- Calò L, Cinque C, Patanè M, Schillaci D, Battaglia G, Melchiorri D, Nicoletti F, Bruno V. Interaction between ephrins/Eph receptors and excitatory amino acid receptors: possible relevance in the regulation of synaptic plasticity and in the pathophysiology of neuronal degeneration. J Neurochem. 2006;98:1–10. doi: 10.1111/j.1471-4159.2006.03844.x. [DOI] [PubMed] [Google Scholar]
- Chen J, Miao Y, Wang XH, Wang Z. Elevation of p-NR2AS1232 by Cdk5/p35 contributes to retinal ganglion cell apoptosis in a rat experimental glaucoma model. Neurobiol Dis. 2011;43:455–464. doi: 10.1016/j.nbd.2011.04.019. [DOI] [PubMed] [Google Scholar]
- Chen Y, Fu AK, Ip NY. Eph receptors at synapses: implications in neurodegenerative diseases. Cell Signal. 2012;24:606–611. doi: 10.1016/j.cellsig.2011.11.016. [DOI] [PubMed] [Google Scholar]
- Dalva MB, Takasu MA, Lin MZ, Shamah SM, Hu L, Gale NW, Greenberg ME. EphB receptors interact with NMDA receptors and regulate excitatory synapse formation. Cell. 2000;103:945–956. doi: 10.1016/S0092-8674(00)00197-5. [DOI] [PubMed] [Google Scholar]
- Dixon RM, Mellor JR, Hanley JG. PICK1-mediated glutamate receptor subunit 2 (GluR2) trafficking contributes to cell death in oxygen/glucose-deprived hippocampal neurons. J Biol Chem. 2009;284:14230–14235. doi: 10.1074/jbc.M901203200. [DOI] [PMC free article] [PubMed] [Google Scholar]
- Dong H, O'Brien RJ, Fung ET, Lanahan AA, Worley PF, Huganir RL. GRIP: a synaptic PDZ domain-containing protein that interacts with AMPA receptors. Nature. 1997;386:279–284. doi: 10.1038/386279a0. [DOI] [PubMed] [Google Scholar]
- Dong H, Zhang P, Song I, Petralia RS, Liao D, Huganir RL. Characterization of the glutamate receptor-interacting proteins GRIP1 and GRIP2. J Neurosci. 1999;19:6930–6941. doi: 10.1523/JNEUROSCI.19-16-06930.1999. [DOI] [PMC free article] [PubMed] [Google Scholar]
- Dräger UC, Olsen JF. Origins of crossed and uncrossed retinal projections in pigmented and albino mice. J Comp Neurol. 1980;191:383–412. doi: 10.1002/cne.901910306. [DOI] [PubMed] [Google Scholar]
- Dreher B, Sefton AJ, Ni SY, Nisbett G. The morphology, number, distribution and central projections of class I retinal ganglion cells in albino and hooded rats. Brain Behav Evol. 1985;26:10–48. doi: 10.1159/000118764. [DOI] [PubMed] [Google Scholar]
- Du J, Tran T, Fu C, Sretavan DW. Upregulation of EphB2 and ephrin-B2 at the optic nerve head of DBA/2J glaucomatous mice coincides with axon loss. Invest Ophthalmol Vis Sci. 2007;48:5567–5581. doi: 10.1167/iovs.07-0442. [DOI] [PubMed] [Google Scholar]
- Egea J, Klein R. Bidirectional Eph-ephrin signaling during axon guidance. Trends Cell Biol. 2007;17:230–238. doi: 10.1016/j.tcb.2007.03.004. [DOI] [PubMed] [Google Scholar]
- Ethell IM, Irie F, Kalo MS, Couchman JR, Pasquale EB, Yamaguchi Y. EphB/syndecan-2 signaling in dendritic spine morphogenesis. Neuron. 2001;31:1001–1013. doi: 10.1016/S0896-6273(01)00440-8. [DOI] [PubMed] [Google Scholar]
- Fox CJ, Russell K, Titterness AK, Wang YT, Christie BR. Tyrosine phosphorylation of the GluR2 subunit is required for long-term depression of synaptic efficacy in young animals in vivo. Hippocampus. 2007;17:600–605. doi: 10.1002/hipo.20302. [DOI] [PubMed] [Google Scholar]
- Fu CT, Sretavan D. Involvement of EphB/Ephrin-B signaling in axonal survival in mouse experimental glaucoma. Invest Ophthalmol Vis Sci. 2012;53:76–84. doi: 10.1167/iovs.11-8546. [DOI] [PMC free article] [PubMed] [Google Scholar]
- Fu CT, Tran T, Sretavan D. Axonal/glial upregulation of EphB/ephrin-B signaling in mouse experimental ocular hypertension. Invest Ophthalmol Vis Sci. 2010;51:991–1001. doi: 10.1167/iovs.09-3579. [DOI] [PMC free article] [PubMed] [Google Scholar]
- Gavrieli Y, Sherman Y, Ben-Sasson SA. Identification of programmed cell death in situ via specific labeling of nuclear DNA fragmentation. J Cell Biol. 1992;119:493–501. doi: 10.1083/jcb.119.3.493. [DOI] [PMC free article] [PubMed] [Google Scholar]
- Gorter JA, Petrozzino JJ, Aronica EM, Rosenbaum DM, Opitz T, Bennett MV, Connor JA, Zukin RS. Global ischemia induces downregulation of Glur2 mRNA and increases AMPA receptor-mediated Ca2+ influx in hippocampal CA1 neurons of gerbil. J Neurosci. 1997;17:6179–6188. doi: 10.1523/JNEUROSCI.17-16-06179.1997. [DOI] [PMC free article] [PubMed] [Google Scholar]
- Grunwald IC, Korte M, Wolfer D, Wilkinson GA, Unsicker K, Lipp HP, Bonhoeffer T, Klein R. Kinase-independent requirement of EphB2 receptors in hippocampal synaptic plasticity. Neuron. 2001;32:1027–1040. doi: 10.1016/S0896-6273(01)00550-5. [DOI] [PubMed] [Google Scholar]
- Grunwald IC, Korte M, Adelmann G, Plueck A, Kullander K, Adams RH, Frotscher M, Bonhoeffer T, Klein R. Hippocampal plasticity requires postsynaptic ephrinBs. Nat Neurosci. 2004;7:33–40. doi: 10.1038/nn1164. [DOI] [PubMed] [Google Scholar]
- Guo L, Wang Y. Glutamate stimulates glutamate receptor interacting protein 1 degradation by ubiquitin-proteasome system to regulate surface expression of GluR2. Neuroscience. 2007;145:100–109. doi: 10.1016/j.neuroscience.2006.11.042. [DOI] [PubMed] [Google Scholar]
- Himanen JP, Saha N, Nikolov DB. Cell-cell signaling via Eph receptors and ephrins. Curr Opin Cell Biol. 2007;19:534–542. doi: 10.1016/j.ceb.2007.08.004. [DOI] [PMC free article] [PubMed] [Google Scholar]
- Hofbauer A, Dräger UC. Depth segregation of retinal ganglion cells projecting to mouse superior colliculus. J Comp Neurol. 1985;234:465–474. doi: 10.1002/cne.902340405. [DOI] [PubMed] [Google Scholar]
- Hruska M, Dalva MB. Ephrin regulation of synapse formation, function and plasticity. Mol Cell Neurosci. 2012;50:35–44. doi: 10.1016/j.mcn.2012.03.004. [DOI] [PMC free article] [PubMed] [Google Scholar]
- Irie F, Okuno M, Pasquale EB, Yamaguchi Y. EphrinB–EphB signalling regulates clathrin-mediated endocytosis through tyrosine phosphorylation of synaptojanin 1. Nat Cell Biol. 2005;7:501–509. doi: 10.1038/ncb1252. [DOI] [PMC free article] [PubMed] [Google Scholar]
- Ji M, Zhao WJ, Dong LD, Miao Y, Yang XL, Sun XH, Wang Z. RGS2 and RGS4 modulate melatonin-induced potentiation of glycine currents in rat retinal ganglion cells. Brain Res. 2011;1411:1–8. doi: 10.1016/j.brainres.2011.07.008. [DOI] [PubMed] [Google Scholar]
- Ji M, Miao Y, Dong LD, Chen J, Mo XF, Jiang SX, Sun XH, Yang XL, Wang Z. Group I mGluR-mediated inhibition of Kir channels contributes to retinal Müller cell gliosis in a rat chronic ocular hypertension model. J Neurosci. 2012;32:12744–12755. doi: 10.1523/JNEUROSCI.1291-12.2012. [DOI] [PMC free article] [PubMed] [Google Scholar]
- Klein R. Bidirectional modulation of synaptic functions by Eph/ephrin signaling. Nat Neurosci. 2009;12:15–20. doi: 10.1038/nn.2231. [DOI] [PubMed] [Google Scholar]
- Kullander K, Klein R. Mechanisms and functions of Eph and ephrin signalling. Nat Rev Mol Cell Biol. 2002;3:475–486. doi: 10.1038/nrm856. [DOI] [PubMed] [Google Scholar]
- Kwak S, Kawahara Y. Deficient RNA editing of GluR2 and neuronal death in amyotropic lateral sclerosis. J Mol Med. 2005;83:110–120. doi: 10.1007/s00109-004-0599-z. [DOI] [PubMed] [Google Scholar]
- Lai KO, Ip NY. Synapse development and plasticity: roles of ephrin/Eph receptor signaling. Curr Opin Neurobiol. 2009;19:275–283. doi: 10.1016/j.conb.2009.04.009. [DOI] [PubMed] [Google Scholar]
- Liebl DJ, Morris CJ, Henkemeyer M, Parada LF. mRNA expression of ephrins and Eph receptor tyrosine kinases in the neonatal and adult mouse central nervous system. J Neurosci Res. 2003;71:7–22. doi: 10.1002/jnr.10457. [DOI] [PubMed] [Google Scholar]
- Lim BK, Matsuda N, Poo MM. Ephrin-B reverse signaling promotes structural and functional synaptic maturation in vivo. Nat Neurosci. 2008;11:160–169. doi: 10.1038/nn2033. [DOI] [PubMed] [Google Scholar]
- Linden R, Perry VH. Massive retinotectal projection in rats. Brain Res. 1983;272:145–149. doi: 10.1016/0006-8993(83)90371-2. [DOI] [PubMed] [Google Scholar]
- Liu B, Liao M, Mielke JG, Ning K, Chen Y, Li L, El-Hayek YH, Gomez E, Zukin RS, Fehlings MG, Wan Q. Ischemic insults direct glutamate receptor subunit 2-lacking AMPA receptors to synaptic sites. J Neurosci. 2006;26:5309–5319. doi: 10.1523/JNEUROSCI.0567-06.2006. [DOI] [PMC free article] [PubMed] [Google Scholar]
- Liu SJ, Zukin RS. Ca2+-permeable AMPA receptors in synaptic plasticity and neuronal death. Trends Neurosci. 2007;30:126–134. doi: 10.1016/j.tins.2007.01.006. [DOI] [PubMed] [Google Scholar]
- Liu S, Lau L, Wei J, Zhu D, Zou S, Sun HS, Fu Y, Liu F, Lu Y. Expression of Ca(2+)-permeable AMPA receptor channels primes cell death in transient forebrain ischemia. Neuron. 2004;43:43–55. doi: 10.1016/j.neuron.2004.06.017. [DOI] [PubMed] [Google Scholar]
- Lu W, Ziff EB. PICK1 interacts with ABP/GRIP to regulate AMPA receptor trafficking. Neuron. 2005;47:407–421. doi: 10.1016/j.neuron.2005.07.006. [DOI] [PubMed] [Google Scholar]
- Miao Y, Dong LD, Chen J, Hu XC, Yang XL, Wang Z. Involvement of calpain/p35-p25/Cdk5/NMDAR signaling pathway in glutamate-induced neurotoxicity in cultured rat retinal neurons. PLoS One. 2012;7:e42318. doi: 10.1371/journal.pone.0042318. [DOI] [PMC free article] [PubMed] [Google Scholar]
- Murai KK, Pasquale EB. Eph receptors, ephrins, and synaptic function. Neuroscientist. 2004;10:304–314. doi: 10.1177/1073858403262221. [DOI] [PubMed] [Google Scholar]
- Nadal-Nicolás FM, Jiménez-López M, Sobrado-Calvo P, Nieto-López L, Cánovas-Martínez I, Salinas-Navarro M, Vidal-Sanz M, Agudo M. Brn3a as a marker of retinal ganglion cells: qualitative and quantitative time course studies in naive and optic nerve-injured retinas. Invest Ophthalmol Vis Sci. 2009;50:3860–3868. doi: 10.1167/iovs.08-3267. [DOI] [PubMed] [Google Scholar]
- Nadal-Nicolás FM, Jiménez-López M, Salinas-Navarro M, Sobrado-Calvo P, Alburquerque-Béjar JJ, Vidal-Sanz M, Agudo-Barriuso M. Whole number, distribution and co-expression of brn3 transcription factors in retinal ganglion cells of adult albino and pigmented rats. PLoS One. 2012;7:e49830. doi: 10.1371/journal.pone.0049830. [DOI] [PMC free article] [PubMed] [Google Scholar]
- Noh KM, Yokota H, Mashiko T, Castillo PE, Zukin RS, Bennett MV. Blockade of calcium-permeable AMPA receptors protects hippocampal neurons against global ischemia-induced death. Proc Natl Acad Sci U S A. 2005;102:12230–12235. doi: 10.1073/pnas.0505408102. [DOI] [PMC free article] [PubMed] [Google Scholar]
- Opitz T, Grooms SY, Bennett MV, Zukin RS, Optiz T. Remodeling of alpha-amino-3-hydroxy-5-methyl-4-isoxazole-propionic acid receptor subunit composition in hippocampal neurons after global ischemia. Proc Natl Acad Sci U S A. 2000;97:13360–13365. doi: 10.1073/pnas.97.24.13360. [DOI] [PMC free article] [PubMed] [Google Scholar]
- Osten P, Khatri L, Perez JL, Köhr G, Giese G, Daly C, Schulz TW, Wensky A, Lee LM, Ziff EB. Mutagenesis reveals a role for ABP/GRIP binding to GluR2 in synaptic surface accumulation of the AMPA receptor. Neuron. 2000;27:313–325. doi: 10.1016/S0896-6273(00)00039-8. [DOI] [PubMed] [Google Scholar]
- Osusky M, Taylor SJ, Shalloway D. Autophosphorylation of purified c-Src at its primary negative regulation site. J Biol Chem. 1995;270:25729–25732. doi: 10.1074/jbc.270.43.25729. [DOI] [PubMed] [Google Scholar]
- Palmer A, Zimmer M, Erdmann KS, Eulenburg V, Porthin A, Heumann R, Deutsch U, Klein R. EphrinB phosphorylation and reverse signaling: regulation by Src kinases and PTP-BL phosphatase. Mol Cell. 2002;9:725–737. doi: 10.1016/S1097-2765(02)00488-4. [DOI] [PubMed] [Google Scholar]
- Pasquale EB. Eph receptor signaling casts a wide net on cell behavior. Nat Rev Mol Cell Biol. 2005;6:462–475. doi: 10.1038/nrm1662. [DOI] [PubMed] [Google Scholar]
- Pasquale EB. Eph-ephrin bidirectional signaling in physiology and disease. Cell. 2008;133:38–52. doi: 10.1016/j.cell.2008.03.011. [DOI] [PubMed] [Google Scholar]
- Pellegrini-Giampietro DE, Zukin RS, Bennett MV, Cho S, Pulsinelli WA. Switch in glutamate receptor subunit gene expression in CA1 subfield of hippocampus following global ischemia in rats. Proc Natl Acad Sci U S A. 1992;89:10499–10503. doi: 10.1073/pnas.89.21.10499. [DOI] [PMC free article] [PubMed] [Google Scholar]
- Perez JL, Khatri L, Chang C, Srivastava S, Osten P, Ziff EB. PICK1 targets activated protein kinase Cα to AMPA receptor clusters in spines of hippocampal neurons and reduces surface levels of the AMPA-type glutamate receptor subunit 2. J Neurosci. 2001;21:5417–5428. doi: 10.1523/JNEUROSCI.21-15-05417.2001. [DOI] [PMC free article] [PubMed] [Google Scholar]
- Quina LA, Pak W, Lanier J, Banwait P, Gratwick K, Liu Y, Velasquez T, O'Leary DD, Goulding M, Turner EE. Brn3a-expressing retinal ganglion cells project specifically to thalamocortical and collicular visual pathways. J Neurosci. 2005;25:11595–11604. doi: 10.1523/JNEUROSCI.2837-05.2005. [DOI] [PMC free article] [PubMed] [Google Scholar]
- Reinehr R, Becker S, Wettstein M, Häussinger D. Involvement of the Src family kinase yes in bile salt-induced apoptosis. Gastroenterology. 2004;127:1540–1557. doi: 10.1053/j.gastro.2004.08.056. [DOI] [PubMed] [Google Scholar]
- Reinehr R, Becker S, Eberle A, Grether-Beck S, Häussinger D. Involvement of NADPH oxidase isoforms and Src family kinases in CD95-dependent hepatocyte apoptosis. J Biol Chem. 2005;280:27179–27194. doi: 10.1074/jbc.M414361200. [DOI] [PubMed] [Google Scholar]
- Salinas-Navarro M, Jiménez-López M, Valiente-Soriano FJ, Alarcón-Martínez L, Avilés-Trigueros M, Mayor S, Holmes T, Lund RD, Villegas-Pérez MP, Vidal-Sanz M. Retinal ganglion cell population in adult albino and pigmented mice: a computerized analysis of the entire population and its spatial distribution. Vision Res. 2009a;49:637–647. doi: 10.1016/j.visres.2009.01.010. [DOI] [PubMed] [Google Scholar]
- Salinas-Navarro M, Mayor-Torroglosa S, Jiménez-López M, Avilés-Trigueros M, Holmes TM, Lund RD, Villegas-Pérez MP, Vidal-Sanz M. A computerized analysis of the entire retinal ganglion cell population and its spatial distribution in adult rats. Vision Res. 2009b;49:115–126. doi: 10.1016/j.visres.2008.09.029. [DOI] [PubMed] [Google Scholar]
- Schmidt JF, Agapova OA, Yang P, Kaufman PL, Hernandez MR. Expression of ephrinB1 and its receptor in glaucomatous optic neuropathy. Br J Ophthalmol. 2007;91:1219–1224. doi: 10.1136/bjo.2006.112185. [DOI] [PMC free article] [PubMed] [Google Scholar]
- Setou M, Seog DH, Tanaka Y, Kanai Y, Takei Y, Kawagishi M, Hirokawa N. Glutamate-receptor-interacting protein GRIP1 directly steers kinesin to dendrites. Nature. 2002;417:83–87. doi: 10.1038/nature743. [DOI] [PubMed] [Google Scholar]
- Simon HU, Yousefi S, Dibbert B, Hebestreit H, Weber M, Branch DR, Blaser K, Levi-Schaffer F, Anderson GP. Role for tyrosine phosphorylation and Lyn tyrosine kinase in fas receptor-mediated apoptosis in eosinophils. Blood. 1998;92:547–557. [PubMed] [Google Scholar]
- Song I, Huganir RL. Regulation of AMPA receptors during synaptic plasticity. Trends Neurosci. 2002;25:578–588. doi: 10.1016/S0166-2236(02)02270-1. [DOI] [PubMed] [Google Scholar]
- Stover DR, Furet P, Lydon NB. Modulation of the SH2 binding specificity and kinase activity of Src by tyrosine phosphorylation within its SH2 domain. J Biol Chem. 1996;271:12481–12487. doi: 10.1074/jbc.271.21.12481. [DOI] [PubMed] [Google Scholar]
- Szabò I, Lepple-Wienhues A, Kaba KN, Zoratti M, Gulbins E, Lang F. Tyrosine kinase-dependent activation of a chloride channel in CD95-induced apoptosis in T lymphocytes. Proc Natl Acad Sci U S A. 1998;95:6169–6174. doi: 10.1073/pnas.95.11.6169. [DOI] [PMC free article] [PubMed] [Google Scholar]
- Takasu MA, Dalva MB, Zigmond RE, Greenberg ME. Modulation of NMDA receptor-dependent calcium influx and gene expression through EphB receptors. Science. 2002;295:491–495. doi: 10.1126/science.1065983. [DOI] [PubMed] [Google Scholar]
- Takuma H, Kwak S, Yoshizawa T, Kanazawa I. Reduction of GluR2 RNAediting, a molecular change that increases calcium influx through AMPA receptors, selective in the spinal ventral gray of patients with amyotrophic lateral sclerosis. Ann Neurol. 1999;46:806–815. doi: 10.1002/1531-8249(199912)46:6<806::AID-ANA2>3.0.CO;2-S. [DOI] [PubMed] [Google Scholar]
- Torres R, Firestein BL, Dong H, Staudinger J, Olson EN, Huganir RL, Bredt DS, Gale NW, Yancopoulos GD. PDZ proteins bind, cluster and synaptically colocalize with Eph receptors and their ephrin ligands. Neuron. 1998;21:1453–1463. doi: 10.1016/S0896-6273(00)80663-7. [DOI] [PubMed] [Google Scholar]
- Wu J, Zhang S, Sun X. Neuroprotective effect of upregulated sonic Hedgehog in retinal ganglion cells following chronic ocular hypertension. Invest Ophthalmol Vis Sci. 2010;51:2986–2992. doi: 10.1167/iovs.09-4151. [DOI] [PubMed] [Google Scholar]
- Yamaguchi Y, Pasquale EB. Eph receptors in the adult brain. Curr Opin Neurobiol. 2004;14:288–296. doi: 10.1016/j.conb.2004.04.003. [DOI] [PubMed] [Google Scholar]
- Yang XF, Miao Y, Ping Y, Wu HJ, Yang XL, Wang Z. Melatonin inhibits tetraethylammonium-sensitive potassium channels of rod ON type bipolar cells via MT2 receptors in rat retina. Neuroscience. 2011;173:19–29. doi: 10.1016/j.neuroscience.2010.11.028. [DOI] [PubMed] [Google Scholar]
- Zhao WJ, Zhang M, Miao Y, Yang XL, Wang Z. Melatonin potentiates glycine currents through a PLC/PKC signaling pathway in rat retinal ganglion cells. J Physiol. 2010;588:2605–2619. doi: 10.1113/jphysiol.2010.187641. [DOI] [PMC free article] [PubMed] [Google Scholar]


