

Abstract
Diabetes is a common comorbidity in stroke patients and a strong predictor of poor functional outcome. To provide a more mechanistic understanding of this clinically relevant problem, we focused on how diabetes affects blood–brain barrier (BBB) function after stroke. Because the BBB can be compromised for days after stroke and thus further exacerbate ischemic injury, manipulating its function presents a unique opportunity for enhancing stroke recovery long after the window for thrombolytics has passed. Using a mouse model of Type 1 diabetes, we discovered that ischemic stroke leads to an abnormal and persistent increase in vascular endothelial growth factor receptor 2 (VEGF-R2) expression in peri-infarct vascular networks. Correlating with this, BBB permeability was markedly increased in diabetic mice, which could not be prevented with insulin treatment after stroke. Imaging of capillary ultrastructure revealed that BBB permeability was associated with an increase in endothelial transcytosis rather than a loss of tight junctions. Pharmacological inhibition (initiated 2.5 d after stroke) or vascular-specific knockdown of VEGF-R2 after stroke attenuated BBB permeability, loss of synaptic structure in peri-infarct regions, and improved recovery of forepaw function. However, the beneficial effects of VEGF-R2 inhibition on stroke recovery were restricted to diabetic mice and appeared to worsen BBB permeability in nondiabetic mice. Collectively, these results suggest that aberrant VEGF signaling and BBB dysfunction after stroke plays a crucial role in limiting functional recovery in an experimental model of diabetes. Furthermore, our data highlight the need to develop more personalized stroke treatments for a heterogeneous clinical population.
Keywords: blood–brain barrier, dendritic spines, diabetes, imaging, stroke, vascular endothelial growth factor
Introduction
Diabetes is a major risk factor for ischemic stroke (Iemolo et al., 2002; Wei et al., 2010) and lowers the prognosis for recovering function and independence in daily life (Toni et al., 1992; Kruyt et al., 2008). Currently, the molecular mechanisms underlying this significant clinical problem remain unclear. However, recent experimental studies have traced the diminished prospect for recovery to abnormalities in peri-infarct cortical plasticity (Sweetnam et al., 2012), neovascularization (Li et al., 2013; Prakash et al., 2013), and blood flow (Tennant and Brown, 2013). Unfortunately, restoring euglycemic conditions after stroke has not been sufficient to prevent these maladaptive neuronal/vascular responses or normalize functional recovery (Sweetnam et al., 2012; Prakash et al., 2013; Tennant and Brown, 2013). Therefore, further mechanistic studies are needed if this common stroke comorbidity is to be adequately treated.
The blood–brain barrier (BBB) plays an important role in maintaining normal brain function in healthy and diseased states (Zlokovic, 2008). Following ischemic stroke, the BBB breaks down in the infarct core and in peri-infarct regions (del Zoppo and Mabuchi, 2003; Ballabh et al., 2004). This breakdown typically occurs in two distinct phases: an early phase that peaks within the first few hours and then a second wave of permeability that crests 2–3 d later (Sandoval and Witt, 2008). As a result of increased BBB permeability, toxic constituents from the blood plasma can enter into the brain parenchyma, causing irreversible damage to neural circuits (Chen et al., 2009). For diabetics, it is conceivable that the extent of BBB breakdown may be much more severe after stroke (Berger and Hakim, 1986), especially because tissue repair mechanisms and endothelial function are already compromised (Hawkins et al., 2007; Li et al., 2010). Whether BBB disruption and subsequent damage to peri-infarct circuits are exacerbated by stroke in an animal model of Type 1 diabetes has not been examined.
Vascular endothelial growth factor (VEGF) plays a pivotal role in regulating vascular function and is upregulated under ischemic conditions (Gu et al., 2001; Zhang et al., 2002; Stowe et al., 2007). By binding to the receptor tyrosine kinase, VEGF receptor 2 (VEGF-R2) (Terman and Dougher-Vermazen, 1992), VEGF is well known to induce BBB permeability (Feng et al., 1999; Zhao et al., 2011). Given the multifaceted effects of VEGF on BBB integrity and endothelial function, many preclinical studies have either blocked or promoted VEGF signaling after stroke (Hermann and Zechariah, 2009). Unfortunately, the outcomes of these studies have been quite variable (Manoonkitiwongsa et al., 2011; Greenberg and Jin, 2013), suggesting that too much or too little VEGF signaling, or even the timing of VEGF therapies, could significantly affect stroke outcome. Here we characterized the spatial and temporal progression of VEGF signaling proteins and resultant loss of BBB integrity after stroke. We focused on the “late” phase of BBB breakdown (≥3 d after stroke) in this preclinical study because it represents a time frame that would be maximally inclusive for stroke treatment. Our experiments reveal that diabetes augments VEGF signaling after stroke, thereby exacerbating BBB permeability, synaptic damage, and limiting functional recovery.
Materials and Methods
Animals.
Two- to 4-month-old male wild-type, GFP-M, or YFP-H line mice on a C57BL/6 background (Feng et al., 2000) were used. Tie2-Cre-ERT2 mice (EMMA 00715) (Forde et al., 2002) were obtained from the European Mouse Mutant Archives and bred with either VEGF-R2flx/flx line (Hooper et al., 2009) or Ai9 tdTomato reporter mice (The Jackson Laboratory, 007909) to confirm recombinase activity and specificity (Madisen et al., 2010). Cre recombinase activity was induced before stroke by three daily intraperitoneal injections of 75 mg/kg of tamoxifen (Sigma) (Monvoisin et al., 2006; Sörensen et al., 2009). Mice were housed under 12 h light/dark cycle and given ad libitum access to water and laboratory diet. All experiments were conducted according to the guidelines set by the Canadian Council of Animal Care and ARRIVE, and approved by the University of Victoria Animal Care Committee.
Induction of chronic hyperglycemia and stroke.
Type 1 diabetes was modeled by injecting food-deprived mice with streptozotocin (STZ; 75 mg/kg, Sigma) dissolved in 50 mm citrate buffer over 2 consecutive days. Nondiabetic controls were administered buffer alone. Mice were given 5% sucrose water for 48 h after injection to prevent sudden hypoglycemia. Blood glucose levels were measured (Accu-Chek, Aviva, Roche) in fasted mice every 1–2 weeks by withdrawing a drop of blood from the tail. Mice with blood glucose levels >15 mm/L (hyperglycemic) were considered diabetic.
Focal ischemic stroke of the right forelimb somatosensory cortex was induced in mice 4–5 weeks following STZ or vehicle injection using the photothrombotic method (Watson et al., 1985; Brown et al., 2007). Mice were anesthetized with 1.5% isoflurane in medical air (flow rate = 0.7 L/min). Each mouse was kept on a heating pad during surgery to stabilize body temperature at 37°C, which was measured with a rectal thermoprobe and temperature feedback regulator. The scalp was retracted, and the skull overlying the forelimb cortex was thinned with a dental drill. Photothrombosis was initiated by exposing the surface vessels over the forelimb cortex to a collimated green laser beam (532 nm beam at 17 mW, Beta Electronics) for 15 min after injecting 1% Rose bengal dye (110 mg/kg, i.p., Sigma) dissolved in HEPES-buffered saline. To normalize blood sugar levels in hyperglycemic mice, two or three slow-release insulin pellets (0.1 U/24 h/implant, LinBit, Linshin Canada) were implanted subcutaneously between the scapulae in the first hour after stroke. Insulin implanted diabetic mice had blood glucose levels tested daily. Mice were allowed to recover after surgery under a heating lamp. Of the 261 mice subjected to stroke, 19 were excluded from the study due to poor health and 8 were excluded for having no visible infarct.
VEGF-R2 inhibition.
Mice were given 50 mg/kg subcutaneous injection of VEGF-R2 inhibitor SU5416 (Tocris Bioscience) in solution (0.5% w/v carboxy methyl cellulose, 0.9% sodium chloride, 0.4% polysorbate, 0.9% benzyl alcohol in dH2O). Controls were given vehicle alone. For behavioral studies of functional recovery, mice were given an injection of SU5416 or vehicle 2.5 d after stroke and then every 3 d for up to 42 d after stroke.
Analysis of vessel permeability and branching.
Three, 7, or 28 d following stroke, mice were anesthetized and given a 0.2 ml intravenous injection of 4% Evans blue (Sigma) in saline through the tail vein. Injections were performed slowly over 7–10 min to minimize stress to the vascular system. Evans blue was allowed to circulate for 30 min after which the mouse was quickly decapitated. The brain was removed and put into 4% PFA in PBS overnight. Brains were sectioned in the coronal plane at a thickness of 100 μm on a Leica VT1000S vibratome. Every sixth vibratome section was stained for 20 min in 50 mm DAPI in 0.1 m PBS to visualize the infarct border. Sections were mounted on charged slides and coverslipped using Fluoromount-G (Southern Biotechnology). Diabetic and control mouse brains were processed and imaged in parallel, and all sections were imaged immediately after cutting to minimize the possible leaching out of Evans blue dye that can occur over a 24 h period. Evans blue was excited using a 635 nm laser and imaged using an Olympus confocal microscope with a 10× objective (NA = 0.40) and a Cy5 filter set (exciter: 605–650 nm, emitter: 670–720 nm, 8.0 μs dwell time) or Zeiss confocal (10× objective, NA = 0.25, 405, and 639 nm laser, Cy5 filter set, 3.15 μs dwell time). Confocal image stacks were collected in 2 μm Z-steps at a pixel resolution of 1024 × 1024 (1.035 μm/pixel). All imaging parameters, including gain and offset, were kept consistent; however, in some cases, laser power was adjusted (but not within an imaging cohort) to avoid saturation of Evans blue signal.
For each mouse, image stacks from three regions within the peri-infarct cortex and two from the contralateral hemisphere were analyzed using National Institutes of Health ImageJ software (version 1.45p). The infarct border was determined from DAPI labeling of nuclei, and the loss of Evans blue-labeled vessels in the infarct core. For each image, an average Z-intensity projection was generated from the middle 30 μm. Visualization of extravascular dye fluorescence was performed by subtracting a vessel mask (created by thresholding and binarizing dye-filled vasculature) from the original Z-projection image (e.g., see Fig. 3B). Extravascular dye fluorescence was quantified at different cortical depths by drawing three lines perpendicular to the infarct border (width 4.14 μm, length 800 μm) at depths of 200, 500, and 800 μm below the pial surface. For the hemisphere contralateral to the stroke, the starting point of each line was matched to the position of the ispilateral infarct border. In each brain, the superficial, middle, and deep measurements of fluorescence were binned in 100 μm intervals from the infarct border and then averaged over the three sections imaged. Because there was no significant difference in extravascular fluorescence between the contralateral and sham stroke hemisphere for both nondiabetic (F(3,15) = 1.21, p = 0.33) and diabetic (F(3,13) = 1.39, p = 0.28) mice, dye fluorescence in the peri-infarct cortex was normalized by subtracting the average contralateral dye fluorescence for the corresponding depth in each animal.
Figure 3.
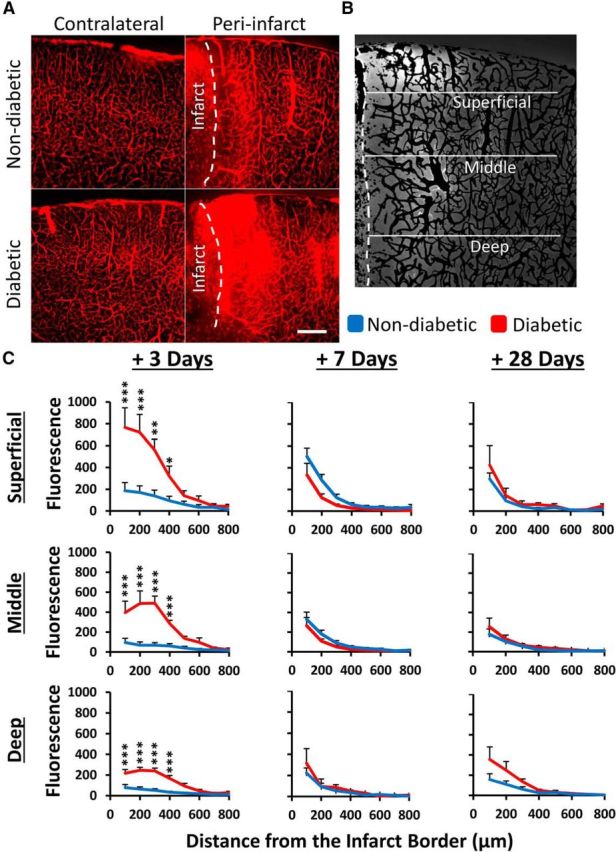
Diabetes exacerbates the loss of BBB integrity 3 d after stroke. A, Representative images of Evans blue fluorescence in diabetic and nondiabetic brains after stroke. In the undamaged contralateral hemisphere, fluorescence was restricted to blood vessels (left). After stroke, extravascular dye fluorescence was evident in peri-infarct cortex, particularly in diabetic mice. Scale bar, 200 μm. B, Representative image showing isolated extravascular fluorescence signal (after subtracting vascular signal, see Materials and Methods) and areas where fluorescence intensity measurements were made. Each line is 800 μm. C, Plot profiles show normalized extravascular fluorescence in nondiabetic (blue) and diabetic (red) peri-infarct cortex, plotted by distance from infarct and by depth from pial surface at 3, 7, and 28 d after stroke (n = 5–7 mice per group). *p < 0.05. **p < 0.01. ***p < 0.001.
We examined the number of vessel branching points within the 400 × 800 μm (width × height) region adjacent to the infarct where we observed increased BBB permeability. Binary vessel masks were skeletonized using Fiji software (Schindelin et al., 2012) and branching points detected and counted using the skeleton analyze plugin by a blind observer. We did not detect any significant differences between the sham and contralateral hemisphere (p > 0.05 for all comparisons); therefore, contralateral data are presented as the control.
Western blotting.
Mice were given an overdose of sodium pentobarbital (175 mg/kg, i.p.) and transcardially perfused with PBS to clear the blood. The peri-infarct and homotopic region of the contralateral cortex were dissected and placed immediately in chilled 0.5 ml lysis buffer (10 mm HEPES, 150 mm NaCl, 2 mm EGTA, 10 mm EDTA, 1% Triton X, 10% glycerol, and 1× Halt Proteinase Inhibitor Mixture). Samples were sonicated and then centrifuged at 2000 × g for 15 min at 4°C. The supernatants were then removed and used for gel electrophoresis. The total protein content of the samples was measured with a BCA protein assay kit (Pierce, #23225, 540 nm absorbance). A total of 20 μg of protein were loaded per well and separated on a 10% SDS polyacrylamide gel followed by transfer to PVDF membranes (Bio-Rad catalog #162-0177) at 40 V in transfer buffer (25 mm Tris, 192 mm glycine, 20% (v/v) methanol) overnight at 4°C. Membranes were blocked for 1 h at room temperature with 5% (w/v) Difco skim milk (Becton Dickinson) and incubated with primary antibody diluted 1:1000–5000 in PBS with 0.1% Tween (PBST) overnight at 4°C. The following primary antibodies were used: rabbit anti-VEGF (Abcam, ab46154), anti-VEGF receptor 1 (Abcam, ab32152), anti-VEGF receptor 2 (Cell Signaling Technology, CS2479s), anti-phosphorylated VEGF receptor 2 (Abcam, ab5473), and anti-β actin (Sigma, A-5441). Anti-mouse IgG-HRP and anti-rabbit IgG-HRP (CS7076 and CS 7054, Cell Signaling Technology) were used as secondary antibodies. Blots were washed in PBST and incubated with the HRP-conjugated antibody (1:2000) in PBST for 1 h at room temperature (or TBST for p-VEGFR2). Blots were developed by enhanced chemiluminescence (GE Healthcare ECL Plus Western Blotting Detection Reagents, RPN2132) and imaged with a Gel Doc XR camera (Bio-Rad). Densitometric scanning of the films was performed under linear exposure conditions with Quantity One software (Bio-Rad) or ImageJ. Levels of VEGF and its receptors in each hemisphere were first normalized to the levels of the loading control (β actin) and then calculated as fold change of peri-infarct/contralateral.
Immunohistochemistry.
One, 3, 7, or 28 d following stroke, mice were given an overdose of sodium pentobarbital and transcardially perfused with PBS. Brains were removed and frozen at −80°C overnight and sectioned at 25 μm on a Leica CM1850 cryostat. Tissue mounted onto slides was briefly fixed in 4% PFA in PBS (5 min), washed with PBS, and then incubated overnight with anti-VEGF receptor 2 (Cell Signaling Technology, CS2479s) diluted 1:250 in 0.1 m PBS containing 0.2% Triton X-100. Slides were washed in PBS and then incubated in secondary antibody (Cy5 conjugated anti-rabbit IgG, 1:400, Invitrogen) for 4 h followed by double labeling with Alexa-488-isolectin B4 (1:400, Invitrogen) overnight. Sections were imaged using an Olympus confocal microscope with a 10× objective (NA = 0.40). Fluorophores (Cy5 and AlexaFluor-488) were excited with 615 and 488 nm lasers, respectively, and a pixel dwell time of 8.0 μs/pixel. Image stacks were collected in 2 μm Z-steps at a resolution of 0.828 μm/pixel. For quantification, 10 planar images were Z projected (maximum intensity) and Gaussian filtered. VEGF-R2 labeled vessels in the peri-infarct region (<250 μm from the infarct border) were manually thresholded in a blinded manner using the isolectin B4 signal as a guide to identify vascular VEGF-R2 expression and reported as percentage of area.
For confirmation of vascular specificity of Cre expression, Tie2-Cre-ERT2 mice were bred with Ai9 tdTomato reporter mice and offspring were administered 75 mg/kg tamoxifen (i.p.) for 3 d. PFA-fixed brains were sectioned at 50 μm and incubated overnight in anti-Cre primary antibody (Covance, MMS-106) diluted 1:1000 in 0.1 m PBS containing 0.2% Triton X-100. Sections were washed in PBS and then incubated in secondary antibody (AlexFlour-488 conjugated anti-mouse IgG, 1:400, Invitrogen) for 4 h. Fluorophores (tdTomato and AlexaFluor-488) were imaged using an Olympus confocal microscope with a 20× objective (NA = 0.75).
Dendritic spine density.
After 1 week recovery from stroke, diabetic or nondiabetic YFP-H or Tie2-Cre ERT2/VEGF-R2flx/+ mice were overdosed, perfused with PBS and 4% PFA, and brains were immersion fixed for 24 h at 4°C. Brain sections were cut at 50 or 70 μm on a vibratome in the coronal plane. Two to 3 weeks before induction of stroke and administration of tamoxifen, Tie2-Cre ERT2/VEGF-R2flx/+ (n = 3 per group) mice received three microinjections (2 ipsilateral, 1 contralateral) of 0.8 μl of AAV-CAG-GFP (Vector Laboratories, 7072; diluted 1/40 from stock) in filtered PBS at a cortical depth of −700 μm to fluorescently label layer 5 pyramidal neurons. Using an Olympus confocal microscope, low-magnification (10×, NA = 0.40) images were first taken to identify the infarct border. The apical dendrites of layer 5 YFP or GFP-labeled neurons were identified and targeted for higher magnification imaging (see Fig. 8B). Only the primary apical dendrites located within layers 2/3 were chosen for imaging and analysis because previous studies have shown that these circuits undergo extensive structural and functional remodeling after stroke (Brown et al., 2007, 2009). High-resolution 1024 × 1024 image stacks (0.103 μm/pixel; 0.5 μm Z-steps) were collected with a 60× oil objective (NA = 1.35) using a 488 nm laser to excite YFP or GFP. Laser power was manually adjusted to prevent saturation of pixel intensity values in the dendritic shaft. Spine counting was performed manually with ImageJ and blind to experimental condition. A minimum of 800 spines were counted per hemisphere for each animal. To normalize variable fluorescence levels between different neurons, the grayscale of each image was adjusted to 40% of the maximum pixel intensity of the dendritic shaft. For a protrusion to be counted as a spine, it must have been clearly visible and project at least 0.4 μm (4 pixels) from the dendritic shaft. Because morphological features of spines (e.g., neck width) could not be spatially resolved with our imaging technique, all dendritic protrusions were counted as spines.
Figure 8.

Inhibiting VEGF-R2 signaling mitigates excessive spine loss in peri-infarct cortex in diabetic mice. A, Experimental timeline. Mice received SU5416 injections 2.5 d after stroke and every 3 d afterward for 6 weeks. B, Confocal image of peri-infarct cortex showing Evans blue-filled vessels (red) and YFP-labeled neurons (green). Spines on the apical dendrites of layer 5 neurons in superficial peri-infarct cortex were imaged and analyzed 1 week after stroke. Scale bar, 10 μm. C, Representative examples of dendritic spines in the peri-infarct cortex. Images outlined in blue represent nondiabetic; images outlined in red represent diabetic. Scale bar, 5 μm. D, Spine density plotted as function of distance from the infarct border. Spine densities return to normal >300 μm from the infarct border. E, Quantification of spine density in peri-infarct cortex 7 d after stroke. Diabetes leads to greater spine loss after stroke (in vehicle-treated mice), which can be prevented with SU5416 or vascular specific knockdown of VEGF-R2 (red hatched bars) (n = 3–9 mice per group). *p < 0.05. **p < 0.01. n.s., Not significant.
Measurement of infarct volume.
Fixed brain sections (100 μm thick) were mounted onto charged slides and stained with 0.0001% Fluoro-Jade C (Millipore) or cresyl violet, as previously described (Türeyen et al., 2004; Schmued et al., 2005) to detect ischemic cell death. Images were collected using a 4× objective (NA = 0.13) and a GFP excitation/emission filter set or with bright-field illumination on a BX-51 Olympus microscope. Using ImageJ software, the infarct region was identified by the absence of cresyl violet staining or dense Fluoro-Jade C labeling and outlined in each section by an observer blind to condition. Infarct volume was calculated by multiplying the infarct area in each section by the distance between each section. Because there was no difference in infarct volumes measured by Fluoro-Jade C and cresyl violet (F(9,45) = 0.3412, p = 0.9560), only values obtained with cresyl violet are presented. An a priori power analysis based on a previous studies indicated that a minimum sample size of five mice per group was necessary to detect significant differences in infarct size at 80% power with an α level of 0.05 (Clarkson et al., 2011; Seto et al., 2014).
Electron microscopy.
Animals were lightly anesthetized with isoflurane and given an i.v. injection of either 0.2 ml of 5 nm gold particle solution (5%) in dH2O (AC Diagnostics) and/or 2 mg/g HRP (Type 2, Sigma). After 60 min of circulation, mice were deeply anesthetized and perfused transcardially with heparinized PBS (Sigma-Aldrich) and then 3.2% PFA in PBS. Brains were extracted and fixed for 5 h on ice and then vibratome sectioned at 150 μm. Regions of peri-infarct HRP extravasation were visualized by reacting sections with a chromagen solution (0.2 mg/ml DAB, 0.01% H2O2) for 5 min. Peri-infarct regions were microdissected into 1 × 1 mm sections. For morphological evaluation of tight junctions, samples were postfixed in 1% osmium tetroxide and 1% potassium ferrocyanide in 0.15 m Na-cacodylate buffer for 4 h, rinsed in dH2O, and then en bloc stained in 2% uranyl acetate (aq) for 4 h. Sections were washed with dH2O and dehydrated with ascending ethanols to 100%. For HRP extravasation experiments, sections were washed with dH2O and dehydrated with ascending ethanols without postfixation with osmium. Tissue blocks were infiltrated with Spurr's low-viscosity embedding resin (Electron Microscopy Sciences) overnight, embedded in capsules, and polymerized overnight at 65°C. Tissue blocks were sectioned at 70 nm thickness with a diamond knife (Diatome) on an Ultracut E ultramicrotome and collected on 200 hex mesh copper grids. For morphological analysis of tissue, sections were poststained with 0.5% lead citrate (aq) for 5 min to increase contrast. The HRP-developed sections were poststained for 10 min in 2% uranyl acetate (aq). Only blocks with the infarct border clearly visible and an additional border to determine cortical depth (pia mater or corpus callosum) with several suitable capillaries were analyzed. The criteria for including capillaries in the analysis were as follows: (1) they were not collapsed or contained a red blood cell, (2) they were cut in cross section, (3) they were <10 μm in diameter, (4) they were 50–500 μm from infarct border and 200–800 μm below pial surface, and (5) they did not contain an endothelial nucleus in the vessel cross-section. Sections were observed on a JEOL 1400 transmission electron microscope equipped with a Gatan SC-1000 digital camera. In total, 24 peri-infarct capillaries were examined for TJ integrity (plus 18 contralateral) and 20 peri-infarct capillaries for HRP extravasation (plus 11 contralateral). Assessments of tight junctional integrity were performed by an observer blinded to condition and using high-magnification images of the tight junctions (80,000–100,000 magnification, 0.6 nm/pixel to 0.5 nm/pixel).
Behavioral assessment of forepaw sensorimotor function.
The adhesive tape removal and horizontal ladder tests are highly sensitive for detecting damage-related changes in sensory and/or motor function of the forepaw (Shanina et al., 2006; Tennant and Jones, 2009; Sweetnam et al., 2012). Behavioral tests were administered at weekly intervals for 2 weeks before stroke and 10 weeks afterward. For the tape removal test, a circular piece of tape (5 mm diameter) was adhered to the palmar surface of each forepaw. Mice were then placed in a glass cylinder and filmed for 120 s. This was repeated three times per testing session, and the time taken to remove tape from each paw was scored. Sensorimotor function of the forepaw during locomotion was assessed by videotaping mice as they walked across an elevated 70-cm-long horizontal ladder that had rungs (1 mm diameter) randomly spaced 1 or 2 cm apart. A blind observer scored forepaw grasping of the rungs on a frame by frame basis using criteria similar to that of previous work (Farr et al., 2006; Sweetnam et al., 2012). Briefly, forepaw placements were scored as follows: (1) “correct” (forepaw placement centered on the rung), (2) “partial” (forepaw partially grasping rung or required a correction of the placement), or (3) “slip/miss.” Because of inherent variability in behavioral measurements, data for each mouse were averaged in 2 week bins.
Statistics.
Statistical analysis of the data was conducted in GraphPad Prism 5. Two-way ANOVA was conducted to analyze treatment effects on Evans blue dye extravasation at each cortical depth. A one-way ANOVA was used to examine group differences in blood glucose levels and spine density. Corrected independent sample t tests were used to follow up significant ANOVAs. Planned independent samples t tests were used to assess group differences in protein expression or VEGF-R2 immunohistochemical labeling of vessels. p values ≤ 0.05 were considered statistically significant for all ANOVAs. For adhesive tape test and horizontal ladder test, repeated-measures ANOVA were used, taking each paw into account separately, as well as individual analyses for correct and partial placements. Data are presented as mean ± SEM.
Results
Animal model of diabetes and ischemic stroke
To evaluate the effects of chronic hyperglycemia on BBB integrity after stroke (Fig. 1A), mice were subjected to photothrombotic stroke in the right primary forelimb somatosensory cortex 4 weeks after STZ (diabetic) or vehicle (nondiabetic) injection. Mice injected with STZ had significantly elevated blood glucose levels (Fig. 1B; p < 0.001 for all comparisons) and lower body weight (Fig. 1C; t(30) = 3.142, p = 0.0038) than nondiabetic controls. The mortality rate for all experiments and groups was 5.8%.
Figure 1.
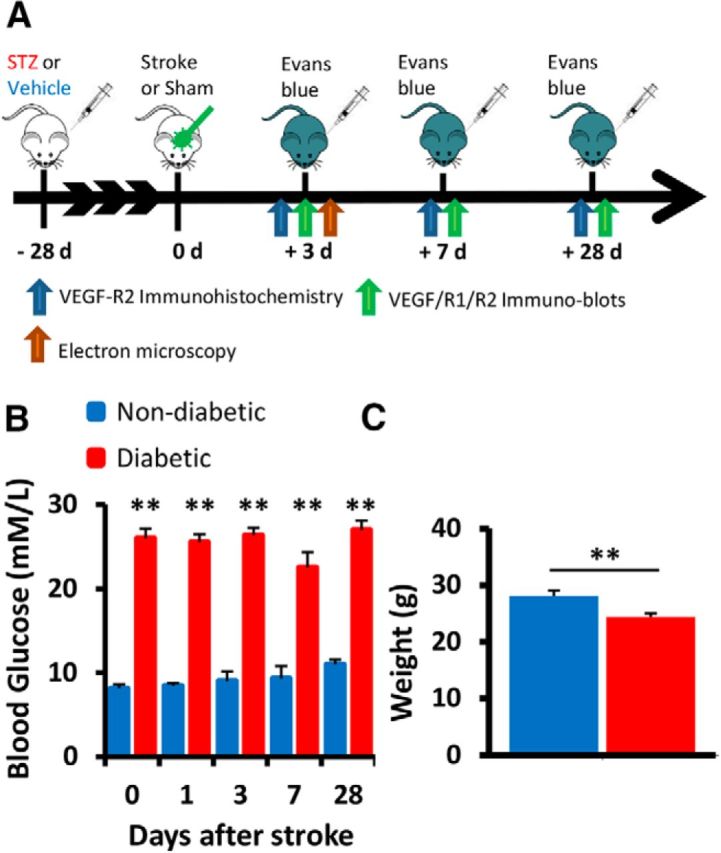
Experimental outline. A, Timeline of experiments assessing the effect of diabetes on cerebrovascular integrity following stroke. B, Average fasted blood glucose (mm/L) for each experimental group at each time point. C, Mouse body weight (grams) in each group averaged across all time points. **p < 0.01.
Aberrant expression of VEGFR2 in the diabetic peri-infarct cortex
To determine whether hyperglycemia altered VEGF signaling after stroke, Western blots were used to measure protein levels in the peri-infarct cortex at 3, 7, and 28 d recovery. Because we did not detect any differences in protein expression between sham stroke mice and the undamaged contralateral hemisphere (p > 0.05 for all comparisons), protein levels were first normalized to β-actin and then a ratio was calculated with peri-infarct cortex/contralateral hemisphere. At 3, 7, or 28 d after stroke, there was no change in VEGF or VEGF-R1 protein expression in the peri-infarct cortex relative to the contralateral control hemisphere in either nondiabetic or diabetic mice (p > 0.05 for all comparisons; Fig. 2A). However, VEGF-R2 expression in the peri-infarct cortex was significantly increased (relative to the contralateral hemisphere) in both nondiabetic and diabetic mice (Fig. 2A). In particular, diabetic mice exhibited significantly greater VEGF-R2 expression in the peri-infarct cortex than nondiabetic mice at 3 d (t(8) = 3.403, p = 0.0093) and 28 d (t(12) = 2.775, p = 0.017) of stroke recovery (Fig. 2A). Immunohistochemical staining revealed that VEGF-R2 (unlike VEGF-R1, data not shown) was highly expressed in peri-infarct regions compared with the opposite control hemisphere (compare Fig. 2B,C) and colocalized with isolectin B4-labeled vessels (Fig. 2D). Analysis of VEGF-R2-labeled vessels indicated a general trend for higher expression levels in diabetic mice, which peaked 3 d after stroke and progressively declined over the 28 d recovery period (Fig. 2E). Interestingly, we found very little expression in peri-infarct regions 1 d after stroke, suggesting that any role VEGF-R2 signaling plays in BBB permeability likely occurs at later time points (e.g., ≥3 d recovery). These results show that hyperglycemia amplifies the upregulation of VEGF-R2 expression on peri-infarct blood vessels after stroke.
Figure 2.
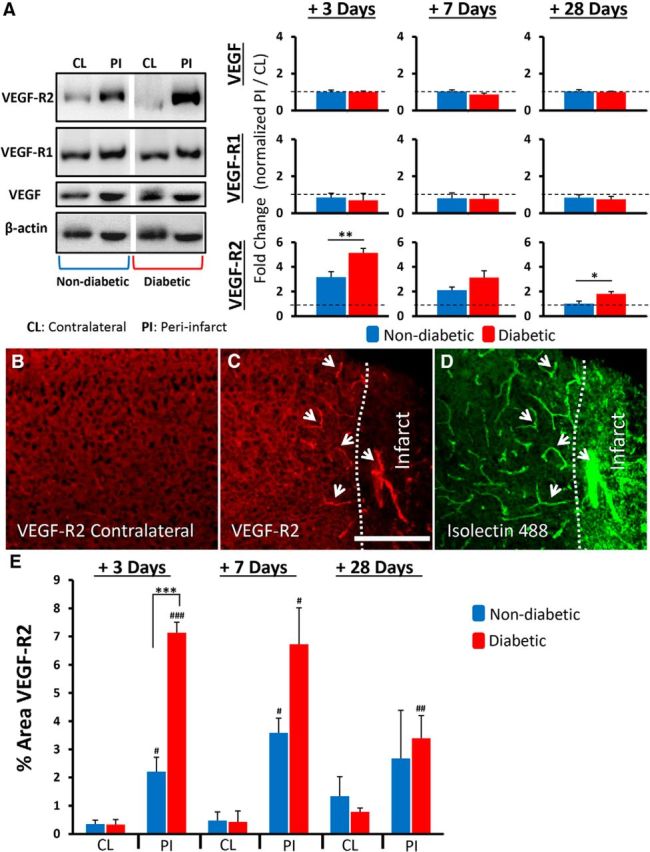
Diabetes amplifies the upregulation of VEGF-R2 after stroke. A, Representative Western blot (cropped) from tissue 3 d after stroke and quantification of VEGF and its receptors 3, 7, and 28 d after stroke in peri-infarct (PI) cortex (normalized to β-actin) relative to undamaged contralateral (CL) hemisphere (normalized to β-actin) (n = 5–7 mice per group). Immunohistochemical staining for VEGF-R2 in the contralateral hemisphere (B) and peri-infarct cortex (C). VEGF-R2 expression colocalizes with isolectin B4-labeled vessels in the peri-infarct cortex (D, see white arrows). Scale bar, 200 μm. E, Quantification of VEGF-R2 expression in peri-infarct or contralateral cortex (n = 4–6 mice per group). *p < 0.05, comparing nondiabetics with diabetics. **p < 0.01, comparing nondiabetics with diabetics. ***p < 0.0001, comparing nondiabetics with diabetics. #p < 0.05, comparing contralateral with peri-infarct.##p < 0.01, comparing contralateral with peri-infarct.###p < 0.001, comparing contralateral with peri-infarct.
Diabetes exacerbates blood–brain barrier disruption after stroke
Because VEGF is a potent inducer of vascular permeability under ischemic conditions, we next quantified changes in the integrity of the BBB at different epochs of stroke recovery (3, 7, and 28 d) using Evans blue dye (Wolman et al., 1981). As expected in both diabetic and nondiabetic mice, Evans blue was largely confined to the vasculature in the nonischemic contralateral hemisphere (Fig. 3A, left) or in both hemispheres of sham stroke controls. Of the little dye that was detected in extravascular spaces in the nonischemic hemisphere, we did not detect any significant differences between groups at any time point (F(7,35) = 1.159, p = 0.357). In the ischemic hemisphere, Evans blue was easily detected in extravascular spaces in both groups, especially peri-infarct cortical regions proximal to the ischemic border (Fig. 3A, right). To understand the spatial breadth of dye extravasation, we quantified extravascular fluorescence both as a function of distance from the infarct border and depth from the cortical surface (Fig. 3B). At 3 d, but not 7 or 28 d recovery, our statistical analysis revealed a significant interaction between experimental group and dye extravasation as a function of distance at each cortical depth (p < 0.001 for each depth). As shown in Figure 3A, C, diabetic mice exhibited significantly greater dye extravasation in superficial, middle, and deep layers of the peri-infarct cortex at 3 d recovery (main effect of diabetes: superficial F(1,64) = 38.95, p < 0.0001, middle F(1,64) = 57.72, p < 0.0001, deep F(1,64) = 83.62, p < 0.0001). At all three depths, dye extravasation decreased as a function of distance from the infarct border (main effect of distance: superficial F(7,64) = 38.94, p < 0.0001, middle F(7,64) = 9.22, p < 0.0001, deep F(7,64) = 16.46, p < 0.0001). A subset of diabetic mice were treated with insulin to determine whether controlling blood glucose levels immediately after stroke would prevent excessive BBB permeability (blood glucose before vs after insulin: 24.10 ± 4.1 mm/L vs 7.113 ± 1.5 mm/L, t(11) = 4.566, p = 0.008). However, insulin treatment did not reduce BBB permeability 3 d after stroke as insulin treated diabetics had significantly greater dye extravasation compared with nondiabetics (superficial F(1,56) = 172.6, p < 0.0001, middle F(1,56) = 95.18, p < 0.0001, deep F(1,56) = 42.93, p < 0.0001).
Seven and 28 d following stroke (Fig. 3C), the BBB was still permeable at all three depths in peri-infarct cortex (main effect of distance: superficial F(7,39) = 7.48, p < 0.001, middle F(7,39) = 6.94, p < 0.001, deep F(7,39) = 7.24, p < 0.001), but only within 200 μm of the infarct border. At these later time points, peri-infarct dye extravasation was relatively equal between nondiabetic and diabetic mice (p values >0.05).
Because angiogenesis has been reported following stroke (Prakash et al., 2013; Ergul et al., 2014) and newly formed blood vessels lack a fully developed BBB (Rigau et al., 2007), we then examined vascular branching density (a surrogate measure of angiogenesis) in peri-infarct cortex (Fig. 4A) where considerable BBB permeability was observed. In general, branching density in the control contralateral hemisphere was slightly increased but not significantly in diabetic relative to nondiabetic mice (t(5) = 2.15, p = 0.08). Stroke tended to reduce branching density in peri-infarct cortex (Fig. 4B), although these trends did not reach statistical significance for both nondiabetic (F(3,25) = 0.9717, p = 0.42) and diabetic mice (F(3,27) = 2.761, p = 0.06). Consistent with previous data (Mostany et al., 2010; Tennant and Brown, 2013), this suggests that increased permeability to Evans blue dye in the diabetic peri-infarct cortex is not due to excessive sprouting of new vessels after stroke.
Figure 4.
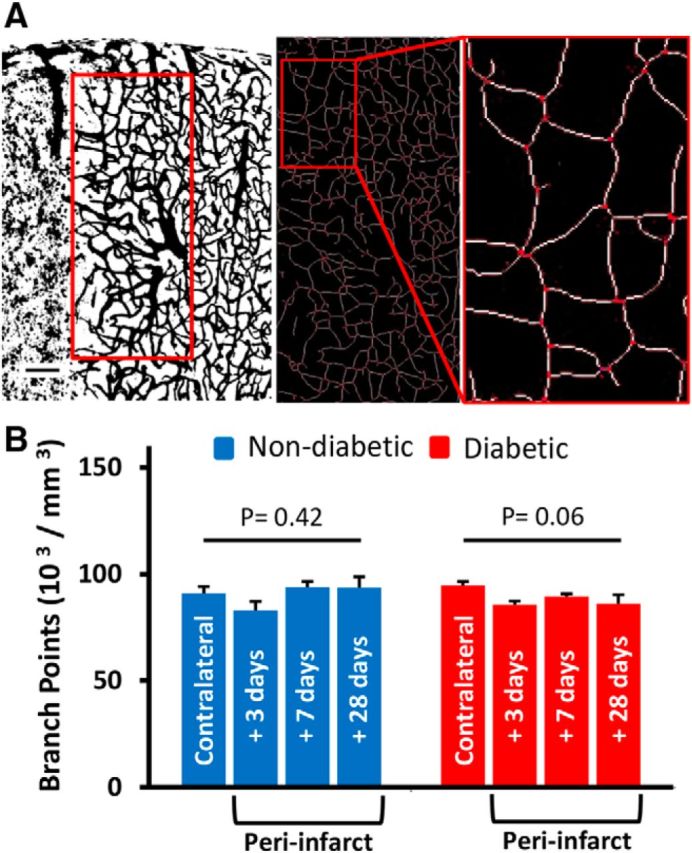
Excessive BBB permeability in diabetic mice is not related to peri-infarct angiogenesis. A, Representative example of the peri-infarct region where vessel branching density was quantified (red box, 400 × 800 μm). Scale bar, 100 μm. Inset, Skeletonized vessels and examples of identified branching points in red. B, Branching points (per mm3) showed that there was no significant change in the peri-infarct cortex compared with the contralateral hemisphere, although there was a trend toward lower branching density in diabetics after stroke.
Loss of BBB integrity is mediated primarily by an increase in endothelial transcytosis
Loss of BBB integrity after stroke can occur through several distinct mechanisms. For example, some studies have suggested that endothelial cells lose the tight junction complexes that normally prevent paracellular movement between cells (Fischer et al., 2002; Willis et al., 2010), whereas others indicate that tight junctions remain intact (Krueger et al., 2013). To elucidate possible cellular mechanisms for BBB disruption, we imaged the ultrastructure of microvessels (<10 μm diameter) in the peri-infarct cortex 3 d after stroke (Fig. 5A). In the contralateral control hemisphere (Fig. 5B), microvessels appeared normal, with intact tight junctions (Fig. 5B, inset, arrowhead) and a generally thin endothelium with few vesicular/vacuolar compartments in the cytoplasm. In the peri-infarct cortex, endothelial tight junctions were generally intact for both nondiabetic and diabetic mice (Fig. 5C, inset, arrowheads; N = 4 mice, 24 vessels ranging from 50 to 500 μm from infarct border). To account for the possibility that BBB permeability occurred through transient openings of tight junctions rather than full disassembly, we intravenously injected 5 nm colloidal gold (in saline) 1 h before death. However, in all vessels examined, we did not detect any gold particles trapped within tight junction structures.
Figure 5.

Loss of BBB integrity at 3 d is due primarily to increased transcytosis and not tight junctional complex disassembly. A, Representative toluidine blue-stained section of embedded tissue. Scale bar, 250 μm. Inset, Example of peri-infarct capillaries (arrowheads) suitable for electron microscopy. Scale bars: middle, 100 μm; right, 10 μm. B, Electron micrograph showing a capillary in the undamaged contralateral hemisphere of a nondiabetic mouse, 3 d after stroke. Inset, Intact tight junctions (arrowhead) and generally thin endothelium. Scale bar, 2 μm. C, Peri-infarct capillary 3 d after stroke. Insets, Tight junctions of the capillary are intact (arrowheads). Scale bar, 2 μm. D, Peri-infarct capillary 3 d after stroke. Inset, Thickened endothelium and large increase in caveolae-like vesicles. Scale bar, 2 μm. E, Bright-field image of coronal section from HRP-injected mouse, reacted with 3,3′ diaminobenzidine, generating electron dense brown reaction product around the infarct. Scale bar, 1.0 mm. F, Capillary in the contralateral control hemisphere showing little HRP staining 3 d after stroke. G, H, Representative electron micrographs showing increased HRP reaction product in the endothelium of capillaries in the peri-infarct cortex of nondiabetic and diabetic mice. Scale bar: F–H, 0.5 μm. I, Diabetic peri-infarct capillary 3 d after stroke and higher-magnification image of boxed region showing 5 nm gold particles (arrows) present in vesicles within the endothelium, basement membrane (BM), and adjacent glial cells. Scale bar, 1 μm. Scale bar: inset, 100 nm.
One clue regarding the mechanism of dye extravasation was that endothelial cells in peri-infarct microvessels appeared swollen with a marked increase in caveolae-like vesicles, sometimes forming an assembly line from luminal to abluminal sides of the endothelium (Fig. 5D). To test the hypothesis that BBB disruption could be mediated by an increase in endothelial transcytosis, we imaged peri-infarct vessels reacted for HRP (2 mg/g, i.v.). HRP is widely used for imaging the ultrastructure of the BBB because it binds albumin, is taken up by transcytotic vesicles, and easily forms an electron dense precipitate (Fig. 5E) when reacted with DAB (Villegas and Broadwell, 1993; Banks and Broadwell, 1994). In the contralateral control hemisphere (Fig. 5E,F), relatively little HRP was detected within the vascular endothelium and beyond. By contrast, there was a profound increase in the amount of blood-borne HRP detected within peri-infarct vascular endothelial cells (Fig. 5G), especially for diabetic mice (Fig. 5H). To confirm that this enhanced transcytotic transport was not specific to just albumin transport, we injected 5 nm colloid gold with the HRP (Fig. 5I). Colloidal gold was easily detected alongside HRP within vesicles (Fig. 5I, arrows); and importantly, gold was found both within the endothelium, underlying basement membrane, adjacent glial cells, and undefined extravascular tissue (Fig. 5I, arrows). These experiments reveal that enhanced BBB permeability in mice 3 d after stroke was associated with an increase in endothelial transcytosis without ultrastructural evidence for widespread opening of tight junctions.
Inhibition of VEGF-R2 signaling attenuates stroke induced BBB permeability in diabetic animals
To directly assess the role of VEGF-R2 in vascular permeability after stroke, we crossed tamoxifen-inducible Tie2-Cre mice (Forde et al., 2002) with a floxed VEGF-R2 mouse line (Hooper et al., 2009). The resulting Tie2-Cre ERT2/VEGF-R2flx/+ mice allowed us to specifically reduce VEGF-R2 expression in the vasculature of adult mice, avoiding the complications of embryonic knock down. As shown in Figure 6A, we first confirmed both the vascular specificity of Cre expression with immunohistochemistry and that our tamoxifen dosing regimen was sufficient to induce Cre recombinase activity using a floxed tdTomato reporter (Madisen et al., 2010). We then confirmed through Western blots that tamoxifen administration significantly reduced VEGF-R2 protein expression in the peri-infarct cortex after stroke (Fig. 6B; t(4) = 3.09, p = 0.037). Vascular-specific knockdown of VEGF-R2 significantly reduced Evans blue extravasation in diabetic mice (Fig. 6E,F; F(1,64) = 33.00, p < 0.0001) but, surprisingly, increased BBB permeability in nondiabetic mice (Fig. 6F; F(1,56) = 19.06, p < 0.0001).
Figure 6.
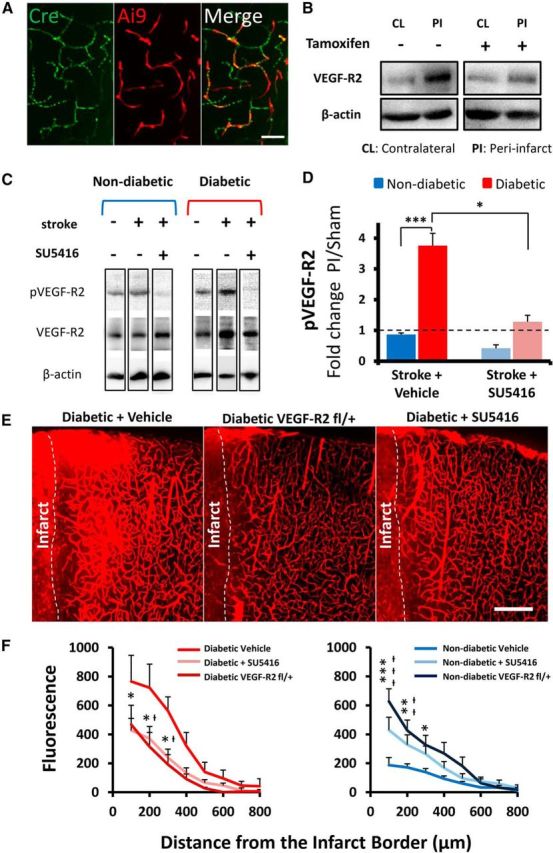
Inhibiting VEGF-R2 signaling attenuates stroke-induced BBB permeability in diabetic mice. A, Immunohistochemical staining for Cre enzyme and tamoxifen induced tdTomato expression in the cortical vasculature. Scale bar, 50 μm. B, Representative Western blots showing VEGF-R2 levels 3 d after stroke in tamoxifen or vehicle-injected Tie2-Cre-ERT2/VEGF-R2fl/+ mice. VEGF-R2 expression in peri-infarct cortex is reduced in tamoxifen-treated Tie2-Cre-ERT2/VEGF-R2fl/+ mice. C, Representative Western blots (cropped) showing that a single injection of SU5416 (50 mg/kg) reduces the expression of phosphorylated VEGF-R2 (pVEGF-R2) in peri-infarct cortex 3 d after stroke. D, Quantification of pVEGF-R2 levels 3 d after stroke in SU5416- or vehicle-injected nondiabetic and diabetic mice. Stroke leads to a significant elevation in pVEGF-R2 expression levels in vehicle-injected diabetic mice, which can be reversed with SU5416 (n = 3–5 mice per group). *p < 0.05. ***p < 0.001. E, Representative confocal images showing greater extravasation of Evans blue dye in vehicle-treated diabetic mice compared with tamoxifen-injected VEGF-R2fl/+ or those injected with SU5416. Scale bars, 200 μm. F, Plots represent normalized extravascular dye fluorescence for vehicle, Tie2-Cre-ERT2/VEGF-R2fl/+ mice or SU5416-treated diabetic and nondiabetic mice (n = 4–7 mice per group). Vehicle to SU5416-treated: *p < 0.05; **p < 0.01; ***p < 0.001. Vehicle to VEG F-R2fl/+: †p < 0.05; ††p < 0.01; †††p < 0.001.
Because a Cre-lox approach is not well suited for translation to the clinic, we then determined whether pharmacological inhibition of VEGF-R2 with a clinically tested and safe drug (SU5416) could ameliorate BBB disruption. SU5416 is well known to inhibit VEGF-R2-dependent tyrosine kinase auto-phosphorylation (Fong et al., 1999; Mendel et al., 2000), is capable of crossing the BBB, and has a relatively long half-life of 72 h (Giles et al., 2003), thereby making it well suited as a stroke therapy. As shown in Figure 6C, stroke (with vehicle infusion) induced a significant increase in phosphorylated VEGF-R2 (pVEGF-R2) expression in peri-infarct cortex at 3 d recovery (t(3) = 3.162, p = 0.05). In accordance with our previous protein quantification experiments, diabetes was associated with significantly greater expression of pVEGF-R2 in peri-infarct cortex relative to nondiabetic mice (Fig. 6C,D; t(6) = 5.52, p = 0.0015). A single dose of 50 mg/kg SU5416 (s.c.) was sufficient to significantly reduce the expression of pVEGF-R2 in diabetic peri-infarct cortex (Fig. 6C,D; t(5) = 2.78, p = 0.039). This reduction in pVEGF-R2 signaling with SU5416 treatment was accompanied by a significant reduction in the extravasation of Evans blue dye in the peri-infarct cortex of diabetic mice (Fig. 6E,F; F(1,88) = 13.85, p = 0.0003). Consistent with our inducible VEGF-R2 knockdown experiments, SU5416 treatment exacerbated BBB permeability in nondiabetic mice (Fig. 6F; F(1,88) = 12.37, p = 0.0007). There were no significant differences in infarct volume between SU5416 or vehicle treatment groups (Fig. 7A,B; F(3,17) = 0.04, p = 0.989). This argues against the possibility that reduced BBB permeability in SU5416-treated diabetic mice was secondary to a reduction in ischemic cell death in the infarct core. It should be noted that SU5416 does have some off target effects, notably modulation of the immune system (Mezrich et al., 2012), which may also play a role in vascular permeability. However, the strikingly similar results yielded with SU5416 to that with genetic knockdown of VEGF-R2 suggests that SU5416 improves BBB integrity primarily through attenuation of VEGF-R2 signaling.
Figure 7.

SU5416 treatment does not affect infarct volume. A, Representative series of coronal brain sections (300 μm apart) stained with cresyl violet 3 d after stroke. Scale bar, 1.0 mm. B, No differences in infarct volume (mm3) for vehicle or SU5416-treated nondiabetic or diabetic mice 3 d after stroke (n = 5–7 mice per group).
VEGF-R2 inhibition in diabetic mice prevents dendritic spine loss and improves functional recovery after stroke
We hypothesized that impaired functional recovery in diabetic mice (Sweetnam et al., 2012) could be mediated, in part, by the excessive VEGF-R2-dependent disruption of BBB and resultant damage to neighboring neural circuits after stroke. Therefore, nondiabetic and diabetic mice were treated with SU5416 (50 mg/kg) or vehicle beginning 2.5 d after stroke (Fig. 8A). This relatively late intervention time was selected because our Western blot, immunohistochemistry, and Evans blue experiments suggested that the BBB at 2.5–3 d recovery would be particularly sensitive to VEGF-R2 inhibition. To assess synaptic damage after stroke, we quantified dendritic spine density in layer 2/3 in sham operates or the peri-infarct cortex (Fig. 8B,C) at 7 d recovery when previous stroke studies have reported significant spine loss (Brown et al., 2007, 2009). For mice subjected to sham stroke surgery, we did not find a significant difference in spine density between nondiabetic and diabetic mice (9.95 ± 0.3 vs 8.91 ± 0.4 spines/10 μm; t(7) = 1.96, p = 0.09). Further, we did not find any difference in spine density between sham operates and the hemisphere contralateral to stroke (p > 0.05 for comparisons in diabetic and nondiabetic mice). In stroke-affected mice, we first examined spine density as a function of distance from the infarct border and found a significant effect of distance (Fig. 8D; nondiabetic R2 = 0.3897, p < 0.001; diabetic R2 = 0.3593, p < 0.001). Spine loss was most evident within a 300-μm-wide zone adjacent to the infarct; therefore, subsequent analyses were restricted to this particular peri-infarct zone. As expected, stroke in vehicle-treated mice was associated with a significant loss of dendritic spines (Fig. 8C,E) in both nondiabetic (t(11) = 2.513, p = 0.029) and diabetic mice t(10) = 4.042, p = 0.0025). In accordance with the idea that increased BBB permeability could exacerbate synaptic damage, vehicle-injected diabetic mice had significantly lower spine density after stroke than vehicle-injected nondiabetic mice (Fig. 8C,E; t(14) = 3.584, p = 0.003). However, this excessive loss of spines could be mitigated with SU5416 treatment in diabetic mice (Fig. 8C,E; diabetic stroke vehicle = 6.44 ± 0.4 spines/10 μm vs SU5416 = 8.35 ± 0.8 spines/10 μm, t(10) = 2.267, p = 0.0047). We also noted that SU5416 treatment in mice not subjected to stroke (i.e., shams) had no effect on spine density (nondiabetic: t(5) = 1.893, p = 0.117, diabetic: t(7) = 0.200, p = 0.847). Because, as mentioned previously, SU5416 may have off-target effects that could influence spine density, we assessed spine density in mice with vessel-specific knockdown of VEGF-R2 (Fig. 8E). Spine density in the contralateral control hemisphere of tamoxifen-treated nondiabetic and diabetic Tie2-Cre ERT2/VEGF-R2flx/+ mice was not significantly different from the spine density reported in nondiabetic (t(3) = 1.736, p = 0.18) or diabetic (t(6) = 2.179, p = 0.07) YFP-H line shams. This result confirmed that our viral labeling approach did not lead to significantly different spine densities in the absence of stroke. Spine density in the peri-infarct cortex of nondiabetic Tie2-Cre ERT2/VEGF-R2flx/+ mice was significantly reduced compared with the contralateral control hemisphere (t(3) = 3.309, p = 0.04). Furthermore, spine density in the peri-infarct cortex of nondiabetic Tie2-Cre ERT2/VEGF-R2flx/+ mice was indistinguishable from those of the nondiabetic mice treated with SU5416 (t(5) = 0.4031, p = 0.7). In the peri-infarct cortex of diabetic Tie2-Cre ERT2/VEGF-R2flx/+ mice, spine densities were not significantly different from the contralateral control hemisphere (t(4) = 0.84, p = 0.44) or SU5416 treated diabetic mice (t(6) = 1.272, p = 0.25). Therefore, in line with our BBB permeability results, we have further confirmed that inhibition of VEGF-R2 activation after stroke prevents spine loss in the diabetic peri-infarct cortex but failed to improve spine loss in nondiabetics. These experiments reveal that excessive BBB permeability in diabetic mice exacerbates the loss of dendritic spines after stroke, which can be prevented by inhibiting VEGF-R2 signaling.
If SU5416 treatment can attenuate BBB permeability and spine loss in diabetic mice, does this translate into improved recovery of forepaw function? Our behavioral tests indicated that stroke induced a marked deficit in forepaw sensory function in all treatment groups, indicated by an increased latency to remove tape from the impaired (left) forepaw (Fig. 9A,B; F(5,200) = 10.074, p < 0.001). Consistent with previous work (Sweetnam et al., 2012), the left (stroke affected) paw of vehicle-injected diabetic mice was significantly more impaired than in nondiabetic mice (Fig. 9B; F(1,15) = 7.45, p < 0.05), especially from testing week 3 onwards. Treatment of diabetic mice with SU5416 for 6 weeks after stroke significantly improved paw function as noted by reduced tape removal latencies for the affected paw (Fig. 9B; F(1,17) = 5.11, p < 0.05) to levels that were comparable with vehicle-treated nondiabetic mice. Interestingly, the beneficial effects of VEGF-R2 inhibition were restricted to diabetic mice, as tape removal latencies in nondiabetic mice treated with SU5416 were similar to, or slightly worse than, their vehicle-injected counterparts (F(1,16) = 0.16, p = 0.69). In the right (unaffected) paw, tape removal latencies did not differ significantly between treatment groups (Fig. 9B; p > 0.05 for all comparisons). Testing of motor function of the forepaw with the horizontal ladder test revealed a stubborn and persistent motor deficit after stroke (Fig. 9C,D). This deficit was evident in all treatment groups (Fig. 9D) by a persistent significant decrease in the percentage of correct forepaw placements (F(5,200) = 81.107, p < 0.001) and an increase in partial (incorrect) placements (F(5,200) = 61.604, p < 0.001). SU5416 treatment had no effect on performance in this task in either diabetic or nondiabetic mice (diabetic state × treatment group × testing week interaction for correct placements: F(5,200) = 1.283, p = 0.273; partial placements: F(5,200) = 1.751, p = 0.125). In summary, SU5416 treatment was effective in promoting the recovery of sensory forepaw function, but only in diabetic mice.
Figure 9.

Inhibiting VEGF-R2 signaling improves functional recovery in diabetic mice. A, Sample image frames showing trial initiation and removal of adhesive tape from the forepaws (black arrow). B, Plots showing the change in time (Δ Latency) it took mice to remove adhesive tape from the left (impaired) and right (unimpaired) forepaw (n = 7–12 mice per group). BL, Baseline or prestroke tape removal latencies. C, Sample frames showing a correct and partial (incorrect) forepaw placement on the horizontal ladder. D, Histograms showing the percentage of correct or partial forepaw placements as a function of total steps taken. *p < 0.05, diabetic vehicle versus diabetic SU5416. †p < 0.05, diabetic vehicle versus nondiabetic vehicle. †† p < 0.01, diabetic vehicle versus nondiabetic vehicle.
Discussion
Ischemia is well known to promote VEGF signaling (Hermann and Zechariah, 2009). In nondiabetic animals, VEGF mRNA and protein expression peak in the ischemic hemisphere within 6–48 h after stroke and then decline thereafter (Marti et al., 2000; Zhang et al., 2002). On the other hand, VEGF-R2 follows a slightly different and more protracted course of expression that is maximal 2–14 d following stroke (Marti et al., 2000; Zhang et al., 2002). Our Western blot and VEGF-R2 immunohistochemistry data support these temporally distinct patterns of VEGF signaling after stroke. However, diabetes clearly alters the magnitude and duration of VEGF-R2 expression, and the consequences of this aberrant response are quite striking, with significant BBB permeability, dendritic spine loss, and poor functional outcome. Dysregulation of VEGF signaling in the vasculature of the eye, kidney, heart, and limbs of diabetics has been described (Vinik and Flemmer, 2002; Howangyin and Silvestre, 2014). In the brain, less is known, although there have been reports of abnormal VEGF expression in the hippocampus and cortex in rodent models of Type 2 diabetes (Prakash et al., 2012; Zhao et al., 2012). The reasons for this aberrant expression are unknown but could be a consequence of abnormal blood flow to the peri-infarct cortex (Tennant and Brown, 2013), inflammation (Kumari et al., 2007), or hypoxia-inducible transcription factors, which are known to regulate VEGF production and influence cell survival (Minchenko et al., 1994; Siddiq et al., 2009).
Delayed edema after an ischemic event is one of the most significant complications following a cerebrovascular insult (Schlaug et al., 1997; del Zoppo and Mabuchi, 2003; Heo et al., 2005). The loss of BBB integrity typically displays a multiphasic progression (Sandoval and Witt, 2008). Initial phases of permeability occur within the ischemic core over the course of minutes to several hours after occlusion, whereas a second distinct delayed phase occurs in the surviving peri-infarct cortex ∼48–72 h (Kuroiwa et al., 1985; Rosenberg et al., 1998; Knowland et al., 2014). Here we focused on the second phase of BBB permeability and found significantly greater extravasation of Evans blue dye in the peri-infarct cortex of diabetic animals. This finding is in agreement with studies showing that Type 1 or 2 diabetes, as well as acute hyperglycemia (induced with glucose injections), increased edema (Li et al., 2013) and the extravasation of HRP or blood-borne immunoglobulins following transient ischemia (Dietrich et al., 1993; Won et al., 2011; Ye et al., 2011). We also demonstrate that controlling blood glucose levels in diabetic mice immediately after stroke does not prevent or even reduce BBB permeability. The impact of insulin treatment on stroke recovery is an active area of investigation, but in general, there is not clear evidence showing that it improves stroke recovery in humans or animal models of diabetes (Baker et al., 2011; MacDougall and Muir, 2011; Ntaios et al., 2014).
The cellular underpinnings of BBB disruption after stroke have been hotly debated in recent years. The prevailing wisdom posits that openings of the BBB are due to dynamic changes in endothelial tight junctions (Sandoval and Witt, 2008). This hypothesis has been supported in biochemical and fluorescence imaging studies reporting changes to tight junction proteins after stroke (Fischer et al., 2002; Willis et al., 2010; Fernández-López et al., 2012; Knowland et al., 2014). However, this theory has been questioned in recent years as clear ultrastructural evidence of tight junction disassembly, at least in surviving peri-infarct tissues, has been sparse. In the present study, we show, using orthogonal approaches of albumin, HRP, and nanogold tracing followed by light and electron microscopy, that BBB permeability is mediated primarily through increased transcellular movement through endothelial vesicles and vacuoles. Indeed, we found little ultrastructural evidence of full tight junction disassembly in peri-infarct cortex, which is consistent with other electron microscopy studies (Lossinsky and Shivers, 2004; Jackman et al., 2013; Krueger et al., 2013). However, we cannot rule out a role for tight junctional disassembly based on our results alone. Because tight junction structure can be influenced by multiple experimental factors, especially the degree of reperfusion (Sandoval and Witt, 2008), discrepancies between studies may result from the different models used and/or regions of the brain examined. Furthermore, if the disassembly/opening of the tight junction is short lived (e.g., on the order of seconds), it is highly unlikely that single snap shot in time would catch this ephemeral event. A comprehensive ultrastructural study, likely involving serial sectioning and reconstruction of tight junctions in 3D, will be required to ultimately clarify the role of tight junctions in BBB breakdown after stroke.
The molecular mechanisms underlying the dismal prognosis for recovering function after stroke in diabetic humans and experimental animals are largely unknown. The findings of our preclinical study shed new light on this issue, suggesting that aberrant VEGF-R2 signaling with resultant BBB dysfunction and spine loss are important factors in dictating poor functional outcome. Indeed, VEGF-R2 expression was significantly increased on peri-infarct blood vessels in the same cortical region and time point (day 3) that we observed the enhanced BBB permeability. Loss of BBB integrity correlated with greater damage to fine synaptic structure in peri-infarct cortex, but not necessarily with larger cerebral infarcts. This finding is in agreement with recent studies showing that micro-hemorrhages can lead to neuronal dysfunction and spine loss without inducing widespread degeneration (Zhang and Murphy, 2007; Rosidi et al., 2011; Cianchetti et al., 2013).
Based on the spatial and temporal pattern of VEGF-R2 expression after stroke, we then showed with a VEGF-R2 inhibitor (SU5416) or vessel-specific knockdown that these approaches were sufficient to partially restore BBB integrity and prevent spine loss in peri-infarct cortex. One unexpected and unique finding was that the beneficial effects of VEGF-R2 inhibition were restricted to diabetic mice. This result highlights the enormous complexity of treating ischemic stroke, which preferentially affects people with various constellations of comorbid conditions, such as diabetes, hypertension, and hyperlipidemia. Why this same treatment would exacerbate BBB permeability and spine loss in nondiabetic mice is uncertain, but it may reflect the fact that too much or too little VEGF signaling can disrupt endothelial cell function and integrity (Lee et al., 2007; Hermann and Zechariah, 2009; Quaegebeur et al., 2011). Indeed, there have been reports that VEGF-R2 inhibitors can produce unwanted side effects, such as intracranial bleeds in humans (Giles et al., 2003; Kamba and McDonald, 2007; Eskens and Verweij, 2006), and can worsen ischemic injury in neonatal rats (Shimotake et al., 2010). These counterintuitive results likely reflect the significant differences in the intracellular signaling environment between euglycemic and hyperglycemic cells. VEGF-R2 signals are integrated into multiple downstream pathways, such as MAPK, PKC, RAGE, ERK, and JNK, most of which are perturbed in hyperglycemic animals (Haneda et al., 1995, 1997; Igarashi et al., 1999; Tomlinson, 1999; Purves et al., 2001). For example, hyperglycemia alters NO production and signaling (Pieper and Peltier, 1995; Pieper, 1997) and increases ROS production (Spitaler and Graier, 2002), which can amplify VEGF-R2 signaling in a VEGF-independent manner (Warren et al., 2014).
Our study has limitations that should be discussed. For example, most of our experiments focused on hyperglycemic mice that did not have blood sugars controlled with insulin. This is a potential problem because chronic hyperglycemia can generate (in some instances) a hyperosmotic syndrome that leads to confusion and diminished arousal. Although a concern, any mice with salient abnormal behaviors (e.g., reduced ambulation or labored breathing) were excluded from the study. One could also comment that our study would not directly model human diabetics that administer blood glucose-lowering therapies to control their symptoms. However, it is worth noting that a significant percentage of people are hyperglycemic but unaware of their condition or are aware but have poor glucose control (Go et al., 2014). Insulin treatment could significantly confound data interpretation because it is well known to stimulate vascular and neuronal growth (King et al., 1985; Chiu et al., 2008), independent of its effect on blood glucose levels. For these reasons, and the fact that insulin did not affect BBB permeability in diabetic mice 3 d after stroke, we focused on a simpler model of diabetes without insulin therapy.
No experimental model of stroke is perfect, and photothrombosis is no exception. We used this model because it allowed us to reliably generate focal infarcts in a specific cortical region in a relatively noninvasive manner. However, because photo-activation of Rose bengal dye leads to singlet oxygen production, which can induce endothelial damage and severe ischemia with little reperfusion (Watson et al., 1985), it may limit the generalizability of our findings. This may help explain why our study did not find convincing evidence for neovascularization when other studies, using different models of diabetes and stroke, have described new vessel growth and remodeling (Ergul et al., 2014). Although this is an issue that cannot be resolved without future study, we should note that the spatial and temporal expression of VEGF signaling proteins and BBB permeability described in our study fits well with previous studies using transient and permanent occlusion of the middle cerebral artery (Marti et al., 2000; Zhang et al., 2002; Krueger et al., 2013).
In conclusion, here we show that chronic hyperglycemia leads to aberrant expression of VEGF-R2 in vascular networks of the peri-infarct cortex, which previous studies have identified is an important site for recovery of function (Carmichael, 2006; Murphy and Corbett, 2009; Mostany et al., 2010). Diabetes exacerbated the opening of the BBB (≥3 d after stroke) in peri-infarct cortex in a VEGF-R2-dependent manner. Excess BBB permeability was mediated through increased endothelial transcytosis and induced greater loss of fine synaptic structure and persistent sensory impairments of the forepaw in diabetic mice. Notably, treating mice with a clinically tested drug to inhibit VEGF-R2 signaling (even when initiated 2.5 d after stroke) was sufficient to diminish BBB permeability, spine loss, and improve functional recovery, but only in diabetic mice. In conclusion, our data provide new mechanistic insights into cerebrovascular disruption and poor functional recovery from stroke in a mouse model of diabetes. Further, our findings emphasize the fact that stroke treatments should take a more individualistic approach where comorbid conditions are factored into the equation.
Footnotes
This work was supported by operating, salary, and equipment grants from CIHR, Heart and Stroke Foundation of British Columbia and Yukon to C.E.B., Michael Smith Foundation for Health Research, Natural Sciences and Engineering Research Council, and Canada Foundation for Innovation. We thank Charmaine Chang and Jarrett Moore for their assistance with experiments, and Drs. Jane Rossant and Andras Nagy for the floxed VEGF-R2 mice.
The authors declare no competing financial interests.
References
- Baker L, Juneja R, Bruno A. Management of hyperglycemia in acute ischemic stroke. Curr Treat Options Neurol. 2011;13:616–628. doi: 10.1007/s11940-011-0143-8. [DOI] [PubMed] [Google Scholar]
- Ballabh P, Braun A, Nedergaard M. The blood–brain barrier: an overview: structure, regulation, and clinical implications. Neurobiol Dis. 2004;16:1–13. doi: 10.1016/j.nbd.2003.12.016. [DOI] [PubMed] [Google Scholar]
- Banks WA, Broadwell RD. Blood to brain and brain to blood passage of native horseradish peroxidase, wheat germ agglutinin, and albumin: pharmacokinetic and morphological assessments. J Neurochem. 1994;62:2404–2419. doi: 10.1046/j.1471-4159.1994.62062404.x. [DOI] [PubMed] [Google Scholar]
- Berger L, Hakim AM. The association of hyperglycemia with cerebral edema in stroke. Stroke. 1986;17:865–871. doi: 10.1161/01.STR.17.5.865. [DOI] [PubMed] [Google Scholar]
- Brown CE, Li P, Boyd JD, Delaney KR, Murphy TH. Extensive turnover of dendritic spines and vascular remodeling in cortical tissues recovering from stroke. J Neurosci. 2007;27:4101–4109. doi: 10.1523/JNEUROSCI.4295-06.2007. [DOI] [PMC free article] [PubMed] [Google Scholar]
- Brown CE, Aminoltejari K, Erb H, Winship IR, Murphy TH. In vivo voltage-sensitive dye imaging in adult mice reveals that somatosensory maps lost to stroke are replaced over weeks by new structural and functional circuits with prolonged modes of activation within both the peri-infarct zone and distant sites. J Neurosci. 2009;29:1719–1734. doi: 10.1523/JNEUROSCI.4249-08.2009. [DOI] [PMC free article] [PubMed] [Google Scholar]
- Carmichael ST. Cellular and molecular mechanisms of neural repair after stroke: making waves. Ann Neurol. 2006;59:735–742. doi: 10.1002/ana.20845. [DOI] [PubMed] [Google Scholar]
- Chen B, Friedman B, Cheng Q, Tsai P, Schim E, Kleinfeld D, Lyden PD. Severe blood–brain barrier disruption and surrounding tissue injury. Stroke. 2009;40:e666–e674. doi: 10.1161/STROKEAHA.109.551341. [DOI] [PMC free article] [PubMed] [Google Scholar]
- Chiu SL, Chen CM, Cline HT. Insulin receptor signaling regulates synapse number, dendritic plasticity, and circuit function in vivo. Neuron. 2008;58:708–719. doi: 10.1016/j.neuron.2008.04.014. [DOI] [PMC free article] [PubMed] [Google Scholar]
- Cianchetti FA, Kim DH, Dimiduk S, Nishimura N, Schaffer CB. Stimulus-evoked calcium transients in somatosensory cortex are temporarily inhibited by a nearby microhemorrhage. PLoS One. 2013;8:e65663. doi: 10.1371/journal.pone.0065663. [DOI] [PMC free article] [PubMed] [Google Scholar]
- Clarkson AN, Overman JJ, Zhong S, Mueller R, Lynch G, Carmichael ST. AMPA receptor-induced local brain-derived neurotrophic factor signaling mediates motor recovery after stroke. J Neurosci. 2011;31:3766–3775. doi: 10.1523/JNEUROSCI.5780-10.2011. [DOI] [PMC free article] [PubMed] [Google Scholar]
- del Zoppo GJ, Mabuchi T. Cerebral microvessel responses to focal ischemia. J Cereb Blood Flow Metab. 2003;23:879–894. doi: 10.1097/01.WCB.0000078322.96027.78. [DOI] [PubMed] [Google Scholar]
- Dietrich WD, Alonso O, Busto R. Moderate hyperglycemia worsens acute blood–brain barrier injury after forebrain ischemia in rats. Stroke. 1993;24:111–116. doi: 10.1161/01.STR.24.1.111. [DOI] [PubMed] [Google Scholar]
- Ergul A, Abdelsaid M, Fouda AY, Fagan SC. Cerebral neovascularization in diabetes: implications for stroke recovery and beyond. J Cereb Blood Flow Metab. 2014;34:553–563. doi: 10.1038/jcbfm.2014.18. [DOI] [PMC free article] [PubMed] [Google Scholar]
- Eskens FALM, Verweij J. The clinical toxicity profile of vascular endothelial growth factor (VEGF) and vascular endothelial growth factor receptor (VEGFR) targeting angiogenesis inhibitors: a review. Eur J Cancer. 2006;42:3127–3139. doi: 10.1016/j.ejca.2006.09.015. [DOI] [PubMed] [Google Scholar]
- Farr TD, Liu L, Colwell KL, Whishaw IQ, Metz GA. Bilateral alteration in stepping pattern after unilateral motor cortex injury: a new test strategy for analysis of skilled limb movements in neurological mouse models. J Neurosci Methods. 2006;153:104–113. doi: 10.1016/j.jneumeth.2005.10.011. [DOI] [PubMed] [Google Scholar]
- Feng G, Mellor RH, Bernstein M, Keller-Peck C, Nguyen QT, Wallace M, Nerbonne JM, Lichtman JW, Sanes JR. Imaging neuronal subsets in transgenic mice expressing multiple spectral variants of GFP. Neuron. 2000;28:41–51. doi: 10.1016/S0896-6273(00)00084-2. [DOI] [PubMed] [Google Scholar]
- Feng Y, Venema VJ, Venema RC, Tsai N, Behzadian MA, Caldwell RB. VEGF-induced permeability increase is mediated by caveolae. Invest Ophthalmol Vis Sci. 1999;40:157–167. [PubMed] [Google Scholar]
- Fernández-López D, Faustino J, Daneman R, Zhou L, Lee SY, Derugin N, Wendland MF, Vexler ZS. Blood–brain barrier permeability is increased after acute adult stroke but not neonatal stroke in the rat. J Neurosci. 2012;32:9588–9600. doi: 10.1523/JNEUROSCI.5977-11.2012. [DOI] [PMC free article] [PubMed] [Google Scholar]
- Fischer S, Wobben M, Marti HH, Renz D, Schaper W. Hypoxia-induced hyperpermeability in brain microvessel endothelial cells involves VEGF-mediated changes in the expression of zonula occludens-1. Microvasc Res. 2002;63:70–80. doi: 10.1006/mvre.2001.2367. [DOI] [PubMed] [Google Scholar]
- Fong TA, Shawver LK, Sun L, Tang C, App H, Powell TJ, Kim YH, Schreck R, Wang X, Risau W, Ullrich A, Hirth KP, McMahon G. SU5416 is a potent and selective inhibitor of the vascular endothelial growth factor receptor (Flk-1/KDR) that inhibits tyrosine kinase catalysis, tumor vascularization, and growth of multiple tumor types. Cancer Res. 1999;59:99–106. [PubMed] [Google Scholar]
- Forde A, Constien R, Gröne HJ, Hämmerling G, Arnold B. Temporal Cre-mediated recombination exclusively in endothelial cells using Tie2 regulatory elements. Genesis. 2002;33:191–197. doi: 10.1002/gene.10117. [DOI] [PubMed] [Google Scholar]
- Giles FJ, Stopeck AT, Silverman LR, Lancet JE, Cooper MA, Hannah AL, Cherrington JM, O'Farrell AM, Yuen HA, Louie SG, Hong W, Cortes JE, Verstovsek S, Albitar M, O'Brien SM, Kantarjian HM, Karp JE. SU5416, a small molecule tyrosine kinase receptor inhibitor, has biologic activity in patients with refractory acute myeloid leukemia or myelodysplastic syndromes. Blood. 2003;102:795–801. doi: 10.1182/blood-2002-10-3023. [DOI] [PubMed] [Google Scholar]
- Go AS, Mozaffarian D, Roger VL, Benjamin EJ, Berry JD, Blaha MJ, Dai S, Ford ES, Fox CS, Franco S, Fullerton HJ, Gillespie C, Hailpern SM, Heit JA, Howard VJ, Huffman MD, Judd SE, Kissela BM, Kittner SJ, Lackland DT, et al. Heart disease and stroke statistics—2014 update: a report from the American Heart Association. Circulation. 2014;129:e28–e292. doi: 10.1161/01.cir.0000441139.02102.80. [DOI] [PMC free article] [PubMed] [Google Scholar]
- Greenberg DA, Jin K. Vascular endothelial growth factors (VEGFs) and stroke. Cell Mol Life Sci. 2013;70:1753–1761. doi: 10.1007/s00018-013-1282-8. [DOI] [PMC free article] [PubMed] [Google Scholar]
- Gu W, Brännström T, Jiang W, Bergh A, Wester P. Vascular endothelial growth factor-A and -C protein up-regulation and early angiogenesis in a rat photothrombotic ring stroke model with spontaneous reperfusion. Acta Neuropathol. 2001;102:216–226. doi: 10.1007/s004010100370. [DOI] [PubMed] [Google Scholar]
- Haneda M, Kikkawa R, Sugimoto T, Koya D, Araki S, Togawa M, Shigeta Y. Abnormalities in protein kinase C and MAP kinase cascade in mesangial cells cultured under high glucose conditions. J Diabetes Complications. 1995;9:246–248. doi: 10.1016/1056-8727(95)80013-5. [DOI] [PubMed] [Google Scholar]
- Haneda M, Araki S, Togawa M, Sugimoto T, Isono M, Kikkawa R. Mitogen-activated protein kinase cascade is activated in glomeruli of diabetic rats and glomerular mesangial cells cultured under high glucose conditions. Diabetes. 1997;46:847–853. doi: 10.2337/diab.46.5.847. [DOI] [PubMed] [Google Scholar]
- Hawkins BT, Lundeen TF, Norwood KM, Brooks HL, Egleton RD. Increased blood–brain barrier permeability and altered tight junctions in experimental diabetes in the rat: contribution of hyperglycaemia and matrix metalloproteinases. Diabetologia. 2007;50:202–211. doi: 10.1007/s00125-006-0485-z. [DOI] [PubMed] [Google Scholar]
- Heo JH, Han SW, Lee SK. Free radicals as triggers of brain edema formation after stroke. Free Radic Biol Med. 2005;39:51–70. doi: 10.1016/j.freeradbiomed.2005.03.035. [DOI] [PubMed] [Google Scholar]
- Hermann DM, Zechariah A. Implications of vascular endothelial growth factor for postischemic neurovascular remodeling. J Cereb Blood Flow Metab. 2009;29:1620–1643. doi: 10.1038/jcbfm.2009.100. [DOI] [PubMed] [Google Scholar]
- Hooper AT, Butler JM, Nolan DJ, Kranz A, Iida K, Kobayashi M, Kopp HG, Shido K, Petit I, Yanger K, James D, Witte L, Zhu Z, Wu Y, Pytowski B, Rosenwaks Z, Mittal V, Sato TN, Rafii S. Engraftment and reconstitution of hematopoiesis is dependent on VEGFR2-mediated regeneration of sinusoidal endothelial cells. Cell Stem Cell. 2009;4:263–274. doi: 10.1016/j.stem.2009.01.006. [DOI] [PMC free article] [PubMed] [Google Scholar]
- Howangyin KY, Silvestre JS. Diabetes mellitus and ischemic diseases: molecular mechanisms of vascular repair dysfunction. Arterioscler Thromb Vasc Biol. 2014;34:1126–1135. doi: 10.1161/ATVBAHA.114.303090. [DOI] [PubMed] [Google Scholar]
- Iemolo F, Beghi E, Cavestro C, Micheli A, Giordano A, Caggia E. Incidence, risk factors and short-term mortality of stroke in Vittoria, southern Italy. Neurol Sci. 2002;23:15–21. doi: 10.1007/s100720200018. [DOI] [PubMed] [Google Scholar]
- Igarashi M, Wakasaki H, Takahara N, Ishii H, Jiang ZY, Yamauchi T, Kuboki K, Meier M, Rhodes CJ, King GL. Glucose or diabetes activates p38 mitogen-activated protein kinase via different pathways. J Clin Invest. 1999;103:185–195. doi: 10.1172/JCI3326. [DOI] [PMC free article] [PubMed] [Google Scholar]
- Jackman K, Kahles T, Lane D, Garcia-Bonilla L, Abe T, Capone C, Hochrainer K, Voss H, Zhou P, Ding A, Anrather J, Iadecola C. Progranulin deficiency promotes post-ischemic blood–brain barrier disruption. J Neurosci. 2013;33:19579–19589. doi: 10.1523/JNEUROSCI.4318-13.2013. [DOI] [PMC free article] [PubMed] [Google Scholar]
- Kamba T, McDonald DM. Mechanisms of adverse effects of anti-VEGF therapy for cancer. Br J Cancer. 2007;96:1788–1795. doi: 10.1038/sj.bjc.6603813. [DOI] [PMC free article] [PubMed] [Google Scholar]
- King GL, Goodman AD, Buzney S, Moses A, Kahn CR. Receptors and growth-promoting effects of insulin and insulinlike growth factors on cells from bovine retinal capillaries and aorta. J Clin Invest. 1985;75:1028–1036. doi: 10.1172/JCI111764. [DOI] [PMC free article] [PubMed] [Google Scholar]
- Knowland D, Arac A, Sekiguchi KJ, Hsu M, Lutz SE, Perrino J, Steinberg GK, Barres BA, Nimmerjahn A, Agalliu D. Stepwise recruitment of transcellular and paracellular pathways underlies blood–brain barrier breakdown in stroke. Neuron. 2014;82:603–617. doi: 10.1016/j.neuron.2014.03.003. [DOI] [PMC free article] [PubMed] [Google Scholar]
- Krueger M, Härtig W, Reichenbach A, Bechmann I, Michalski D. Blood–brain barrier breakdown after embolic stroke in rats occurs without ultrastructural evidence for disrupting tight junctions. PLoS One. 2013;8:e56419. doi: 10.1371/journal.pone.0056419. [DOI] [PMC free article] [PubMed] [Google Scholar]
- Kruyt ND, Nys GM, van der Worp HB, van Zandvoort MJ, Kappelle LJ, Biessels GJ. Hyperglycemia and cognitive outcome after ischemic stroke. J Neurol Sci. 2008;270:141–147. doi: 10.1016/j.jns.2008.02.020. [DOI] [PubMed] [Google Scholar]
- Kumari R, Willing LB, Krady JK, Vannucci SJ, Simpson IA. Impaired wound healing after cerebral hypoxia-ischemia in the diabetic mouse. J Cereb Blood Flow Metab. 2007;27:710–718. doi: 10.1038/sj.jcbfm.9600382. [DOI] [PubMed] [Google Scholar]
- Kuroiwa T, Ting P, Martinez H, Klatzo I. The biphasic opening of the blood–brain barrier to proteins following temporary middle cerebral artery occlusion. Acta Neuropathol. 1985;68:122–129. doi: 10.1007/BF00688633. [DOI] [PubMed] [Google Scholar]
- Lee S, Chen TT, Barber CL, Jordan MC, Murdock J, Desai S, Ferrara N, Nagy A, Roos KP, Iruela-Arispe ML. Autocrine VEGF signaling is required for vascular homeostasis. Cell. 2007;130:691–703. doi: 10.1016/j.cell.2007.06.054. [DOI] [PMC free article] [PubMed] [Google Scholar]
- Li W, Prakash R, Kelly-Cobbs AI, Ogbi S, Kozak A, El-Remessy AB, Schreihofer DA, Fagan SC, Ergul A. Adaptive cerebral neovascularization in a model of type 2 diabetes: relevance to focal cerebral ischemia. Diabetes. 2010;59:228–235. doi: 10.2337/db09-0902. [DOI] [PMC free article] [PubMed] [Google Scholar]
- Li W, Qu Z, Prakash R, Chung C, Ma H, Hoda MN, Fagan SC, Ergul A. Comparative analysis of the neurovascular injury and functional outcomes in experimental stroke models in diabetic Goto-Kakizaki rats. Brain Res. 2013;1541:106–114. doi: 10.1016/j.brainres.2013.10.021. [DOI] [PMC free article] [PubMed] [Google Scholar]
- Lossinsky AS, Shivers RR. Structural pathways for macromolecular and cellular transport across the blood–brain barrier during inflammatory conditions. Histol Histopathol. 2004;19:535–564. doi: 10.14670/HH-19.535. [DOI] [PubMed] [Google Scholar]
- MacDougall NJ, Muir KW. Hyperglycaemia and infarct size in animal models of middle cerebral artery occlusion: systematic review and meta-analysis. J Cereb Blood Flow Metab. 2011;31:807–818. doi: 10.1038/jcbfm.2010.210. [DOI] [PMC free article] [PubMed] [Google Scholar]
- Madisen L, Zwingman TA, Sunkin SM, Oh SW, Zariwala HA, Gu H, Ng LL, Palmiter RD, Hawrylycz MJ, Jones AR, Lein ES, Zeng H. A robust and high-throughput Cre reporting and characterization system for the whole mouse brain. Nat Neurosci. 2010;13:133–140. doi: 10.1038/nn.2467. [DOI] [PMC free article] [PubMed] [Google Scholar]
- Manoonkitiwongsa P, Schultz R, Lyden P. Safe and effective vascular endothelial cell growth factor (VEGF)-based therapeutic angiogenesis for ischemic stroke: insights from preclinical trials. In: Slevin M, editor. Therapeutic angiogenesis for vascular diseases. Amsterdam: Springer; 2011. pp. 169–212. [Google Scholar]
- Marti HJH, Bernaudin M, Bellail A, Schoch H, Euler M, Petit E, Risau W. Hypoxia-induced vascular endothelial growth factor expression precedes neovascularization after cerebral ischemia. J Pathol. 2000;156:965–976. doi: 10.1016/S0002-9440(10)64964-4. [DOI] [PMC free article] [PubMed] [Google Scholar]
- Mendel DB, Schreck RE, West DC, Li G, Strawn LM, Tanciongco SS, Vasile S, Shawver LK, Cherrington JM. The angiogenesis inhibitor SU5416 has long-lasting effects on vascular endothelial growth factor receptor phosphorylation and function. Clin Cancer Res. 2000;6:4848–4858. [PubMed] [Google Scholar]
- Mezrich JD, Nguyen LP, Kennedy G, Nukaya M, Fechner JH, Zhang X, Xing Y, Bradfield CA. SU5416, a VEGF receptor inhibitor and ligand of the AHR, represents a new alternative for immunomodulation. PLoS One. 2012;7:e44547. doi: 10.1371/journal.pone.0044547. [DOI] [PMC free article] [PubMed] [Google Scholar]
- Minchenko A, Salceda S, Bauer T, Caro J. Hypoxia regulatory elements of the human vascular endothelial growth-factor gene. Cell Mol Biol Res. 1994;40:35–39. [PubMed] [Google Scholar]
- Monvoisin A, Alva JA, Hofmann JJ, Zovein AC, Lane TF, Iruela-Arispe ML. VE-cadherin-CreERT2 transgenic mouse: a model for inducible recombination in the endothelium. Dev Dyn. 2006;235:3413–3422. doi: 10.1002/dvdy.20982. [DOI] [PubMed] [Google Scholar]
- Mostany R, Chowdhury TG, Johnston DG, Portonovo SA, Carmichael ST, Portera-Cailliau C. Local hemodynamics dictate long-term dendritic plasticity in peri-infarct cortex. J Neurosci. 2010;30:14116–14126. doi: 10.1523/JNEUROSCI.3908-10.2010. [DOI] [PMC free article] [PubMed] [Google Scholar]
- Murphy TH, Corbett D. Plasticity during stroke recovery: from synapse to behaviour. Nat Rev Neurosci. 2009;10:861–872. doi: 10.1038/nrn2735. [DOI] [PubMed] [Google Scholar]
- Ntaios G, Papavasileiou V, Bargiota A, Makaritsis K, Michel P. Intravenous insulin treatment in acute stroke: a systematic review and meta-analysis of randomized controlled trials. Int J Stroke. 2014;9:489–493. doi: 10.1111/ijs.12225. [DOI] [PubMed] [Google Scholar]
- Pieper GM. Acute amelioration of diabetic endothelial dysfunction with a derivative of the nitric oxide synthase cofactor, tetrahydrobiopterin. J Cardiovasc Pharmacol. 1997;29:8–15. doi: 10.1097/00005344-199701000-00002. [DOI] [PubMed] [Google Scholar]
- Pieper GM, Peltier BA. Amelioration by L-arginine of a dysfunctional arginine nitric-oxide pathway in diabetic endothelium. J Cardiovasc Pharmacol. 1995;25:397–403. doi: 10.1097/00005344-199503000-00008. [DOI] [PubMed] [Google Scholar]
- Prakash R, Somanath PR, El-Remessy AB, Kelly-Cobbs A, Stern JE, Dore-Duffy P, Johnson M, Fagan SC, Ergul A. Enhanced cerebral but not peripheral angiogenesis in the Goto-Kakizaki model of type 2 diabetes involves VEGF and peroxynitrite signaling. Diabetes. 2012;61:1533–1542. doi: 10.2337/db11-1528. [DOI] [PMC free article] [PubMed] [Google Scholar]
- Prakash R, Li W, Qu Z, Johnson MA, Fagan SC, Ergul A. Vascularization pattern after ischemic stroke is different in control versus diabetic rats: relevance to stroke recovery. Stroke. 2013;44:2875–2882. doi: 10.1161/STROKEAHA.113.001660. [DOI] [PMC free article] [PubMed] [Google Scholar]
- Purves T, Middlemas A, Agthong S, Jude EB, Boulton AJ, Fernyhough P, Tomlinson DR. A role for mitogen-activated protein kinases in the etiology of diabetic neuropathy. FASEB J. 2001;15:2508–2514. doi: 10.1096/fj.01-0253hyp. [DOI] [PubMed] [Google Scholar]
- Quaegebeur A, Lange C, Carmeliet P. The neurovascular link in health and disease: molecular mechanisms and therapeutic implications. Neuron. 2011;71:406–424. doi: 10.1016/j.neuron.2011.07.013. [DOI] [PubMed] [Google Scholar]
- Rigau V, Morin M, Rousset MC, de Bock F, Lebrun A, Coubes P, Picot MC, Baldy-Moulinier M, Bockaert J, Crespel A, Lerner-Natoli M. Angiogenesis is associated with blood–brain barrier permeability in temporal lobe epilepsy. Brain. 2007;130:1942–1956. doi: 10.1093/brain/awm118. [DOI] [PubMed] [Google Scholar]
- Rosenberg GA, Estrada EY, Dencoff JE. Matrix metalloproteinases and TIMPs are associated with blood–brain barrier opening after reperfusion in rat brain. Stroke. 1998;29:2189–2195. doi: 10.1161/01.STR.29.10.2189. [DOI] [PubMed] [Google Scholar]
- Rosidi NL, Zhou J, Pattanaik S, Wang P, Jin W, Brophy M, Olbricht WL, Nishimura N, Schaffer CB. Cortical microhemorrhages cause local inflammation but do not trigger widespread dendrite degeneration. PLoS One. 2011;6:e26612. doi: 10.1371/journal.pone.0026612. [DOI] [PMC free article] [PubMed] [Google Scholar]
- Sandoval KE, Witt KA. Blood–brain barrier tight junction permeability and ischemic stroke. Neurobiol Dis. 2008;32:200–219. doi: 10.1016/j.nbd.2008.08.005. [DOI] [PubMed] [Google Scholar]
- Schindelin J, Arganda-Carreras I, Frise E, Kaynig V, Longair M, Pietzsch T, Preibisch S, Rueden C, Saalfeld S, Schmid B, Tinevez JY, White DJ, Hartenstein V, Eliceiri K, Tomancak P, Cardona A. Fiji: an open-source platform for biological-image analysis. Nat Methods. 2012;9:676–682. doi: 10.1038/nmeth.2019. [DOI] [PMC free article] [PubMed] [Google Scholar]
- Schlaug G, Siewert B, Benfield A, Edelman RR, Warach S. Time course of the apparent diffusion coefficient (ADC) abnormality in human stroke. Neurology. 1997;49:113–119. doi: 10.1212/WNL.49.1.113. [DOI] [PubMed] [Google Scholar]
- Schmued LC, Stowers CC, Scallet AC, Xu L. Fluoro-Jade C results in ultra high resolution and contrast labeling of degenerating neurons. Brain Res. 2005;1035:24–31. doi: 10.1016/j.brainres.2004.11.054. [DOI] [PubMed] [Google Scholar]
- Seto A, Taylor S, Trudeau D, Swan I, Leung J, Reeson P, Delaney KR, Brown CE. Induction of ischemic stroke in awake freely moving mice reveals that isoflurane anesthesia can mask the benefits of a neuroprotection therapy. Front Neuroenerget. 2014;6:1. doi: 10.3389/fnene.2014.00001. [DOI] [PMC free article] [PubMed] [Google Scholar]
- Shanina EV, Schallert T, Witte OW, Redecker C. Behavioral recovery from unilateral photothrombotic infarcts of the forelimb sensorimotor cortex in rats: role of the contralateral cortex. Neuroscience. 2006;139:1495–1506. doi: 10.1016/j.neuroscience.2006.01.016. [DOI] [PubMed] [Google Scholar]
- Shimotake J, Derugin N, Wendland M, Vexler ZS, Ferriero DM. Vascular endothelial growth factor receptor-2 inhibition promotes cell death and limits endothelial cell proliferation in a neonatal rodent model of stroke. Stroke. 2010;41:343–349. doi: 10.1161/STROKEAHA.109.564229. [DOI] [PMC free article] [PubMed] [Google Scholar]
- Siddiq A, Aminova LR, Troy CM, Suh K, Messer Z, Semenza GL, Ratan RR. Selective inhibition of hypoxia-inducible factor (HIF) prolyl-hydroxylase 1 mediates neuroprotection against normoxic oxidative death via HIF- and CREB-independent pathways. J Neurosci. 2009;29:8828–8838. doi: 10.1523/JNEUROSCI.1779-09.2009. [DOI] [PMC free article] [PubMed] [Google Scholar]
- Sörensen I, Adams RH, Gossler A. DLL1-mediated Notch activation regulates endothelial identity in mouse fetal arteries. Blood. 2009;113:5680–5688. doi: 10.1182/blood-2008-08-174508. [DOI] [PubMed] [Google Scholar]
- Spitaler MM, Graier WF. Vascular targets of redox signalling in diabetes mellitus. Diabetologia. 2002;45:476–494. doi: 10.1007/s00125-002-0782-0. [DOI] [PubMed] [Google Scholar]
- Stowe AM, Plautz EJ, Eisner-Janowicz I, Frost SB, Barbay S, Zoubina EV, Dancause N, Taylor MD, Nudo RJ. VEGF protein associates to neurons in remote regions following cortical infarct. J Cereb Blood Flow Metab. 2007;27:76–85. doi: 10.1038/sj.jcbfm.9600320. [DOI] [PMC free article] [PubMed] [Google Scholar]
- Sweetnam D, Holmes A, Tennant KA, Zamani A, Walle M, Jones P, Wong C, Brown CE. Diabetes impairs cortical plasticity and functional recovery following ischemic stroke. J Neurosci. 2012;32:5132–5143. doi: 10.1523/JNEUROSCI.5075-11.2012. [DOI] [PMC free article] [PubMed] [Google Scholar]
- Tennant KA, Brown CE. Diabetes augments in vivo microvascular blood flow dynamics after stroke. J Neurosci. 2013;33:19194–19204. doi: 10.1523/JNEUROSCI.3513-13.2013. [DOI] [PMC free article] [PubMed] [Google Scholar]
- Tennant KA, Jones TA. Sensorimotor behavioral effects of endothelin-1 induced small cortical infarcts in C57BL/6 mice. J Neurosci Methods. 2009;181:18–26. doi: 10.1016/j.jneumeth.2009.04.009. [DOI] [PMC free article] [PubMed] [Google Scholar]
- Terman BI, Dougher-Vermazen M, Carrion ME, Dimitrov D, Armellino DC, Gospodarowicz D, Böhlen P. Identification of the KDR tyrosine kinase as a receptor for vascular endothelial cell growth factor. Biochem Biophys Res Commun. 1992;187:1579–1586. doi: 10.1016/0006-291X(92)90483-2. [DOI] [PubMed] [Google Scholar]
- Tomlinson DR. Mitogen-activated protein kinases as glucose transducers for diabetic complications. Diabetologia. 1999;42:1271–1281. doi: 10.1007/s001250051439. [DOI] [PubMed] [Google Scholar]
- Toni D, Sacchetti ML, Argentino C, Gentile M, Cavalletti C, Frontoni M, Fieschi C. Does hyperglycaemia play a role on the outcome of acute ischaemic stroke patients? J Neurol. 1992;239:382–386. doi: 10.1007/BF00812155. [DOI] [PubMed] [Google Scholar]
- Türeyen K, Vemuganti R, Sailor KA, Dempsey RJ. Infarct volume quantification in mouse focal cerebral ischemia: a comparison of triphenyltetrazolium chloride and cresyl violet staining techniques. J Neurosci Methods. 2004;139:203–207. doi: 10.1016/j.jneumeth.2004.04.029. [DOI] [PubMed] [Google Scholar]
- Villegas JC, Broadwell RD. Transcytosis of protein through the mammalian cerebral epithelium and endothelium: II. Adsorptive transcytosis of WGA-HRP and the blood–brain and brain–blood barriers. J Neurocytol. 1993;22:67–80. doi: 10.1007/BF01181571. [DOI] [PubMed] [Google Scholar]
- Vinik A, Flemmer M. Diabetes and macrovascular disease. J Diabetes Complications. 2002;16:235–245. doi: 10.1016/S1056-8727(01)00212-4. [DOI] [PubMed] [Google Scholar]
- Warren CM, Ziyad S, Briot A, Der A, Iruela-Arispe ML. A ligand-independent VEGFR2 signaling pathway limits angiogenic responses in diabetes. Sci Signal. 2014;7:ra1. doi: 10.1126/scisignal.2004235. [DOI] [PMC free article] [PubMed] [Google Scholar]
- Watson BD, Dietrich WD, Busto R, Wachtel MS, Ginsberg MD. Induction of reproducible brain infarction by photochemically initiated thrombosis. Ann Neurol. 1985;17:497–504. doi: 10.1002/ana.410170513. [DOI] [PubMed] [Google Scholar]
- Wei JW, Heeley EL, Wang JG, Huang Y, Wong LK, Li Z, Heritier S, Arima H, Anderson CS. Comparison of recovery patterns and prognostic indicators for ischemic and hemorrhagic stroke in China: the ChinaQUEST (QUality Evaluation of Stroke Care and Treatment) Registry Study. Stroke. 2010;41:1877–1883. doi: 10.1161/STROKEAHA.110.586909. [DOI] [PubMed] [Google Scholar]
- Willis CL, Meske DS, Davis TP. Protein kinase C activation modulates reversible increase in cortical blood–brain barrier permeability and tight junction protein expression during hypoxia and posthypoxic reoxygenation. J Cereb Blood Flow Metab. 2010;30:1847–1859. doi: 10.1038/jcbfm.2010.119. [DOI] [PMC free article] [PubMed] [Google Scholar]
- Wolman M, Klatzo I, Chui E, Wilmes F, Nishimoto K, Fujiwara K, Spatz M. Evaluation of the dye-protein tracers in pathophysiology of the blood–brain barrier. Acta Neuropathol. 1981;54:55–61. doi: 10.1007/BF00691332. [DOI] [PubMed] [Google Scholar]
- Won SJ, Tang XN, Suh SW, Yenari MA, Swanson RA. Hyperglycemia promotes tissue plasminogen activator-induced hemorrhage by Increasing superoxide production. Ann Neurol. 2011;70:583–590. doi: 10.1002/ana.22538. [DOI] [PMC free article] [PubMed] [Google Scholar]
- Ye X, Chopp M, Cui X, Zacharek A, Cui Y, Yan T, Shehadah A, Roberts C, Liu X, Lu M, Chen J. Niaspan enhances vascular remodeling after stroke in type 1 diabetic rats. Exp Neurol. 2011;232:299–308. doi: 10.1016/j.expneurol.2011.09.022. [DOI] [PMC free article] [PubMed] [Google Scholar]
- Zhang S, Murphy TH. Imaging the impact of cortical microcirculation on synaptic structure and sensory-evoked hemodynamic responses in vivo. PLoS Biol. 2007;5:e119. doi: 10.1371/journal.pbio.0050119. [DOI] [PMC free article] [PubMed] [Google Scholar]
- Zhang ZG, Zhang L, Tsang W, Soltanian-Zadeh H, Morris D, Zhang R, Goussev A, Powers C, Yeich T, Chopp M. Correlation of VEGF and angiopoietin expression with disruption of blood–brain barrier and angiogenesis after focal cerebral ischemia. J Cereb Blood Flow Metab. 2002;22:379–392. doi: 10.1097/00004647-200204000-00002. [DOI] [PubMed] [Google Scholar]
- Zhao LN, Yang ZH, Liu YH, Ying HQ, Zhang H, Xue YX. Vascular endothelial growth factor increases permeability of the blood–tumor barrier via caveolae-mediated transcellular pathway. J Mol Neurosci. 2011;44:122–129. doi: 10.1007/s12031-010-9487-x. [DOI] [PubMed] [Google Scholar]
- Zhao Q, Niu Y, Matsumoto K, Tsuneyama K, Tanaka K, Miyata T, Yokozawa T. Chotosan ameliorates cognitive and emotional deficits in an animal model of type 2 diabetes: possible involvement of cholinergic and VEGF/PDGF mechanisms in the brain. BMC Complement Altern Med. 2012;12:188. doi: 10.1186/1472-6882-12-188. [DOI] [PMC free article] [PubMed] [Google Scholar]
- Zlokovic BV. The blood–brain barrier in health and chronic neurodegenerative disorders. Neuron. 2008;57:178–201. doi: 10.1016/j.neuron.2008.01.003. [DOI] [PubMed] [Google Scholar]