

Abstract
Axonal guidance and synaptic specification depends on specific signaling mechanisms that occur in growth cones. While several signaling pathways implicated in cone navigation have been identified, membrane dynamics in growth cones remains largely unknown. We took advantage of SynaptopHluorin and high-speed optical recordings to monitor the patterns of membrane dynamics in rat hippocampal growth cones. We show that exocytosis occurs both at the peripheral and central domains, including filopodia, and that SynaptopHluorin signals occur as spontaneous patterned peaks. Such transients average approximately two per minute and last ∼30 s. We also demonstrate that the chemoattractant Netrin-1 elicits increases in the frequency and slopes of these transients, with peaks averaging up to six per minute in the peripheral domain. Netrin-1-dependent regulation of exocytotic events requires the activation of the Erk1/2 and SFK pathways. Furthermore, we show that domains with high SynaptopHluorin signals correlate with high local calcium concentrations and that local, spontaneous calcium increases are associated with higher SynaptopHluorin signals. These findings demonstrate highly stereotyped, spontaneous transients of local exocytosis in growth cones and that these transients are positively regulated by chemoattractant molecules such as Netrin-1.
Keywords: exocytosis, growth cone, Netrin-1, SynaptopHluorin
Introduction
Axonal growth and guidance is essential for the generation of synaptic circuits. Several families of guidance molecules make crucial contributions to the development of neural connections. Such molecules act through receptors expressed in growth cones and trigger the activation of transduction pathways. The chemoattractant Netrin-1 binds to Deleted in Colorectal Cancer (DCC) receptors at growth cones, which in turn activate MAP kinases, Src-family kinases (SFKs), small GTPases, cyclic nucleosides, and calcium transients, among other signaling cascades (Del Río et al., 2004; Henley and Poo, 2004; Round and Stein, 2007; Ly et al., 2008; Tcherkezian et al., 2010; Kolodkin and Tessier-Lavigne, 2011; Nicol et al., 2011). Netrin-1 signaling leads to the rearrangement and stabilization of cytoskeletal components in growth cones (Dent et al., 2004; Leung et al., 2006). These studies support that the growth cone is the key compartment for exploring the extracellular “milieu” during axonal growth (Ramón y Cajal, 1909; Tessier-Lavigne and Goodman, 1996) and for generating axonal responses, whether extension or retraction, through the local transduction of guidance cues.
Little is known, however, about the cross talk between axonal guidance and membrane dynamics, other than the fact that growth cones are filled by vesicles and express most SNARE and exocyst proteins (Sabo and McAllister, 2003; Yuan et al., 2003; Condeelis et al., 2005; Leung et al., 2006; Chernyshova et al., 2011; Cotrufo et al., 2011, 2012). It has recently been reported that the vSNARE VAMP2 is required for L1-mediated chemoattraction (Tojima et al., 2007) and for Sema3A-induced chemorepulsion (Zylbersztejn et al., 2012). Another study reported that the developmentally regulated vSNARE TI-VAMP is required for the outgrowth of neurites (Martinez-Arca et al., 2000; Meldolesi, 2011). Moreover, Netrin-1 triggers exocytosis of the DCC receptor (Bouchard et al., 2004, 2008; Cotrufo et al., 2012), and we recently found that Netrin-1-mediated attraction requires Syntaxin-1 and TI-VAMP, which co-associate with DCC in a ligand-dependent manner (Cotrufo et al., 2011, 2012). Studies using pHluorin probes have reported single vesicle fusion events in growth cones (Tojima et al., 2007; Burgo et al., 2012). Conversely, endocytosis has been proposed to be required for growth cone collapse and chemorepulsion, suggesting that membrane dynamics and remodeling are critical for axonal guidance (Igarashi et al., 1996; Tojima et al., 2010, 2011; Tojima, 2012). However, how and where exocytotic events take place in growth cones and their overall dynamics remain largely unknown. Here we used SynaptopHluorin and optical recordings to dissect the dynamics of exocytosis in growth cones. We show that, rather than a random event, growth cone exocytosis takes place as spontaneous patterned peaks of increased exocytosis, followed by periods of low membrane turnover. These patterned events were more frequent in the peripheral domain, including filopodia, than in the central domain. Finally, we show that SynaptopHluorin signals correlate with local increases in calcium, that Netrin-1 increases exocytosis in growth cones by regulating the frequency and slope of SynaptopHluorin peaks, and that this increase requires Erk1/2 and SFK activation.
Materials and Methods
Materials.
PP1, PP2, U0125, and SB203580 (Sigma) were used at a concentration of 1 μm and PD98059 was used at a concentration of 5 μm. rmNetrin-1 (R&D Systems) was used at 100 ng/ml. The SynaptopHluorin plasmid (Miesenböck et al., 1998) was a generous gift from Dr. G. Miesenböck (Oxford, UK) and Dr. Fernando Aguado (University of Barcelona, Spain). The R-GECO1 plasmid, designed by Robert Campbell (Zhao et al., 2011), was obtained from the Addgene repository (Addgene plasmid 32444).
Animals.
E17 embryos from the Sprague Dawley OF-A rat strain (Iffa-Credo) were used. Embryos of both sexes were used. The mating day was considered E0. Pregnant rats were killed following national and European regulations.
Culture and transfection of hippocampal neurons.
To obtain neuronal cultures, the hippocampi of E17 embryos were dissected out and digested enzymatically with trypsin (Invitrogen) and DNase (Roche) followed by mechanic disaggregation by gentle pipetting. Individual cells were plated at a density of 125,000 cells in glass-bottomed 35 mm dishes (WPI) previously coated with poly-l-lysine (Sigma) in borate buffer. The cultures were incubated at 37°C in a 5% CO2 atmosphere in Neurobasal/GlutaMAX /B-27 (Invitrogen). We further supplemented the medium by adding 1/5 of the volume with conditioned medium from mature (>14 DIV) hippocampal cultures. After 2 DIV, the cultures were transfected with SynaptopHluorin, using Lipofectamine 2000 (Invitrogen) and the following protocol: before the transfection procedure, 2/5 of the medium was removed from the plate and kept aside to be returned after the transfection. For each 35 mm plate, 4 μg of DNA and 8 μl of Lipofectamine 2000 were mixed with 250 μl Opti-MEM (Invitrogen), each in separate tubes. After a 5 min incubation at room temperature, the contents of the two tubes were mixed and incubated for 20 min at room temperature. The mixture was then carefully added to the cultures, which were incubated at 37°C and 5% CO2 for 50 min. The medium was then replaced with that removed at the beginning of the protocol, an equal amount of fresh Neurobasal/GlutaMAX/B-27, and 1/5 of conditioned medium. The cultures were kept in an incubator until the following day.
In vivo imaging of SynaptopHluorin-transfected growth cones.
Healthy and motile growth cones were selected for imaging under the microscope. Images were acquired using a Revolution confocal Spinning Disk unit (Andor Technology) coupled to an inverted IX81 microscope (Olympus) with a 100× objective (1.3 NA), and the dedicated program IQ2 (Andor Technology). The samples were excited with a 488 diode laser and emission was collected using a filter for GFP. The basic acquisition parameters were set at a laser intensity of 5% and acquisition time of 100 ms. A Z-stack of five images separated by 0.5 μm was acquired every 1.5 s or 2 s, depending on the experiment. For the imaging of single exocytotic events, the recording started 1 min after the addition of Netrin-1. For the analysis of long-term effects, Netrin-1 was added 10 min after the beginning of the recording. For the pharmacology experiments, Netrin-1 was added 30 min after the start of the recording, and 15 min after the addition of the pharmacological agents (Fig. 6B).
Figure 6.
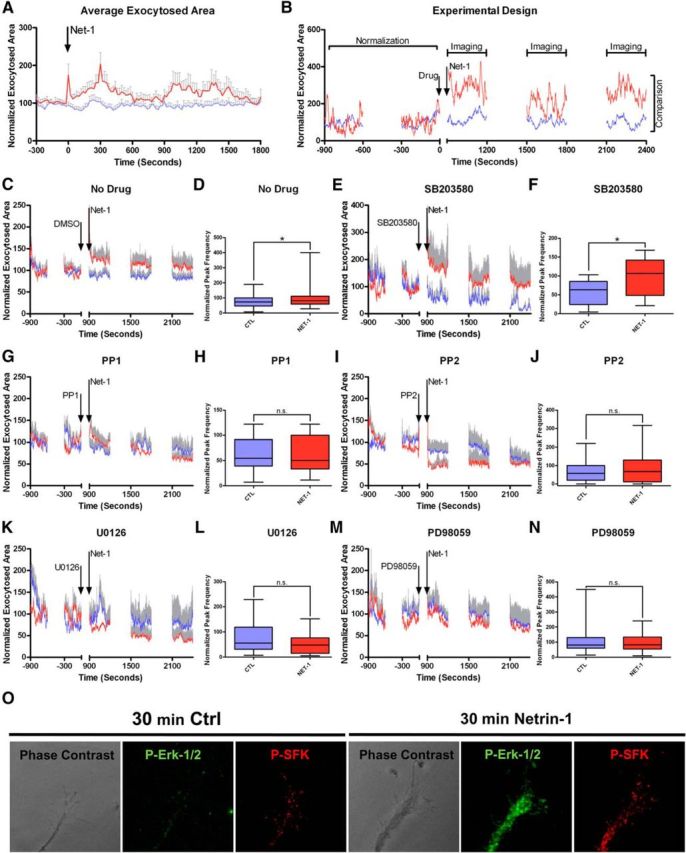
Involvement of SFKs and Erk1/2 in the Netrin-1-induced increase in growth cone membrane dynamics. A, Average exocytotic profiles of control and Netrin-1-treated growth cones, imaged every 20 s. After the addition of Netrin-1 (time 0), growth cones show an increase in the average exocytosed area, whereas control growth cones remain stable. Data averages 35 control and 20 Netrin-1-treated growth cones. B, Experimental design of the pharmacology experiments. The plot profile shows the traces of a control and Netrin-1-treated growth cone. Images were acquired every 1.5 s at 5 min intervals. The first 15 min were considered as controls and used to normalize the plots. Drugs were added 15 min after the beginning of the recording; Netrin-1 was added 15 min after the addition of the drug. Traces from minute 30 onward were analyzed and used for comparison. The time points at which the drug and Netrin-1 were added are labeled by arrows. C, E, G, I, K, M, Average profiles of control and Netrin-1-treated growth cones without the addition of a drug (C), or treated with the p38 inhibitor SB203580 (E), the SFKs inhibitors PP1 and PP2 (G and I, respectively), and the Erk1/2 inhibitors U0126 and PD98059 (K, M). Note that SFKs and Erk1/2 inhibitors block Netrin-1-induced increases in SynaptopHluorin signals. D, F, H, J, L, N, Comparison between the average peak frequencies of control and Netrin-1-treated growth cones in the absence (D) or presence of the aforementioned inhibitors: p38 (F), SFKs (H, J), and Erk1/2 (L, N). Mann–Whitney test. n.s., non-significant. *p < 0.05. O, Confocal images show low phosphorylation levels of Erk1/2 and SFKs in hippocampal growth cones in control conditions (left). Note that Netrin-1 triggers the local phosphorylation of Erk1/2 and SFKs in the growth cone (right). CTL, control; NET-1, Netrin-1.
For calcium imaging samples were excited sequentially every 3 s with 488 and 568 diode lasers, and images were acquired using GFP and rhodamine filters, respectively.
Image processing.
Maximum Z-projections for each time point were rendered in IQ2. We designed a series of tools in Fiji (Open Source image processing package) for the processing and analysis of fluorescent spots in the growth cones: The image sequences were normalized by the average intensities of the growth cone at each time point to compensate for photobleaching, using a custom-designed macro. Briefly, the macro evaluates the decrease in the signal in the whole growth cone and turns it into a value by which it multiplies the value of each pixel in the image, removing the global loss of intensity induced by the imaging process. The growth cones and the areas of exocytosis were then outlined by an intensity threshold and the areas occupied by both were measured using a second custom-designed macro. The ratio between total exocytosed area and the growth cone area was normalized to the same ratio during control conditions and represented over time. The central and peripheral domains of the growth cone were defined with iterative erosions of the mask of the whole growth cone and then outlined in the normalized image sequence using the logical operator “AND.” The relation between the growth cone expansion and the movement of the exocytosed membrane was calculated in Fiji using a custom macro that measures area occupied by the thresholded image of the growth cone in a 45° sector centered in the vector of movement of the fluorescent spot (user-defined) during 50 frames.
SynaptopHluorin/R-GECO1 image sequences were processed similarly for the green channel, and average intensity of the red channel within the growth cone was calculated for each frame and plotted over time. SynaptopHluorin/R-GECO1 correlations were calculated defining a high- and low-intensity region within the growth cone in the green channel, and calculating the average intensity in this same region in the red channel. The evolution of the SynaptopHluorin-positive area in the region of local calcium increases was calculated by localizing local calcium increases by visual inspection and using the same macro used to calculate the expansion of the growth cones in the segmented SynaptopHluorin image sequence.
Plot analysis.
The characteristics of these plots were analyzed in a semiautomated manner using a custom script in MATLAB (The MathWorks), which allows discrimination of transient fluctuations above a defined threshold (set at 20% increase/decrease) and calculates the amplitude (increase in exocytosed growth cone membrane between the maximum of the peak compared with the preceding minimum), duration (distance between two consecutive minimums), slope (amplitude/distance between the minimum and the maximum of the peak), and the area (contained in the triangle whose vertices are the maximum and the two flanking minimums of the peak). A threshold of 20% increase/decrease was selected, as visual inspection of individual profiles revealed that (1) most peaks were clearly above this threshold and could therefore be detected by the threshold (e.g., average peak amplitude ∼50; Fig. 3I), (2) smaller thresholds (e.g., 10%) were only slightly above background levels, and (3) higher thresholds (e.g., 40%) did not allow visual detection of fluctuations. In addition, we performed a comparative analysis using various thresholds (e.g., 10 and 40, in addition to 20), which demonstrated that relative differences between groups were maintained using distinct thresholds (data not shown). Calcium peak frequency was obtained by analyzing the R-GECO1 fluctuations in MATLAB with a 2.5% threshold.
Figure 3.
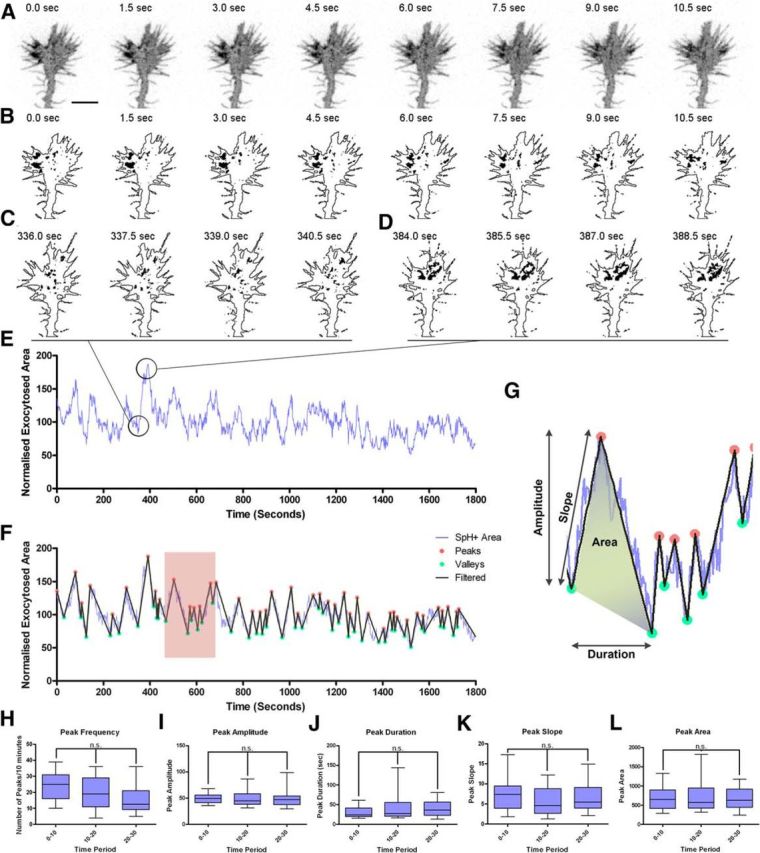
Quantitative analyses of exocytotic events in hippocampal growth cones using SynaptopHluorin. A, Image sequence of a growth cone transfected with SynaptopHluorin over 10 s. B, Segmented images of the growth cone in A displaying the regions with fluorescence above a defined threshold, isolated from the outline of the growth cone. C, D, Segmented images of the growth cone in A during a period of low (C) and high (D) exocytotic activity. E, Representative plot of fluorescent areas, normalized to the total area of the growth cone, over time 30 min. F, Plot in E filtered by a 20% threshold (black line) superimposed on the original plot (blue line). Transient peaks are defined by the minimums and maximums (highlighted in green and red, respectively) of the filtered plot (SpH+, SynaptopHluorin-positive). G, Magnification of the boxed region in F illustrating the parameters analyzed: Amplitude, Duration, Slope, and Area. H–L, Quantifications of the average peak frequency (H), amplitude (I), duration (J), slope (K), and area (L) in control hippocampal growth cones recorded for 30 min (every 10 min). n.s., non-significant. Kruskal–Wallis test with Dunn's post hoc analysis.
Macros and script.
A total of six custom algorithms was used throughout this manuscript: five Fiji macros and a MATLAB script. Fiji macros were designed to (1) correct for photobleaching, (2) segment the exocytosed membrane from the growth cone outline and measure their relative areas in an standardized manner, (3) segment the peripheral domain from the central and analyze their relative area of exocytosis, (4) analyze the expansion of the growth cone in a determined sector, and (5) compare the evolution of SynaptopHluorin to GECO fluorescence on a determined region in the growth cone. The MATLAB script finds oscillations above a determined threshold on a plot, and calculates their amplitude, duration, slope, and area. The macros and custom scripts used in this study can be requested at esoriano@ub.edu or oriol.ros@inserm.fr.
Immunolocalization of extracellular membrane SynaptopHluorin.
Hippocampal neurons at 3 DIV, transfected with SynaptopHluorin (see below), were incubated with an antibody against GFP (5 μg/ml, rabbit polyclonal; Life Technologies) for 30 min at 4–8°C and either returned to the incubator for 30 s or used immediately in the next step. After brief washing with cold DPBS (calcium-free and magnesium-free; Life Technologies) three times, neurons were fixed for 5 min at room temperature in paraformaldehyde (4%)/sucrose (4%) without permeabilization. Surface antibody-labeled SynaptopHluorin was visualized by means of a 1 h incubation with Alexa Fluor 568-conjugated secondary antibody (Alexa Fluor 568 goat anti-rabbit, 4 μg/ml; Life Technologies). Neurons were permeabilized for 10 min with PBS-Triton (0.1%), and intracellular Syntaxin-1 or EEA1 were detected by a 2 h incubation with specific antibodies (monoclonal anti-Syntaxin-1 and clone HPC1, Sigma; monoclonal anti-EEA1, BD Biosciences), and a further 1 h incubation with Cy5-secondary antibody (Jackson ImmunoResearch). After staining, the coverslips were mounted in Mowiol (Sigma). To minimize bleed through, images were acquired sequentially in an SP2 spectral confocal microscope equipped with a 63× NA, 1.45 objective.
Immunolocalization of Phospho-Erk and Phospho-Src in growth cones.
Hippocampal primary cultures (3 DIV) were deprived of B-27 for 3 h, treated with Netrin-1 or vehicle solution for 30 min, and then fixed with 4% PFA. Primary anti-Phospho-Erk1/2 (Cell Signaling Technology) and anti-Phospho-Src (Clone 9A6; Millipore) antibodies were used at a concentration of 1 μg/ml; secondary Alexa Fluor goat anti-mouse 568 and goat anti-rabbit 488 (Invitrogen) were used at a concentration of 5 μg/ml. Images were acquired using a Nikon E-1000 microscope equipped with a 63× NA, 1.45 objective, in phase contrast, and green and red emission channels. Acquisition time was kept constant for control and Netrin-1-treated cultures, and images were processed in parallel.
Statistics.
Data were plotted as box-and-whisker graphs displaying median and range, unless otherwise stated, and were analyzed statistically with the Kruskal–Wallis test, followed by the post hoc Dunn's test or the Mann–Whitney test in GraphPad Prism (GraphPad Software).
Results
SynaptopHluorin allows reliable imaging of local exocytotic events in living growth cones
To examine local membrane dynamics and exocytosis in axonal growth cones, we used a pHluorin fluorescent probe (SynaptopHluorin, ratiometric pHluorin fused to the luminal C terminus of VAMP2) that renders high fluorescent spots when the lumen of vesicles is in contact with the extracellular space (Miesenböck et al., 1998). We transfected cultured embryonic hippocampal neurons with SynaptopHluorin at 2 DIV and recorded exocytotic events the day after. To allow high spatiotemporal resolution, we used Spinning Disk Confocal Microscopy, a technique that allows high-speed imaging while minimizing photobleaching. We routinely captured the entire z-axis of growth cones every 1.5 s over 30 min (Figs. 1, 2, Movies 1–3). Higher temporal resolution (e.g., 0.5 s) compromised the viability of growth cones, which frequently collapsed.
Figure 1.

SynaptopHluorin reliably labels exocytotic events occurring in the growth cone. A, Image of a hippocampal growth cone transfected with SynaptopHluorin. Membrane domains with increased fluorescence appear in the central (arrows) and peripheral (arrowheads) domains. Images are shown in an inverted scale. B, Image sequence of the growth cone in A over a 27 s recording period. Fluorescent SynaptopHluorin-positive spots are dynamic and appear and disappear within the course of a few seconds. Arrows and arrowheads indicate different exocytotic events. C, Confocal images of a hippocampal growth cone with extracellular SynaptopHluorin (SpH) signals and the t-SNARE Syntaxin-1, showing almost complete colocalization. Right, Shows a magnification of boxed area in C showing marked colabeling (arrowheads). D, Confocal images of a hippocampal growth cone showing the distribution of extracellular SynaptopHluorin and the endocytic marker EEA1. Boxed areas are enlarged on the right. After labeling with a GFP antibody, live neurons were cultured for 30 min to allow possible retrieval of extracellular SynaptopHluorin. Note the low colocalization of the two proteins (arrows; arrowhead indicates partial colocalization). Scale bars: A, C, D, 5 μm.
Figure 2.
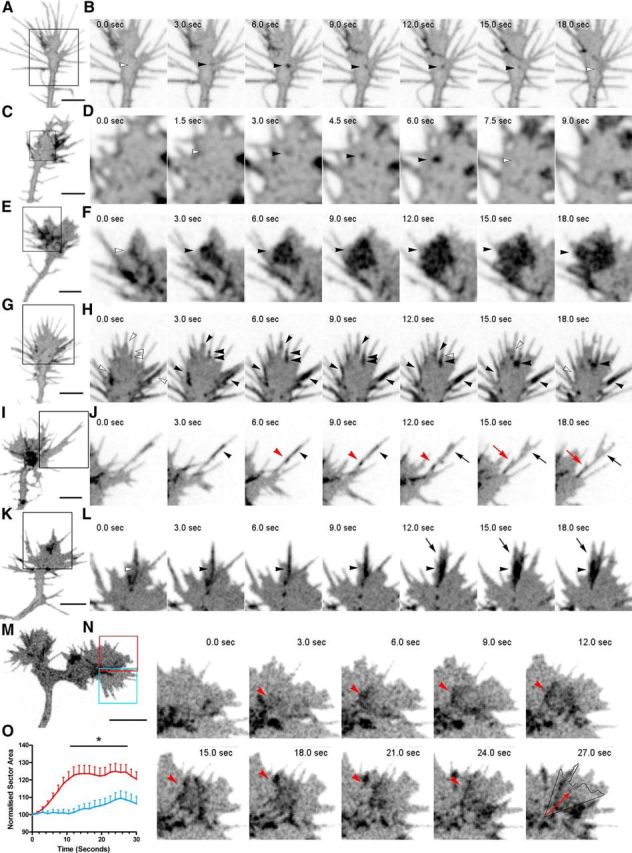
SynaptopHluorin imaging reveals distinct modes of exocytosis in the growth cone and in filopodia. A, B, Image of a hippocampal growth cone transfected with SynaptopHluorin (A) and image sequence of the boxed region in A (B). The sequence shows the appearance of a fluorescent spot (black arrowheads) in the central domain of the growth cone—possibly corresponding to a single vesicle—lasting for ∼12 s. C, D, Image of a hippocampal growth cone transfected with SynaptopHluorin (C) and image sequence of the boxed region in C (D). The sequence shows the appearance of a highly transient, fluorescent spot (arrowheads) in the central domain of the growth cone. E, F, Hippocampal growth cone transfected with SynaptopHluorin (E) and image sequence of the boxed region in E (F). The sequence shows the appearance of a large fluorescent cluster (black arrowheads) at the periphery of the growth cone (white arrowhead, left). G, H, Growth cone transfected with SynaptopHluorin (G) and image sequence of the boxed region in G (H). The sequence shows the appearance of fluorescent spots in numerous filopodia in a single growth cone, including the sequential appearance of several fluorescent spots along the shaft of a single filopodium (black arrowheads). White arrowheads label the location where exocytosis will take place. I, J, Image of a growth cone transfected with SynaptopHluorin (I) and image sequence of the boxed region in I (J). The sequence shows the appearance of two exocytotic events in a single filopodium (black and red arrowheads), followed by the branching of the filopodium next to the sites of increased fluorescence (black and red arrows). K, L, Growth cone transfected with SynaptopHluorin (K) and image sequence of the boxed region of K (L). The sequence shows the appearance of a large fluorescent spot (black arrowheads) within a filopodium, preceding a large membrane expansion (black arrows). M, N, Growth cone transfected with SynaptopHluorin (M) and image sequence of the red box in M (N). The blue boxed area represents a control region in the same growth cone displaying low exocytosis (see O). The sequence in N shows the appearance of a large fluorescent spot in the central domain of the growth cone (arrowhead at 3.0 s), which subsequently moves toward the periphery (arrowheads at 6.0 to 18.0 s), and the subsequent expansion of the growth cone in the same direction (18.0 to 24.0 s). The last image shows the outline of the growth cone at 0.0 s and the motion vector of the fluorescent spot (arrow). O, Quantification of the area of the growth cones in a 45° sector centered in the vector of movement of 10 random SynaptopHluorin events (red line) compared with control regions of the same growth cones exhibiting low exocytotic rates (blue). Data averages eight different growth cones. Data are means ± SEM, two-way ANOVA, and Bonferroni post hoc test. *p < 0.05. Scale bars: A, C, E, G, I, K, M, 5 μm.
Movie 1.
Growth cone transfected with SynaptopHluorin. The growth cone corresponds to Figure 1A and B.
Movie 2.
Massive exocytosis. Video recording corresponding to Figure 2E and F.
Movie 3.
Filopodial exocytosis and growth cone expansion. Video recording corresponding to Figure 2K and L.
The video recordings revealed that exocytotic events, visualized as intense fluorescent spots, were frequent in individual growth cones over time (Figs. 1 A,B, 2, Movie 1). These events generally involved one or several medium-sized spots (0.4–0.9 μm), which most likely correspond to single vesicle exocytosis. To confirm that such fluorescent spots corresponded to exocytotic events, we incubated living growth cones with an anti-GFP antibody to label luminal, extracellularly exposed SynaptopHluorin (at 4°C to minimize membrane endocytosis). When these growth cones were costained with the exocytotic protein Syntaxin-1, we found a virtual complete colocalization with SynaptopHluorin spots (Fig. 1C). Conversely, when such anti-GFP-labeled cones were immunostained with EEA1 antibodies to label the endocytotic compartment, there was no colocalization—a finding consistent with the intracellular localization of the endosomal compartment (data not shown). Finally, even when anti-GFP-labeled growth cones were returned to 37°C for 30 min to allow membrane internalization, there was very little colocalization of SynaptopHluorin and EEA1 protein (Fig. 1D). These data indicate that SynaptopHluorin signals correspond essentially to exocytotic events.
SynaptopHluorin signals were present throughout the growth cone, including the peripheral and central regions. The duration of single vesicle fluorescent spots was variable, with some visible over short ranges of time (∼1.5–4.5 s; Fig. 2A–D), and others lasting up to 15 s (Fig. 2G,H). In addition to single vesicle events, we also observed larger clusters of SynaptopHluorin-positive spots (size: ∼1.5–4.5 μm, duration 12–50 s) apposed to specific regions of the growth cone for varying lengths of time (Fig. 2E,F, Movies 1, 2). These clusters appeared to comprise several individual vesicular spots, suggesting that simultaneous mass exocytosis of vesicles also occurs in growth cones (Fig. 2E,F, Movie 2).
SynaptopHluorin-positive events were also frequently observed in filopodia often as clusters of single vesicles arranged longitudinally in a single filopodium (Fig. 2G–L, Movie 3). Interestingly, analyses of video recordings revealed that clusters of fluorescent spots often correlated with surface dynamic events, including the branching of filopodia and local surface expansion of growth cones (Fig. 2I–L, Movie 3). To substantiate these observations, we compared the expansion in areas of the same growth cones where SynaptopHluorin-positive events took place with cone regions with low SynaptopHluorin signals. Intense fluorescent events were found to correlate with local expansions (Fig. 2M,O).
The above data show that SynaptopHluorin can be used to efficiently monitor exocytotic events in growth cones with high spatiotemporal resolution and that exocytotic events are heterogeneous and occur in all domains of the cone, including filopodia.
Quantitative profiling of exocytotic events over time reveals spontaneous patterned transient increases in growth cones
To gain further insight into growth cone membrane dynamics, we developed a semiautomatic procedure to measure and quantify exocytotic events in living growth cones over time. The protocol segments the movies into binary images on the basis of the emission properties of SynaptopHluorin, isolating regions of the growth cone displaying fluorescent intensities above a defined threshold. Fluorescent areas, normalized to the total surface of the growth cone, were quantified and plotted over time (Fig. 3A,B, Movie 4). These fluorescent surface plots revealed that, rather than showing a uniform distribution over time, growth cones exhibited dynamic exocytotic events with an uneven spatiotemporal profile, in which peaks of high fluorescent signals, during which up to 20% of the growth cone showed elevated fluorescence, were followed by periods of low fluorescence (Fig. 3C–E). These SynaptopHluorin transients were observed in virtually all the control growth cones analyzed (n = 31), were variable both in amplitude and duration, and were detected over the entire recording periods (30 min). These findings support the notion that these transients reflect a robust, intrinsic property of growth cone dynamics.
Movie 4.
Image segmentation and processing. The movie shows the growth cone in Figure 3 together with the segmented images.
To further characterize the dynamics and patterns of the transients, we performed a custom-made semiautomatic quantitative analysis, in which we defined a peak as an increase in fluorescent area ≥20% within a given growth cone, as referred to the immediate previous minimum (Fig. 3F,G). We performed this analysis on 31 growth cones and recorded >3700 fluorescence peak transients. This approach allowed us to calculate peak frequency, duration, slope, and area. The frequency of SynaptopHluorin-positive peaks averaged 2.1 ± 1.8 per minute (range 0.2–5/min) and lasted for 28.4 ± 4.5 s (range 4.5–100 s). The peak amplitudes were also variable with ranges of 20–100 units (average 50.8 ± 6.1), as were the slopes of the increases in fluorescence (3–50; average: 8.4 ± 2; Fig. 3H–L). We thus conclude that SynaptopHluorin-positive events in growth cones do not occur steadily, but rather in a highly stereotyped manner, alternating peaks of high activity with periods of low exocytosis.
Exocytotic events were especially notable in the outer domain of the growth cones and in filopodia. We thus addressed whether the dynamics of these events differed between the peripheral and central domains of these structures (Fig. 4A, Movies 5, 6). With this aim, we subdivided the growth cones into central and peripheral domains using a custom-built macro in Fiji based on the erosion of the binary images corresponding to the outline of the growth cone (see Material and Methods). Exocytotic events were considered to take place at the periphery of the growth cone when they appeared at a distance of 0.5 μm or less from the growth cone edge or in filopodia (Fig. 4A–C, Movie 5). The remaining fluorescent events were considered to occur in the central domain (Fig. 4A,D,E, Movie 6). Both the qualitative examination of the SynaptopHluorin-positive profiles (Fig. 4F,G) and a quantitative analysis of optical recordings revealed that transient exocytotic peaks occurred in both compartments (peripheral and central) of the growth cone (Fig. 4F–L). However, peak frequencies and slopes were higher in the peripheral region (Fig. 4H,K), while peak duration and area were lower in the peripheral domain (Fig. 4J,L).
Figure 4.
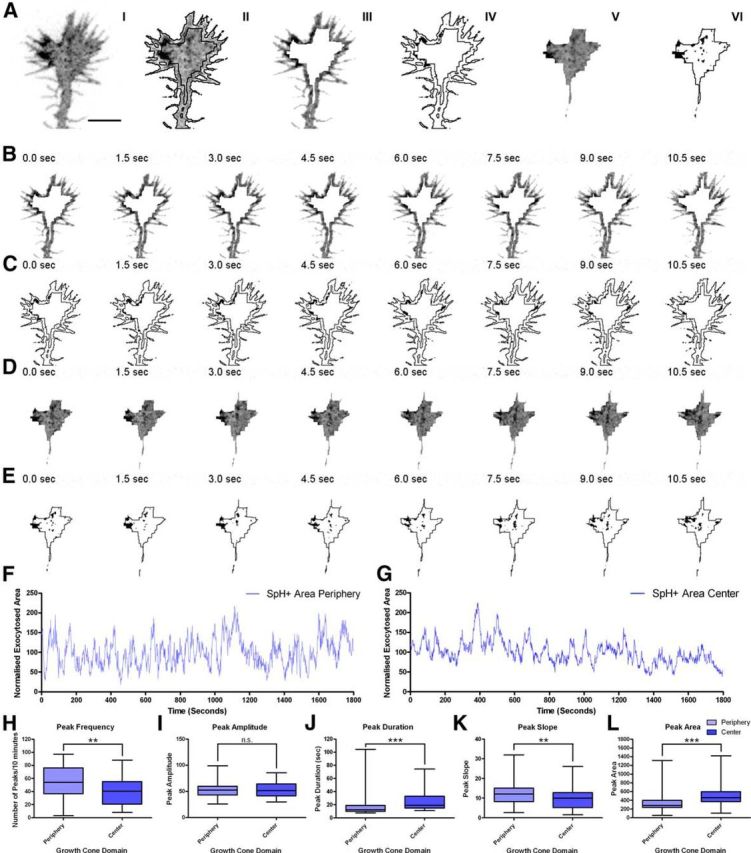
Analysis of exocytotic events in the central and peripheral domains of the growth cone. A, Dissection of the growth cone displayed in I into the peripheral (III) and central (V) domains. IV and VI show the respective segmented images. B, C, Image sequence (B) and the corresponding segmented images (C) of the peripheral domain of the growth cone in A. D, E, Image sequence (D) and the corresponding segmented images (E) of the central domain of the growth cone in A. F, Plot of fluorescent areas of the peripheral domain of the growth cone in A, normalized to the total area of the growth cone, plotted over time. G, Plot of fluorescent areas of the central domain of the growth cone in A, normalized to the total area of the growth cone, plotted over time (SpH+, SynaptopHluorin-positive). H–L, Quantification of the average peak frequency (H), amplitude (I), duration (J), slope (K), and area (L) in the central and peripheral domains of control growth cones recorded for 30 min. Mann–Whitney test. n.s., non-significant. **p < 0.01, ***p < 0.001.
Movie 5.
Image segmentation in the peripheral domain. Video recording of the peripheral domain of the growth cone in Figure 4 together with its segmented image.
Movie 6.
Image segmentation in the central domain. Video recording of the central domain of the growth cone in Figure 4 together with its segmented image.
These data demonstrate that although exocytosis occurs throughout the growth cone, overall exocytotic events and transient peaks are more active at the periphery of cones, including filopodia.
Netrin-1 elicits exocytosis in growth cones by increasing peak dynamics
To study the regulation of growth cone exocytosis by guidance cues, we imaged hippocampal neurons transfected with SynaptopHluorin over 30 min, after previous incubation with recombinant Netrin-1 or vehicle solution (Fig. 5). Qualitative evaluation of video recordings of individual growth cones and plots of SynaptopHluorin signals over time revealed that overall fluorescence signals increased in cones treated with Netrin-1. Thus, while the global characteristics of exocytosis in Netrin-1-treated cones did not differ significantly from those of controls (Fig. 5A–D), they appeared to be more dynamic; for instance, large groups of fluorescent vesicles, clustered within filopodia or near the outer edge of the cones, were frequently observed after exposure to Netrin-1 (Fig. 5C–F, Movie 7).
Figure 5.
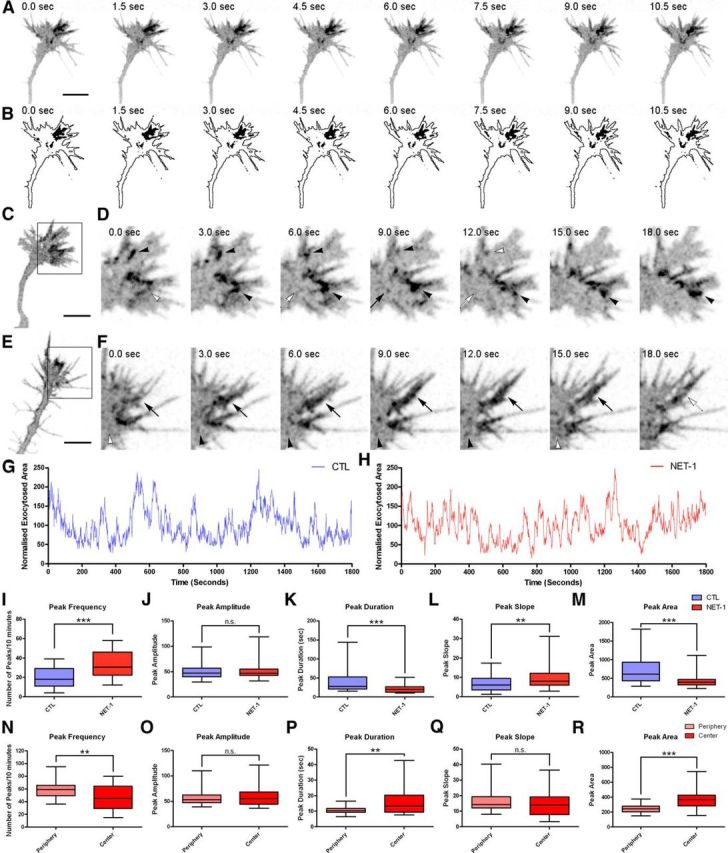
Quantitative profiling of exocytotic events in Netrin-1-treated growth cones transfected with SynaptopHluorin. A, Image sequence of a Netrin-1-treated growth cone transfected with SynaptopHluorin. B, Segmented images of the growth cone in A displaying the regions with fluorescence above a defined threshold, isolated from the outline of the growth cone. C, Image of a Netrin-1-treated hippocampal growth cone transfected with SynaptopHluorin. D, Image sequence of the boxed region in C. The image sequence shows the appearance of large fluorescent spots (black arrowheads) at the periphery of the growth cone and a fast single vesicle spot (arrow). E, Image of a Netrin-1-treated hippocampal growth cone transfected with SynaptopHluorin. F, Image sequence of the boxed region in E. The image sequence shows the appearance of several large fluorescent spots (black arrowheads) within filopodia. A particularly large fluorescent cluster is labeled by arrows. G, Plot of exocytotic events in a control growth cone over time. H, Plot of exocytotic events recorded in the growth cone incubated with Netrin-1 depicted in A. I–M, Quantification of the average peak frequency (I), amplitude (J), duration (K), slope (L), and area (M) in control and Netrin-1-treated growth cones recorded for 30 min. N–R, Quantification of the average peak frequency (N), amplitude (O), duration (P), slope (Q), and area (R) in the central and peripheral domains of Netrin-1-treated growth cones recorded for 30 min. Mann–Whitney test. n.s., non-significant. **p < 0.01, ***p < 0.001. Scale bars: A, C, E, 5 μm. CTL, control; NET-1, Netrin-1.
Movie 7.
Image segmentation of Netrin-1-treated growth cones. Movie corresponding to 2 min recording and the segmented image of the growth cone in Figure 5A and B.
Next, we plotted the exocytosed area of treated and untreated growth cones over time. Netrin-1 did not modify the overall profiles of fluorescence signals, in which increases and peaks were clearly visible (Fig. 5G,H, Movie 7). However, fluorescent transients appeared to be more evident after incubation with Netrin-1 than in control conditions (Fig. 5G,H). To further substantiate these findings, we quantitatively analyzed the dynamics and patterns of exocytotic events, as described above. Netrin-1 elicited a marked increase in peak frequencies and slopes, concomitantly with decreased peak durations and peak areas (Fig. 5I–M). Average peak amplitudes were similar in both groups (Fig. 5J). A similar quantitative evaluation, analyzing differentially exocytotic events occurring at the peripheral or central domains of growth cones, showed that both control and Netrin-1-treated growth cones are more active at the peripheral than at the central region (Fig. 5N–R).When all the SynaptopHluorin optical recordings corresponding to Netrin-1- or vehicle-incubated cones were plotted together, an overall increase of ∼25% in fluorescence was detected (Fig. 6A). Together, these findings indicate that, while Netrin-1 does not modify the overall pattern of SynaptopHluorin fluorescence (as defined by transient fluctuations), it does increase the frequency of peaks by ∼35% and their slopes by ∼20%, thus leading to an overall increase in SynaptopHluorin signals of ∼25%. These findings indicate that Netrin-1 triggers exocytosis in both the central and peripheral domains of developing growth cones.
Nerin-1-dependent exocytosis in growth cones requires Erk1/2 and Src family kinase activation
Several signaling pathways are activated by Netrin-1 binding to DCC receptors (Forcet et al., 2002; Campbell and Holt, 2003; Bashaw and Klein, 2010; Kolodkin and Tessier-Lavigne, 2011). To study the involvement of these pathways in Netrin-1-regulated exocytosis, we incubated growth cones with one of the following inhibitors for 15 min: SB203580, PP1, PP2, PD98059, or U0126 (Fig. 6B–N). Thereafter, cones were incubated with Netrin-1 or with vehicle solution, and the SynaptopHluorin profiles were analyzed. First, comparative analyses between control growth cones showed no effects of the drugs on baseline exocytosis (data not shown). While incubation with PP1 and PP2 (SFK inhibitors; Fig. 6G–J) or U0126 and PD98059 (Erk1/2 inhibitors; Fig. 6K–N) abolished Netrin-1-induced increases and peak frequencies in SynaptopHluorin signals, application of the p38 inhibitor SB203580 did not seem to alter the profiles of the SynaptopHluorin signals elicited by Netrin-1 (Fig. 6E,F). Furthermore, in our experimental conditions, we observed a local increase in the phosphorylation of Erk1/2 and Src in hippocampal growth cones after treatment with Netrin-1 (Fig. 6O).
These results suggest that the activation of Erk1/2 and SFK signaling pathways in hippocampal growth cones is required for Netrin-1 to trigger increases in SynaptopHluorin signals and thus in local exocytosis.
Correlation of SynaptopHluorin signals and calcium increases
To study whether SynaptopHluorin signals/fluctuations correlated with calcium increases/concentration, we simultaneously imaged SynaptopHluorin and calcium in growth cones by using the calcium sensor R-GECO1 (Zhao et al., 2011; Fig. 7). First, and consistent with previous studies (Nicol et al., 2011), we corroborated that Netrin-1 elicited an overall increase in calcium dynamics in growth cones (Fig. 7A). Next, we analyzed the profiles of both SynaptopHluorin and calcium signals over time in control and Netrin-1- treated growth cones, using the same quantitative approach as described above (Fig. 7B). We found that calcium concentration exhibited peak transients in growth cones and that the frequency of these transients increased following Netrin-1 incubation and paralleled the increase in peak frequency in SynaptopHluorin signals (Fig. 7A,B).
Figure 7.
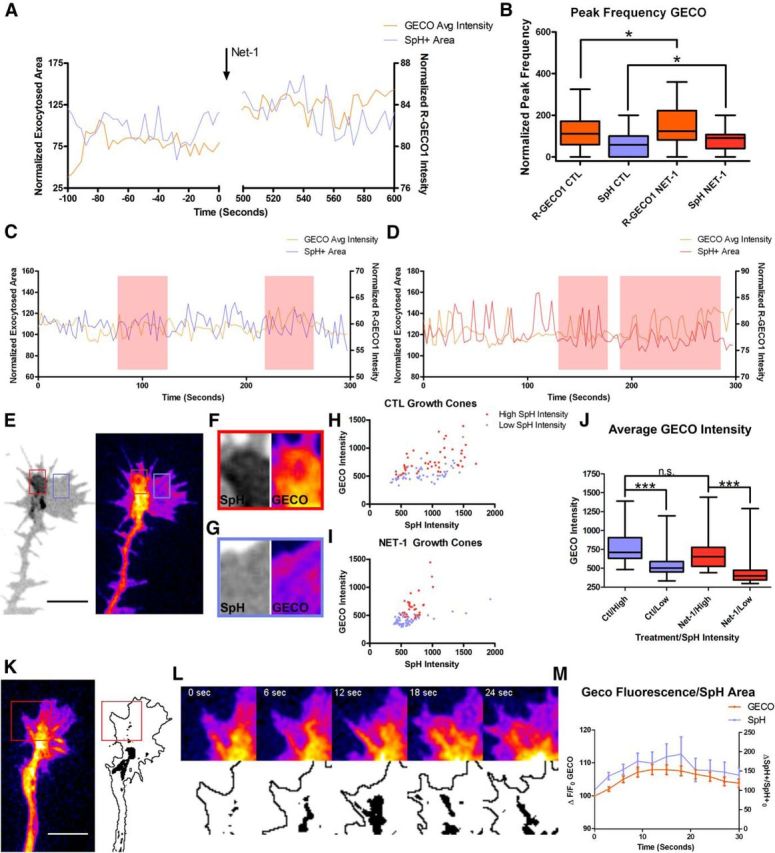
Calcium and membrane dynamics correlation in growth cones. A, Calcium (orange) and membrane (blue) dynamics in a representative growth cone before and after the addition of Netrin-1, measured using the indicators R-GECO1 and SynaptopHluorin, respectively. B, Comparison of R-GECO1 and SynaptopHluorin peak frequencies in control and Netrin-1-treated growth cones. C, D, Representative calcium (orange) and SynaptopHluorin (blue or red) traces in a control (C) and a Netrin-1-treated (D) growth cone, showing a parallel evolution of peaks. Horizontal lines above the raster show periods of apparent high correlation. E, Image of a growth cone imaged with SynaptopHluorin and RGECO-1 showing regions of high (red box) and low (blue box) SynaptopHluorin/RGECO-1 (the latter is pseudocolored in Fiji's “Fire” LUT). F, G, Magnification of the red and blue boxes in E. H, I, Scatterplots of the intensity of SynaptopHluorin signals (x-coordinate) and calcium signals (y-coordinate) in domains exhibiting high or low calcium concentrations in control (CTL; H) and Netrin-1-treated (NET-1; I) growth cones. J, Average intensities in calcium signals in cone areas depicting high and low SynaptopHluorin domains in Netrin-1 (red) and control (blue) growth cones. K, L, Image of a growth cone labeled with R-GECO1 (K) and image sequence of the evolution of R-GECO1 and SynaptopHluorin labeling over time (L). Note that local calcium domains correlate with high SynaptopHluorin signals. M, Average R-GECO1 and SynaptopHluorin correlated intensities (mean ± SEM, n = 35 calcium transients of 8 different growth cones) in cone domains displaying a local increase in calcium concentration, plotted over time. The image shows that the two processes occur simultaneously. Kruskal–Wallis with Dunn's post hoc test. n.s., non-significant. *p < 0.05, ***p < 0.001. CTL, control; NET-1, Netrin-1; SPH, SynaptopHluorin; GECO, R-GECO1.
Visual inspection of the raster plots suggested that some SynaptopHluorin peaks were correlated with calcium increases in growth cones in some periods but not in others (Fig. 7B,C). However, when all the raster plots were analyzed, we were unable to find a statistically positive correlation between the two peak events over time (Spearman correlation ρ = 0.085; p = 0.75).
We reasoned that this lack of statistical correlation might be due to an uneven distribution of SynaptopHluorin and calcium signals within domains of the growth cone. We thus compared calcium concentrations in regions of the growth cone exhibiting high SynaptopHluorin signals with domains of the same cones exhibiting low SynaptopHluorin signals (Fig. 7E–G). Our results indicate that cone regions with high SynaptopHluorin signals were highly correlated with cone domains exhibiting a high calcium concentration, in both control and Netrin-1-treated cones (Fig. 7H–J). Furthermore, we analyzed the evolution of SynaptopHluorin-positive areas in regions of the growth cone that showed a transient increase in calcium concentration (Fig. 7K–M). We found that SynaptopHluorin-positive areas often evolved in parallel to dynamic calcium-rich domains (Fig. 7K–M). These findings indicate that local calcium increases in discrete domains of the growth cone may be regulating the exocytosis of SynaptopHluorin-positive vesicles in response to Netrin-1.
Discussion
Growth cone-driven axonal extension and guidance are essential for the formation of neural circuits, and thus for correct neural functioning. In addition to signaling pathways that lead to the stabilization of cytoskeletal components, mechanisms controlling membrane dynamics and extension through exocytosis and endocytosis are essential for axonal growth. Thus, it has been proposed that while axonal chemoattraction requires exocytosis, growth cone collapse and chemorepulsion rely mainly on endocytotic events (Tojima et al., 2007, 2010, 2011; Cotrufo et al., 2011, 2012; Zylbersztejn et al., 2012). Membrane markers (e.g., FM1–43 and Dextran) have allowed end point determination of cone exocytosis (Pfenninger et al., 2003; Cotrufo et al., 2011). Furthermore, recent studies using pHluorins have reported eventual single vesicle fusion events in growth cones (Tojima et al., 2007, 2010; Burgo et al., 2012; Nakazawa et al., 2012). However, how and where these exocytotic events occur in these structures and their overall dynamics over time remains unknown. In the present study, the use of SynaptopHluorin, high spatiotemporal resolution optical recordings over long times, and custom-designed analysis tools have allowed us to continuously monitor and analyze membrane dynamics in growth cones for long periods.
We show that exocytotic events take place along the entire extension and domains of growth cones, but with a marked predominance in the peripheral domain; indeed, our recordings show that both single vesicle events and simultaneous exocytosis of clusters of vesicles occur, suggesting that membrane addition and extension in growth cones is mediated by diverse mechanisms, including the exocytosis of single vesicles and in bulk exocytosis of small vesicles or other vesicular components (Hines et al., 2012). The observation that exocytotic events associate with dynamic structures such as lamellipodia and filopodia highlight the link between the regulation of the actin cytoskeleton and membrane exocytosis (Skalski et al., 2010; Veale et al., 2011). Interestingly, our data demonstrate that individual filopodia are a preferential region for exocytosis, which often correlates with filopodial expansion or branching. This finding is consistent with previous studies reporting that vesicles are present in filopodia and may indicate that vesicles destined to filopodia can be rapidly transported from the central domain to the periphery of growth cones or can belong to the filopodial pool to undergo fast exocytosis (Kraszewski et al., 1995; Tojima et al., 2007; Pfenninger, 2009). Our results support the notion that filopodia are not only domains that recognize the extracellular “milieu,” but also preferential regions for local exocytosis, thus consolidating axonal extension and growth.
Our analysis of overall exocytotic events over time showed that, rather than being constant or random, growth cone exocytosis displayed highly complex and stereotyped dynamics with peaks of maximal activity followed by periods of low exocytosis. These transients occurred spontaneously and were present in all the growth cones examined, thus indicating that such a patterned exocytosis is a robust feature intrinsic to these cones. The transients occurred in both peripheral and central domains, and are especially conspicuous in the outer regions, including filopodia. The peaking profiles of SynaptopHluorin transients resembled the increases in calcium—necessary for both axonal extension and exocytosis (Lipscombe et al., 1988; Henley and Poo, 2004; Ooashi et al., 2005)—which take place in growth cones and the spontaneous calcium oscillations that occur in most developing neurons (Yuste et al., 1994; Peterlin et al., 2000; Gomez et al., 2001; Aguado et al., 2002; Tang et al., 2003; Ruffinatti et al., 2013). Furthermore, the frequency and duration of the growth cone transients described here are in the range of the spontaneous calcium spikes described in young hippocampal neurons (Aguado et al., 2003). These similarities raise the possibility that these two spontaneous processes are correlated, with spontaneous calcium transients leading to cell body spikes and calcium increases in distal parts of developing neurons, including growth cones (Nicol et al., 2011; Plazas et al., 2013). However, despite confirming the existence of spontaneous calcium transients in growth cones and their regulation by Netrin-1, we were unable to detect an overall statistical correlation between SynaptopHluorin and calcium signals when whole growth cones were analyzed (Fig. 7). In contrast, growth cone microdomains exhibiting high SynaptopHluorin signals were strongly correlated with high calcium concentrations and, conversely, regions of the same growth cones with low SynaptopHluorin signals exhibited low calcium concentrations. Furthermore, we describe that local calcium transients and SynaptopHluorin events occur within the same domain of the growth cone in an intrinsic fashion (Tojima et al., 2007), and that the rise in SynaptopHluorin signals correlates with directed expansions of the growth cone membrane. These data suggest that local exocytosis in growth cones is controlled by local increases in calcium in specific growth cone domains rather than by overall calcium concentrations.
Our results, showing Netrin-1-dependent exocytotic increases using SynaptopHluorin probes, support previous reports that this chemoattractant increases the exocytosis of both DCC-containing vesicles and BODIPY-ceramide-loaded vesicles (Bouchard et al., 2004; Cotrufo et al., 2011). Furthermore, SynaptopHluorin recordings allowed us to study how Netrin-1 alters the dynamics and patterns of exocytotic events in growth cones. Interestingly, Netrin-1 did not modify the highly stereotyped, peaking pattern of exocytotic events in the growth cones, even after continuous incubation with this molecule. This observation reinforces the notion that transient exocytotic profiles are a robust feature of these cones. We observed that Netrin-1 leads to an overall increase of 25% in SynaptopHluorin-positive domains, increasing peak frequency by 30% and peak slopes by 20%. This chemoattractant elicited increased exocytosis both in the peripheral and central domains of growth cones. It is also noteworthy that Netrin-1 has been described to increase local calcium concentrations in growth cones and that such transients are required for chemoattraction (Tang et al., 2003; Nishiyama et al., 2008; Tojima et al., 2011). The present study supports these data by showing that Netrin-1 increases the frequency of calcium rises in growth cones of hippocampal neurons paralleling the increase in SynaptopHluorin signals (Fig. 7). Moreover, our data reveal that, in Netrin-1-treated cones, domains with high SynaptopHluorin signals are highly correlated with local increases in calcium, and that local increments of calcium and SynaptopHluorin co-evolve. These observations are, again, in accordance with data reporting that Netrin-1 induces local increases in the frequency of filopodial calcium transients (Nicol et al., 2011). Although further experiments with pharmacological calcium tools would be required to fully understand the relationship between calcium and exocytosis upon Netrin-1 incubation, our data suggest that Netrin-1 elicits increases in calcium transients, which may result in higher rates of exocytosis. However, in our hands incubation with these compounds (e.g., BAPTA-AM, ionomycin, calcimycin, thapsigargin, and EDTA), together with imaging of both RGECO-1 and SynaptopHluorin, resulted in a fast collapse of growth cones in all experiments and conditions, precluding the analysis of these experiments. Moreover, our findings indicate that, rather than modifying stereotyped patterns of exocytosis, Netrin-1 exacerbates intrinsically determined patterns of membrane dynamics and exocytosis, as it occurs with calcium.
Netrin-1-regulated axonal guidance has been consistently found to be dependent on the activation of the Erk1/2 and SFKs pathways (Forcet et al., 2002; Li et al., 2004; Liu et al., 2004; Ren et al., 2004). p38 activation has been reported to be required for Netrin-1 signaling in some neural systems, but not in others (Forcet et al., 2002; Campbell and Holt, 2003). Our results support the above studies and the notion that Netrin-1-regulated exocytosis in hippocampal axonal growth cones depends upon the activation of the Erk1/2 and SFK pathways, whereas p38 signaling may be dispensable. By blocking Netrin-1-regulated exocytosis by pharmacological inhibition of Netrin-1-dependent pathways, our data support both the specificity of the observed effects of Netrin-1 and the possible involvement of these signaling pathways in Netrin-1-regulated exocytosis.
In conclusion, our observations reveal that growth cones show patterned exocytosis, which is positively regulated by the chemoattractant Netrin-1. Together with findings demonstrating exocytotic events in neuronal domains other than nerve terminals, such as dendritic spines (Yuste et al., 1994; Kennedy et al., 2010; Meldolesi, 2011), our results highlight the coexistence of distinct exocytotic dynamics in specialized domains of the same neurons. Finally, we propose that the spontaneous and patterned exocytotic activity described herein may provide a mechanistic basis for the intrinsically determined, rapid growth of axons and its regulation by growth-promoting molecules.
Notes
Supplemental material for this article is available at http://www.ub.edu/biocel/wp-content/uploads/2015/02/RosSorianoJNeurosciJN-RM-0124-14SupplMaterial.zip. Material for supplemental movie files has not been peer reviewed.
Footnotes
This work was supported by grants from the MICINN/MINECO and MSC (BFU2008-03980; SAF2013-42445R, and PND2010-149) to E.S. We thank Sara E. Rubio, Giulia Fuschini, and Fernando Aguado for discussion; Julien Colombelli, Sebastien Tosi, Lídia Bardia, and Jordi Hernández for technical assistance and comments; and Tanya Yates for editorial help.
The authors declare no competing financial interests.
References
- Aguado F, Espinosa-Parrilla JF, Carmona MA, Soriano E. Neuronal activity regulates correlated network properties of spontaneous calcium transients in astrocytes in situ. J Neurosci. 2002;22:9430–9444. doi: 10.1523/JNEUROSCI.22-21-09430.2002. [DOI] [PMC free article] [PubMed] [Google Scholar]
- Aguado F, Carmona MA, Pozas E, Aguilo A, Martínez-Guijarro FJ, Alcantara S, Borrell V, Yuste R, Ibañez CF, Soriano E. BDNF regulates spontaneous correlated activity at early developmental stages by increasing synaptogenesis and expression of the K+/Cl- co-transporter KCC2. Development. 2003;130:1267–1280. doi: 10.1242/dev.00351. [DOI] [PubMed] [Google Scholar]
- Bashaw GJ, Klein R. Signaling from axon guidance receptors. Cold Spring Harb Perspect Biol. 2010;2:a001941. doi: 10.1101/cshperspect.a001941. [DOI] [PMC free article] [PubMed] [Google Scholar]
- Bouchard JF, Moore SW, Tritsch NX, Roux PP, Shekarabi M, Barker PA, Kennedy TE. Protein kinase A activation promotes plasma membrane insertion of DCC from an intracellular pool: a novel mechanism regulating commissural axon extension. J Neurosci. 2004;24:3040–3050. doi: 10.1523/JNEUROSCI.4934-03.2004. [DOI] [PMC free article] [PubMed] [Google Scholar]
- Bouchard JF, Horn KE, Stroh T, Kennedy TE. Depolarization recruits DCC to the plasma membrane of embryonic cortical neurons and enhances axon extension in response to netrin-1. J Neurochem. 2008;107:398–417. doi: 10.1111/j.1471-4159.2008.05609.x. [DOI] [PubMed] [Google Scholar]
- Burgo A, Proux-Gillardeaux V, Sotirakis E, Bun P, Casano A, Verraes A, Liem RK, Formstecher E, Coppey-Moisan M, Galli T. A molecular network for the transport of the TI-VAMP/VAMP7 vesicles from cell center to periphery. Dev Cell. 2012;23:166–180. doi: 10.1016/j.devcel.2012.04.019. [DOI] [PubMed] [Google Scholar]
- Campbell DS, Holt CE. Apoptotic pathway and MAPKs differentially regulate chemotropic responses of retinal growth cones. Neuron. 2003;37:939–952. doi: 10.1016/S0896-6273(03)00158-2. [DOI] [PubMed] [Google Scholar]
- Chernyshova Y, Leshchyns'ka I, Hsu SC, Schachner M, Sytnyk V. The neural cell adhesion molecule promotes FGFR-dependent phosphorylation and membrane targeting of the exocyst complex to induce exocytosis in growth cones. J Neurosci. 2011;31:3522–3535. doi: 10.1523/JNEUROSCI.3109-10.2011. [DOI] [PMC free article] [PubMed] [Google Scholar]
- Condeelis J, Singer RH, Segall JE. The great escape: when cancer cells hijack the genes for chemotaxis and motility. Annu Rev Cell Dev Biol. 2005;21:695–718. doi: 10.1146/annurev.cellbio.21.122303.120306. [DOI] [PubMed] [Google Scholar]
- Cotrufo T, Pérez-Branguli F, Muhaisen A, Ros O, Andrés R, Baeriswyl T, Fuschini G, Tarrago T, Pascual M, Ureña J, Blasi J, Giralt E, Stoeckli ET, Soriano E. A signaling mechanism coupling netrin-1/deleted in colorectal cancer chemoattraction to SNARE-mediated exocytosis in axonal growth cones. J Neurosci. 2011;31:14463–14480. doi: 10.1523/JNEUROSCI.3018-11.2011. [DOI] [PMC free article] [PubMed] [Google Scholar]
- Cotrufo T, Andrés RM, Ros O, Pérez-Branguli F, Muhaisen A, Fuschini G, Martínez R, Pascual M, Comella JX, Soriano E. Syntaxin 1 is required for DCC/Netrin-1-dependent chemoattraction of migrating neurons from the lower rhombic lip. Eur J Neurosci. 2012;36:3152–3164. doi: 10.1111/j.1460-9568.2012.08259.x. [DOI] [PubMed] [Google Scholar]
- Del Río JA, González-Billault C, Ureña JM, Jiménez EM, Barallobre MJ, Pascual M, Pujadas L, Simó S, La Torre A, Wandosell F, Avila J, Soriano E. MAP1B is required for Netrin 1 signaling in neuronal migration and axonal guidance. Curr Biol. 2004;14:840–850. doi: 10.1016/j.cub.2004.04.046. [DOI] [PubMed] [Google Scholar]
- Dent EW, Barnes AM, Tang F, Kalil K. Netrin-1 and semaphorin 3A promote or inhibit cortical axon branching, respectively, by reorganization of the cytoskeleton. J Neurosci. 2004;24:3002–3012. doi: 10.1523/JNEUROSCI.4963-03.2004. [DOI] [PMC free article] [PubMed] [Google Scholar]
- Forcet C, Stein E, Pays L, Corset V, Llambi F, Tessier-Lavigne M, Mehlen P. Netrin-1-mediated axon outgrowth requires deleted in colorectal cancer-dependent MAPK activation. Nature. 2002;417:443–447. doi: 10.1038/nature748. [DOI] [PubMed] [Google Scholar]
- Gomez TM, Robles E, Poo M, Spitzer NC. Filopodial calcium transients promote substrate-dependent growth cone turning. Science. 2001;291:1983–1987. doi: 10.1126/science.1056490. [DOI] [PubMed] [Google Scholar]
- Henley J, Poo MM. Guiding neuronal growth cones using Ca2+ signals. Trends Cell Biol. 2004;14:320–330. doi: 10.1016/j.tcb.2004.04.006. [DOI] [PMC free article] [PubMed] [Google Scholar]
- Hines JH, Henle SJ, Carlstrom LP, Abu-Rub M, Henley JR. Single vesicle imaging indicates distinct modes of rapid membrane retrieval during nerve growth. BMC Biol. 2012;10:4. doi: 10.1186/1741-7007-10-4. [DOI] [PMC free article] [PubMed] [Google Scholar]
- Igarashi M, Kozaki S, Terakawa S, Kawano S, Ide C, Komiya Y. Growth cone collapse and inhibition of neurite growth by botulinum neurotoxin C1: a t-SNARE is involved in axonal growth. J Cell Biol. 1996;134:205–215. doi: 10.1083/jcb.134.1.205. [DOI] [PMC free article] [PubMed] [Google Scholar]
- Kennedy MJ, Davison IG, Robinson CG, Ehlers MD. Syntaxin-4 defines a domain for activity-dependent exocytosis in dendritic spines. Cell. 2010;141:524–535. doi: 10.1016/j.cell.2010.02.042. [DOI] [PMC free article] [PubMed] [Google Scholar]
- Kolodkin AL, Tessier-Lavigne M. Mechanisms and molecules of neuronal wiring: a primer. Cold Spring Harb Perspect Biol. 2011;3:a001727. doi: 10.1101/cshperspect.a001727. [DOI] [PMC free article] [PubMed] [Google Scholar]
- Kraszewski K, Mundigl O, Daniell L, Verderio C, Matteoli M, De Camilli P. Synaptic vesicle dynamics in living cultured hippocampal neurons visualized with CY3-conjugated antibodies directed against the lumenal domain of synaptotagmin. J Neurosci. 1995;15:4328–4342. doi: 10.1523/JNEUROSCI.15-06-04328.1995. [DOI] [PMC free article] [PubMed] [Google Scholar]
- Leung KM, van Horck FP, Lin AC, Allison R, Standart N, Holt CE. Asymmetrical beta-actin mRNA translation in growth cones mediates attractive turning to netrin-1. Nat Neurosci. 2006;9:1247–1256. doi: 10.1038/nn1775. [DOI] [PMC free article] [PubMed] [Google Scholar]
- Li W, Lee J, Vikis HG, Lee SH, Liu G, Aurandt J, Shen TL, Fearon ER, Guan JL, Han M, Rao Y, Hong K, Guan KL. Activation of FAK and Src are receptor-proximal events required for netrin signaling. Nat Neurosci. 2004;7:1213–1221. doi: 10.1038/nn1329. [DOI] [PMC free article] [PubMed] [Google Scholar]
- Lipscombe D, Madison DV, Poenie M, Reuter H, Tsien RY, Tsien RW. Spatial distribution of calcium channels and cytosolic calcium transients in growth cones and cell bodies of sympathetic neurons. Proc Natl Acad Sci U S A. 1988;85:2398–2402. doi: 10.1073/pnas.85.7.2398. [DOI] [PMC free article] [PubMed] [Google Scholar]
- Liu G, Beggs H, Jürgensen C, Park HT, Tang H, Gorski J, Jones KR, Reichardt LF, Wu J, Rao Y. Netrin requires focal adhesion kinase and Src family kinases for axon outgrowth and attraction. Nat Neurosci. 2004;7:1222–1232. doi: 10.1038/nn1331. [DOI] [PMC free article] [PubMed] [Google Scholar]
- Ly A, Nikolaev A, Suresh G, Zheng Y, Tessier-Lavigne M, Stein E. DSCAM is a netrin receptor that collaborates with DCC in mediating turning responses to netrin-1. Cell. 2008;133:1241–1254. doi: 10.1016/j.cell.2008.05.030. [DOI] [PMC free article] [PubMed] [Google Scholar]
- Martinez-Arca S, Alberts P, Zahraoui A, Louvard D, Galli T. Role of tetanus neurotoxin insensitive vesicle-associated membrane protein (TI-VAMP) in vesicular transport mediating neurite outgrowth. J Cell Biol. 2000;149:889–900. doi: 10.1083/jcb.149.4.889. [DOI] [PMC free article] [PubMed] [Google Scholar]
- Meldolesi J. Neurite outgrowth: this process, first discovered by Santiago Ramon y Cajal, is sustained by the exocytosis of two distinct types of vesicles. Brain Res Rev. 2011;66:246–255. doi: 10.1016/j.brainresrev.2010.06.004. [DOI] [PubMed] [Google Scholar]
- Miesenböck G, De Angelis DA, Rothman JE. Visualizing secretion and synaptic transmission with pH-sensitive green fluorescent proteins. Nature. 1998;394:192–195. doi: 10.1038/28190. [DOI] [PubMed] [Google Scholar]
- Nakazawa H, Sada T, Toriyama M, Tago K, Sugiura T, Fukuda M, Inagaki N. Rab33a mediates anterograde vesicular transport for membrane exocytosis and axon outgrowth. J Neurosci. 2012;32:12712–12725. doi: 10.1523/JNEUROSCI.0989-12.2012. [DOI] [PMC free article] [PubMed] [Google Scholar]
- Nicol X, Hong KP, Spitzer NC. Spatial and temporal second messenger codes for growth cone turning. Proc Natl Acad Sci U S A. 2011;108:13776–13781. doi: 10.1073/pnas.1100247108. [DOI] [PMC free article] [PubMed] [Google Scholar]
- Nishiyama M, von Schimmelmann MJ, Togashi K, Findley WM, Hong K. Membrane potential shifts caused by diffusible guidance signals direct growth-cone turning. Nat Neurosci. 2008;11:762–771. doi: 10.1038/nn.2130. [DOI] [PubMed] [Google Scholar]
- Ooashi N, Futatsugi A, Yoshihara F, Mikoshiba K, Kamiguchi H. Cell adhesion molecules regulate Ca2+-mediated steering of growth cones via cyclic AMP and ryanodine receptor type 3. J Cell Biol. 2005;170:1159–1167. doi: 10.1083/jcb.200503157. [DOI] [PMC free article] [PubMed] [Google Scholar]
- Peterlin ZA, Kozloski J, Mao BQ, Tsiola A, Yuste R. Optical probing of neuronal circuits with calcium indicators. Proc Natl Acad Sci U S A. 2000;97:3619–3624. doi: 10.1073/pnas.97.7.3619. [DOI] [PMC free article] [PubMed] [Google Scholar]
- Pfenninger KH. Plasma membrane expansion: a neuron's Herculean task. Nat Rev Neurosci. 2009;10:251–261. doi: 10.1038/nrn2593. [DOI] [PubMed] [Google Scholar]
- Pfenninger KH, Laurino L, Peretti D, Wang X, Rosso S, Morfini G, Cáceres A, Quiroga S. Regulation of membrane expansion at the nerve growth cone. J Cell Sci. 2003;116:1209–1217. doi: 10.1242/jcs.00285. [DOI] [PubMed] [Google Scholar]
- Plazas PV, Nicol X, Spitzer NC. Activity-dependent competition regulates motor neuron axon pathfinding via PlexinA3. Proc Natl Acad Sci U S A. 2013;110:1524–1529. doi: 10.1073/pnas.1213048110. [DOI] [PMC free article] [PubMed] [Google Scholar]
- Ramón y Cajal S. Histologie du système nerveux de l'homme et des vertébrés. Paris: Maloine; 1909. [Google Scholar]
- Ren XR, Ming GL, Xie Y, Hong Y, Sun DM, Zhao ZQ, Feng Z, Wang Q, Shim S, Chen ZF, Song HJ, Mei L, Xiong WC. Focal adhesion kinase in netrin-1 signaling. Nat Neurosci. 2004;7:1204–1212. doi: 10.1038/nn1330. [DOI] [PubMed] [Google Scholar]
- Round J, Stein E. Netrin signaling leading to directed growth cone steering. Curr Opin Neurobiol. 2007;17:15–21. doi: 10.1016/j.conb.2007.01.003. [DOI] [PubMed] [Google Scholar]
- Ruffinatti FA, Gilardino A, Lovisolo D, Ferraro M. Spatial wavelet analysis of calcium oscillations in developing neurons. PLoS One. 2013;8:e75986. doi: 10.1371/journal.pone.0075986. [DOI] [PMC free article] [PubMed] [Google Scholar]
- Sabo SL, McAllister AK. Mobility and cycling of synaptic protein-containing vesicles in axonal growth cone filopodia. Nat Neurosci. 2003;6:1264–1269. doi: 10.1038/nn1149. [DOI] [PubMed] [Google Scholar]
- Skalski M, Yi Q, Kean MJ, Myers DW, Williams KC, Burtnik A, Coppolino MG. Lamellipodium extension and membrane ruffling require different SNARE-mediated trafficking pathways. BMC Cell Biol. 2010;11:62. doi: 10.1186/1471-2121-11-62. [DOI] [PMC free article] [PubMed] [Google Scholar]
- Tang F, Dent EW, Kalil K. Spontaneous calcium transients in developing cortical neurons regulate axon outgrowth. J Neurosci. 2003;23:927–936. doi: 10.1523/JNEUROSCI.23-03-00927.2003. [DOI] [PMC free article] [PubMed] [Google Scholar]
- Tcherkezian J, Brittis PA, Thomas F, Roux PP, Flanagan JG. Transmembrane receptor DCC associates with protein synthesis machinery and regulates translation. Cell. 2010;141:632–644. doi: 10.1016/j.cell.2010.04.008. [DOI] [PMC free article] [PubMed] [Google Scholar]
- Tessier-Lavigne M, Goodman CS. The molecular biology of axon guidance. Science. 1996;274:1123–1133. doi: 10.1126/science.274.5290.1123. [DOI] [PubMed] [Google Scholar]
- Tojima T. Intracellular signaling and membrane trafficking control bidirectional growth cone guidance. Neurosci Res. 2012;73:269–274. doi: 10.1016/j.neures.2012.05.010. [DOI] [PubMed] [Google Scholar]
- Tojima T, Akiyama H, Itofusa R, Li Y, Katayama H, Miyawaki A, Kamiguchi H. Attractive axon guidance involves asymmetric membrane transport and exocytosis in the growth cone. Nat Neurosci. 2007;10:58–66. doi: 10.1038/nn1814. [DOI] [PubMed] [Google Scholar]
- Tojima T, Itofusa R, Kamiguchi H. Asymmetric clathrin-mediated endocytosis drives repulsive growth cone guidance. Neuron. 2010;66:370–377. doi: 10.1016/j.neuron.2010.04.007. [DOI] [PubMed] [Google Scholar]
- Tojima T, Hines JH, Henley JR, Kamiguchi H. Second messengers and membrane trafficking direct and organize growth cone steering. Nat Rev Neurosci. 2011;12:191–203. doi: 10.1038/nrn2996. [DOI] [PMC free article] [PubMed] [Google Scholar]
- Veale KJ, Offenhäuser C, Murray RZ. The role of the recycling endosome in regulating lamellipodia formation and macrophage migration. Commun Integr Biol. 2011;4:44–47. doi: 10.4161/cib.13569. [DOI] [PMC free article] [PubMed] [Google Scholar]
- Yuan XB, Jin M, Xu X, Song YQ, Wu CP, Poo MM, Duan S. Signalling and crosstalk of Rho GTPases in mediating axon guidance. Nat Cell Biol. 2003;5:38–45. doi: 10.1038/ncb895. [DOI] [PubMed] [Google Scholar]
- Yuste R, Gutnick MJ, Saar D, Delaney KR, Tank DW. Ca2+ accumulations in dendrites of neocortical pyramidal neurons: an apical band and evidence for two functional compartments. Neuron. 1994;13:23–43. doi: 10.1016/0896-6273(94)90457-X. [DOI] [PubMed] [Google Scholar]
- Zhao Y, Araki S, Wu J, Teramoto T, Chang YF, Nakano M, Abdelfattah AS, Fujiwara M, Ishihara T, Nagai T, Campbell RE. An expanded palette of genetically encoded Ca(2)(+) indicators. Science. 2011;333:1888–1891. doi: 10.1126/science.1208592. [DOI] [PMC free article] [PubMed] [Google Scholar]
- Zylbersztejn K, Petkovic M, Burgo A, Deck M, Garel S, Marcos S, Bloch-Gallego E, Nothias F, Serini G, Bagnard D, Binz T, Galli T. The vesicular SNARE Synaptobrevin is required for Semaphorin 3A axonal repulsion. J Cell Biol. 2012;196:37–46. doi: 10.1083/jcb.201106113. [DOI] [PMC free article] [PubMed] [Google Scholar]