

Abstract
The acquisition of distinct neuronal fates is fundamental for the function of the cerebral cortex. We find that the development of subcerebral projections from layer 5 neurons in the mouse neocortex depends on the high levels of expression of the transcription factor CTIP1; CTIP1 is coexpressed with CTIP2 in neurons that project to subcerebral targets and with SATB2 in those that project to the contralateral cortex. CTIP1 directly represses Tbr1 in layer 5, which appears as a critical step for the acquisition of the subcerebral fate. In contrast, lower levels of CTIP1 in layer 6 are required for TBR1 expression, which directs the corticothalamic fate. CTIP1 does not appear to play a critical role in the acquisition of the callosal projection fate in layer 5. These findings unravel a key step in the acquisition of cell fate for closely related corticofugal neurons and indicate that differential dosages of transcriptions factors are critical to specify different neuronal identities.
Keywords: cerebral cortex, CTIP1, CTIP2, in utero electroporation, subcerebral projection neurons, TBR1
Introduction
The specification of projection neurons (PN) of the cerebral neocortex relies on combinatorial codes of gene expression (Srinivasan et al., 2012; Greig et al., 2013). Neocortical PNs can be classified as corticofugal projection neurons (CfuPN), which reside in layers 5 and 6, and send their axons away from the cortex, and intracortical projection neurons, which send their axons to ipsilateral or contralateral cortex (mainly via the corpus callosum) and are found mostly within layers 2/3, as well as in layer 5. CfuPN neurons comprise corticothalamic neurons, with cell bodies located in layer 6 that project their axons toward the thalamus and subcerebral projection neurons (SCPNs), with cell bodies confined to layer 5, which project axons toward caudal targets, including the spinal cord (Molyneaux et al., 2007). The specification of the closely related CfuPN population appears to result from mutual inhibitory relationships established at least in part by the transcription factors (TFs) FEZF2 (also ZFP312/FEZL), CTIP2 (also BCL11b), and TBR1 (Chen et al., 2008; Han et al., 2011; McKenna et al., 2011). FEZF2 and CTIP2 are expressed at high levels in layer 5 SCPNs and at low levels in layer 6 neurons. FEZF2 and CTIP2 are required to regulate the identity and projection patterns of SCPNs, as evidenced by the loss of the subcerebral projecting axons (SCPAs) in both Fezf2 and Ctip2 knock-out (KO) mice. The absence of high CTIP2 expression in layer 5 PNs in Fezf2 KO mice and the rescue of SCPA defects by restoring CTIP2 expression suggest that CTIP2 is an important downstream regulator of SCPN development (Arlotta et al., 2005; Chen et al., 2005a,b, 2008; Molyneaux et al., 2005). In contrast to FEZF2 and CTIP2, TBR1 is highly expressed in layer 6 neurons and promotes the specification of corticothalamic neurons, possibly through the inhibition of the FEZF2-CTIP2 pathway (Han et al., 2011; McKenna et al., 2011). Moreover, previous data suggest that the transcriptional repression of TBR1 in layer 5 PNs appears to be a key step in the specification of SCPNs, as the loss of SCPAs observed in Fezf2 KO mice is accompanied of a rise in TBR1 expression suggesting a repressive role of FEZF2 over TBR1 expression. Furthermore, overexpression of TBR1 in these neurons is sufficient to prevent the development of SCPAs through Fezf2 repression (Han et al., 2011; McKenna et al., 2011).
Here we show that CTIP1 (also BCL11a/EVI9), a transcriptional repressor with unknown function in the cerebral cortex, is highly expressed in layer 5 neurons and regulates the development of SCPNs through the repression of Tbr1 gene, as the in vivo decrease of CTIP1 expression in layer 5 PNs led to an increase in TBR1, a decrease of CTIP2 and the loss of SCPAs. Since a marked difference in CTIP1 expression between neurons in layer 5 and 6 exists, we propose that these different levels of CTIP1 expression lead to differential degrees of repression of the Tbr1 gene that are critical to establish the alternative fates of PNs in deep cortical layers.
Materials and Methods
Plasmids and cloning.
pshCTIP1 was constructed by subcloning the human U6 promoter-shCTIP1 cassette from pLKO.1 (ClaI-EcoRI fragment; clone ID: TRCN0000096553; The RNAi Consortium, Broad Institute of Harvard and MIT) into BstBI-EcoRI digested pFUGW-H1 (pFUX) plasmid (Leal-Ortiz et al., 2008), which encodes EGFP under the human ubiquitin C promoter. This cloning strategy eliminates the H1 promoter contained in pFUX leaving the rest of the plasmid intact. pFUX plasmid can be used as a conventional expression vector or alternatively as a shuttle vector in three-plasmid vector system to ensemble lentiviral particles (see below). A pFUX plasmid encoding a nonsense combination of the bases contained in shCTIP1 was used as control (pshControl). pmutCTIP1 (pmutCTIP1-IRES-GFP) encodes the largest CTIP1 murine isoform engineered to be insensitive to the action of shCTIP1. pmutCTIP1 was constructed by PCR-mediated mutagenesis using as template embryonic day (E)15.5 cortex cDNA. The fragments were cloned into pCAGIG-IRES-GFP (Matsuda and Cepko, 2004); MYC or HA tags were added to the C-terminal primers as shown in bold characters. All constructions were verified by sequencing. The PCR primers were as follows: N-terminal: GTACTCGAGATGTCTCGCCGCAAGCAAGG; mutagenesis primer: GCTGCCgTTaCAcTGcTTCCtcTTaTGCTCGATAAAAATAAGAATGTC (mutagenized nucleotides are shown in lower case); C-terminal HA-tag: TAGCGGCCGCTCAAGCGTAGTCTGGGACGTCGTATGGGTAGAACTTAAGGGTTCTTGAGC; C-terminal MYC-tag: TACGGCCGTTACAGATCTTCTTCAGAAATAAGTTTTTGTTCGAACTTAAGGGTTCTTGAGC.
Animals and in utero electroporation.
CF-1 mice were maintained in standard animal housing. Animal studies were conducted according to NIH and CONICYT (Chile) guidelines. The institutional Bioethics Committee (Universidad de Chile) approved all animal protocols (CBA, 0474). In utero electroporation procedure and processing of tissue was performed as described previously (Saito and Nakatsuji, 2001; Fuentes et al., 2012). Briefly, timed pregnant female mice were deeply anesthetized with isofluorane to expose the uterus through a midline incision in the abdominal wall. A volume of 1–1.5 μl of a plasmid solution (3–4 μg/μl) mixed with Fast Green (0.05%; Fisher Scientific) was injected into the lateral ventricle of the embryos of either sex using a pulled microcapillary, followed by five square pulses (35 V each, 50 ms duration at 1 s intervals) delivered across the embryo's head using a 0.5 cm diameter electrodes connected to an electroporator (GenePulse Xcell, Bio-Rad). The uterus was returned to the abdominal cavity, the midline incision was closed, and the development of embryos was allowed to continue until desired stages. At the selected developmental stage, the animals were fixed to process the brains for direct visualization of EGFP or for immunohistochemistry.
Immunohistochemistry and antibodies.
Embryonic or postnatal mice of either sex were perfused transcardially with chilled PBS 1×, followed by 4% paraformaldehyde (PFA). The brains were postfixed in 4% PFA overnight, embedded into low melting point agarose (2%) and sectioned using a vibratome (VT1000S, Leica). Brain slices were blocked with 3% donkey serum, 0.25% Triton X-100 in PBS 1× during 2 h at room temperature. Sections were incubated overnight at 4°C with primary antibodies and rinsed 3 times with PBS 1×. Secondary antibodies were applied during 1.5 h at room temperature. Sections were rinsed three times with PBS 1×, stained with Hoechst (Invitrogen) and mounted on microscope slides in Vectashield mounting medium (Vector Laboratories). Primary antibodies: anti-CUX1 (sc-13024), anti-doublecortin (sc-8066), anti-CTIP2 (sc-56014, 25B6 clone), anti-CTIP1 (sc-56011, 14B5 clone), anti-HA (sc-13024), and anti-TFIIB (sc-225) were purchased from Santa Cruz Biotechnology. Anti-Ki67 (AB9260) and anti-SOX2 (AB5603) were purchased from Millipore Bioscience Research Reagents. Anti-histone H3 (ab1791), anti-TBR1 (AB31940), and anti-TBR2 (AB23345) were purchased from Abcam. Anti-MYC (9E10) was purchased from Hybridoma Bank. All fluorophore-conjugated secondary antibodies were purchased from Jackson Immunoresearch and were used at 1:300 dilutions.
ChIP.
Chromatin immunoprecipitation (ChIP) studies were performed as described previously (Henríquez et al., 2011) with modifications. Cerebral cortices from E17.5 mice embryos of either sex were obtained and cross-linked. After cell lysis and homogenization, the chromatin was fragmented by sonication. Chromatin was precleared with normal rabbit IgG (sc-2027, Santa Cruz Biotechnology) and Protein A-agarose beads (sc-2001, Santa Cruz Biotechnology). An aliquot of chromatin was stored at −80°C without treatment as input. Precleared supernatant was incubated with anti-CTIP1, anti-histone H3 or normal rabbit IgG (12-370, Merck, Millipore). Samples were incubated with protein A-agarose and the immunocomplexes were recovered by centrifugation. The protein-DNA complexes were eluted and the cross-linking was reversed incubating at 65°C. Proteins were digested with proteinase K (Merck, Millipore) and DNA was recovered by phenol-chloroform extraction. DNA was resuspended in TE buffer, pH 8.0. Quantitation of samples was performed by real time quantitative PCR in a Stratagene Mx3000 system using the Brilliant SYBR Green QPCR Master Mix (Stratagene-Agilent). Results are expressed as percentage of input. The following primers were used: Tbr1 forward (−327/−241; 5′-ACCTGGGTACTCCAATTCTGC-3′); Tbr1 reverse (−327/−241; 5′-TGTTAGACCCGGTTTCCCTT-3′); Tbr1 forward (−192/+14; 5′-TCATCAACCTGTCCGGCCTAT-3′); Tbr1 reverse (−192/+14; 5′-AGCTGGGTGGAACTTGGGTAT-3′); Frzb forward (+623/+849; 5′-ACCTGGGAGCACTTGGATC-3′); Frzb reverse (+623/+849) (5′-GAGCAGCCAGGACTAGCAAC-3′).
Cortical neuron culture and lentiviral transduction.
Cortical neurons were cultured from E13.5 mice embryos of either sex according to established procedures (Goslin and Banker, 1991). The day in which the culture was made (0 DIV) neurons were transduced with lentiviral particles encoding shControl or shCTIP1 plus GFP at a multiplicity of infection of five viral particles per cell. On the next day, the medium containing lentiviral particles was removed and replaced with fresh medium. The primary culture was maintained for 3 additional days before RNA or protein expression analysis.
Retrograde tracing.
AlexaFluor-647-conjugated cholera toxin β subunit (CT-β; Invitrogen) was used for in vivo retrograde tracing experiments. P1 mice of either sex under ice anesthesia were injected by using a syringe pump (Genie Touch, Kent Scientific) into the cerebral cortex or into the cerebral peduncle to label callosal projection neurons or subcerebral projection neurons, respectively. Injected mice were fixed at P3 by cardiac perfusion. The brains were dissected and inspected at the injection site both externally and in sections through the injection site. Correctly injected brains were processed for immunohistochemistry.
Western blot analysis.
Transfected cells, primary cortical cultures or fresh cortical tissue were lysed in lysis buffer: 10 mm TRIS-base, 0.1% SDS supplemented with protease inhibitor cocktail (Roche). Cortical tissue was disrupted using a Dunce homogenizer. The cell lysates were passed several times through a conventional 1 ml syringe needle to complete the cell lysis; the lysates were cleared by centrifugation at 10,000 × g for 10 min. Supernatants containing total cells extract were stored at −80°C. Protein concentration in total cell extracts was measured through bicinchoninic acid protein assay (Stoscheck, 1990). Proteins were separated on 8% SDS-PAGE minigels and then transferred to nitrocellulose membrane (Bio-Rad) for Western blotting. Membranes were incubated with anti-CTIP1 (1:700), anti-TBR1 (1:2500), or anti-TFIIβ (1:1000) overnight at 4°C. Both donkey anti-rabbit and donkey anti-mouse HRP-conjugated secondary antibodies were purchased from Jackson Immunoresearch and were used at a dilution of 1:5000–1:10,000. SuperSignal West Pico Chemiluminescent substrate (Thermo Scientific) was used to develop the reaction.
Cell-line culture and transfection.
The HEK293T cell line was obtained from ATCC and was grown under standard conditions in DMEM (Invitrogen) supplemented with 10% fetal bovine serum (Hyclone). The cells were transfected at 70% confluence in 35 mm dish using Lipofectamine 2000 transfection reagent (Life Technologies) according to the manufacturer's instructions. The total mass of DNA used was 1 μg per dish. The ratio of pshTBR1 to pTBR1 (pCAGIG-TBR1) was 8:1. After 48 h of transfection, cells were lysed and TBR1 abundance was evaluated by Western blot.
RNA isolation and quantitative real time PCR.
Total RNA was purified from cultured cortical neurons by using Trizol (Invitrogen) according to the manufacturer's instructions and treated with RNase-free, DNase (Ambion). For reverse transcription, First Strand Superscript III (Invitrogen) was used and quantitative real-time PCR was performed using Brilliant II SYBR Green QPCR master mix (Stratagene-Agilent). Relative abundance of the specific mRNAs purified from cortical cultures was normalized to Gapdh mRNA and was calculated according to the 2−ΔΔCt method (Livak and Schmittgen, 2001). Primers used are as follows: Fezf2 forward (5′-CACCGGAGCTAGACCGTTTGT-3′); Fezf2 reverse (5′-AGCGTGGAGCTGCGATTGA-3′); Tbr1 forward (5′-CAACAGGCCACTTTGGCTGAA-3′); Tbr1 reverse (5′-AATGAGCGGTGGGATCGAGA-3′); Gapdh forward (5′-AACTCCCACTCTTCCACCTT-3′); Gapdh reverse (5′-TTACTCCTTGGAGGCCATGT-3′).
Virus preparation and titration.
Lentiviral particles were produced by transfecting a three-plasmid vector system comprising a shuttle plasmid (pshCTIP1 or pshControl), and two packaging plasmids (pCMVΔR8.9 and pVSVg) into HEK293T cells as previously described (Maass et al., 2013). Lentiviral particles were concentrated as previously reported (Sena-Esteves et al., 2004). Viral titer was determined by flow cytometry with a FACSCantoABD cytometer (Becton Dickinson) modifying the protocol of Logan et al. (2004). Briefly, we transduced HEK293T cells with serial viral dilutions: 1:103, 1:104, and 1:105, and after 72 h we fixed the cells at 4°C in PBS containing 2% formaldehyde, 0.5% bovine serum albumin, and 0.05% sodium azide. To determine the viral titer we calculated the percentage of GFP-positive cells and estimated the number of viral particles per microliter.
Microscopy, images, and statistics.
Images were acquired using an Olympus disk-spinning unit microscope (BX61WIDSU) and processed using ImageJ software (NIH). The montage of figures was performed using GIMP (GNU Image Manipulation Program). For comparison between two groups, the unpaired t test was used to determine statistical significance. Comparisons between more than two groups were analyzed using one-way ANOVA followed by Tukey post hoc test.
Results
To uncover the identity of genes involved in the specification of PN subtypes, we devised an approach based on the phylogenetic conservation of key components of transcriptional networks regulating neural development. Through a genetic screening performed in Drosophila (Oliva and Sierralta, 2010) we identified CG9650 as a gene involved in the control of neural development in this organism. We identified CTIP1, a C2H2 zinc-finger transcriptional repressor (Avram et al., 2002), as the mouse orthologous of the gene found in Drosophila and explored its expression pattern in the mammalian CNS. Consistently with published data, we found that CTIP1 is widely expressed in the mouse telencephalon displaying high expression levels in the hippocampus, cerebral cortex, and striatum (data not shown; Kuo and Hsueh, 2007). The function of CTIP1 has been well characterized in lymphoid and dendritic cells development and erythrocyte differentiation (Liu et al., 2003; Sankaran et al., 2008, 2009, 2010; Jawaid et al., 2010; Xu et al., 2010; Yu et al., 2012; Wu et al., 2013). More recently it has been shown that CTIP1 regulates genes involved in differentiation of hippocampal cultured cells and sensory neurons in the developing spinal cord (Kuo et al., 2009; John et al., 2012); however, despite its high expression, its function in the cerebral cortex remains unknown.
To gain insight into the function of CTIP1 in the cortex, we first defined the cell populations that express CTIP1 during cortical development. At E15.5, CTIP1 is highly expressed in the cortical plate and in migrating neurons in the intermediate zone but it is completely excluded from ventricular and subventricular progenitor populations identified by the expression of SOX2 and TBR2, respectively (Fig. 1A–E). Consistently, CTIP1 is not detected in proliferating cells identified by the expression of Ki67 but is broadly expressed by postmitotic cells identified by the expression of Doublecortin (Fig. 1F–H).
Figure 1.
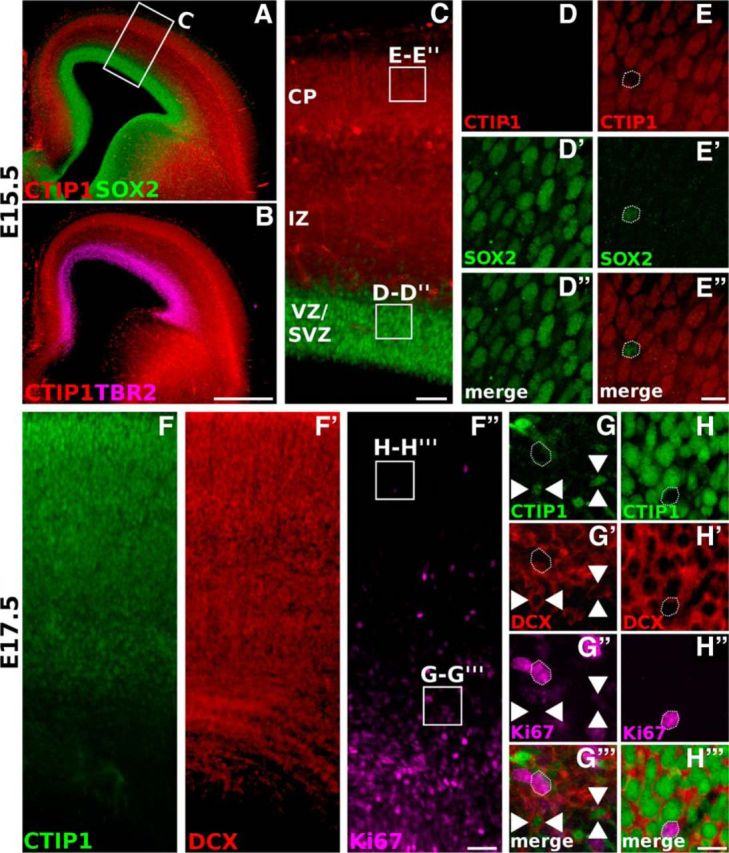
CTIP1 is expressed in postmitotic neurons in the embryonic cerebral cortex. A, B, Coronal sections of an E15.5 brain showing the expression pattern of CTIP1 in the cerebral cortex. CTIP1 expression is contrasted with the patterns of SOX2 (A) and TBR2 (B), which are expressed in the ventricular zone (VZ) and subventricular zone (SVZ), respectively. C, Magnification of the area within the rectangle shown in A. CTIP1 is excluded from the VZ/SVZ and is observed throughout the intermediate zone (IZ) and the cortical plate (CP). D–E″, Magnified views of the areas enclosed by the squares in C. Observe the null expression of CTIP1 in progenitor cells expressing SOX2. F–F″, Coronal section of an E17.5 cortex showing the expression of CTIP1 compared with the expression of doublecortin (DCX) and Ki67. G, H‴, Magnified views of the areas enclosed by the squares in F″. CTIP1 is coexpressed throughout the CP with DCX and it is excluded from proliferating cells marked by Ki67. Arrowheads point representative cells near the proliferative regions expressing CTIP1 and DCX but not Ki67. Scale bars: B, 500 μm; C, F, 100 μm; E″, H‴, 25 μm.
During development, CTIP1 is detectable as a band of ∼116 kDa in homogenates prepared from cerebral cortices, consistently with previous data (Kuo and Hsueh, 2007; Kuwata and Nakamura, 2008; Fig. 2A). This band reaches its highest intensity at embryonic stages and then declines from birth (P0) and thereafter (Fig. 2A,B). We also examined the temporal pattern of CTIP1 distribution in the developing neocortex performing immunolocalization of CTIP1 at different embryonic and postnatal stages. At prenatal ages (E15.5 and E17.5) CTIP1 displays a uniform distribution across the cortical plate (Fig. 2C). Notably, at P0, CTIP1 shows a laminar pattern of expression with enrichment in layers 2/3 and 5, low expression in layer 4 and moderate expression in layer 6 (Fig. 2C). This pattern becomes more evident at P3 and is maintained at later stages (Fig. 2C).
Figure 2.

Analysis of CTIP1 expression across cortical layers during cortical development. A, B, Western blot analysis of CTIP1 abundance at different stages of cortical development. C, Analysis of CTIP1 spatial distribution in the cerebral cortex at different stages of brain development. Notice the differential expression pattern of CTIP1 across cortical layers at postnatal stages. Cx, Cortex; IZ, intermediate zone; SVZ/VZ, subventricular zone/ventricular zone; WM, white matter. D, Analysis of CTIP1 expression across cortical layers in a coronal section of a P3 brain. Left, Cortical layers are identified by the expression of CUX1 (layers 2–4), CTIP2 high (layer 5), and TBR1 (layer 6). Right, High-magnification views showing the approximate boundaries between layers 4/5 and 5/6. CTIP1 expression is noticeably more intense in neurons residing at layers 2/3 and 5. E, Quantification of the cell populations expressing CTIP1 and/or CTIP2 in layer 5. F, Nuclear TBR1 fluorescent signal plotted against nuclear CTIP1 fluorescent signal in cells residing in layers 5 and 6. Pearson's correlation analysis shows a negative correlation between the expression levels of CTIP1 and TBR1 in deep cortical layers (r = −0.56; two-tailed t test p < 10−4). Inset, Normalized average fluorescence levels of CTIP1 and TBR1 in cells residing in layers 5 and 6. Error bars represent average ± SD. Student's t test: *p < 0.05, ***p < 0.001. G, I, Diagrams showing brain injections of the retrograde tracer CT-β in the cortex (CT-β-Cx; D) or in the cerebral peduncle (CT-β-Cp; F) at P1. Coronal sections of P3 brains at low-magnification showing neurons retrogradely labeled with CT-β across the cortex. G′, I′, Confocal images showing layer 5 neurons at high-magnification retrogradely labeled with CT-β (notched arrowheads, G′; arrowheads, I′) and immunostained for SATB2/CTIP2 (G′, top) or CTIP1/CTIP2 (G′, bottom, I′). H, J, Quantification of the percentage of CT-β-labeled cells expressing SATB2, CTIP1, and CTIP2 in layer 5 in CT-β-Cx (H; n = 3 brains) and CT-β-Cp (J; n = 3 brains) injected brains. Error bars represent ± SD. Scale bars: C, D, I, 100 μm; I′, 20 μm.
To define more precisely the laminar distribution of CTIP1 and the PN subtypes that express it in the postnatal brain, we defined laminar boundaries by the well studied expression of the TFs CUX1, CTIP2, and TBR1, which are enriched in layers 2–4, 5, and 6, respectively (Fig. 2D). First, we compared CTIP1 expression in layer 5 with the expression of its close homolog CTIP2. Most cells in layer 5 express CTIP1 (64%; n = 4 brains), whereas CTIP2 itself is expressed in 42% of the cells in this layer (Fig. 2D,E). Interestingly, most of CTIP2-positive cells also express CTIP1 (77% of CTIP2-positive cells), whereas only 44% of CTIP1-positive cells express CTIP2 (Fig. 2E). We next compared the expression of CTIP1 and TBR1, which is present at low levels in layer 5 and at high levels in layer 6 PNs (Fig. 2D). By measuring the average fluorescence intensity of CTIP1 and TBR1 in these layers, we found a reciprocal expression pattern between CTIP1 and TBR1 in layers 5 and 6. Although many cells coexpress CTIP1 and TBR1 in both layers, high levels of CTIP1 associate to low levels of TBR1 in the same cell (Fig. 2D–F). Altogether, these data show that the cells expressing CTIP1 outnumber the cells expressing CTIP2 in cortical layer 5 and that most of the SCPNs in layer 5 (defined by CTIP2 expression boundaries) express CTIP1. On the other hand, a negative correlation between CTIP1 and TBR1 expression levels is observed in deep cortical layers.
Because callosal PNs and SCPNs coexist in cortical layer 5 we explored the projection identity of CTIP1-expressing cells in this layer by combining CT-β retrograde tracing and immunohistochemistry. We injected CT-β in the cerebral cortex (CT-β-Cx) of P1 mice and then analyzed the retrogradely labeled neurons in the contralateral side 48–60 h later (Fig. 2G). Consistent with previous work (Alcamo et al., 2008; Britanova et al., 2008), we found that almost all callosal PNs in layer 5 express SATB2, but not CTIP2 (96%, of 246 CT-β-Cx-labeled cells, 237 were SATB2-positive/CTIP2-negative, n = 3 brains; Fig. 2G′,H). Further, all neurons retrogradely labeled from the contralateral cortex express CTIP1 but not CTIP2 (99%, of 237 CT-β-Cx-labeled cells, 234 were CTIP1-positive/CTIP2-negative, n = 3 brains). These data indicate that layer 5 cells expressing CTIP1, but not CTIP2, have a callosal identity. On the other hand, to label SCPNs, we injected CT-β at the cerebral peduncle (CT-β-Cp) of P1 mice and analyzed retrogradely labeled neurons in the ipsilateral cerebral cortex 48–60 h later (Fig. 2I). As expected from the above data, we found that the majority of labeled cells express both, CTIP1 and CTIP2 (97%, of 409 CT-β-Cp-labeled cells, 396 were CTIP1-positive/CTIP2-positive, n = 3 brains; Fig. 2I′,J). Additionally, we found a small number of cells expressing CTIP2 without expression of CTIP1 (3%, of 409 CT-β-Cp-labeled cells, 14 were CTIP1-negative/CTIP2-positive, n = 3 brains), which is consistent with our data showing that there is a fraction of cells expressing CTIP2 but not CTIP1 in layer 5. Overall, our tracing experiments show that CTIP1 is expressed in both callosal PNs and SCPNs residing in layer 5.
To explore the transcriptional networks in which CTIP1 is involved and to gain insight into its function in cortex development, we performed an in silico search for conserved consensus binding sites for CTIP1 (GGCCGC or GGCCGG) on regulatory regions of genes coding TFs in the mouse genome (Avram et al., 2002; Chen et al., 2009; John et al., 2012). It called our attention that the mouse Tbr1 promoter harbors a putative CTIP1 binding site at position −55 with respect to the transcription start site (+1; Fig. 3A). Based on the resemblance in the cortical expression pattern of TBR1 in mice, rat and human (Hevner et al., 2001; Hong and Hsueh, 2007; Saito et al., 2011), we predicted that the regulatory elements controlling its expression, including CTIP1 binding sites, should be evolutionarily conserved in the promoter region of this gene. Consistently, we found five putative CTIP1 binding sites in the human Tbr1 promoter, clustered between positions −1713 and −1192, and three sites in the rat Tbr1 promoter in comparable positions (Fig. 3A). Additionally, we found three CTIP1 putative binding sites in the chicken Tbr1 promoter region, but we did not find any site in the zebrafish and fugu Tbr1 promoters. To assess whether CTIP1 occupies the Tbr1 gene promoter in vivo during cortical development we performed ChIP analysis, which revealed that CTIP1 is bound to Tbr1 promoter in the E17.5 mouse cerebral cortex (Fig. 3B). The enrichment of CTIP1 at this promoter is comparable to the one found at the Frzb gene promoter, which is a known direct target of CTIP1 (John et al., 2012). Because the evidence supports CTIP1 function as a transcriptional repressor (Avram et al., 2000; Senawong et al., 2005), we predicted that a decrease of CTIP1 expression should lead to an increase of TBR1 expression. Accordingly, CTIP1 knock-down in cultured embryonic cortical neurons, achieved by transduction of a lentiviral vector encoding an shRNA against CTIP1 mRNA (shCTIP1) that efficiently reduces its expression (reduction in 66 ± 5% relative to the control culture transduced with lentiviral particles encoding a control shRNA, p = 0.0017, n = 4), resulted in a significant increase in TBR1 expression as compared with the control culture (62 ± 20% increase, p = 0.0091, n = 4; Fig. 3C,D). These results support that CTIP1 binds to the Tbr1 promoter and acts as a transcriptional repressor of its expression.
Figure 3.

CTIP1 binds to a regulatory element on the Tbr1 promoter and negatively regulates its expression. A, In silico analysis showing putative CTIP1 binding sites found in the promoter region of the mammalian and avian Tbr1 orthologous genes. B, ChIP assay of CTIP1 occupancy (or control IgG) in E17.5 mouse cortex showing that CTIP1 can be found bound to the Tbr1 promoter. Data are presented as percentage ± S.D of amplification relative to input chromatin (n = 3). In the legends are indicated the positions in the genomic sequences covered by each set of primers used. The binding of CTIP1 to Frzb was used as a positive control. Bars representing the unspecific (IgG) binding are not visible at the graph scale. C, Western blot analysis of CTIP1 and TBR1 proteins in cultured cortical neurons transduced with lentiviral particles expressing shControl or shCTIP1 revealing an increase in TBR1 expression associated to the knock-down of CTIP1. D, Densitometric analysis of CTIP1 and TBR1 proteins abundance. Error bar represents ± SD. Student's t test **p < 0.01, n = 4.
Considering the reciprocal pattern of expression between CTIP1 and TBR1 in deep cortical layers and the finding that CTIP1 acts as a transcriptional repressor of TBR1 in vitro, we examined the relevance of this regulation in vivo. We performed in utero electroporation of a plasmid encoding GFP plus shCTIP1 or shControl (pshCTIP1, pshControl) in embryonic mouse brains at the peak time of the generation of deep layer neurons (E13.5) and analyzed the electroporated brains at P0 when cortical layers are already formed (Greig et al., 2013). Consistently with our in vitro results, in vivo CTIP1 knock-down in layer 5 neurons augmented the expression of TBR1 (Fig. 4A) as shown by a significant increase in the number of TBR1-positive cells (pshControl: 28 ± 7%, 54 of 195 GFP-positive cells were TBR1-positive; pshCTIP1: 63 ± 5%, 169 of 267 GFP-positive cells were TBR1-positive; n = 5 brains, p = 0.0004; Fig. 4B). The effect of pshCTIP1 on TBR1 expression in layer 5 neurons was reversed by the coelectroporation of a plasmid encoding the longest murine isoform of CTIP1 shown to act as a transcriptional repressor (Avram et al., 2002) that was engineered to render it insensitive to shCTIP1 (pmutCTIP1; pshCTIP1: 63 ± 5%; pshCTIP1+pmutCTIP1: 26 ± 5%, 57 of 216 GFP-positive cells were TBR1-positive, n = 5 brains, p = 1.34 × 10⁻⁷; Fig. 4A,B). This result indicates a specific effect of pshCTIP1 on TBR1 expression.
Figure 4.

In vivo CTIP1 knock-down in layer 5 PNs and its overexpression in layer 6 PNs lead to reciprocal changes in TBR1 expression. A, C, Coronal sections of brains in utero electroporated at E13.5 and analyzed at P0. A, Confocal images of layer 5 neurons are shown; electroporated neurons express GFP. CTIP1 knockdown associates to an increase in the number of cells expressing TBR1 in layer 5 PNs (n = 5 brains) relative to control condition. pshCTIP1 effect on TBR1 expression is reversed by the coelectroporation of a plasmid expressing a CTIP1 variant engineered to be insensitive to shCTIP1 (pmutCTIP1; n = 5 brains). Notched arrowheads point electroporated cells expressing TBR1. C, Confocal images of layer 6 neurons overexpressing CTIP1 by electroporation of pmutCTIP1. Cells electroporated with pmutCTIP1 are identified by the expression of the MYC epitope. Overexpression of CTIP1 in layer 6 PNs leads to a decrease in the number of cells expressing TBR1 (n = 6 brains) relative to control condition. The empty expression vector (pCAGIG-IRES-GFP) was used as control. Notched arrowheads point electroporated cells expressing TBR1. B, D, Quantification of experiments showed in A and C, respectively. The results are expressed as the percentage of GFP-positive cells that also express TBR1 in layer 5 (B) or in layer 6 (D). Error bars represent ± SD. Student's t test ***p < 0.001. Scale bar, 25 μm.
On the basis of our results showing the repressive effect of CTIP1 on TBR1 expression and the fact that layer 6 neurons exhibit lower CTIP1 expression and higher TBR1 expression than layer 5 (Fig. 2D,F), we hypothesized that the ectopic overexpression of CTIP1 in layer 6 neurons should decrease TBR1 expression in this layer. As predicted, brains electroporated with pmutCTIP1 (Fig. 4C) showed a significant decrease in the number of neurons GFP-positive/TBR1-positive in layer 6, compared with brains electroporated with the empty vector (control), confirming the repressive activity of CTIP1 over TBR1 expression in deep layers (control: 70 ± 3%, 257 of 363 GFP-positive cells were TBR1-positive; pmutCTIP1: 30 ± 13%, 140 of 472 GFP-positive cells were TBR1-positive, p = 5.5 × 10⁻⁴, n = 6 brains; Fig. 4D). We did not observe a further increase in TBR1 expression levels in layer 6 neurons associated to the electroporation of pshCTIP1 (see Fig. 7D).
Figure 7.

Coelectroporation of pshCTIP1 and pshTBR1 rescues SCPA defects. A, Western-blot analysis of TBR1 protein in HEK293T cells transfected with pTBR1 (pCAGIG-TBR1) plus pshControl or pshTBR1. B, Coronal sections of brains electroporated in utero with the indicated plasmids at E13.5 and processed at P0. MZ, marginal zone; CP, cortical plate; WM, white matter. C, Quantification of cell position in the cortex of experiments showed in B. The results are expressed as the percentage of GFP-positive cells distributed in different cortical layers. Error bars represent ± SD. Student's t test, ***p < 0.001; **p < 0.01; n = 6 brains per condition. D, Cortical sections of brains electroporated in utero at E13.5 and fixed at P0, showing an accumulation of cells expressing high levels of CTIP2 in layer 6 in the pshCTIP1 plus pshTBR1 coelectroporation condition. E, Coronal sections of brains electroporated as before. Ei, Brains with comparable amounts of electroporated cells and GFP labeling intensity in the cerebral cortex are shown for adequate comparison. Eii, Coronal sections of the brainstems obtained from the same brains shown in Ei. Eii, Right, Higher-magnification of the areas within the white rectangles. The oval and arrow indicate the approximate location of the pyramidal tract. F, Proposed role of CTIP1 in deep cortical layers. Diagrammatic representation of the transcriptional regulatory network regulating PN identity in deep cortical layers. Interactions among different TFs are depicted according to literature and our own results. The arrows and bar-end lines indicate direct positive and negative regulation, respectively. The dashed arrows and dashed bar-end lines indicate proposed indirect positive and negative regulation, respectively. The TFs weakly colored indicate that are expressed at lower levels. The differential dosage of CTIP1 expression in deep cortical layers (high in layer 5 and low in layer 6) determine the degree of repression of Tbr1. We propose that this regulatory relationship is critical to specify differential neuronal identities in deep cortical layers. Scale bars: B, 100 μm; D, (low-magnification) 100 μm, (high-magnification) 25 μm; Di, 500 μm; Dii, 250 μm; magnification in Dii, 100 μm.
It has been reported that TBR1 directly represses Fezf2 transcription (Han et al., 2011; McKenna et al., 2011) and that Fezf2 is a positive genetic regulator of CTIP2 expression in layer 5 PNs (Chen et al., 2005a, 2008; Molyneaux et al., 2005; Srinivasan et al., 2012). Therefore, we reasoned that the high CTIP1 expression levels in this layer could play a permissive role for Fezf2 and in turn over CTIP2 expression through the repression of Tbr1 gene. Consistent with this, the decrease of CTIP1 expression in layer 5 by electroporation of pshCTIP1 at E13.5 led to a significant reduction in the number of CTIP2-positive cells at P0 (pshControl: 32 ± 9%, 74 of 234 GFP-positive cells were CTIP2-positive; pshCTIP1: 2.9 ± 4%, 7 of 244 GFP-positive cells were CTIP2-positive; p = 0.007; n = 7 brains; Fig. 5A,B). To discard a direct inhibition of CTIP2 by shCTIP1, we searched for putative target sequences of shCTIP1 on Ctip2 mRNA and did not find any region with a value >62% of similarity, indicating that CTIP2 cannot be efficiently targeted by shCTIP1. Moreover and as shown below, cells coelectroporated with pshCTIP1 plus a plasmid encoding wild-type CTIP2 cDNA show that these cells display a robust CTIP2 expression (Fig. 6B), allowing us to discard an off-target effect of pshCTIP1 over CTIP2. To explore the proposed pathway, we performed in vitro measurement of mRNA levels in primary cultures of cortical neurons transduced with lentiviral vectors coding either shControl or shCTIP1. As expected, neurons expressing shCTIP1 showed a robust increase of Tbr1 mRNA expression (control: 1.01 ± 0.05; shCTIP1: 1.63 ± 0.13; p = 0.0005; n = 11) that was correlated with a moderate but significant decrease in Fezf2 mRNA levels compared with control conditions (shControl: 1.01 ± 0.04; shCTIP1: 0.87 ± 0.03; p = 0.0147; n = 11; Fig. 5C). These observations are compatible with the idea that CTIP2 expression is regulated by CTIP1 through a pathway that partly depends on FEZF2 expression. Although FEZF2 has been recognized as an important regulator of CTIP2, several sets of data support the view that FEZF2 is not sufficient for CTIP2 expression. These include: (1) the overexpression of FEZF2 through in utero electroporation in layer 2/3 neurons redirects callosal axons into subcerebral targets without the induction of the expression of CTIP2 (Chen et al., 2008), (2) the rescue of SCPAs after the overexpression of FEZF2 in the Fezf2 KO cortex is not accompanied by the recovery of CTIP2 expression (Chen et al., 2008), and (3) the overexpression of TBR1 in layer 5 PNs inhibits the expression of Fezf2 and the extension of SCPAs even when the electroporated cells still express high CTIP2 levels (McKenna et al., 2011). Our data and these evidences are consistent with the idea that CTIP1 is involved in the regulation of CTIP2 expression indirectly through a mechanism that appears to include, but that is not limited to, Fezf2 regulation.
Figure 5.

In vivo CTIP1 knock-down in layer 5 PNs decreases the expression of CTIP2 and disrupts SCPA development. A, Coronal sections of brains in utero electroporated at E13.5 and fixed at P0. Confocal images of layer 5 neurons are shown; electroporated neurons express GFP. CTIP1 knockdown associates to a decrease of CTIP2 expression (n = 7 brains) that is not reversed by the coelectroporation of pmutCTIP1 (n = 4 brains). The overexpression of CTIP1 alone leads to a decrease in CTIP2 expression (n = 6 brains). Arrows indicate electroporated cells expressing CTIP2. Notched arrowheads point to electroporated cells that do not express CTIP2. B, Quantification of experiments shown in A. The results are expressed as the percentage of GFP-positive (GFP) cells that express CTIP2 in layer 5. Error bars represent ± SD. Student's t test **p < 0.01. C, Real time RT-PCR analysis of Tbr1 and Fezf2 mRNA levels in cultured cortical neurons transduced with lentiviral particles expressing shControl or shCTIP1. Error bars represent ± SEM. Student's t test ***p < 0.001; *p < 0.05; n = 11. D, Coronal sections of brains in utero electroporated at E13.5 and fixed at P0. A diagram representing a parasagittal section of the mouse brain is shown to indicate the anteroposterior position of the coronal sections shown in Di and Dii. OB, olfactory bulb; IC, internal commissure; Po, pons; SC, spinal cord; L5, layer 5. Di, Brains with comparable amounts of electroporated cells and GFP-labeling intensity in the cerebral cortex are shown for adequate comparison. Dii, Coronal sections of the brainstems obtained from the same brains shown in Di. The rightmost panels in Dii show higher-magnification of the areas within the white rectangles. The oval and arrow indicate the approximate location of the pyramidal tract (pt). SCPAs are observed in the control condition, whereas a very marked reduction is seen in the brains electroporated with pshCTIP1. This effect was not rescued by the coelectroporation of pmutCTIP1. The electroporation of pmutCTIP1 alone leads to a marked decrease of SCPAs in the pyramidal tract. Scale bars: A, 25 μm; Di, 500 μm; Dii, 250 μm; magnification in Dii, 100 μm.
Figure 6.

SCPA defects induced by CTIP1 knock-down are rescued by the expression of CTIP2 in layer 5. A, Cortical coronal sections from brains electroporated in utero with empty pCAGIG (control) or pCTIP2 (pCAGIG-CTIP2) at E13.5 and fixed at P0. Cells electroporated with pCTIP2 effectively express CTIP2. B, Coronal sections of brains electroporated with pshCTIP1 plus empty pCAGIG or pCTIP2 at E13.5 and fixed at P0. Confocal images of layer 5 neurons are shown. Coelectroporation of pshCTIP1 and pCTIP2 rescues CTIP2 expression levels in layer 5 PNs in a context of downregulation of CTIP1 expression (n = 5 brains). C, Quantification of the rescue experiments shown in B. Error bars represent ± SD. Student's t test, ***p < 0.001. D, Coronal sections of brains in utero electroporated at E13.5 and fixed at P0. A diagram representing a parasagittal section of the mouse brain is shown to indicate the anteroposterior position of the coronal sections shown in Di and Dii. OB, olfactory bulb; IC, internal commissure; Po, pons; SC, spinal cord; L5, layer 5. Di, Brains with comparable number of electroporated cells and GFP-labeling intensity in the cerebral cortex are shown for adequate comparison. Dii, Coronal sections of the brainstems obtained from the same brains shown in Di. The rightmost panels in Dii show higher-magnification of the areas within the white rectangles. The oval and arrow indicate the approximate location of the pt. The loss of SCPA associated to CTIP1 knock-down is recued by the coelectroporation of pCTIP2. Scale bars: A, 100 μm; B, 25 μm; Di, 500 μm, Dii, 250 μm; magnification in Dii, 100 μm.
Surprisingly, even though the in vivo coelectroporation of pshCTIP1 and pmutCTIP1 rescued TBR1 expression, this procedure was not able to restore the expression of CTIP2 in layer 5 neurons (pshCTIP1+pmutCTIP1: 1.5 ± 2%, 3 of 202 GFP-positive cells were CTIP2-positive; p = 0.0063; n = 4 brains; Fig. 5A,B). Moreover, we observed that the sole electroporation of pmutCTIP1 correlates with a significant reduction of CTIP2 expression in layer 5 neurons compared with control condition (pmutCTIP1: 1.9 ± 2%, 5 of 253 GFP-positive cells were CTIP2-positive; p = 0.0069; n = 6 brains; Fig. 5A,B). These results led us to suspect an earlier disruptive effect on the transcriptional network associated to CTIP1 ectopic overexpression that could lead to an altered CTIP2 expression on layer 5 PN.
Considering that CTIP2 is a key factor for the execution of subcerebral identity (Arlotta et al., 2005; Chen et al., 2008) and that CTIP1 knock-down associates to a decrease in CTIP2 expression in layer 5, we evaluated the effect of CTIP1 downregulation on the development of SCPAs. We examined the presence of GFP-labeled SCPA axons in the pyramidal tract projecting caudally to the spinal cord in brains in which CTIP1 has been inhibited (Fig. 5D). As the number of electroporated cells is inherently variable between experiments, we compared the intensity of fluorescence in the pyramidal tract of brains in which similar degrees of electroporation density and GFP fluorescence intensity were observed in the sensorimotor cortex. We found that GFP-labeled axons in the pyramidal tract of brains electroporated with pshCTIP1 at E13.5 and analyzed at P0 show a noticeable reduction of GFP fluorescence compared with control brains (Fig. 5D). To determine whether the lack of GFP-labeled SCPAs at the pyramidal tract of pshCTIP1 electroporated brains is due to a developmental delay, we analyzed pshCTIP1-electroporated brains at P7 and observed the same SCPA defects (data not shown). Given that callosal PNs residing in layer 5 are generated along with SCPNs and both populations of neurons are equally electroporated, we examined the callosal axons projecting medially (Fig. 5D). Remarkably, and in contrast with the decrease of SCPAs, the callosal projections did not appear to be affected by the downregulation of CTIP1 levels (Fig. 5D). Consistently, we electroporated pshCTIP1 at E15.5 to target PNs destined to occupy superficial cortical layers and observed that, as in pshControl electroporated brains, most cells locate correctly in layer 2/3 and project axons medially toward the corpus callosum at P0 (data not shown). Thus, high CTIP1 expression in layer 5 appears to be required for the correct development of subcerebral projections, but not for callosal projections. As expected from the data shown above on the effect of pmutCTIP1 overexpression on CTIP2 expression, the coelectroporation of pshCTIP1 and pmutCTIP1 did not rescue the normal pattern of SCPAs (Fig. 5D). Additionally, the electroporation of pmutCTIP1 alone altered the normal development of SCPAs confirming the disruptive effects on SCPNs associated to CTIP1 ectopic overexpression (Fig. 5D).
To confirm that the loss of SCPA associated to CTIP1 knock-down is a consequence of CTIP2 inhibition, we performed in utero electroporation of pshCTIP1 along with a plasmid encoding CTIP2 cDNA (pCTIP2) that efficiently express the protein in vivo (Fig. 6A). Coelectroporation experiments revealed that most of electroporated cells in layer 5 displayed robust CTIP2 expression leading to an increase in the number GFP-positive/CTIP2-positive cells relative to control and pshCTIP1 electroporation conditions (pshCTIP1+pCTIP2: 69% ± 3.9, 115 of 166 GFP-positive cells were CTIP2-positive; p = 0.0018; n = 4 brains; Fig. 6B,C). Importantly, the rescue of CTIP2 expression is associated to sustained inhibition of CTIP1 expression as only 4% of GFP-positive cells expressed CTIP1 (Fig. 6B). This supports both the specificity of shCTIP1 on CTIP1 and the high degree of incorporation of the two plasmids in coelectroporation experiments as previously reported (LoTurco et al., 2009). As expected, the coelectroporation of pshCTIP1 and pCTIP2 was able to revert the loss of SCPAs, thus supporting the view that the defects in SCPAs are consequence of CTIP2 decrease induced by the CTIP1 knock-down (Fig. 6D).
As our results reveal a functional relationship between CTIP1 and TBR1 we hypothesized that the defects in the development of SCPAs associated to CTIP1 knock-down in layer 5 neurons are mediated by the increase in TBR1 levels. To test this possibility, we performed coelectroporation of pshCTIP1 along with a plasmid that encodes a shRNA targeting TBR1 (pshTBR1), which efficiently inhibits its expression in vitro (reduction to 13.9 ± 10% relative to a control culture transfected with a control shRNA, p = 7 × 10⁻⁴, n = 4; Fig. 7A) and in vivo (Fig. 7D). Remarkably and consistently with our hypothesis, CTIP1 and TBR1 double-inhibition was able to rescue the loss of SCPA (Fig. 7E). This result supports the idea that the increased expression of TBR1 as a consequence of CTIP1 inhibition leads to the loss of SCPA. It must be noticed that we did not observed an increase in CTIP2-positive cells in layer 5 in pshCTIP1+pshTBR1 electroporation condition relative to pshCTIP1 condition (pshCTIP1+pshTBR1: 4.1 ± 2%, 12 of 287 GFP-positive cells were CTIP2-positive; p = 0.8925; n = 4 brains) but instead found a high number of cells with elevated expression of CTIP2 accumulated in layer 6 in the CTIP1-TBR1 double-knock-down condition (Fig. 7D). These cells possibly correspond to PNs destined to layer 5 that as a consequence of the migratory defects associated to TBR1 knock-down did not reach its normal position in the cortex but still acquired some of their molecular features (i.e., high CTIP2 expression) and presumably account for the observed rescue of SCPAs. This view is based on previous reports showing that TBR1, aside of the functions in regulating specification and connectivity of corticothalamic neurons discussed here, coregulates multiple aspects of cortical development including laminar positioning of PNs (Hevner et al., 2001; Bedogni et al., 2010; Srinivasan et al., 2012). In agreement with previous data, the electroporation of brains with pshTBR1 at E13.5 and analyzed at P0 revealed a marked impairment in cell migration as evidenced by an accumulation of cells in layer 6 with respect to control condition (pshControl: 28.4 ± 5.3%, n = 6 brains; pshTBR1: 50.5 ± 7%, n = 9 brains; p = 1.4 × 10⁻⁷; Fig. 7B,C). These migratory defects were also seen in CTIP1/TBR1 double-knockdown (pshCTIP1+pshTBR1: 53.3 ± 3% of GFP-positive cells in layer 6, n = 6 brains; p = 1.2 × 10⁻⁷; Fig. 7B,C), but were absent in CTIP1 single inhibition (pshCTIP1: 35.3 ± 4% of GFP-positive cells in layer 6, n = 10 brains; p = 0.0865; Fig. 7B,C). The migratory defects associated to TBR1 knock-down were also seen in brains electroporated with pshTBR1 at the time of the generation of PNs destined to superficial layers (E15.5) and analyzed at P0 (data not shown).
Together these results support a role for CTIP1 on the specification of the SCPNs in layer 5 through the repression of TBR1 and the promotion of CTIP2 expression that, consequently, allows the deployment of the genetic program responsible for the development of SCPAs. Overall, our findings contribute to the understanding of the elaborate transcriptional network controlling the rich phenotypic diversity of PN subtypes found in the cerebral cortex (Fig. 7F).
Discussion
Our results show that the specification of the subcerebral fate of layer 5 PNs depends on the direct repression of TBR1 by CTIP1 and likely through a permissive effect on CTIP2 expression.
TBR1 is well known as a transcription factor critically important for the development of cortical layer 6 features, mainly the corticothalamic PN fate, and the repression of the subcerebral projection fate (Hevner et al., 2001; Bedogni et al., 2010; Han et al., 2011; McKenna et al., 2011). Therefore, the interplay between CTIP1 and TBR1 would appear as a critical process for the specification of layer 5 and layer 6 fates. It is interesting to note that both TFs are expressed in the two cortical layers, albeit at clearly different levels. This suggests that combinatorial codes based on dosage variations subtler than the all-or-none expression of these TF provide a way to achieve the phenotypic variety between closely related CfuPN.
Several lines of evidence support that the role of CTIP1 on the specification of SCPNs depends on the direct transcriptional repression of Tbr1. First, ChIP experiments show that CTIP1 is bound to a conserved element in the Tbr1 promoter in the developing cortex and that acts as a repressor of TBR1 expression in cultured cortical neurons. Second, we show that decreasing CTIP1 levels in layer 5 neurons or its overexpression in layer 6 neurons leads to reciprocal changes in TBR1 expression. Finally, we demonstrate that the loss of SCPA associated to CTIP1 knock-down is reversed by the simultaneous interference of TBR1 expression in layer 5 neurons.
A candidate link between CTIP1, TBR1, and the development of SCPAs is CTIP2, which is considered a key element in the implementation of the SCPN developmental program (Arlotta et al., 2005; Chen et al., 2008). CTIP2 is a close homolog of CTIP1, although there is no reported common function for them. Their expression patterns in the cerebral cortex do not suggest redundant roles, as their overlap is limited to cells in deep layers and only CTIP1 is abundantly expressed in superficial layers. TBR1 has been proposed to indirectly regulate CTIP2 expression likely through its effect on Fezf2, which in turn positively regulates CTIP2 (Molyneaux et al., 2005; McKenna et al., 2011). We observed that the targeted decrease of CTIP1 in layer 5 PN, which we already demonstrated causes derepression of TBR1, led to a marked decrease of CTIP2 and to the complete loss of SCPA. Our in vitro experiments showing that the inhibition of CTIP1 expression results in an increase in Tbr1 and a modest decrease in Fezf2 mRNA, suggest that Fezf2 is not the only regulator downstream of TBR1 that regulates CTIP2 expression and that additional unidentified CTIP1-regulated genes likely control CTIP2 levels in layer 5 supporting the view that multiple genes operate in the regulation of CTIP2 expression during cortex development (Greig et al., 2013). Interestingly, it has been shown that the loss of cells expressing high levels of CTIP2 in layer 5 in Fezf2−/− mice is partially rescued in the Fezf2−/−;Tbr1−/− compound mice, suggesting that CTIP2 is regulated, at least partially, by TBR1 (McKenna et al., 2011). A plausible explanation could be that TBR1 derepression in CTIP1 knock-down condition contributes to the inhibition of CTIP2 expression. Consistently, it must be noticed that the combined decrease of CTIP1 and TBR1 achieved by the coelectroporation of pshCTIP1 and pshTBR1 associates to the occurrence of ectopic cells expressing high levels of CTIP2 in the layer 6 which presumably account for the observed rescue of SCPAs, despite the misplacement of these cells attributable to TBR1 inhibition. Finally, the data showing that the reintroduction of CTIP2 into cells in which CTIP1 was simultaneously inhibited rescues the defects in SCPAs support that CTIP1 function is mediated through CTIP2. Altogether, these data place CTIP1 as an important permissive element for the development of the SCPN phenotype through the repression of TBR1 in layer 5.
Although we were able to rescue the normal expression of TBR1 by reintroducing CTIP1 in cells transfected with pshCTIP1, we were not able to revert the loss of SCPA and CTIP2 expression in layer 5 neurons. We show that the electroporation of a plasmid encoding CTIP1 causes defects per se. This could be due to the premature expression of functional CTIP1 in progenitors or to an excessive dose of CTIP1 driven by a strong promoter. On the other hand TBR1, although expressed at high level in layer 6 PN, is also expressed transiently by almost all postmitotic PNs as part of the normal glutamatergic neurogenic process (Englund et al., 2005; Hevner et al., 2006). Thus it is possible that observed defects associated to CTIP1 ectopic overexpression could be mediated by the premature repression of Tbr1, altering the normal differentiation program of PN. This view is supported by mild but notorious migratory defects in brains electroporated with pmutCTIP1 at E13.5 (Fig. 5D) and strong migratory defect in brains electroporated with pmutCTIP1 at E15.5 (data not shown) resembling the migratory phenotype observed by the downregulation of TBR1. Nevertheless, the body of evidence and particularly the rescue of the effects of pshCTIP1 on SCPAs and CTIP2 expression by the coelectroporation of pshTBR1, as well as the rescue of the SCPA development by CTIP2 support a bona fide and specific role for CTIP1 on the development of SCPNs in layer 5.
An open question is the fate of layer 5 cells when CTIP1 expression was decreased. We did not find clearly misguided axons in the brains electroporated with shCTIP1, despite the decrease in the number of axons in the pyramidal tract. It is possible that these axons project through the corpus callosum to cortical targets, as it occurs in Fezf2−/− mutants, in which CTIP2 expression in layer 5 is impaired (Chen et al., 2005a, 2008; Molyneaux et al., 2005). We were unable to prove or discard this possibility based on our experimental approach, as normally occurring corticocortical axons projecting from electroporated neurons are similarly labeled. Another interesting observation is that the projection of corticocortical axons from layers 5 and 2/3, which also express high levels of CTIP1, is unaffected by the inhibition CTIP1. This observation rules out a general defect in axon extension or navigation caused by the inhibition of CTIP1 expression and points toward a specific role in the acquisition of the SCPN phenotype. It also emphasizes the importance of the cellular context in the function of CTIP1 in the developing cortex.
Our experimental approach based in the change of the CTIP1 expression levels instead of its elimination allows us to propose that the interplay of CTIP1 and TBR1 is not based on all-or-none patterns, but on graded levels of their abundance. Thus, it appears that low but not null expression of CTIP1 in layer 6 neurons suffices to maintain high TBR1 expression. We propose that the differential dosages of CTIP1 between layer 5 and 6 determine the degree of repression of Tbr1 gene and thus contribute to establish the alternative fates and the laminar origin of CfuPNs in deep cortical layers (Fig. 7F). Examples of dose-dependent function are the low levels of expression of TBR1 on layers 2/3 and Fezf2 in layer 6 that appear to be necessary for the correct differentiation of callosal and corticothalamic PNs, respectively (Hirata et al., 2004; Chen et al., 2005b; Molyneaux et al., 2005; Srinivasan et al., 2012). The development of methods that modify TF levels in gradual and controlled manners will facilitate to investigate the role of TF dosages in cell fate specification, in addition to the all or none expression.
To fully understand the transcriptional regulatory networks in which CTIP1 is involved during cortex development, it will be necessary to study all the genetic and physical interactions with relevant TFs and their relationships with its cognate DNA-binding elements at different spatiotemporal contexts (Shibata et al., 2015). Although it is known that CTIP1 interacts with SOX6 during the control of globin gene transcription, as well as with TLX (Xu et al., 2010; Estruch et al., 2012), both SOX6 and TLX are not expressed in postmitotic PNs (Monaghan et al., 1995; Stenman et al., 2003; Azim et al., 2009; Batista-Brito et al., 2009). Therefore, there is no support to propose a role for these types of complexes in the function of CTIP1 in the cortex. On the other hand it has been shown that CTIP1 interacts with COUP-TFs and that COUP-TFI influences the timing of birth and specification of corticospinal motor neurons in somatosensory cortex (Tomassy et al., 2010). CTIP1 dependency of COUP-TFs in the regulation of Tbr1 remains to be investigated.
Our results significantly contribute to the understanding of the logic of the genetic network that underlies cortical neuron diversity. Further studies are required to elucidate the complement of TFs expressed in each type of PNs and to define their interactions within the context of each neuronal type, as well as the mechanisms that determine the different levels of expression of some TFs in different classes of neurons.
Footnotes
This work was supported by Iniciativa Científica Milenio (Chile) P09-015-F, FONDECYT (Chile) 1090281 (M.K.) and 1120684 (J.S.), FONDAP (Chile) 15090007 (M.M.), and CONICYT (Chile) Fellowship (J.C.). We thank Drs S.C. Noctor and A. Couve for critical reading of the paper.
The authors declare no competing financial interests.
References
- Alcamo EA, Chirivella L, Dautzenberg M, Dobreva G, Fariñas I, Grosschedl R, McConnell SK. Satb2 regulates callosal projection neuron identity in the developing cerebral cortex. Neuron. 2008;57:364–377. doi: 10.1016/j.neuron.2007.12.012. [DOI] [PubMed] [Google Scholar]
- Arlotta P, Molyneaux BJ, Chen J, Inoue J, Kominami R, Macklis JD. Neuronal subtype-specific genes that control corticospinal motor neuron development in vivo. Neuron. 2005;45:207–221. doi: 10.1016/j.neuron.2004.12.036. [DOI] [PubMed] [Google Scholar]
- Avram D, Fields A, Pretty On Top K, Nevrivy DJ, Ishmael JE, Leid M. Isolation of a novel family of C2H2 zinc finger proteins implicated in transcriptional repression mediated by chicken ovalbumin upstream promoter transcription factor (COUP-TF) orphan nuclear receptors. J Biol Chem. 2000;275:10315–10322. doi: 10.1074/jbc.275.14.10315. [DOI] [PMC free article] [PubMed] [Google Scholar]
- Avram D, Fields A, Senawong T, Topark-Ngarm A, Leid M. COUP-TF (chicken ovalbumin upstream promoter transcription factor)-interacting protein 1 (CTIP1) is a sequence-specic DNA binding protein. Biochem J. 2002;368:555–563. doi: 10.1042/BJ20020496. [DOI] [PMC free article] [PubMed] [Google Scholar]
- Azim E, Jabaudon D, Fame RM, Macklis JD. SOX6 controls dorsal progenitor identity and interneuron diversity during neocortical development. Nat Neurosci. 2009;12:1238–1247. doi: 10.1038/nn.2387. [DOI] [PMC free article] [PubMed] [Google Scholar]
- Batista-Brito R, Rossignol E, Hjerling-Leffler J, Denaxa M, Wegner M, Lefebvre V, Pachnis V, Fishell G. The cell-intrinsic requirement of Sox6 for cortical interneuron development. Neuron. 2009;63:466–481. doi: 10.1016/j.neuron.2009.08.005. [DOI] [PMC free article] [PubMed] [Google Scholar]
- Bedogni F, Hodge RD, Elsen GE, Nelson BR, Daza RA, Beyer RP, Bammler TK, Rubenstein JL, Hevner RF. Tbr1 regulates regional and laminar identity of postmitotic neurons in developing neocortex. Proc Natl Acad Sci U S A. 2010;107:13129–13134. doi: 10.1073/pnas.1002285107. [DOI] [PMC free article] [PubMed] [Google Scholar]
- Britanova O, de Juan Romero C, Cheung A, Kwan KY, Schwark M, Gyorgy A, Vogel T, Akopov S, Mitkovski M, Agoston D, Sestan N, Molnár Z, Tarabykin V. Satb2 is a postmitotic determinant for upper-layer neuron specification in the neocortex. Neuron. 2008;57:378–392. doi: 10.1016/j.neuron.2007.12.028. [DOI] [PubMed] [Google Scholar]
- Chen B, Schaevitz LR, McConnell SK. Fezl regulates the differentiation and axon targeting of layer 5 subcortical projection neurons in cerebral cortex. Proc Natl Acad Sci U S A. 2005a;102:17184–17189. doi: 10.1073/pnas.0508732102. [DOI] [PMC free article] [PubMed] [Google Scholar]
- Chen JG, Rasin MR, Kwan KY, Sestan N. Zfp312 is required for subcortical axonal projections and dendritic morphology of deep-layer pyramidal neurons of the cerebral cortex. Proc Natl Acad Sci U S A. 2005b;102:17792–17797. doi: 10.1073/pnas.0509032102. [DOI] [PMC free article] [PubMed] [Google Scholar]
- Chen B, Wang SS, Hattox AM, Rayburn H, Nelson SB, McConnell SK. The Fezf2-Ctip2 genetic pathway regulates the fate choice of subcortical projection neurons in the developing cerebral cortex. Proc Natl Acad Sci U S A. 2008;105:11382–11387. doi: 10.1073/pnas.0804918105. [DOI] [PMC free article] [PubMed] [Google Scholar]
- Chen Z, Luo HY, Steinberg MH, Chui DH. BCL11A represses HBG transcription in K562 cells. Blood Cells Mol Dis. 2009;42:144–149. doi: 10.1016/j.bcmd.2008.12.003. [DOI] [PubMed] [Google Scholar]
- Englund C, Fink A, Lau C, Pham D, Daza RA, Bulfone A, Kowalczyk T, Hevner RF. Pax6, Tbr2, and Tbr1 are expressed sequentially by radial glia, intermediate progenitor cells, and postmitotic neurons in developing neocortex. J Neurosci. 2005;25:247–251. doi: 10.1523/JNEUROSCI.2899-04.2005. [DOI] [PMC free article] [PubMed] [Google Scholar]
- Estruch SB, Buzón V, Carbó LR, Schorova L, Lüders J, Estébanez-Perpiñá E. The oncoprotein BCL11A binds to orphan nuclear receptor TLX and potentiates its transrepressive function. PLoS One. 2012;7:e37963. doi: 10.1371/journal.pone.0037963. [DOI] [PMC free article] [PubMed] [Google Scholar]
- Fuentes P, Cánovas J, Berndt FA, Noctor SC, Kukuljan M. CoREST/LSD1 control the development of pyramidal cortical neurons. Cereb Cortex. 2012;22:1431–1441. doi: 10.1093/cercor/bhr218. [DOI] [PubMed] [Google Scholar]
- Goslin K, Banker G. Rat hippocampal neurons in low-density cultures. In: Banker G, Goslin K, editors. Culturing nerve cells. Cambridge, MA: MIT; 1991. pp. 251–281. [Google Scholar]
- Greig LC, Woodworth MB, Galazo MJ, Padmanabhan H, Macklis JD. Molecular logic of neocortical projection neuron specification, development and diversity. Nat Rev Neurosci. 2013;14:755–769. doi: 10.1038/nrn3586. [DOI] [PMC free article] [PubMed] [Google Scholar]
- Han W, Kwan KY, Shim S, Lam MM, Shin Y, Xu X, Zhu Y, Li M, Sestan N. TBR1 directly represses Fezf2 to control the laminar origin and development of the corticospinal tract. Proc Natl Acad Sci U S A. 2011;108:3041–3046. doi: 10.1073/pnas.1016723108. [DOI] [PMC free article] [PubMed] [Google Scholar]
- Henríquez B, Hepp M, Merino P, Sepulveda H, van Wijnen AJ, Lian JB, Stein GS, Stein JL, Montecino M. C/EBPβ binds the P1 promoter of the Runx2 gene and up-regulates Runx2 transcription in osteoblastic cells. J Cell Physiol. 2011;226:3043–3052. doi: 10.1002/jcp.22652. [DOI] [PMC free article] [PubMed] [Google Scholar]
- Hevner RF, Shi L, Justice N, Hsueh Y, Sheng M, Smiga S, Bulfone A, Goffinet AM, Campagnoni AT, Rubenstein JL. Tbr1 regulates differentiation of the preplate and layer 6. Neuron. 2001;29:353–366. doi: 10.1016/S0896-6273(01)00211-2. [DOI] [PubMed] [Google Scholar]
- Hevner RF, Hodge RD, Daza RA, Englund C. Transcription factors in glutamatergic neurogenesis: conserved programs in neocortex, cerebellum, and adult hippocampus. Neurosci Res. 2006;55:223–233. doi: 10.1016/j.neures.2006.03.004. [DOI] [PubMed] [Google Scholar]
- Hirata T, Suda Y, Nakao K, Narimatsu M, Hirano T, Hibi M. Zinc finger gene fez-like functions in the formation of subplate neurons and thalamocortical axons. Dev Dyn. 2004;230:546–556. doi: 10.1002/dvdy.20068. [DOI] [PubMed] [Google Scholar]
- Hong CJ, Hsueh YP. Cytoplasmic distribution of T-box transcription factor Tbr-1 in adult rodent brain. J Chem Neuroanat. 2007;33:124–130. doi: 10.1016/j.jchemneu.2007.01.005. [DOI] [PubMed] [Google Scholar]
- Jawaid K, Wahlberg K, Thein SL, Best S. Binding patterns of BCL11A in the globin and GATA1 loci and characterization of the BCL11A fetal hemoglobin locus. Blood Cells Mol Dis. 2010;45:140–146. doi: 10.1016/j.bcmd.2010.05.006. [DOI] [PubMed] [Google Scholar]
- John A, Brylka H, Wiegreffe C, Simon R, Liu P, Jüttner R, Crenshaw EB, 3rd, Luyten FP, Jenkins NA, Copeland NG, Birchmeier C, Britsch S. Bcl11a is required for neuronal morphogenesis and sensory circuit formation in dorsal spinal cord development. Development. 2012;139:1831–1841. doi: 10.1242/dev.072850. [DOI] [PMC free article] [PubMed] [Google Scholar]
- Kuo TY, Hsueh YP. Expression of zinc finger transcription factor Bcl11A/Evi9/CTIP1 in rat brain. J Neurosci Res. 2007;85:1628–1636. doi: 10.1002/jnr.21300. [DOI] [PubMed] [Google Scholar]
- Kuo TY, Hong CJ, Hsueh YP. CTIP1 regulates expression of DCC and MAP1b in control of axon branching and dendrite outgrowth. Mol Cell Neurosci. 2009;42:195–207. doi: 10.1016/j.mcn.2009.07.006. [DOI] [PubMed] [Google Scholar]
- Kuwata T, Nakamura T. BCL11A is a SUMOylated protein and recruits SUMO-conjugation enzymes in its nuclear body. Genes Cells. 2008;13:931–940. doi: 10.1111/j.1365-2443.2008.01216.x. [DOI] [PubMed] [Google Scholar]
- Leal-Ortiz S, Waites CL, Terry-Lorenzo R, Zamorano P, Gundelfinger ED, Garner CC. Piccolo modulation of Synapsin1a dynamics regulates synaptic vesicle exocytosis. J Cell Biol. 2008;181:831–846. doi: 10.1083/jcb.200711167. [DOI] [PMC free article] [PubMed] [Google Scholar]
- Liu P, Keller JR, Ortiz M, Tessarollo L, Rachel RA, Nakamura T, Jenkins NA, Copeland NG. Bcl11a is essential for normal lymphoid development. Nat Immunol. 2003;4:525–532. doi: 10.1038/ni925. [DOI] [PubMed] [Google Scholar]
- Livak KJ, Schmittgen TD. Analysis of relative gene expression data using real-time quantitative PCR and the 2(−δδCT) method. Methods. 2001;25:402–408. doi: 10.1006/meth.2001.1262. [DOI] [PubMed] [Google Scholar]
- Logan AC, Nightingale SJ, Haas DL, Cho GJ, Pepper KA, Kohn DB. Factors influencing the titer and infectivity of lentiviral vectors. Hum Gene Ther. 2004;15:976–988. doi: 10.1089/hum.2004.15.976. [DOI] [PubMed] [Google Scholar]
- LoTurco J, Manent JB, Sidiqi F. New and improved tools for in utero electroporation studies of developing cerebral cortex. Cereb Cortex. 2009;19:i120–i125. doi: 10.1093/cercor/bhp033. [DOI] [PMC free article] [PubMed] [Google Scholar]
- Maass JC, Berndt FA, Cánovas J, Kukuljan M. p27Kip1 knockdown induces proliferation in the organ of Corti in culture after efficient shRNA lentiviral transduction. J Assoc Res Otolaryngol. 2013;14:495–508. doi: 10.1007/s10162-013-0383-2. [DOI] [PMC free article] [PubMed] [Google Scholar]
- Matsuda T, Cepko CL. Electroporation and RNA interference in the rodent retina in vivo and in vitro. Proc Natl Acad Sci U S A. 2004;101:16–22. doi: 10.1073/pnas.2235688100. [DOI] [PMC free article] [PubMed] [Google Scholar]
- McKenna WL, Betancourt J, Larkin KA, Abrams B, Guo C, Rubenstein JL, Chen B. Tbr1 and Fezf2 regulate alternate corticofugal neuronal identities during neocortical development. J Neurosci. 2011;31:549–564. doi: 10.1523/JNEUROSCI.4131-10.2011. [DOI] [PMC free article] [PubMed] [Google Scholar]
- Molyneaux BJ, Arlotta P, Hirata T, Hibi M, Macklis JD. Fezl is required for the birth and specification of corticospinal motor neurons. Neuron. 2005;47:817–831. doi: 10.1016/j.neuron.2005.08.030. [DOI] [PubMed] [Google Scholar]
- Molyneaux BJ, Arlotta P, Menezes JR, Macklis JD. Neuronal subtype specification in the cerebral cortex. Nat Rev Neurosci. 2007;8:427–437. doi: 10.1038/nrn2151. [DOI] [PubMed] [Google Scholar]
- Monaghan AP, Grau E, Bock D, Schütz G. The mouse homolog of the orphan nuclear receptor tailless is expressed in the developing forebrain. Development. 1995;121:839–853. doi: 10.1242/dev.121.3.839. [DOI] [PubMed] [Google Scholar]
- Oliva C, Sierralta J. Regulation of axonal development by the nuclear protein hindsight (pebbled) in the Drosophila visual system. Dev Biol. 2010;344:911–921. doi: 10.1016/j.ydbio.2010.06.007. [DOI] [PubMed] [Google Scholar]
- Saito T, Nakatsuji N. Efficient gene transfer into the embryonic mouse brain using in vivo electroporation. Dev Biol. 2001;240:237–246. doi: 10.1006/dbio.2001.0439. [DOI] [PubMed] [Google Scholar]
- Saito T, Hanai S, Takashima S, Nakagawa E, Okazaki S, Inoue T, Miyata R, Hoshino K, Akashi T, Sasaki M, Goto Y, Hayashi M, Itoh M. Neocortical layer formation of human developing brains and lissencephalies: consideration of layer-specific marker expression. Cereb Cortex. 2011;21:588–596. doi: 10.1093/cercor/bhq125. [DOI] [PubMed] [Google Scholar]
- Sankaran VG, Menne TF, Xu J, Akie TE, Lettre G, Van Handel B, Mikkola HK, Hirschhorn JN, Cantor AB, Orkin SH. Human fetal hemoglobin expression is regulated by the developmental stage-specific repressor BCL11A. Science. 2008;322:1839–1842. doi: 10.1126/science.1165409. [DOI] [PubMed] [Google Scholar]
- Sankaran VG, Xu J, Ragoczy T, Ippolito GC, Walkley CR, Maika SD, Fujiwara Y, Ito M, Groudine M, Bender MA, Tucker PW, Orkin SH. Developmental and species-divergent globin switching are driven by BCL11A. Nature. 2009;460:1093–1097. doi: 10.1038/nature08243. [DOI] [PMC free article] [PubMed] [Google Scholar]
- Sankaran VG, Xu J, Orkin SH. Transcriptional silencing of fetal hemoglobin by BCL11A. Ann N Y Acad Sci. 2010;1202:64–68. doi: 10.1111/j.1749-6632.2010.05574.x. [DOI] [PubMed] [Google Scholar]
- Sena-Esteves M, Tebbets JC, Steffens S, Crombleholme T, Flake AW. Optimized large-scale production of high titer lentivirus vector pseudotypes. J Virol Methods. 2004;122:131–139. doi: 10.1016/j.jviromet.2004.08.017. [DOI] [PubMed] [Google Scholar]
- Senawong T, Peterson VJ, Leid M. BCL11A-dependent recruitment of SIRT1 to a promoter template in mammalian cells results in histone deacetylation and transcriptional repression. Arch Biochem Biophys. 2005;434:316–325. doi: 10.1016/j.abb.2004.10.028. [DOI] [PMC free article] [PubMed] [Google Scholar]
- Shibata M, Gulden FO, Sestan N. From trans to cis: transcriptional regulatory networks in neocortical development. Trends Genet. 2015;31:77–87. doi: 10.1016/j.tig.2014.12.004. [DOI] [PMC free article] [PubMed] [Google Scholar]
- Srinivasan K, Leone DP, Bateson RK, Dobreva G, Kohwi Y, Kohwi-Shigematsu T, Grosschedl R, McConnell SK. A network of genetic repression and derepression specifies projection fates in the developing neocortex. Proc Natl Acad Sci U S A. 2012;109:19071–19078. doi: 10.1073/pnas.1216793109. [DOI] [PMC free article] [PubMed] [Google Scholar]
- Stenman J, Yu RT, Evans RM, Campbell K. Tlx and Pax6 cooperate genetically to establish the pallio-subpallial boundary in the embryonic mouse telencephalon. Development. 2003;130:1113–1122. doi: 10.1242/dev.00328. [DOI] [PubMed] [Google Scholar]
- Stoscheck CM. Quantitation of protein. Methods Enzymol. 1990;182:50–68. doi: 10.1016/0076-6879(90)82008-P. [DOI] [PubMed] [Google Scholar]
- Tomassy GS, De Leonibus E, Jabaudon D, Lodato S, Alfano C, Mele A, Macklis JD, Studer M. Area-specific temporal control of corticospinal motor neuron differentiation by COUP-TFI. Proc Natl Acad Sci U S A. 2010;107:3576–3581. doi: 10.1073/pnas.0911792107. [DOI] [PMC free article] [PubMed] [Google Scholar]
- Wu X, Satpathy AT, Kc W, Liu P, Murphy TL, Murphy KM. Bcl11a controls Flt3 expression in early hematopoietic progenitors and is required for pDC development in vivo. PLoS One. 2013;8:e64800. doi: 10.1371/journal.pone.0064800. [DOI] [PMC free article] [PubMed] [Google Scholar]
- Xu J, Sankaran VG, Ni M, Menne TF, Puram RV, Kim W, Orkin SH. Transcriptional silencing of γ-globin by BCL11A involves long-range interactions and cooperation with SOX6. Genes Dev. 2010;24:783–798. doi: 10.1101/gad.1897310. [DOI] [PMC free article] [PubMed] [Google Scholar]
- Yu Y, Wang J, Khaled W, Burke S, Li P, Chen X, Yang W, Jenkins NA, Copeland NG, Zhang S, Liu P. Bcl11a is essential for lymphoid development and negatively regulates p53. J Exp Med. 2012;209:2467–2483. doi: 10.1084/jem.20121846. [DOI] [PMC free article] [PubMed] [Google Scholar]