

Abstract
For decades, neurophysiologists have worked on elucidating the function of the cortical sensorimotor control system from the standpoint of kinematics or dynamics. Recently, computational neuroscientists have developed models that can emulate changes seen in the primary motor cortex during learning. However, these simulations rely on the existence of a reward-like signal in the primary sensorimotor cortex. Reward modulation of the primary sensorimotor cortex has yet to be characterized at the level of neural units. Here we demonstrate that single units/multiunits and local field potentials in the primary motor (M1) cortex of nonhuman primates (Macaca radiata) are modulated by reward expectation during reaching movements and that this modulation is present even while subjects passively view cursor motions that are predictive of either reward or nonreward. After establishing this reward modulation, we set out to determine whether we could correctly classify rewarding versus nonrewarding trials, on a moment-to-moment basis. This reward information could then be used in collaboration with reinforcement learning principles toward an autonomous brain–machine interface. The autonomous brain–machine interface would use M1 for both decoding movement intention and extraction of reward expectation information as evaluative feedback, which would then update the decoding algorithm as necessary. In the work presented here, we show that this, in theory, is possible.
Keywords: BMI, mirror neurons, motor cortex, reward
Introduction
Traditionally, the motor cortex has been theorized to carry information on either movement dynamics or kinematics (Georgopoulos et al., 1988; Kalaska et al., 1997; Moran and Schwartz, 1999; Scott et al., 2001; Kurtzer et al., 2006; Chhatbar and Francis, 2013). More recently, the motor cortex has been viewed from a control-engineering (Todorov and Jordan, 2002; Scott, 2004) and dynamical systems viewpoint (Churchland et al., 2012). Modulatory signals, such as dopaminergic drive (Francis and Song, 2011), appear necessary for the induction of long-term potentiation (LTP) in the motor cortex. Such dopaminergic drive has been used in simulations to emulate motor cortical plasticity in conjunction with a brain–machine interface (BMI) (Legenstein et al., 2010), as well as to control robotic limbs (Dura-Bernal et al., 2014). Recently, there has been evidence of VTA-induced corelease of dopamine and glutamate in the primary sensorimotor cortex of rats, indicating how such dopaminergic drive could have influences on multiple timescales (Kunori et al., 2014). Human studies using transcranial magnetic stimulation have demonstrated momentary reward-induced changes in M1 excitability (Thabit et al., 2011). However, dopaminergic modulation of the sensorimotor cortex has yet to be quantified on the level of unit firing rates and field potentials. Neural correlates of reward expectation have been found in a variety of cortical and noncortical regions, many of which connect to M1 (Platt and Glimcher, 1999; Roesch and Olson, 2003; Musallam et al., 2004; Tanaka et al., 2004; Campos et al., 2005; Shuler and Bear, 2006; Louie et al., 2011; Mizuhiki et al., 2012), and dopamine receptors exist in M1 (Richfield et al., 1989).
We wished to determine whether reward modulation would be seen in M1, from both a basic neuroscience perspective as well as a biomedical engineering standpoint, for the generation of an autonomous BMI. Imagine if we could record a signal from the brain itself that tells us whether “things” are going well, or not. Such feedback could be used to adapt a BMI using reinforcement learning (DiGiovanna et al., 2009; Sanchez et al., 2009; Bae et al., 2011; Tarigoppula et al., 2012). Toward this goal and to further our understanding of reward modulation on the sensorimotor cortex, we recorded neural activity bilaterally from M1 in macaques while they either made manual reaching movements to a visually cued target or simply observed cursor trajectories to such targets. Reward expectation was indicated either via the color of the target or via the trajectory of the feedback cursor. Our goals are threefold: (1) to quantify the reward modulation of bilateral M1 during awake behavior at the neural level; (2) to demonstrate that previously noted observation activated neurons in M1 (Tkach et al., 2007; Dushanova and Donoghue, 2010; Vigneswaran et al., 2013) are also reward modulated; and (3) to discuss how this new knowledge can be used to generate an autonomous BMI.
Materials and Methods
Surgery.
Three bonnet macaques (Macaca radiata) were implanted bilaterally in the primary motor cortex with chronic 96-channel platinum microelectrode arrays (10 × 10 array separated by ∼400 μm, 1.5 mm electrode length, 400 kOhm impedance, ICS-96 connectors, Blackrock Microsystems). The implantation of large numbers of electrodes was made possible because of our previously described techniques (Chhatbar et al., 2010). We briefly summarize here. All surgical procedures were conducted in compliance with guidelines set forth by the National Institutes of Health Guide for the Care and Use of Laboratory Animals and were further approved by the State University of New York Downstate Institutional Animal Care and Use Committee. All surgical procedures were performed under general anesthesia, and aseptic conditions were maintained throughout. Anesthesia and animal preparation were performed directly or were supervised by members of the State University of New York Division of Comparative Medicine veterinary staff. Ketamine was used to induce anesthesia; isofluorane and fentanyl were used in maintenance of anesthesia. Dexamethasone was used to prevent inflammation during the procedures, and diuretics, such as mannitol and furosemide, were available to further reduce cerebral swelling if needed. All subjects were observed hourly for the first 12 hours after implantation and were provided with a course of antibiotics (baytril and bicilin) and analgesics (buprenorphine and rimadyl) commensurate with the recommendations of the Division of Comparative Medicine veterinary staff.
Three to 6 months before this electrode array implantation, an initial implantation with a footed titanium headpost (Crist Instrument) to allow head fixation during training was conducted, again under aseptic conditions. Head restraint of the animal is required for our experiments to ensure minimization of movement artifacts on our neural recording system, as well as to track the movement of the eyes. Implantation was performed following training to a sustained performance level of at least 90% correctly completed trials per training session for manual tasks.
Extracellular unit recordings.
Subjects were allowed to recover for 2–3 weeks after implantation surgery, after which recordings of single-unit, multiunit, and local field potential (LFP) activity were recorded while the subjects performed the below tasks. Recordings were made using multichannel acquisition processor systems (Plexon). Neural signals were amplified, bandpass filtered (170 Hz to 8 kHz for single and multiunit activity and 0.7–300 Hz for LFPs), sampled at 40 kHz for single-unit/multiunit activity activity and 2 KHz for LFP, thresholded and single-unit/multiunits were sorted based on their waveforms using principal component (PC)-based methods in Sort-Client software (Plexon). For data analysis, we used bilateral M1 units from Monkeys A and C, and ipsilateral M1 units from Monkey Z for our manual experiments. In our observation experiments, we analyzed data from the contralateral M1 (with respect to the right arm) of Monkey A and the ipsilateral M1 (with respect to the right arm) of Monkey Z. For the purposes of this work, we did not specifically segregate between single units and multiunits. An average of 180 M1 units were recorded per session/d.
Electromyography.
Surface gold disc electrodes (Grass Technologies) were sewn onto elastic bands and placed on the skin overlying muscle groups. EMG was recorded from the following muscle groups: latissimus dorsi, biceps, deltoid, triceps, forearm extensors, and forearm flexors. EMG signals were acquired through the Plexon system at a sampling rate of 2 kHz.
Experimental setup and behavioral training.
Three Bonnet macaques (M. radiata, 2 females, 1 male) were trained to perform a center-out reaching task while their right arm rested inside the Kinarm exoskeletal robotic manipulandum (BKIN Technologies). There were two main types of experiments: manual and observational tasks. Visual feedback of the current hand position was provided by a hand feedback cursor on the monitor that precisely colocated with the tip of the monkey's middle finger during manual trials. The manual task (see Fig. 1a), consisted of right hand movements from a center target to a peripheral target located 5 cm to the right of a start position. The target radius was 0.8 cm. Trials were initiated by entering the center target (with neutral color, see Fig. 1, green) and holding for 325 ms (center hold). The center hold was followed by the color cue period (100–300 ms depending on the animal's temperament). The color-cued peripheral target was displayed, and the color of the center target changed from the neutral color to the same color as the cued peripheral target, informing the monkey whether the trial would be rewarding or nonrewarding. The monkey was required to maintain its hold on the color-cued center for 325–400 ms, again depending on the animal's temperament. The implicit GO cue was when the center target disappeared after the 300 ms color cue period, at which time the monkey could move to the peripheral target, where it had to hold for 325 ms before receiving a liquid reward or no reward. A liquid reward was provided only after a successful reach for a rewarding trial. If the monkey failed to complete a trial correctly, the same trial was repeated, giving incentive to perform nonrewarding trials correctly the first time. Trials types were randomized otherwise.
Figure 1.

Manual task. a, Reward experiment. The monkey was required to hold at the center target for 325 ms before the peripheral target appeared, then hold an additional 300 ms before the center target disappeared, the go cue to move to the peripheral target, and hold for 325 ms before receiving a liquid reward or no reward. The drop symbolizes reward. The clock symbolizes no reward (i.e., passage of time). b, Modulation of M1 units by reward expectation. Left subplot represents a unit with a higher firing rate during rewarding trials. Right subplot represents the converse relation. For each sample unit, the average of all waveforms (black) with sample waveforms (gray) are shown above the perievent rasters. We have plotted the average firing rate with ± SEM (shaded region following the curves) for rewarding (red) and nonrewarding (blue) trials, and corresponding sample rasters. In each graph, the black dotted line indicates the time of color cue and the red dotted line indicates the average time of reward. Pie graph represents the total percentage of M1 units that had higher firing rates during rewarding trials, nonrewarding trials, or neither.
For the first observational task (observational task 1, OT1), the rewarding and nonrewarding trials were color-coded as in the manual task; however, in the observational tasks, the hand feedback cursor would automatically move on its own to the peripheral target to the right of the center target while the KINARM was locked into place, so that the monkey could not make active reaching movements (see Fig. 2a). The left arm was restrained with a padded cuff for all experiment types. In this task, the cursor moved at a constant speed toward the peripheral target. The monkeys knew when the KINARM was locked and did not attempt to make reaching movements during these trials. For the second observational task (OT2), the color of the targets was maintained to be the same for rewarding and nonrewarding trials (i.e., there was no color cueing in OT2). The cue of reward versus no reward was the cursor moving toward or away from a peripheral target, respectively. In this version of the task, there were two possible peripheral targets, as can be seen in Figure 3a.
Figure 2.

OT1. a, Reward experiment. The monkey would fixate at the center target and observe the center target change color: red represents a rewarding trial; blue represents a nonrewarding trial. The cursor would then move toward the peripheral target at a constant speed with movement toward a red target resulting in a reward, once the cursor arrived inside the target, as indicated by the drop of liquid. For blue targets, reward was withheld as indicated by the clock. The monkey had to view the target plane to start a trial and maintain visual gaze until the color cue was given. b, Modulation of M1 units by reward expectation. Left subplot represents a unit with higher firing rate during rewarding trials. Right subplot represents a unit with a higher firing rate during nonrewarding trials. For each sample unit, the average of all waveforms (black) with sample waveforms (gray) are shown above the perievent rasters. We have plotted the average firing rate ± SEM (shaded region following the curves) for rewarding (red) and nonrewarding (blue) trials, and corresponding sample rasters. In each graph, the black dotted line indicates the time of color cue and the red dotted line indicates the time of reward. Pie graph represents the total percentage of M1 units that had higher firing rates during rewarding trials, nonrewarding trials, or neither.
Figure 3.
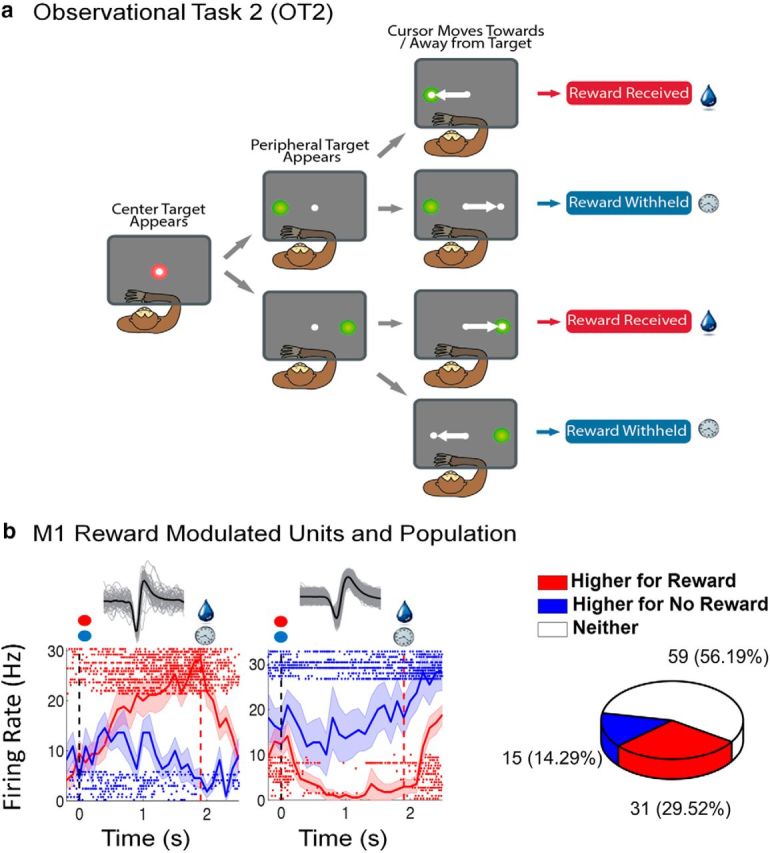
OT2. a, Reward experiment. The monkey observed the cursor moving away or toward a target with movement toward the target resulting in a reward, once the cursor arrived inside the target, as indicated by the drop of liquid, and no reward otherwise as indicated by the clock. b, Modulation of M1 units by reward expectation. Left subplot represents a unit that had a higher firing rate during rewarding trials. Right subplot represents a unit that had a higher firing rate during nonrewarding trials. For each sample unit, the average of all waveforms (in black) with sample waveforms in gray is shown above the perievent rasters. We have plotted the average firing rate ± SEM (shaded region following the curves) for rewarding (red) and nonrewarding (blue) trials, and corresponding sample rasters. In each graph, the black dotted line indicates the time of the go cue and the red dotted line indicates time of reward. Pie graph represents the total percentage of M1 units that fired higher during rewarding trials, nonrewarding trials, or neither.
During every trial, eye-tracking was conducted using an IR-sensitive camera. A trial was aborted if the monkey failed to look at the projection screen where the tasks was displayed during either the color cue period (manual task and OT1) or during the initial feedback cursor movement (OT2).
Data analysis.
Multivariate linear regression was performed on the neural firing rates (100 ms bins) to fit and predict shoulder and elbow positions acquired during the manual task (for fits and predictions, see Table 1). The mean of each 100 ms of position data was fit by 10 bins of neural data, corresponding to 1 s of causal information (Francis and Chapin, 2006) (for fits and predictions, see Table 1). Multivariate linear regression was also performed on the neural data (100 ms bins) to fit and predict EMGs of the right latissimus dorsi and right biceps brachii acquired during the manual task and OT1 (for fits and predictions, see Table 2).
Table 1.
Fit and prediction R values of the multivariate linear regression performed on the raw neural data with respect to the shoulder and elbow angle
| Shoulder angle |
Elbow angle |
|||
|---|---|---|---|---|
| Fit | Prediction | Fit | Prediction | |
| Monkey A | ||||
| Contralateral M1 | 0.8131 | 0.7177 | 0.6167 | 0.3382 |
| Ipsilateral M1 | 0.8762 | 0.5047 | 0.9022 | 0.6175 |
| Monkey C | ||||
| Contralateral M1 | 0.7161 | 0.5966 | 0.6879 | 0.6304 |
| Ipsilateral M1 | 0.6215 | 0.3375 | 0.6913 | 0.4134 |
| Monkey Z | ||||
| Ipsilateral M1 | 0.6999 | 0.5577 | 0.6267 | 0.4325 |
Table 2.
Fit and prediction R values of the multivariate linear regression performed on the raw neural data with respect to the right latissimus dorsi and right biceps brachii EMG of Monkey Aa
| EMG channel | Right latissimus dorsi | Right biceps brachii |
|---|---|---|
| EMG reward data manual | ||
| Prediction R | 0.877 | 0.9371 |
| Fit R | 0.9894 | 0.9917 |
| EMG reward data OT1 | ||
| Prediction R | 0.0112 | 0.0023 |
| Fit R | 0.6698 | 0.6631 |
aEMG channels show that the muscle activity is correlated highly with the neural data for the manual task, but not for observation task 1 (OT1).
The total number of units acquired in each task per brain area ranged from 31 to 214. For the manual task: Monkey A had 172 contralateral M1 units and 126 ipsilateral M1 units (total of 298 units). Monkey C had 89 contralateral M1 units and 100 ipsilateral M1 units (total 189 units). Monkey Z had 52 ipsilateral M1 units. Hence, the total number of M1 units was 539. For observation task 1: Monkey A had 214 contralateral M1 units and Monkey Z had 51 ipsilateral M1 units. For observation task 2: Monkey A had 54 contralateral M1 units and Monkey Z had 51 ipsilateral M1 units. The amount of units available slowly decreased over time after implantation.
For the manual task, we pruned the data in the following manner to be sure that the differences between rewarding and nonrewarding trials were not due to differences in kinematics. Nonrewarded trials were pruned, so that only trials with maximum velocity, path length, and time to reward within one SD of the average rewarding trials were selected. All the trials whose maximum velocity peak occurred at or after 1200 ms (qualitatively/visually selected) after the initiation of the trial were eliminated to remove trials with delayed reach time. Trials with double peaks in the velocity profile were also removed. Only neural data from pruned trials were selected for analysis. The separability between rewarding and nonrewarding trials was evident without pruning the data (data not shown). However, the data were pruned to show that the separability was not purely due to kinematic differences between the trials.
We analyzed the neural data comparing rewarding to nonrewarding trials. The observational tasks lasted longer compared with the manual tasks due to our choice of the cursor speed. In the manual task, we considered data (binned at 100 ms) starting 200 ms before the color cue and ending 1500 ms (includes 300 ms after average reach time to the target) after the presentation of the color cue for each trial, whereas in the observation task, we considered data (binned at 100 ms) starting 200 ms before the color cue and ending 2700 ms (includes 300 ms after reach time to the target) after the presentation of the color cue for OT1, and movement onset for OT2 for each trial. There was no statistical difference (two-sample t test, p < 0.05) between the neural data considered 200 ms before the color cue (manual and OT1), or the start of movement (OT2) for rewarding versus nonrewarding trials.
The square root transform was performed on all units' binned data to bring the values closer to a Gaussian distribution (Yu et al., 2009). Reward-modulated units (units with a significantly different firing rate between rewarding and nonrewarding trials for a state in the trial: two-sample t test, p < 0.05) were further separated based on whether their average firing rate was higher for rewarding or nonrewarding trials. Units from these groups were selected as samples for the figures.
For Figure 5a–c, the following states were considered: before the color cue (200 ms), color cue present (300 ms), movement of cursor (task-dependent), reward period (300 ms), after reward period (300 ms). For each state, a two-sample t test (p < 0.05) was used to determine whether a significant difference existed between rewarding and nonrewarding trials.
Figure 5.
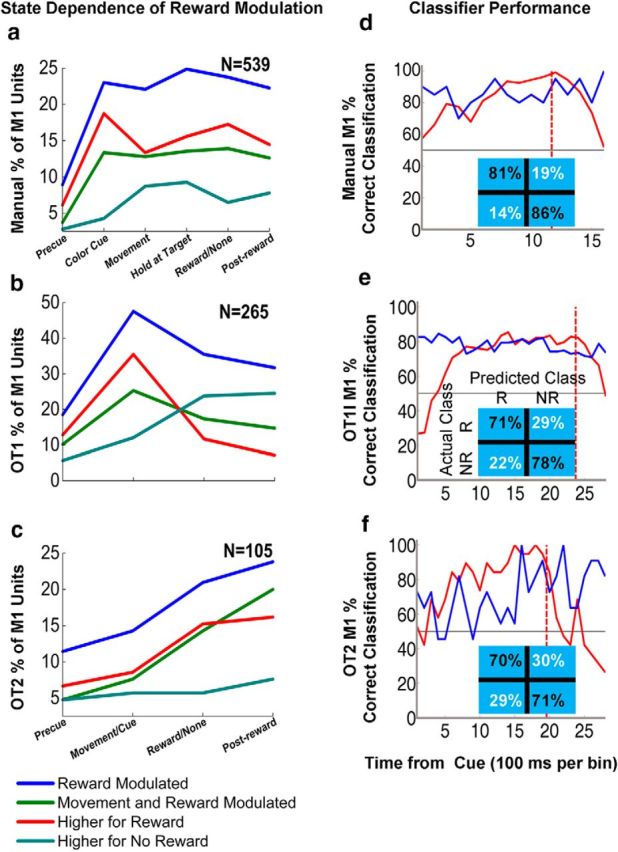
State dependence of reward modulation in the manual task (a, M1), OT1 (b, M1), and OT2 (c, M1). Blue represents the percentage of significantly reward-modulated units through different states in the trial. Red represents percentage of units that fired higher during rewarding trials than during nonrewarding trials in a given state. Cyan represents percentage of units that fired lower during rewarding trials than during nonrewarding trials in a given state. Green represents the percentage of reward-modulated units that fired significantly higher during movement than during the color cue hold period. N equals the total number of units for each brain region. Two-sample t test (p < 0.05) on square-root transformed neural vectors for rewarding versus nonrewarding trials and color cue versus movement periods. d–f, Samples of linear classifier performance using leave-one out analysis. Graphs represent the linear classifier performance for the subjects using select principal component scores from the contralateral M1 of Monkey A while he performed the manual task (d), from the contralateral M1 of Monkey A while he performed observation task 1 (e), and from the ipsilateral M1 of Monkey Z while she performed observation task 2 (f). Red lines indicate true positives. Blue lines indicate true negatives. Inset tables represent the confusion matrices for sample results. The time of color cue is zero on the x-axis. Red dotted line indicates time of reward. Empirical chance is 50% (gray line).
Classifiers.
PC analysis was performed on all the units' data from 100 ms bins during the times taken from the pruned data for the manual files and all the completed trials in the observational tasks. The neural data were z-scored before running the princomp function in MATLAB (MathWorks). As an example, if we had 100 units for a given experiment and there were 100 good trials that were 2000 ms long, we would then have a data matrix that was 2000 rows (nins) by 100 (units). This data matrix was then passed into the MATLAB function princomp. PC score values were separated into rewarding and (pruned, for the manual task) nonrewarding trials. Support vector machines, logistic regression, and linear discriminant analysis (linear classify function of MATLAB) were tested to obtain the best prediction of rewarding vs nonrewarding trials by using PC scores as inputs. The best results were obtained from the linear classify function in MATLAB. After training, the function classifies each bin of sampled data PC scores into one of the training groups: rewarding or nonrewarding. The smallest number of PC scores that gave the best prediction values was selected for use in the algorithm, which was 10. For each monkey, we applied leave-one-out cross validation on its data to quantify the classification performance.
LFP analysis.
LFP signals were collected from 32 channels of the M1 array through the plexon system at a sampling rate of 2k (filtered between 0.7 Hz and 300 Hz). Event-related time frequency (ERTF) analysis was performed using methods adapted from Canolty et al. (2012). Briefly, the average of the 32 channel LFP signal was filtered at frequencies centered from 1 to 128 Hz (in log space) using Gabor filters with a proportional filter bandwidth of 0.25 (bandwidth = 0.25 × the center frequency). For each frequency channel, the power of the filtered signal was realigned to the start of each trial and then averaged across trials. The trial-averaged power at each frequency was then normalized with respect to the value for the 500-0 ms pretrial period and expressed in dB unit.
Reinforcement learning (RL)-based BMI.
Briefly, the theory of RL indicates that an agent, such as an animal, or in our case the RL-BMI system, should act in a manner that leads to the most rewards while interacting with its environment. The term “environment” in our case includes the neural activation patterns from M1, and the type of reinforcement learning architecture we are considering here is termed actor critic, where the actor is the motor BMI and the critic is the evaluative feedback. The logic used by the actor to perform an action given a state, neural firing pattern, is called the policy. An action performed by the actor under a given policy leads it to a new state in the environment, and the consequence of such an action is used as feedback to modify its behavior/policy, which is learning.
Temporal difference learning is a branch of reinforcement learning that allows moment-to-moment updating given a simple evaluative feedback signal, such as the one we are deriving from our classifier. Specifically we used Q learning. The state-action value, Qπ(s, a), is the expected return starting from state “s” given that the RL agent executes the action “a” in state “s” under a policy π (Sutton and Barto, 1998). Specifically, we used an ε-greedy policy as the actor and the Q learning paradigm augmented with Eligibility Trace Q(λ), as the actor's update rule. An eligibility trace is extremely useful in dealing with the credit assignment problem (Sutton and Barto, 1998). The action with the highest Q value is selected 1 − ε percentage of the time (exploitation), whereas a random action is performed ε percentage of the time (exploration) under the ε-greedy policy. There are also ways to change ε given the systems performance, but such full descriptions are outside the scope of this work.
In Q learning, the TD error equation is as follows:
Where r = {− 1,1} is the immediate reward, γ = the discount rate and its allowable range is [0,1], (s, a) = the previous state and the action performed in state s under an ε-greedy policy π, respectively, and (s', a') = the current state and a' is the ε-greedy action in state s', respectively.
The TD error is used as feedback to update the estimates of the state-action values (Q values) as follows:
In our architecture, r is the class label predicted by a reward classifier (critic) whose input is the M1 neural activity. Specifically, when population firing is classified as rewarding, r is set to 1, whereas when the neural activity is classified as nonrewarding, r is set to −0.1. As such, a classifier outputs a binary evaluative measure by decoding the neural signal, which critiques the executed action. The architecture suggested here conforms to a broader definition of the actor-critic architecture as it has a separate memory structure to explicitly represent the policy independent of the entity providing the evaluative signal. The scalar evaluative signal is the sole output of the critic and drives all learning in the actor. The suggested architecture can easily be modified to conform to the stricter definition of actor-critic wherein the critic represents the estimated value function and the evaluative feedback provided by the critic is used to update itself along with the actor (Sutton and Barto, 1998). One can also envision versions where the user gives feedback on the critic's performance as a perfect source of feedback to update the critic and subsequently the actor when necessary.
Simulations.
One of our future biomedical engineering goals is to use neural activity from M1 simultaneously to control movement, via a motor BMI, as well as to update this BMI via an evaluative feedback signal, also derived from M1. One architecture that is well suited for this type of updating would be a BMI that works via reinforcement learning (DiGiovanna et al., 2009; Sanchez et al., 2011; Tarigoppula et al., 2012; Mahmoudi et al., 2013; Pohlmeyer et al., 2014), as this would only necessitate an evaluative signal, such as rewarding or nonrewarding, rather than a full error signal, such as the difference on a moment-to-moment basis between the desired movement trajectory and the actual one made by the BMI. This later full error signal is what most BMIs to date use. This decrease in the amount of information necessary for updating the BMI system makes it more plausible that such a system could autonomously correct itself in real-world changing environments. One can easily imagine combining the best of the supervised learning world with the best of the reinforcement-learning world, but we leave these architectures as future work at this point (see discussion below on methods of the RL agent).
Here we simply demonstrate that the amount of evaluative feedback obtained in our experiments from M1 would be sufficient for a reinforcement learning BMI in theory to work. Toward this goal, we used a simulation of the motor cortical output that we have previously used (Tarigoppula et al., 2012) in testing RL-BMI systems. We have previously used M1 information for BMI purposes (Chhatbar and Francis, 2013), including RL-based systems (Sanchez et al., 2011), and thus know that the movement-related activation is present, a well-known fact at present. We therefore needed to test whether the evaluative feedback from M1 would be sufficient as well. The RL system we used for our proof of concept was a simple one-step system. It used only the neural output from M1 at the start of the trial during target presentation. From that neural activation pattern, it decided which target to approach. This type of one step system has been shown previously in real-time (Pohlmeyer et al., 2012). Our rationale for using the simulation rather than the actual monkeys for this RL-BMI proof of concept is that the monkeys used for these reward-based experiments had lost their chronic recordings to a large extent by the time this work would have been conducted.
We used the classification rates obtained in our OT2 for this simulation, as it is reasonable to expect no difference, from the animal's point of view, between OT2 and an online one step RL-BMI. Our group has previously described the use of a RL paradigm in which an RL agent performed a 4 target-8 action center out reaching task by decoding the firing rate of a simulated M1 neuronal ensemble (Tarigoppula et al., 2012). We used this same neural model in our current work, and thus only briefly describe it here. In this M1 model, a group of neurons was simulated using the Izhikevich model neuron. The neural ensemble consisted of 80 neurons; 60% of the neurons had unimodal tuning curves, 15% were had bimodal tuning curves, and 25% had assigned asymmetric tuning curves, as observed by Amirikian et al. (2000). A tuning curve directed the degree of neural modulation, given the direction of the target with respect to the cursor's position. Preferred directions of these neurons were assigned randomly. A spike was detected every time the membrane potential of a neuron surpassed 30 mV (Tarigoppula et al., 2012). The task was identical to OT2 in spatial arrangement and cursor motion; however, the cursor was controlled by the RL system.
The target direction in a given trial changed each neuron's firing rate with respect to its baseline activity based on their respective tuning curves. That is, given a target in the left direction, the neurons that had their preferred direction to the left fired at their maximum firing rate, whereas the remaining neurons modulated their firing based on their tuning curve. Using the output of the simulated neural ensemble as the input to an artificial neural network, the Q value for each potential action was determined. Specifically, a multilayer perceptron (MLP) with a single hidden layer consisting of 120 units was used to calculate the Q value, given an input from the neural ensemble. Here, 99% of the time, the action with the highest Q value was executed (the “greedy” part of the ε-greedy policy). The other 1% of the time, a random action was taken (the exploratory rate, the “ε” part of the ε-greedy policy). The exploratory rate, the percentage of steps in which an action is executed randomly regardless of its optimality, was set at 1% (“ε” part of ε-greedy policy). The random exploration allows for discovery of new solutions by the RL agent, useful especially in an altering environment. Update of the weights of the MLP was performed by back-propagation (Bryson and Ho, 1969) of a qualitative error signal “TD error × eligibility trace,” calculated using the immediate reward it received based on the correct or incorrect action performed. A correct action resulted in evaluative feedback to the RL agent of either 1 (rewarding) or −0.1 (nonrewarding) with a probability determined by the success rate of our M1 classifier for OT2, equivalent to 70% correct feedback. This means that, 70% of the time in our simulation, the RL agent was given the correct evaluative feedback of rewarding or nonrewarding and 30% of the time it was given false information.
Results
Reward expectation during reaching modulates units in M1
In our first set of experiments, we recorded single-unit/multiunit activity bilaterally from M1 in three bonnet macaques while they performed a reaching task from a center target to a right peripheral target (Fig. 1a) while wearing an exoskeletal robot (BKIN Technologies) (data not shown). We choose a single target for this initial work on reward modulation in M1 to increase our statistical power by keeping reward as the only variable we tested because it is well known that neural activity in this region is modulated by direction, force, speed, etc. In what follows, we did not differentiate between single units and multiunits unless otherwise explicitly stated. To investigate neural correlates of reward expectation, we trained the subjects to perform the task with knowledge of whether a reward would be provided at the end of a successful trial by color coding the targets on the screen: for example, red for rewarding and blue for nonrewarding (Fig. 1a). Rewarding trials occurred 50%–67% of the time, based on the monkey's motivation level, and the trials were randomized within each recording session. We selected kinematically indistinguishable trajectories between the two reward contingencies for offline analysis to isolate the effect of reward (for details, see Materials and Methods). We discovered units in M1 whose firing rates modulated with respect to reward expectation.
Two example M1 single-unit responses are shown in Figure 1b. Responses for each trial were aligned at the color cue onset (Fig. 1b, black vertical dashed line) and were separated by trial type (red for rewarding and blue for nonrewarding). A difference in the firing pattern was observed for data considered after color cue and before reward/no reward was acquired (red vertical dashed line). The average firing rate of the left example unit was higher during rewarding trials whereas the right sample unit had a higher firing rate during nonrewarding trials (two-sample t test, p < 0.05, Fig. 1b). In the left example unit, the activity is qualitatively very similar between the trial types but simply shifted upward for rewarding trials. In total, 69.4% (181 of 261) of contralateral M1 units and 47.8% (133 of 278) of ipsilateral M1 units were reward modulated (pooled sum of statistically significant units, two-sample t tests, p < 0.05). Combining contralateral and ipsilateral M1 data, 44.0% (237 of 539) of M1 units had average firing rates significantly (two-sample t tests, p < 0.05) higher during rewarding trials than nonrewarding trials and 24.9% (134 of 539) of M1 units responded in the converse manner, with average firing rates significantly higher during nonrewarding trials than rewarding trials (Fig. 1b). When the color of the rewarding cue was switched as a control, there was no significant difference in the neural representation of reward (data not shown). This suggests that the above results were due to differences in reward and not color.
Reward expectation during observation tasks modulates units in M1
In recent years, it has become clear that we can decode movement intention from the neural activity in motor cortex and use it to control a BMI (Chapin et al., 1999; Serruya et al., 2002; Taylor et al., 2002). However, such systems need to be taught, and this generally is accomplished via supervised learning, with techniques as simple as linear regression (Chhatbar and Francis, 2013). We hope to generate a BMI that can update itself using reward expectation information from the user's brain and reinforcement learning principles (Pohlmeyer et al., 2014). Toward this goal, we needed to know whether reward modulation would also be measurable in the absence of actual arm movement. We designed two experiments in which reward was distributed conditionally upon passive observation of a moving cursor on a computer screen while the macaques' arms were kept stationary. During OT1, a cursor moved from a center start position to a peripheral target at a constant speed of 1 cm/s. The same target color cues used previously in the manual-reaching task above for nonrewarding and rewarding were presented at motion onset (Fig. 2a); thus, this task was identical to the manual version simply without active movement by the monkey.
Our results indicate that a subset of neurons in the M1 population is modulated by reward expectation in the absence of arm movement or muscle activation (Fig. 2b). We found that 47.2% (125 of 265) of M1 units had an average firing rate significantly (two-sample t tests, p < 0.05) higher during rewarding trials than nonrewarding trials and 39.6% (105 of 265) of M1 units had the opposite response (Fig. 2b). The diverse set of neural responses obtained as the left example unit in Fig. 2b demonstrated a large increase in activity for rewarding trials early, which then fell back toward baseline over the trial, whereas the right hand example unit showed tonic shifts in activity during the trial.
It was necessary to create an experiment where kinematic parameters were identical to prove that reward modulation existed in M1. However, there is generally no color cue in real-world BMI situations. Reward in real-world BMIs may be represented through a variety of explicit and circumstantial means, including those related to successful operation of the BMI. An M1 reward signal, if present under these circumstances, is a natural candidate for providing reward feedback to reinforcement learning BMIs.
To explore this possibility, we designed OT2, in which the macaques observed a cursor that either moved toward or away from a neutral colored target (Fig. 3a). The cursor movement was deterministic and always moved directly from the center start position either toward or away from the peripheral target, again at a constant speed as in OT1. Reward was delivered on trials in which the cursor reached the target but was withheld on trials in which the cursor moved away from the target (Fig. 3a). Again, we found a population of M1 units that was modulated by reward expectation (Fig. 3b). We found 29.5% (31 of 105) of M1 units had significantly (two-sample t tests, p < 0.05) higher average firing rates during rewarding trials and 14.3% (16 of 105) of M1 units had the opposite pattern (i.e., higher average firing rates during nonrewarding trials) (Fig. 3b).
To further probe reward's influence on M1, we analyzed both contralateral and ipsilateral cortices across the above three tasks and show our results in Figure 4: Monkey A contralateral (Fig. 4a–i) and Monkey Z ipsilateral M1 (Fig. 4j–r). We first tested the individual correlations between reward expectation and firing rate, as well as kinematic properties and firing rate for each unit. To do this, we concatenated all trials within a task and computed the correlation coefficient of binned (50 ms) spike rate against each of three variables: position, speed (for manual task only), and reward. Position refers to either the hand feedback cursor position during manual tasks or to the viewed position of the cursor during observational tasks. We did not consider speed for our correlation analysis during the observation tasks because the cursor speed was kept constant. Reward was assigned a value of −1 for nonrewarding trials and 1 for rewarding trials for all sample points within that trial. Mean correlation values and SEM are plotted in Figure 4a–c, j–l (bar plots) of units with significant correlations (Pearson's correlation test, p < 0.05).
Figure 4.
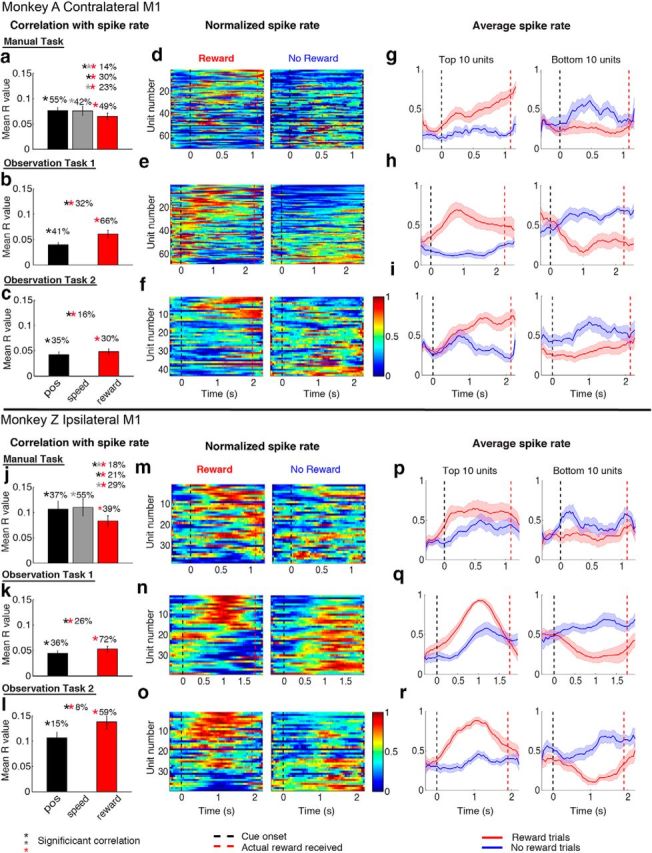
Contralateral versus ipsilateral M1 reward modulation. Top panels, Contralateral M1 of Monkey A. Bottom panels, Ipsilateral M1 of Monkey Z. Left column (a–c, j–l), Average correlation coefficient of firing rate to kinematic variables (position and speed) and “reward” variable. The bar value and error bar represent the mean and SEM of the significant correlations (p < 0.05), respectively. Percentages of significant correlated units are displayed above the bars. Middle columns (d–f, m–o), Population “neurograms” for rewarding and nonrewarding trials. The units were sorted according to the correlation coefficients with the variable “reward” in descending order. The spike times of each unit were binned at 50 ms for manual and passive tasks and smoothened with a moving average of 10 bins. The average firing rate for each unit was then linearly normalized to the range between 0 (blue) and 1 (red). Right columns (g–i, p–r), Average activity of the top 10 and bottom 10 units in the neurogram. Black dotted line indicates the time of color cue, and the red dotted line indicates the average time of reward for manual and the actual time of reward for the OT tasks.
For the manual task, we found that 55% of contralateral and 37% of ipsilateral units were significantly correlated with position (Fig. 4a,j, black bar for mean correlation values and black asterisks for significant correlations, Pearson's correlation test, p < 0.05), whereas 42% of contralateral and 55% of ipsilateral units were significantly correlated with speed (Fig. 4a,j, gray bar and asterisks). The firing rates of units in both cortices correlated significantly with reward: 49% of contralateral and 39% of ipsilateral units were significantly correlated with reward (Fig. 4a,j, red bar and red asterisks). Furthermore, 30% of contralateral units were correlated with position and reward (Fig. 4a, black and red double asterisk), 23% with both speed and reward (gray and red double asterisk), and 14% with all three variables (triple asterisk). Compared with the manual task, there was a larger percentage of units correlated with reward during observation task 1 for both contralateral (66%, Fig. 4b) and ipsilateral (72%, Fig. 4k) M1 units compared with the manual task. A subset of units was also correlated with cursor position (41% for contralateral and 36% for ipsilateral). To our knowledge, this is the first report of reward-modulated neurons in M1 to both action and action observation.
We next explored the population neural response difference between rewarding and nonrewarding trials using population neurograms, which show the average firing rate over time for all units (Fig. 4d–f,m–o). Thus, these figures show similar information to that seen for the PSTHs of the sample units in Figures 1, 2, and 3 as rows in the neurograms. The units were sorted by the strength of their correlation to reward in descending order. The average firing rate for each unit was linearly normalized across the two trial types to the range between 0 (minimum firing rate, blue) and 1 (maximum firing rate, red). In all three tasks, we observed a difference in firing rate profiles between rewarding and nonrewarding trials (Figs. 4d–f,m–o). The average activity of the top 10 and bottom 10 units is shown to the right (Figs. 4g–i,p–r, red for rewarding trials and blue for nonrewarding trials). Often the peak activity (Fig. 4h,p,q,r) is during the trial and not at the end as might be expected if actual reward delivery and consumption were causing the increased firing rates. The average firing rate pattern separates after cue onset (color cue for manual task, cursor movement onset for observation tasks). In summary, both contralateral and ipsilateral M1 contains units that simultaneously correlate with reward and kinematics during reaching and observation.
M1 reward modulation can be used for classifying reward expectation
Given the significant percentage of reward-modulated units, we examined our ability to classify the trial type on a moment-to-moment basis as would be beneficial for a temporal difference reinforcement learning BMI (see Materials and Methods). Our results indicated that the first few principal component scores generated from the neural data (see Materials and Methods) were differentially separable based on reward (data not shown). We then used select principal component scores to create a reward classifier. Because BMIs are often designed to take in neural data every 100 ms, we separated the principal component scores along the same temporal resolution. Select principal component scores were used as the input into a linear classifier (see Materials and Methods).
The percentage of M1 units displaying reward modulation with respect to different states in a given trial is shown in Figure 5a–c. The average classifier performance over all the M1 data for the manual task was 72.6% correct classification contralaterally and 69.0% correct ipsilaterally. The best M1 classifier performance was 81% true positives and 86% true negatives (Fig. 5d). Here, the optimal time point for classification was 1.1 s into the task, which yielded 98.4% correct classification.
The average classifier performance over all the M1 data for OT1 was 72.1% correct classification. In the OT1 task, the best classifier performance was 71% true positives and 78% true negatives (Fig. 5e). Here, the optimal time point for classification was 1.3 s into the task, which yielded 82.4% correct classification. For OT1, the M1 classifier showed a steep improvement between the color cue and 700 ms into the observed cursor movement (Fig. 5b,e). Classifier performance was maintained at ∼80% for rewarding and nonrewarding trials until 2.4 s into the trial (end of reward acquisition, Fig. 5e). For OT2, the classifier yielded 63.9% correct classification on average, showing improvement in performance as trial time increased (Fig. 5f). We had fewer units for OT2 as it was conducted last in our set of experiments after manual and then OT1. For OT2, the best classifier performance was 70% true positives and 71% true negatives (Fig. 5f). Here, the optimal time point for classification was 1.5 s into the task, which yielded 96.7% correct classification. It should be noted that all these classification rates are on the moment-to-moment 100 ms bins that could be used for a temporal difference reinforcement learning method. However, higher classification rates should be expected if one takes into consideration the full trial time.
LFP Indications of reward in M1
In addition to the above analysis on unit data, we explored whether reward modulation would be evident in LFPs recorded from M1 as well. Using data from the three tasks (manual, OT1, and OT2) we examined the ERTF components of the M1 LFPs using methods adapted from Canolty et al. (2012) (see Materials and Methods), in which we averaged all of the LFP channels together, making a proxy for a larger EEG-like electrode recording. The power of each frequency band was extracted and normalized to 500-0 ms pretrial value and expressed in dB units. Figure 6a shows an example ERTF from a recording session during the manual task from Monkey A's contralateral M1. As can be seen from this example, there are reward-modulated changes in LFP frequency power in the δ (1.5–4 Hz), θ (4.5–9 Hz), and β range (11–30 Hz) from the trial onset (color cue/cursor enters center target, black solid line) to the trial end (reward given/withheld, red dashed line). On average, the δ and θ band power during the trial decreases for rewarding trials and increases for nonrewarding trials (Fig. 6b, population average across all recording sessions). Similar changes are observed for Monkey Z ipsilateral M1 (Fig. 6g,h), although only θ band showed a significant difference. Interestingly, the LFP power in δ and θ power also showed reward modulated change during observing task 1 for both contralateral (Fig. 6c,d) and ipsilateral M1 (Fig. 6i,j). Similar trends can be observed for observation task 2 for some recording sessions (Fig. 6e,k), although the population average did not reach a significant level (Fig. 6f,l). It should be noted that OT2 was performed last, and our neural signals were more degraded compared with earlier experiments (manual and OT1).
Figure 6.
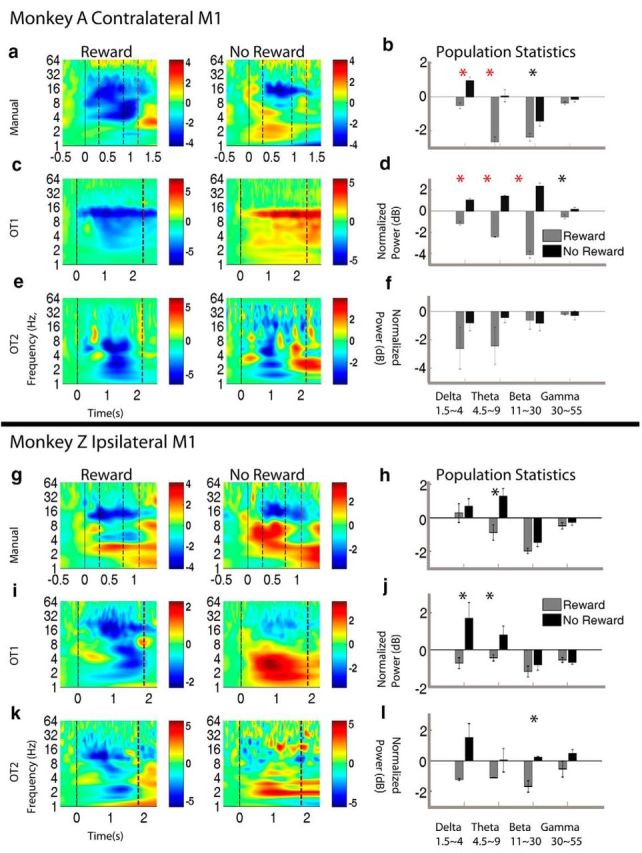
LFP modulation by reward expectation. Example event-related time frequency analysis from each of the three task types is shown for Monkey A contralateral M1 (a,c,e) and Monkey Z ipsilateral M1 (g,i,k). Left column, Nonrewarding trials. Middle column, Rewarding trials. Color scale is normalized LFP power relative to pretrial baseline (−500 to 0 ms). Solid black line indicates start of trial (color cue/cursor enters center target). First black dashed line indicates start of cursor movement. Second black dashed line indicates end of cursor movement. Red solid line indicates time of reward/reward withheld. Right column (b, d, f, h, j, l) represents the average δ, θ, β, and γ power for rewarding trials (gray) and nonrewarding trials (black) during the trial with SEM shown (error bar). Red stars represent significant difference between reward and no reward for a given LFP (paired-sample t test, p < 0.0125). *0.0125 < p < 0.05. LFP power increases in δ (1–4.5 Hz) and θ range (4.5–9 Hz) for nonrewarding trials and decreases for rewarding trials, in manual and OT1 tasks for both contralateral and ipsilateral cortices.
Simulated RL-BMI
To determine whether a reinforcement learning-based BMI could, in theory, perform a task successfully with the level of evaluative feedback we obtained from our classifiers, we ran simulations and present the results in Fig. 7. Figure 7a shows the simulated task, which was identical to OT2, as well as the neural network architecture used for the putative RL-BMI system (see Materials and Methods). We used a simulated M1 for driving the BMI action decisions while simultaneously using the percentage correct evaluative feedback we had previously derived from the actual monkeys' M1 for OT2 (Fig. 5f). As can be seen in Fig. 7b, the system converges to ∼90% success on this task using a rather simple RL learning system. This indicates that the generation of an autonomous RL-BMI should in principle be possible using information solely from M1.
Figure 7.

a, Architecture of the offline RL simulation: task plane with two targets (left and right) was created as shown in the figure. The firing rate of the units in the simulated motor cortex was dictated by their tuning curves, thus resulting in a differentiable neural signal for the two targets. The task used an ε-greedy policy RL agent (MLP) to decode the firing rate of the neural ensemble and move the cursor in a given trial. The MLP mapped the firing rate of the neural ensemble calculated every 100 ms to the state-action values (Q values). The MLP had a hidden layer with 120 units and 8 units in the output layer representing the Q values of the 8 possible actions corresponding to movements spaced 45 degrees apart along the circle. Only one action was allowed to be made per trial to reach the intended target. A reward is given as a qualitative feedback of the executed action with an accuracy of 70% to reflect the success rate acquired by our reward classifier on OT2 data (reward = 1 for the correct action; reward = −0.1 for the incorrect action). The qualitative feedback is used to adapt the RL agent through back-propagation. b, RL agent's performance: 8 actions, one step RL simulation, 70% accuracy of the reward feedback. Data are mean ± SE of the RL agent's performance across the simulation. The simulation consisted of 5000 trials. The performance of the RL agent was calculated every 100 trials in the given simulation. The RL agent attained >90% success rate with 70% accuracy of the reward feedback.
Discussion
Our results demonstrate that bilateral primary motor cortices are modulated by reward expectation in primates. M1 reward modulation is evident across manual and observation trial types. This modulation is evident at the resolution of neural units and LFP signals. We have shown that M1 units are modulated by reward, even in the absence of arm movement or muscle activation, while the animals viewed cursor trajectories. In addition, we have demonstrated that reward expectation can be predicted on a moment-to-moment basis using a classifier trained on principal component scores derived from M1 unit activities. We suggest that such reward classification can be used for the production of an autonomous brain–machine interface (DiGiovanna et al., 2009; Mahmoudi and Sanchez, 2011; Tarigoppula et al., 2012).
The contralateral cortex possessed a higher percentage of units modulated by reward expectation than did the ipsilateral. M1 contained a population of units that fired more during rewarding trials and another that fired more during nonrewarding trials. These results are congruent with work on the rostral anterior cingulate cortex (Toda et al., 2012), where both increasing and decreasing units were found during rewarding trials. Furthermore, the percentages of our increased and decreased firing rates were similar to work on reward-modulated mirror neurons in F5 (Caggiano et al., 2012). Given that M1 units are modulated by reward, even in the absence of arm movement or muscle activation, as well as via the viewed trajectory of a cursor, they appear to have a mirror-like quality (Tkach et al., 2007). In theory, this population of neurons could be reward-modulated neurons that respond to action observation (Tkach et al., 2007; Dushanova and Donoghue, 2010) as well as action itself. Further research would be necessary to determine whether they are mirror neurons, in the strict sense, and is left for future work.
Our results indicate the presence of reward expectation information in M1 before movement execution. During the manual task, 23.0% of the 539 M1 units fired differentially for reward before the movement start cue (Fig. 5a). Additionally, during both manual and observational tasks, there existed a subpopulation of units that were reward-modulated but not modulated by movement. These results imply that there may be separate neural populations in M1 that contain information about reward/reward expectation, movement, or both. Units found solely with reward modulation under this paradigm may have a preferred direction in an axis orthogonal to the ones used here, and further work will be necessary to determine this.
The percentage of reward-modulated M1 units was highest for OT1, followed by the manual task, and then OT2. This could be for a variety of reasons, including the reasonable assumption that the neurons are coding for different amounts of information as task difficulty and complexity changes. For instance, in OT1, the speed profiles and kinematics of the trajectories are identical for all trials, although there is much more variability in speed for the manual task, which involved movements to only one target. On the other hand, OT2 involved movements to two targets that were in opposite directions. If the neurons code for each of the task-relevant variables, then the amount of information that the units would need to encode could follow the observed trend in percentages. Our future work will aim to test these concepts.
In addition to neural spiking, LFPs also showed consistent event-related differences in δ and θ ranges between rewarding and nonrewarding trials. Studies have shown that the low-frequency components of LFPs (up to 30 Hz) are not, or are, minimally contaminated by spiking activity (Waldert et al., 2013). Thus, these LFP results provide additional information on a network level that may not be reflected in the spiking patterns and may be useful as an evaluative signal for the BMI system. Furthermore, the frequency band change with respect to reward expectation in the LFP signal is consistent with previous studies on Parkinson's disease models (Costa et al., 2006; Lemaire et al., 2012). This suggests that the mechanism of M1 reward differentiation could be rooted in dopamine signaling. Our findings are consistent with a study showing that dopamine depletion in the rat striatum amplifies LFP oscillations at δ and θ frequencies during movement (Lemaire et al., 2012). We showed that a consistent event-related increase for nonrewarding trials and decrease for rewarding trials in the δ and θ range (∼1–8 Hz) in manual and OT1 tasks for both contralateral and ipsilateral cortices is observed (Fig. 6). Costa et al. (2006) have shown that dopamine depletion in both the striatum and primary motor cortex of dopamine transporter knock-out mice causes an increase in the power of LFP oscillations at β and δ frequencies in both brain regions. Our analysis demonstrates a possible relationship between dopamine, reward expectation, and M1 LFPs. Further direct experimentation and recording will be necessary to determine whether indeed these LFP results are due to changes in dopamine, but clearly they indicate usefulness of LFPs for our desired BMI critic information, which is a signal that could tell us if “things” are going well or not, such as movements leading toward reward or not.
Our results, and the literature, suggest that the mechanism of M1 reward differentiation may be rooted in dopamine signaling. The dopaminergic input from the ventral tegmental area directly to M1 is one source of reward modulation (Hosp et al., 2011; Kunori et al., 2014). Additionally, the primary motor cortex is known to be directly or indirectly influenced by some of the major reward pathways (mesocortical, mesolimbic, and nigrostriatal). Cortical structures such as anterior cingulate cortex (Niki and Watanabe, 1979; Seo and Lee, 2007; Hayden and Platt, 2010), medial and dorsal prefrontal cortex (Watanabe, 1996; Leon and Shadlen, 1999; Barraclough et al., 2004; Matsumoto et al., 2007; Kim et al., 2009), orbitofrontal cortex (Padoa-Schioppa and Assad, 2006; Kennerley and Wallis, 2009; Wallis and Kennerley, 2010), lateral intraparietal cortex (Platt and Glimcher, 1999; Dorris and Glimcher, 2004; Sugrue et al., 2004; Seo et al., 2009), parietal reach region (Musallam et al., 2004), supplementary motor area (Campos et al., 2005), premotor area and frontal eye field (Roesch and Olson, 2003) are known to present these reward-related signals. Many of these regions are known precursors of M1. Motor information from PMd (which is reward modulated itself) to M1 is just one source of movement-related input. Further direct experimentation and recording will be necessary to determine if indeed our results are due to changes in dopamine. Nonetheless, our results clearly indicate the usefulness of both single-unit/multiunit data and LFPs for our desired BMI critic information.
In conclusion, the neural activity in M1 can be mapped to desired movements by an appropriate decoder, and the corresponding reward signal extracted from the same neural ensembles can be used as an evaluative signal of the performed action to allow subsequent autonomous BMI improvement. We have several lines of evidence from our laboratory and others that indicate we should indeed be able to generate an autonomous BMI using neural activity from M1 for both the control of movement (Chapin et al., 1999; Carmena et al., 2003; Hochberg et al., 2006; Velliste et al., 2008; Chhatbar and Francis, 2013) as well as to decode an evaluative signal as presented in this report. In our previous work, we have demonstrated that, even with a less than perfect evaluative signal, a reinforcement learning-based agent can do rather well (DiStasio and Francis, 2013; their Fig. 8), performing at levels as high as 93% success, even when the evaluative feedback signal is only 70% correct. We are currently running the closed loop BMI experiments with this type of BMI system and hope to report our results in the near future.
Notes
Supplemental material for this article is available at http://joefrancislab.com/. Please find a supplemented version of this paper on our webpage. This material has not been peer reviewed.
Footnotes
This work was supported by DARPA REPAIR Project N66001–10-C-2008. We thank Drs. Pratik Chhatbar and Mulugeta Semework for collaboration in surgeries and setting up the Plexon system; Irving Campbell for running software created by the author for data analysis; Dr. Marcello DiStasio for collecting 1 d of experimental data for the manual task for Monkey C and advice/edits of the paper; Dr. Ryan Canolty for providing tools for LFP analysis; and Dr. John F. Kalaska for input on the manuscript.
The authors declare no competing financial interests.
References
- Amirikian B, Georgopoulos AP, Georgopulos AP. Directional tuning profiles of motor cortical cells. Neurosci Res. 2000;36:73–79. doi: 10.1016/S0168-0102(99)00112-1. [DOI] [PubMed] [Google Scholar]
- Bae J, Chhatbar P, Francis JT, Sanchez JC, Principe JC. Reinforcement learning via kernel temporal difference: conference proceedings. IEEE Eng Med Biol Soc. 2011;2011:5662–5665. doi: 10.1109/IEMBS.2011.6091370. [DOI] [PubMed] [Google Scholar]
- Barraclough DJ, Conroy ML, Lee D. Prefrontal cortex and decision making in a mixed stratergy game. Nat Neurosci. 2004;7:404–410. doi: 10.1038/nn1209. [DOI] [PubMed] [Google Scholar]
- Bryson AE, Ho YC. Applied optimal control: optimization, estimation, and control. Boca Raton, FL: Taylor and Francis; 1969. [Google Scholar]
- Caggiano V, Fogassi L, Rizzolatti G, Casile A, Giese MA, Thier P. Mirror neurons encode the subjective value of an observed action. Proc Natl Acad Sci U S A. 2012;109:11848–11853. doi: 10.1073/pnas.1205553109. [DOI] [PMC free article] [PubMed] [Google Scholar]
- Campos M, Breznen B, Bernheim K, Andersen RA. Supplementary motor area encodes reward expectancy in eye-movement tasks. J Neurophysiol. 2005;94:1325–1335. doi: 10.1152/jn.00022.2005. [DOI] [PubMed] [Google Scholar]
- Canolty RT, Ganguly K, Carmena JM. Task-dependent changes in cross-level coupling between single neurons and oscillatory activity in multiscale networks. PLoS Comput Biol. 2012;8:e1002809. doi: 10.1371/journal.pcbi.1002809. [DOI] [PMC free article] [PubMed] [Google Scholar]
- Carmena JM, Lebedev MA, Crist RE, O'Doherty JE, Santucci DM, Dimitrov DF, Patil PG, Henriquez CS, Nicolelis MA. Learning to control a brain-machine interface for reaching and grasping by primates. PLoS Biol. 2003;1:E42. doi: 10.1371/journal.pbio.0000042. [DOI] [PMC free article] [PubMed] [Google Scholar]
- Chapin JK, Moxon KA, Markowitz RS, Nicolelis MA. Real-time control of a robot arm using simultaneously recorded neurons in the motor cortex. Nat Neurosci. 1999;2:664–670. doi: 10.1038/10223. [DOI] [PubMed] [Google Scholar]
- Chhatbar PY, Francis JT. Towards a naturalistic brain-machine interface: hybrid torque and position control allows generalization to novel dynamics. PLoS One. 2013;8:e52286. doi: 10.1371/journal.pone.0052286. [DOI] [PMC free article] [PubMed] [Google Scholar]
- Chhatbar PY, von Kraus LM, Semework M, Francis JT. A bio-friendly and economical technique for chronic implantation of multiple microelectrode arrays. J Neurosci Methods. 2010;188:187–194. doi: 10.1016/j.jneumeth.2010.02.006. [DOI] [PubMed] [Google Scholar]
- Churchland MM, Cunningham JP, Kaufman MT, Foster JD, Nuyujukian P, Ryu SI, Shenoy KV. Neural population dynamics during reaching. Nature. 2012;487:51–56. doi: 10.1038/nature11129. [DOI] [PMC free article] [PubMed] [Google Scholar]
- Costa RM, Lin SC, Sotnikova TD, Cyr M, Gainetdinov RR, Caron MG, Nicolelis MA. Rapid alterations in corticostriatal ensemble coordination during acute dopamine-dependent motor dysfunction. Neuron. 2006;52:359–369. doi: 10.1016/j.neuron.2006.07.030. [DOI] [PubMed] [Google Scholar]
- DiGiovanna J, Mahmoudi B, Fortes J, Principe JC, Sanchez JC. Coadaptive brain-machine interface via reinforcement learning. IEEE Trans Biomed Eng. 2009;56:54–64. doi: 10.1109/TBME.2008.926699. [DOI] [PubMed] [Google Scholar]
- DiStasio MM, Francis JT. Use of frontal lobe hemodynamics as reinforcement signals to an adaptive controller. PLoS One. 2013;8:e69541. doi: 10.1371/journal.pone.0069541. [DOI] [PMC free article] [PubMed] [Google Scholar]
- Dorris MC, Glimcher PW. Activity in posterior parietal cortex is correlated with the relative subjective desirability of action. Neuron. 2004;44:365–378. doi: 10.1016/j.neuron.2004.09.009. [DOI] [PubMed] [Google Scholar]
- Dura-Bernal S, Chadderdon GL, Neymotin XZ, Przekwas A, Francis JT, Lytton WW. Virtual musculoskeletal arm and robotic arm driven by a biomimetic model of sensorimotor cortex with reinforcement learning. IEEE Signal Processing in Medicine and Biology Symposium (SPMB'13).2014. [Google Scholar]
- Dushanova J, Donoghue J. Neurons in primary motor cortex engaged during action observation. Eur J Neurosci. 2010;31:386–398. doi: 10.1111/j.1460-9568.2009.07067.x. [DOI] [PMC free article] [PubMed] [Google Scholar]
- Francis JT, Chapin JK. Neural ensemble activity from multiple brain regions predicts kinematic and dynamic variables in a multiple force field reaching task. IEEE Eng Med Biol Soc. 2006;14:172–174. doi: 10.1109/TNSRE.2006.875553. [DOI] [PubMed] [Google Scholar]
- Francis JT, Song W. Neuroplasticity of the sensorimotor cortex during learning. Neural Plast. 2011;2011:310737. doi: 10.1155/2011/310737. [DOI] [PMC free article] [PubMed] [Google Scholar]
- Georgopoulos AP, Kettner RE, Schwartz AB. Primate motor cortex and free arm movements to visual targets in three-dimensional space: II. Coding of the direction of movement by a neuronal population. J Neurosci. 1988;8:2928–2937. doi: 10.1523/JNEUROSCI.08-08-02928.1988. [DOI] [PMC free article] [PubMed] [Google Scholar]
- Hayden BY, Platt ML. Neurons in anterior cingulate cortex multiplex information about reward and action. J Neurosci. 2010;30:3339–3346. doi: 10.1523/JNEUROSCI.4874-09.2010. [DOI] [PMC free article] [PubMed] [Google Scholar]
- Hochberg LR, Serruya MD, Friehs GM, Mukand JA, Saleh M, Caplan AH, Branner A, Chen D, Penn RD, Donoghue JP. Neuronal ensemble control of prosthetic devices by a human with tetraplegia. Nature. 2006;442:164–171. doi: 10.1038/nature04970. [DOI] [PubMed] [Google Scholar]
- Hosp JA, Pekanovic A, Rioult-Pedotti MS, Luft AR. Dopaminergic projections from midbrain to primary motor cortex mediate motor skill learning. J Neurosci. 2011;31:2481–2487. doi: 10.1523/JNEUROSCI.5411-10.2011. [DOI] [PMC free article] [PubMed] [Google Scholar]
- Kalaska JF, Scott SH, Cisek P, Sergio LE. Cortical control of reaching movements. Curr Opin Neurobiol. 1997;7:849–859. doi: 10.1016/S0959-4388(97)80146-8. [DOI] [PubMed] [Google Scholar]
- Kennerley SW, Wallis JD. Encoding of reward and space during a working memory task in the orbitofrontal cortex and anterior cingulate sulcus. J Neurophysiol. 2009;102:3352–3364. doi: 10.1152/jn.00273.2009. [DOI] [PMC free article] [PubMed] [Google Scholar]
- Kim S, Hwang J, Seo H, Lee D. Valuation of uncertain and delayed rewards in primate prefrontal cortex. Neural Netw. 2009;22:294–304. doi: 10.1016/j.neunet.2009.03.010. [DOI] [PMC free article] [PubMed] [Google Scholar]
- Kunori N, Kajiwara R, Takashima I. Voltage-sensitive dye imaging of primary motor cortex activity produced by ventral tegmental area stimulation. J Neurosci. 2014;34:8894–8903. doi: 10.1523/JNEUROSCI.5286-13.2014. [DOI] [PMC free article] [PubMed] [Google Scholar]
- Kurtzer I, Herter TM, Scott SH. Nonuniform distribution of reach-related and torque-related activity in upper arm muscles and neurons of primary motor cortex. J Neurophysiol. 2006;96:3220–3230. doi: 10.1152/jn.00110.2006. [DOI] [PubMed] [Google Scholar]
- Legenstein R, Chase SM, Schwartz AB, Maass W. A reward-modulated hebbian learning rule can explain experimentally observed network reorganization in a brain control task. J Neurosci. 2010;30:8400–8410. doi: 10.1523/JNEUROSCI.4284-09.2010. [DOI] [PMC free article] [PubMed] [Google Scholar]
- Lemaire N, Hernandez LF, Hu D, Kubota Y, Howe MW, Graybiel AM. Effects of dopamine depletion on LFP oscillations in striatum are task-and learning-dependent and selectively reversed by l-DOPA. Proc Natl Acad Sci U S A. 2012;109:18126–18131. doi: 10.1073/pnas.1216403109. [DOI] [PMC free article] [PubMed] [Google Scholar]
- Leon MI, Shadlen MN. Effect of expected reward magnitude on the response of neurons in the dorsolateral prefrontal cortex of the macaque. Neuron. 1999;24:415–425. doi: 10.1016/S0896-6273(00)80854-5. [DOI] [PubMed] [Google Scholar]
- Louie K, Grattan LE, Glimcher PW. Reward value-based gain control: divisive normalization in parietal cortex. J Neurosci. 2011;31:10627–10639. doi: 10.1523/JNEUROSCI.1237-11.2011. [DOI] [PMC free article] [PubMed] [Google Scholar]
- Mahmoudi B, Sanchez JC. A symbiotic brain-machine interface through value-based decision making. PLoS One. 2011;6:e14760. doi: 10.1371/journal.pone.0014760. [DOI] [PMC free article] [PubMed] [Google Scholar]
- Mahmoudi B, Pohlmeyer EA, Prins NW, Geng S, Sanchez JC. Towards autonomous neuroprosthetic control using Hebbian reinforcement learning. J Neural Eng. 2013;10 doi: 10.1088/1741-2560/10/6/066005. 066005. [DOI] [PubMed] [Google Scholar]
- Matsumoto M, Matsumoto K, Abe H, Tanaka K. Medial prefrontal cell activity signalling prediction errors of action values. Nat Neurosci. 2007;10:647–656. doi: 10.1038/nn1890. [DOI] [PubMed] [Google Scholar]
- Mizuhiki T, Richmond BJ, Shidara M. Encoding of reward expectation by monkey anterior insular neurons. J Neurophysiol. 2012;107:2996–3007. doi: 10.1152/jn.00282.2011. [DOI] [PMC free article] [PubMed] [Google Scholar]
- Moran DW, Schwartz AB. Motor cortical representation of speed and direction during reaching. J Neurophysiol. 1999;82:2676–2692. doi: 10.1152/jn.1999.82.5.2676. [DOI] [PubMed] [Google Scholar]
- Musallam S, Corneil BD, Greger B, Scherberger H, Andersen RA. Cognitive control signals for neural prosthetics. Science. 2004;305:258–262. doi: 10.1126/science.1097938. [DOI] [PubMed] [Google Scholar]
- Niki H, Watanabe M. Prefrontal and cingulate unit activity during timing behavior in the monkey. Brain Res. 1979;171:213–224. doi: 10.1016/0006-8993(79)90328-7. [DOI] [PubMed] [Google Scholar]
- Padoa-Schioppa C, Assad JA. Neurons in the orbitofrontal cortex encode economic value. Nature. 2006;441:223–226. doi: 10.1038/nature04676. [DOI] [PMC free article] [PubMed] [Google Scholar]
- Platt ML, Glimcher PW. Neural correlates of decision variables in parietal cortex. Nature. 1999;400:233–238. doi: 10.1038/22268. [DOI] [PubMed] [Google Scholar]
- Pohlmeyer EA, Mahmoudi B, Geng S, Prins N, Sanchez JC. Brain-machine interface control of a robot arm using actor-critic rainforcement learning: conference proceedings. IEEE Eng Med Biol Soc. 2012;2012:4108–4111. doi: 10.1109/EMBC.2012.6346870. [DOI] [PubMed] [Google Scholar]
- Pohlmeyer EA, Mahmoudi B, Geng S, Prins NW, Sanchez JC. Using reinforcement learning to provide stable brain-machine interface control despite neural input reorganization. PLoS One. 2014;9:e87253. doi: 10.1371/journal.pone.0087253. [DOI] [PMC free article] [PubMed] [Google Scholar]
- Richfield EK, Young AB, Penney JB. Comparative distributions of dopamine D-1 and D-2 receptors in the cerebral cortex of rats, cats, and monkeys. J Comp Neurol. 1989;286:409–426. doi: 10.1002/cne.902860402. [DOI] [PubMed] [Google Scholar]
- Roesch MR, Olson CR. Impact of expected reward on neuronal activity in prefrontal cortex, frontal and supplementary eye fields and premotor cortex. J Neurophysiol. 2003;90:1766–1789. doi: 10.1152/jn.00019.2003. [DOI] [PubMed] [Google Scholar]
- Sanchez JC, Mahmoudi B, DiGiovanna J, Principe JC. Exploiting co-adaptation for the design of symbiotic neuroprosthetic assistants. Neural Netw. 2009;22:305–315. doi: 10.1016/j.neunet.2009.03.015. [DOI] [PubMed] [Google Scholar]
- Sanchez JC, Tarigoppula A, Choi JS, Marsh BT, Chhatbar PY, Mahmoudi B, Francis JT. Control of a center-out reaching task using a reinforcement learning brain-machine interface. Neural Engineering (NER) 2011 International IEEE/EMBS Conference 525–528.2011. [Google Scholar]
- Scott SH. Optimal feedback control and the neural basis of volitional motor control. Nat Rev Neurosci. 2004;5:532–546. doi: 10.1038/nrn1427. [DOI] [PubMed] [Google Scholar]
- Scott SH, Gribble PL, Graham KM, Cabel DW. Dissociation between hand motion and population vectors from neural activity in motor cortex. Nature. 2001;413:161–165. doi: 10.1038/35093102. [DOI] [PubMed] [Google Scholar]
- Seo H, Lee D. Temporal filtering of reward signals in the dorsal anterior cingulate cortex during a mixed-strategy game. J Neurosci. 2007;27:8366–8377. doi: 10.1523/JNEUROSCI.2369-07.2007. [DOI] [PMC free article] [PubMed] [Google Scholar]
- Seo H, Barraclough DJ, Lee D. Lateral intraparietal cortex and reinforcement learning during a mixed-strategy game. J Neurosci. 2009;29:7278–7289. doi: 10.1523/JNEUROSCI.1479-09.2009. [DOI] [PMC free article] [PubMed] [Google Scholar]
- Serruya MD, Hatsopoulos NG, Paninski L, Fellows MR, Donoghue JP. Instant neural control of a movement signal. Nature. 2002;416:141–142. doi: 10.1038/416141a. [DOI] [PubMed] [Google Scholar]
- Shuler MG, Bear MF. Reward timing in the primary visual cortex. Science. 2006;311:1606–1609. doi: 10.1126/science.1123513. [DOI] [PubMed] [Google Scholar]
- Sugrue LP, Corrado GS, Newsome WT. Matching behavior and the representation of value in the parietal cortex. Science. 2004;304:1782–1787. doi: 10.1126/science.1094765. [DOI] [PubMed] [Google Scholar]
- Sutton RS, Barto AG. Reinforcement learning: an introduction. Cambridge, MA: Massachusetts Institute of Technology; 1998. [Google Scholar]
- Tanaka SC, Doya K, Okada G, Ueda K, Okamoto Y, Yamawaki S. Prediction of immediate and future rewards differentially recruits cortico-basal ganglia loops. Nat Neurosci. 2004;7:887–893. doi: 10.1038/nn1279. [DOI] [PubMed] [Google Scholar]
- Tarigoppula A, Rotella N, Francis JT. Properties of a temporal difference reinforcement learning brain–machine interface driven by a simulated motor cortex. Conf Proc IEEE Eng Med Biol Soc. 2012;2012:3284–3287. doi: 10.1109/EMBC.2012.6346666. [DOI] [PubMed] [Google Scholar]
- Taylor DM, Tillery SI, Schwartz AB. Direct cortical control of 3D neuroprosthetic devices. Science. 2002;296:1829–1832. doi: 10.1126/science.1070291. [DOI] [PubMed] [Google Scholar]
- Thabit MN, Nakatsuka M, Koganemaru S, Fawi G, Fukuyama H, Mima T. Momentary reward induce changes in excitability of primary motor cortex. Clin Neurophysiol. 2011;122:1764–1770. doi: 10.1016/j.clinph.2011.02.021. [DOI] [PubMed] [Google Scholar]
- Tkach D, Reimer J, Hatsopoulos NG. Congruent activity during action and action observation in motor cortex. J Neurosci. 2007;27:13241–13250. doi: 10.1523/JNEUROSCI.2895-07.2007. [DOI] [PMC free article] [PubMed] [Google Scholar]
- Toda K, Sugase-Miyamoto Y, Mizuhiki T, Inaba K, Richmond BJ, Shidara M. Differential encoding of factors influencing predicted reward value in monkey rostral anterior cingulate cortex. PLoS One. 2012;7:e30190. doi: 10.1371/journal.pone.0030190. [DOI] [PMC free article] [PubMed] [Google Scholar]
- Todorov E, Jordan MI. Optimal feedback control as a theory of motor coordination. Nat Neurosci. 2002;5:1226–1235. doi: 10.1038/nn963. [DOI] [PubMed] [Google Scholar]
- Velliste M, Perel S, Spalding MC, Whitford AS, Schwartz AB. Cortical control of a prosthetic arm for self-feeding. Nature. 2008;453:1098–1101. doi: 10.1038/nature06996. [DOI] [PubMed] [Google Scholar]
- Vigneswaran G, Philipp R, Lemon RN, Kraskov A. M1 corticospinal mirror neurons and their role in movement suppression during action observation. Curr Biol. 2013;23:236–243. doi: 10.1016/j.cub.2012.12.006. [DOI] [PMC free article] [PubMed] [Google Scholar]
- Waldert S, Lemon RN, Kraskov A. Influence of spiking activity on cortical local field potentials. J Physiol. 2013;591:5291–5303. doi: 10.1113/jphysiol.2013.258228. [DOI] [PMC free article] [PubMed] [Google Scholar]
- Wallis JD, Kennerley SW. Heterogeneous reward signals in prefrontal cortex. Curr Opin Neurobiol. 2010;20:191–198. doi: 10.1016/j.conb.2010.02.009. [DOI] [PMC free article] [PubMed] [Google Scholar]
- Watanabe M. Reward expectancy in primate prefrontal neurons. Nature. 1996;382:629–632. doi: 10.1038/382629a0. [DOI] [PubMed] [Google Scholar]
- Yu BM, Cunningham JP, Santhanam G, Ryu SI, Shenoy KV, Sahani M. Gaussian-process factor analysis for low-dimensional single-trial analysis of neural population activity. J Neurophysiol. 2009;102:614–635. doi: 10.1152/jn.90941.2008. [DOI] [PMC free article] [PubMed] [Google Scholar]