

Abstract
The brain is proposed to operate through probabilistic inference, testing and refining predictions about the world. Here, we search for neural activity compatible with the violation of active predictions, learned from the contingencies between actions and the consequent changes in sensory input. We focused on vision, where eye movements produce stimuli shifts that could, in principle, be predicted. We compared, in humans, error signals to saccade-contingent changes of veridical and inferred inputs by contrasting the electroencephalographic activity after saccades to a stimulus presented inside or outside the blind spot. We observed early (<250 ms) and late (>250 ms) error signals after stimulus change, indicating the violation of sensory and associative predictions, respectively. Remarkably, the late response was diminished for blind-spot trials. These results indicate that predictive signals occur across multiple levels of the visual hierarchy, based on generative models that differentiate between signals that originate from the outside world and those that are inferred.
Keywords: active vision, blind spot, eye movements, linear model analysis of EEG, predictive coding
Introduction
The brain is likely to operate constructively, generating probabilistic models of reality that are in continuous testing against sensory inputs. Functionally, probabilistic models can successfully explain a large range of phenomena, like perceptual illusions (Weiss et al., 2002), spontaneous activity representing uncertainty (Fiser et al., 2010), and the optimal integration of multimodal signals (Wolpert et al., 1995; Ernst and Banks, 2002; Körding and Wolpert, 2004). To find neural correlates of such processes, researchers look for patterns of brain activity compatible with probabilistic neural computation, in which predictive coding is one of the most popular models.
In predictive coding, higher areas in a brain hierarchy predict the activity of lower areas by inhibitory feedback, whereas lower areas generate corresponding error signals in relation to their own feedforward inputs. In current formulations of predictive coding, the precision-weighted prediction errors are thought to be encoded predominantly in superficial pyramidal cells of the cortex (Feldman and Friston, 2010; Bastos et al., 2012), and thus measurable by electroencephalography (EEG). Previous EEG experiments, which revealed neural signatures compatible with predictive coding, have mostly relied on passive tasks, in which the predictability of the stimuli is imposed externally. However, the predictive coding framework can also embrace predictions that are the consequences of agents' self-generated actions, in-line with recent proposals of embodied cognition that emphasize the role of the body and self-generated action for perception (Engel et al., 2013).
Eye movements can be considered as “experiments” in the visual domain, testing hypotheses about visual content through actions (Friston et al., 2012). Given that there is evidence for predictive coding in early visual areas for passive stimulation (Murray et al., 2002; Summerfield et al., 2008; Alink et al., 2010; Kok et al., 2012), it is conceivable that the shifts of the visual input produced by eye movements could, in principle, result in predictable signals in all levels of the visual hierarchy. Moreover, active sensory predictions could also exist for signals that are generated in the absence of actual inputs. This occurs naturally in the retina's blind spot, which is demonstrable in monocular vision as a percept that is “filled-in” from the surroundings' content.
We combined eye-tracking and EEG measurements to evaluate the existence and timing of predictive signals that are caused by human subject's eye movements. Crucially, in our experimental design we measured prediction error responses in the context of both veridical (precise) sensory information and inferred (imprecise) visual cues, presented outside and within the blind spot, respectively. Two alternatives are conceivable in the case of blind spot stimulation: first, feedforward activity of neurons related to filling-in is taken by the brain as if it was actual input, and therefore, no differences should exist between prediction violations inside or outside the blind spot. Alternatively, within the brain's generative models, there is an expected uncertainty about the blind quality of filled-in information; therefore, we would expect to see an attenuated error response when the violations were based upon imprecise filling-in, when stimuli were presented in the blind spot, relative to when they were not.
Materials and Methods
Overview
To find signals compatible with predictive errors that can be differentiated from nonpredictive remapping signals, we compared EEG responses with stimuli that were changed or unchanged during the saccade that brought it to the center of the gaze. Our study design has effectively two key factors (Fig. 1); namely, a stimulus change during the saccade (or not) and an initial presentation of the stimulus (presaccadic) within the blind spot (or not). The stimulus change involved rotating the inner segment of a circular grating to create an inner visual feature, in which the direction of the grating was orthogonal to the surroundings. Crucially, this visual feature (inset) was smaller than the blind spot resulting in perceptual filling-in when presented within the blind spot. We presented stimuli within the blind spot using monocular stimuli (by using shutter glasses), but alternatively to the right or left eye. This resulted in a design with four factors in total: stimulus change (present or absent), inset (present or absent), blind spot (within or without), and position (peripheral initial presentation, right vs left).
Figure 1.
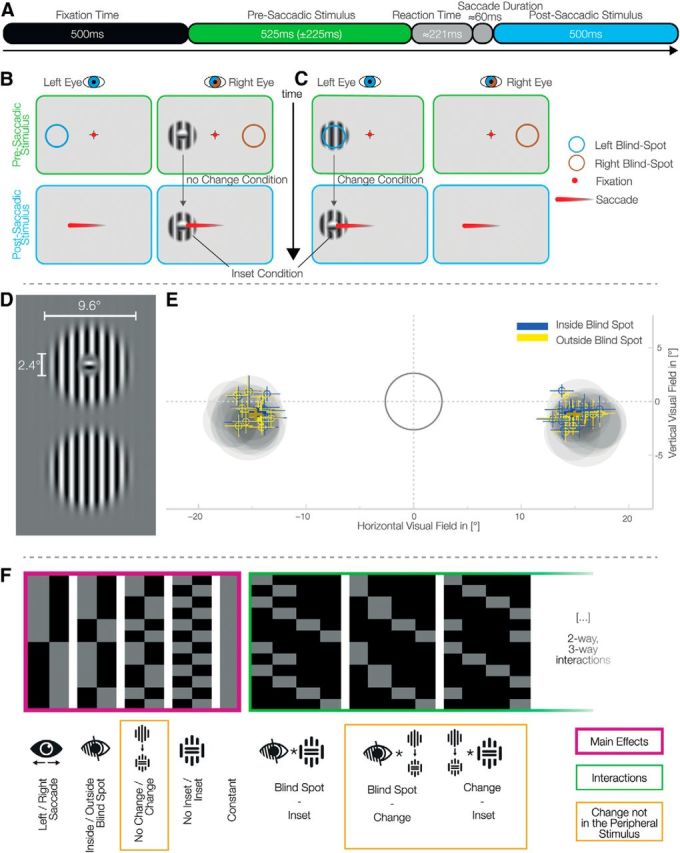
Experimental setup and eye-movements behavior. A, Trial time course. B, C, Each set of two panels represents what is presented to each eye with the shutter glasses. After a fixation interval, a stimulus appeared monocularly in the periphery (top). After the disappearance of the fixated crosshair, the subjects perform a saccade to the center of the presaccadic stimulus, which becomes the postsaccadic stimulus (bottom). The colored circles represent the location of the blind spot in each eye and were not displayed on the screen. B, An example of a trial without change: the inset stimulus, presented outside the blind spot, does not change before and after the saccade. Importantly, presenting an inset stimulus inside the blind spot always leads to fill-in and therefore the perception of a continuous stimulus. We therefore recorded the inset no-change condition only outside the blind spot. C, A trial with change: the continuous stimulus, presented inside the blind spot, is exchanged during the saccade to an inset stimulus. D, Gabor patches used as stimuli; horizontal stimuli were also used. The inset was set to ∼50% the diameter of the blind spot. E, Locations of the blind spots and saccades' end-points. The gray ring encloses the tolerance area for fixation. The gray discs represent the average calibrated blind spot sizes and locations for each subject. Bold crosses represent the winsorized average saccade end locations over subjects of both inside and outside blind spot trials (±winsorized SD). Small crosses show the same metrics for each individual subject. F, The design matrix used for the single subject GLMs. An overparameterized model of four main effects (purple), constant, and all interactions (green) was used.
Subjects
Fifteen subjects participated in the study [mean age: 22.5 years (18–28); 1 left-handed, 6 with a left-dominant eye, 9 female). All subjects gave written consent, and the experiment was approved by the local ethics committee. An additional nine subjects were rejected before their EEG recording either due to the screening procedure (n = 4, see below for criteria); technical problems (n = 2); incompatibility of lenses with the combination of shutter glasses and eye tracker (n = 2); or perceptual problems in the peripheral field-of-view (n = 1).
Materials
EEG.
Electrophysiological data were recorded using 64 Ag/AgCl electrodes with an equal-distance placement system (actiCap, Brain Products GmbH). Scalp impedances were kept <5 kOhm. EEG data were sampled with 1000 Hz, using Cz as a recording reference, and the ground electrode was placed near Fz.
Eyetracking.
A remote, infrared eye-tracking device (Eyelink 1000, SR Research) with a 500 Hz sampling rate was used. The average calibration error was kept <0.5° with a maximal calibration error <1.0°. Trials with a fixation deviation of >2.6° from the fixation point were aborted.
Display.
We used a 24 inch, 120 Hz monitor (XL2420t, BenQ) with a resolution of 1920 × 1080 pixels in combination with consumer-grade shutter glasses for monocular stimuli presentation (3D Vision, Nvidia, wired version). The shutter glasses were evaluated for appropriate crosstalk/ghosting using a custom-manufactured luminance sensor sampling at 20 kHz. The measured crosstalk at full luminance was 3.94%.
Change latency.
As the main analysis of EEG data were about signals related to saccade-contingent changes, we needed to make sure that the stimulus change always occurred during the saccades. The online detection of a saccade by the eye-tracker took on average 27 ms [SD = 1 ms, 5/95% (22–35 ms)] from the movement start, and the saccade duration was on average 60 ms [SD = 4 ms, 5/95% (48–80 ms)]. An additional 8.75 ms (max = 11 ms) delay occurred from the computer command to the actual stimulus change on the monitor. The slowest detection of a saccade (35 ms) plus the maximum time it took to change the stimulus (11 ms) was faster then the shortest saccade (48 ms). Thus, the stimulus was always exchanged before the fixation onset. Reaction time from go signals to saccade start was, on average, 248 ms (SD = 20 ms).
Stimuli.
Modified Gabor patches with a frequency of 0.89 cycles/° and a diameter of 9.6° were generated. Two kinds of patterns were used (Fig. 1D): one completely continuous and one with a small perpendicular inset of 2.4°. For comparison, the blind spot typically has a diameter of 4°–5°. The Gabor had constant contrast in a radius of 6.3° around the center. This ensured the same perception of the continuous stimulus outside the blind spot compared with a filled-in stimulus where the inner part is inside the blind spot. To account for possible adaptation effects, horizontal and vertical stimuli were used in a balanced and randomized way over trials. Stimuli were displayed using the Psychophysics Toolbox (Brainard, 1997; Kleiner et al., 2007) and Eyelink Toolbox (Cornelissen et al., 2002).
Experiments
Calibration of blind spot.
To calibrate the blind spots, subjects were instructed to use the keyboard to move a circular monocular probe on the monitor, and adjust the size and location to fill the blind spot with maximal size. They were explicitly instructed to calibrate it as small as necessary to preclude any residual flickering. The circular probe flickered from dark gray to light gray to be more salient than a probe with constant color (Awater et al., 2005). All stimuli were presented centered at the respective calibrated blind spot location. In total, each subject calibrated the blind spot 30 times over two sessions.
In-line with previous studies (Wolf and Morandi, 1962), the blind spots (left and right) were located horizontally at −15.4° (SD = 0.6°) and 15.7° (SD = 0.6°) from the fixation cross. The mean calibrated diameter was 4.9° (SD = 0.7°) for the left and 5.0° (SD = 0.5°) for the right blind spot. Blind spots did not significantly differ in size (p = 0.061, CI = −0.3, 0.0) but they did differ in absolute horizontal position (in relation to the fixation cross; p = 0.005, CI= −0.5°, −0.1°) with the right blind spot, on average, 0.3° further outside from the fixation cross. There was no difference in the vertical position (p = 0.87, CI = −0.5°, 0.3°). In summary, the properties of the subjects' blind spots were fully compatible with the previously reported values. One exception is that subjects calibrated the left blind spot, compared with the right one, closer to the fixation cross.
Eye movements result in EEG artifacts that differ according to their kinematics. Although we used state-of-the-art procedures to remove this artifact (see below), it is important to evaluate the systematic differences in eye movement that could confound the analysis. The saccades did not differ in amplitude for saccades to the left against saccades to the right. There was a significant difference of amplitude between saccades inside the blind spot and saccades outside the blind spot of 0.3° (SD = 0.1°, p = 0.001, CI = 0.1°, 0.4°). However, this difference was small compared with the overall average saccade amplitude of 13.9°, and the stimulus size of 9.6°.
Screening procedure.
The screening procedure was used to ensure a normal fill-in, absence of problems in the peripheral vision unbeknownst to the subjects themselves, and the ability to sustain a high level of attention. A single stimulus, either continuous or with an inset, was monocularly presented in the periphery at the previously determined blind-spot location (inside the blind spot, temporally) or in the horizontally mirrored position (outside the blind spot, nasally). Subjects indicated via button press whether they perceived a stimulus without inset (left key) or a stimulus with inset (right key) stimulus. A total of 48 trials were shown, and they were fully balanced and randomized. We applied conservative criteria, requesting a 94% performance level in this simple classification task. If an inset stimulus was presented inside the blind spot and thereby eliciting fill-in, it was counted as a correct trial when subjects answered that they perceived the stimulus as continuous.
Responses to saccade contingent changes outside and inside BS.
Concurrent EEG and eye-tracking recordings were performed allowing us to induce artificial mismatches between presaccadic and postsaccadic stimuli and thus evaluate the differences in EEG responses to saccade-contingent changes. At the start of the trial (Fig. 1A–C), the subjects were asked to fixate on a cross in the middle of the screen. A Gabor stimulus, the presaccadic stimulus, was presented monocularly either to the left or to the right eye and either outside the blind spot (nasally) or inside the blind spot (temporally). After an average of 525 ms (±225 ms), the fixation cross disappeared and the subjects had to perform a saccade to the center of the stimulus. We called the second stimulus, now in the center of the gaze, the postsaccadic stimulus.
Two key factors were evaluated during the experiment. The first factor was “change.” To induce a prediction error, we exchanged the stimulus during the saccade in half of the trials. This change was either from a stimulus with the inset present to one where the inset is absent, or vice versa. Saccades were detected online when the gaze deviated >2.6° from the fixation cross. Saccade-contingent changes occurred equally often for movements to stimuli presented inside or outside the blind spot. The second factor, “inset,” related to whether subjects saw a stimulus with or without an inset.
Presenting the stimulus with an inset in the blind spot elicits fill-in and thus is perceived as a continuous stimulus, regardless of the veridical physical stimulus properties. It is therefore impossible to perceive an inset stimulus when the initial presaccadic stimulus is presented in the blind spot; thus, we did not record trials in such a condition. Moreover, an inset in the later postsaccadic stimulus, when the previous periphery stimulus was inside the blind spot, can only co-occur with a change.
In total, 2880 trials were displayed over two sessions with 10 blocks per session. Each condition was displayed in a fully balanced and randomized way for each block.
Analysis
EEG processing.
Data were analyzed using MATLAB and EEGLAB (Delorme and Makeig, 2004). Data were resampled to 500 Hz and bad channels, which we identified by visual inspection (never more than 1 channel per subject) were excluded from further analysis and interpolated at a later stage (after data epoching, see below) using spherical interpolation. Signals were cleaned visually for coarse motor artifacts and signal drops. An independent-component (IC) analysis (AMICA, standard parameters as implemented in BCILAB v12; Palmer et al., 2008) was applied on, only for this step, FIR high-pass filtered data (1 Hz, −6 dB cutoff at 0.5 Hz, 1 Hz transition bandwidth, FIRFILT, EEGLAB plugin). ICs were automatically screened for artifacts. For eye artifacts, we used an automatic reliable algorithm (Dimigen et al., 2011; Plöchl et al., 2012) that removed, on average, 7.5 eye-artifact ICs (SD = 2.5; low = 4, high = 18) per subject. For muscle-artifact ICs, we correlated the spectrum of the ICs with a prototypical “square-root” spectrum commonly observed in muscle artifacts. A correlation >0.7 was used to identify an IC as a muscle-artifact IC. We found, on average, 6.8 components per subject (2.3; low = 0, high =15). All rejected ICs were also visually validated by inspecting the topographies, spectra, and activation over time, and confirmed.
Finally, EEG data were low-pass filtered <50 Hz (−6 dB cutoff at 56.25 Hz, 12.5 Hz transition bandwidth) using a FIR filter. Data were cut into epochs of −300 to 500 ms with a baseline of −300 to −100 ms, and aligned to two different events: the onset of the presaccadic stimulus and the start of the postsaccadic stimulus fixation. Trials were excluded from further analysis in three circumstances: subjects made a saccade when they should have maintained fixation, the saccade endpoint was not in an area of 10° around the center of the stimulus, or the reaction time was greater than three times the SD above the mean for each subject. After online fixation control and EEG cleaning, on average, 88% (4.9%; low = 62.9%; high = 96.5%) of the trials entered further analysis.
The complete eye-tracking and EEG datasets, and analysis scripts are available upon request.
Statistics.
We used robust statistics wherever possible. Robust statistics are more reliable in the case of small deviations from assumed distributions than their classical statistical counterparts (Wilcox, 2012, their Chapter 1). If not stated otherwise, all reported descriptive values are 20% winsorized mean followed by 20% winsorized SD in round brackets (Wilcox, 2012, their Chapter 3.3). When winsorizing, the upper and lower 20% of samples are replaced by the remaining most extreme values, and then the mean or SD is calculated. The influence of outliers is thereby strongly attenuated. The median, arguably least affected by outliers, is equal to the most extreme winsorized mean (threshold of 50%), where all values, except the median value, are declared “outliers.” Ranges are reported by (low = X, high = Y). We evaluated one-sample tests with the percentile bootstrap method of trimmed means (20%) with α = 0.05 (Wilcox, 2012, pp 115–116). For paired two-sample data, we used the same procedure on the difference scores. We used bias-corrected, accelerated 95% bootstrapped confidence intervals of the trimmed mean (20%) and reported them in the text by (CI= XY). All bootstrap tests and estimates were done with 10.000 resamples, except for the EEG multiple-comparison correction (TFCE) where we used only 1.000 resamples.
Single-subject GLM.
Using a MATLAB toolbox suitable for mass-univariate generalized linear models (GLM; LIMO toolbox; Pernet et al., 2011), GLMs were fitted on each electrode and time-point separately for each subject. The analysis of EEG data with GLMs, has previously shown advantages in terms of higher sensitivity and unbiased data-driven analysis (Rousselet et al., 2011; Dandekar et al., 2012b) and is a standard application of statistical parametric mapping (Litvak et al., 2011). An overparameterized dummy coding with interaction comparisons was used for the design matrix (Fig. 1F). The main factors used were stimulus Change, Blind spot (outside/inside), Position (left/right), and Inset (with and without). All possible interactions were modeled.
The analyzed estimable functions are linear combinations of the parameters of the same experimental factor or interaction. For example, for the main factor, position, the estimable function was β2 − β1. We tested this statistically using Yuen's t tests with corresponding H0-centered bootstraps over subjects. For an interaction example, Position × Blind spot, the estimable function was (β10 − β9) − (β12 − β11) and tested by a Yuen's t test with corresponding H0-centered bootstraps over subjects. For the presaccadic analysis, we did not model the change factor, as the stimulus was not exchanged in that time window of the analysis.
Group-level statistics.
We used a standard TFCE measure of local responses and permutation testing (Smith and Nichols, 2009; Pernet et al., 2014) to control the elevated familywise error ratio of the multiple electrodes × timeframes tests that were performed. In brief, TFCE bypasses the need to define an arbitrary threshold for sample clustering by establishing the “local support” in space and time for every sample. This local support is given by the sum of all sections in time and space that are underneath it; in other words, the sum of all samples that are not beyond and higher than any local minima that is between them and the sample under calculation. TFCE was calculated for the actual mean factors and for 1000 bootstraps of centered subjects. For each of these bootstrapped samples of subjects, the maximum TFCE value across all samples in time and space is used to construct an H0 distribution, against which the actual TFCE values were compared. Values above the 95th percentile were considered to be controlled for multiple comparisons at an α level of 0.05. The neighborhood distance was calculated on the default electrode locations.
For a given model and data partition, the procedure described above controls for the familywise error rate resulting from fitting multiple GLMs to different electrodes and time points. We report only effects that extended over five samples (10 ms) or more. Effect clusters of significant values were reported in the text with their respective timing and median TFCE-corrected p value (p̃).
Shift of factor labels.
Due to the nature of our factorial design, one can relabel the factors such that main effects and interactions are exchangeable. For example, a main effect of change can be regarded as an interaction between the presence of an inset before and after the saccade: an inset stimulus before the saccade combined with a change results in a no-inset stimulus after the saccade. Without the change, the stimulus before and after the saccade is identical. This is true in reverse for the no-inset stimulus before the saccade. We, indeed, found a change × inset interaction effect (Fig. 4B) even before the saccade ended. We observed this presaccade-offset positive effect from −64 to 6 ms (positive betas: −64–6 ms, p̃ = 0.019, min p = 0.004; negative betas: −60 to −34 ms, p̃ = 0.045, min p = 0.03, and from −30 to 0 ms, p̃ = 0.042, min p = 0.035). This seems puzzling at first, as the change of the stimuli occurred ∼30 ms before the saccade offset, which is after this observed interaction of change × inset. The effect before saccade offset most probably resembles the main effect of the inset during the presaccadic stimulus stimulation and can be explained by this changing of factor labels.
Figure 4.

Middle and early latency interaction with the change factor. Data aligned to the saccade offset when the stimulus is foveated A, The Change × Position interaction shows a clearly lateralized prediction error at ∼200 ms. The two histograms insets depict saccade onset and stimulus change, and show that all changes occurred during the saccades. B, The Change × Inset interaction shows three separate effects. Detailed descriptions are found in Results. C, The Change × Inset × Position interaction shows an early prediction error that is lateralized and also dependent on the low-level stimuli properties.
Incomplete design.
Due to the very nature of filling-in at the blind spot, only an incomplete factorial design is possible: an inset stimulus inside the blind spot cannot be perceived. Therefore, we have to assume that the three-way interaction containing the Blind spot factor, the Change factor, and the factor Inset is negligible. We additionally confirmed all results in two reduced subset models, each containing a full-factorial design. For the first full-factorial model, we collapsed the change and inset factors in a combined factor and selected only trials that were available both inside and outside the blind spot. The second model excluded the factor Blind spot (and all of the data with a stimulus inside the blind spot) but included separate factors Change and Inset. This allowed us to confirm our full-factorial model with the limitation of two independent error terms for the two models, instead of one error term. All results were confirmed in the fully balanced designs.
Results
Fifteen subjects participated in a concurrent EEG and eye-tracking experiment. They were asked to perform an eye movement from the center of the screen onto a Gabor stimulus (Fig. 1D) located in the periphery, in either the left or the right visual field (Fig. 1A–C). The position of the stimulus was centered at either the left or right blind spot of each individual subject and the diameter of the stimulus itself was larger than the blind spot by a factor of ∼2 (see Materials and Methods, Calibration of blind spot). By using a 3-D monitor with shutter glasses, it was possible to present the stimuli either in the blind spot or in the same location, albeit in the nasal non-blind spot field of the other eye. Uninstructed to the subjects, in half of the trials, the stimulus changed during the saccade. Postexperiment debriefing established that all subjects became aware that the stimulus was sometimes exchanged. This consisted in a change of a small inset within the center of the Gabor patch (smaller than the blind spot) from no inset (a completely continuous stimulus) to the stimulus with an inset (during inside and outside blind spot trials) or vice versa (only during outside blind spot trials). This experimental manipulation allowed us to evaluate the presence of EEG responses compatible with error signals to changes in a stimulus that are contingent on subjects' actions.
We analyzed electrophysiological responses that are produced after identical eye movements (Fig. 1E) with the same amplitude, direction, and target location (see Materials and Methods, Calibration of blind spot) and that resulted in the foveation of identical stimuli, albeit between trials in which the stimulus was either changed or not changed during the eye movement. EEG responses were analyzed with mass-univariate general linear models (Pernet et al., 2011) that were fitted to each electrode and time-point for each subject. The main factors used were as follows: stimulus Change (with/without), Blind spot (outside/inside), Position (left/right saccade), and Inset (with/without; Fig. 1F). On the group level, instead of a classical ERP analysis, we analyzed the estimable contrasts of the parameter estimates from the general linear model of the main factors and interactions. This corresponds to a summary statistic approach to random effects analyses. The reported values, termed “β values” as a shorthand, are similar to difference values of raw ERP, but importantly, they take into account the variance of the other independent variables. We found clusters of significant effects associated with the main effect of interest, change, at four distinctive latencies in the analysis of the data after the saccade offset. The following results are organized in three sections. First, we describe EEG effects of filling-in before a saccade was done. Second, we illustrate the effects related to late prediction signals postsaccade. Finally, we describe early and middle latency effect of postsaccadic predictive signals.
Inferred information in the periphery
A stimulus presented in the blind spot elicits filling-in, in which visual signals are inferred from surrounding information without a direct input from the retina or the outside world. Neural activity related to filling-in has been described previously in areas V1–V3 in neurophysiological studies with primates (Fiorani Júnior et al., 1992; Komatsu et al., 2000; Matsumoto and Komatsu, 2005) and in fMRI experiments with humans (Tong and Engel, 2001), but not in human electrophysiology. We found that, before the eye movement, after the onset of a peripheral stimulus, there is a main effect for the Blind spot factor (Fig. 2A) from 172 to 246 ms (positive betas: 172–244 ms, median p value: p̃ = 0.015, min p = 0.001; negative betas: 172–214 ms, p̃ = 0.011, min p = 0.002, and from 216 to 246 ms, p̃ = 0.028, min p = 0.011; positive values represent a positive deviation from the average ERP over all conditions and vice versa). As the presaccadic stimulation was lateralized, we analyzed the main factor Position (Fig. 2B) and found two significant effects. The first occurred immediately after the presaccadic stimulus onset from 70 to 114 (positive betas: 70–114 ms, p̃ = 0.015, min p = 0.003; negative betas: 72–106 ms, p̃ = 0.017, min p = 0.005). As to be expected, a stimulus in the right or left periphery elicits stronger activation in the contralateral occipital electrodes. A second effect can be seen from 362 to 408 (positive betas: 362–408 ms, p̃ = 0.022, min p = 0.01; negative betas: 368–404 ms, p̃ = 0.018, min p = 0.004). Importantly, processing of the blind spot filling-in could be lateralized as well. Therefore, we analyzed the interaction Blind spot × Position (Fig. 2C) and found two significant positive effects. The first was from 210 to 226 ms (p̃ = 0.022, min p = 0.003), and the second one was from 276 to 292 ms (p̃ = 0.03, min p = 0.011). The first of the lateralized effects started and ended during the main effect, whereas the second one started ∼30 ms after the main effect. The overall blind spot results are in-line with previous studies with intracranial recordings of V1 neurons that have receptive fields which include the blind spot, and that show differences in activation after 100 ms (Matsumoto and Komatsu, 2005, their Fig. 9B) or after 200 ms (Komatsu et al., 2000, their Fig. 9A). These two effects shown here establish an EEG correlate for the difference in visual processing of peripheral stimuli when they are veridical (outside the blind spot) or inferred (inside the blind spot).
Figure 2.

Main factor blind spot. Time-series plots of the EEG β weights of the main factors or interactions for each electrode are shown (butterfly plot), aligned to the onset of the presaccadic stimulus. Blue marked latencies are significant under TFCE α of 0.05 and, therefore, are corrected for multiple comparisons over time points and electrodes. Black marked latencies are significant under additional Bonferroni correction for the testing of multiple factors in a model. This second procedure is overly conservative and only done to evaluate the robustness of the effects. The first row of the topographical plots represents the mean β weights averaged over 50 ms bins. The second row depicts the minimal TFCE-corrected p values over the same bin. Black marked electrodes represent significant channels. The location of the red highlighted channel is depicted in the first topographic plot. A, The main effect Blind spot depicts the difference of a presaccadic stimulus presentation inside and outside the blind spot, which is prominent 200 ms after stimulus onset. B, The main effect of Position shows a contralateral processing in occipital electrodes to a stimulus presented in the periphery. C, The Blind Spot × Position interaction depicts a lateral component of the effect shown in A.
Prediction signals over saccades
Our main goal was to find an EEG effect compatible with error signals related to the prediction of specific visual content across eye movements. In contrast to the results described above, all subsequent effects are for the postsaccadic stimulus. The violation of a predictive signal that is independent of specific low-level visual content (which would show in the interaction with position or inset) can be investigated by the main effect of the Change factor. Such a main effect was present from 248 to 498 ms after the end of the saccade (positive betas: 248–498 ms, p̃ = 0.001, min p < 0.001; negative betas: 250–482 ms, p̃ < 0.001, min p < 0.001). Together, the topographies and timing of these positive and negative effects were compatible with a P3 ERP (Fig. 3A). The P3 component is usually found after infrequent or unexpected events, independently of sensory modality. Our data are therefore consistent with a high-level prediction error, associated with a prediction based on peripheral visual input and the subjects' eye movement.
Figure 3.

Main effect of change and interaction with the blind spot. Data aligned to saccade offset when the stimulus is foveated. A, The main effect Change is shown, comparing trials in which the stimulus remained the same, with trials, where it changed during the saccade. The effect resembles a prediction error in the form of a P3. B, The interaction Blind spot × Change is shown. This shows a reduction of the prediction error described in A. C, Correlation of each subject effect-template with ERP data over 10 partitions of the experiment. The red correlation shows that the main effect of change habituates over the course of the experiment. The blue correlation shows no significant increase or decrease for the Change × Blind spot interaction and thus stays stationary over the experiment. D, Raw ERP data of the interaction depicted in B. The top row depicts outside the blind spot data and the bottom row depicts inside the blind spot data. The difference of the change effect inside blind spot against outside blind spot was tested using a bootstrapped Yuen's t test and corrected for multiple comparisons using TFCE. The significant electrodes and time-points can be seen as black dots. This confirms the reduction of the P3 inside the blind spot.
After establishing the presence of a signal compatible with postsaccadic prediction error, we investigated whether this error signal was different depending on whether the presaccadic visual input was veridical (outside the blind spot) or inferred (filling-in inside the blind spot). The Change × Blind spot interaction (Fig. 3B) was significant from 190 to 382 ms (negative betas: 190–382 ms, p̃ = 0.007, min p < 0.001; positive betas: 276–368 ms, p̃ = 0.01, min p < 0.001). To understand the direction of the interaction effect, we additionally analyzed the raw ERP difference between the conditions change and no-change, once inside and outside the blind spot. To evaluate these data independently of effects due to the inset, we subtracted the inset difference ERP from the change conditions separately for trials inside and outside the blind spot (Fig. 3D). The resulting ERPs show how the interaction modifies the P3 component in two different ways. First, and corresponding to the positive cluster of the interaction, there is a reduction of the anterior part of the P3 when the previously peripheral stimulus was shown inside the blind spot compared with when it was shown outside. This correspond to the P3a subcomponent, which is associated with orienting responses due to the processing of unexpected, novel events (Friedman et al., 2001; Polich, 2007). Second, corresponding to the negative cluster of the interaction, there is an increase in the posterior part of the P3 for blinds pot trials. This corresponds to the P3b subcomponent, which has been associated to several different processes like changes in episodic context (Donchin and Coles, 1988), the processing of statistical surprise (Mars et al., 2008; Kolossa et al., 2012), and the updating of perceptual evidence (O'Connell et al., 2012; Wyart et al., 2012; Kelly and O'Connell, 2013; Cheadle et al., 2014). In summary, this demonstrates that the brain treats violations of predictions differently, depending on whether they are based on external or inferred information.
We controlled for nonstationary effects, such as those due to learning, by investigating the Change × Blind spot interaction over the course of the experiment. As a comparison, we looked into a similar correlation but with the main change effect. The interaction is only estimable over multiple trials; therefore, we used trial partitions of the Change × Blind spot interaction (the difference of differences) and the difference of change and no change for the change main effect. We partitioned the whole experiment into 10 parts and for each part calculated the corresponding ERP difference. We used the interaction β weights (over time and electrodes) of each subject as a template and correlated these 10 parts with the template resulting in 10 correlation values for each subject. (Fig. 3C). For the change main effect, we observed a significant negative slope of correlation values against trial partition order (winsorized mean slope: −0.012, p = 0.001, bootstrap CI = −0.022, −0.00). This indicates that the P3 amplitude diminishes over time because subjects get used to the experimental setting and become habituated to the saccade-contingent change (Ravden and Polich, 1998, 1999). However, the slope over trials for the Change × Blind spot interaction was not significantly different from zero (winsorized mean slope: 0.002, p = 0.8, bootstrap CI = −0.009, 0.012). Hence, subjects got used to the task and were less surprised by the saccade contingent change, but there was no habituation of the Change × Blind spot interaction, indicating that the modified error signal for filled-in content was a stationary effect.
In addition to the Change × Blind spot interaction, we found one additional significant late interaction between the factors Change and Inset (Fig. 4B). The interaction was significant from 334 ms to at least 500 ms (positive betas: 342–436 ms,p̃ = 0.016, min p = 0.005 and from 440 to >500 ms, p̃ = 0.035, min-p = 0.019; negative betas: 334–428 ms, p̃ = 0.008, min p = 0.004, from 434 to 468 ms, p̃ = 0.036, min p = 0.013 and from 472 to >500 ms, p̃ = 0.039, min p = 0.026). We interpreted this interaction as a consequence of the imbalance in the experimental design (see Materials and Methods, Incomplete design). We showed more continuous than inset stimuli in the periphery (1/3–2/3) due to the physical limitation, as an inset stimulus in the blind spot is necessarily perceived as the stimulus without inset. Due to this imbalance, a change from continuous to an inset stimulus is twice as frequent as a change from inset to a continuous stimulus. This less frequent change, the one to a continuous stimulus, resulted in an increased response compatible with a higher surprise.
Middle and early prediction signals
The main and interaction effects presented above emerge late after the postsaccadic foveation of the stimulus and showed a topography that is consistent with a known high-level associative component. As such, those effects are unlikely to be related to trans-saccadic prediction signals of specific low-level visual input. We search for evidence for this kinds of predictions based on two criteria: effect latency and interaction with low-level stimulus features. Specifically, we would first expect that sensory error signals would be different whether the change was from presaccadic no-inset to postsaccadic inset stimuli or vice versa. Second, the presaccadic position of the stimulus should also have an effect due to the communication of prediction and error signals between unilateral hemispheric areas and the bihemispheric central representation of the postsaccadic foveal stimulus. The change effect had a lateralized component, which was dependent on the stimulus location previous to the eye movement, even though the stimulus was then fixated centrally: we observed a significant Change × Position interaction (Fig. 4A) from 182 to 226 ms (positive betas: 182–226 ms, p̃ = 0.009, min p < 0.001; negative betas: 192–212 ms, p̃ = 0.029, min p = 0.015, and from 216 to 226 ms, p̃ = 0.039, min p = 0.027). Even earlier effects were observed in an interaction between Change and Inset factors and in the three-way interaction Position × Change × Inset. The interaction Change × Inset (Fig. 4B) was significant only for negative values, ∼100 ms (90–126 ms, p̃ = 0.03, min p = 0.011). Lateralized effects of this two-way interaction were found in the Position × Change × Inset interaction (Fig. 4C): we found a positive effect from 108 to 154 ms (p̃ = 0.03, min p = 0.001) and a similar effect, albeit negative, on the other hemisphere from 120 to 142 ms (p̃ = 0.035, min p = 0.006). Note that the interactions that include the factor Position result in topographic effect similar to the one observed for the presaccadic stimuli (Fig. 2B), thus suggesting that the processing of postsaccadic foveal stimulus include extensive crosstalk with the areas that represented it before a movement was done. Altogether, these middle and early effects of the interactions between saccadic-contingent change, presaccadic position, and low-level characteristics of the stimulus indicate the production of error signals to low-level visual predictions.
Discussion
We investigated the EEG correlates of prediction errors to changes in visual stimulation occurring during an eye movement. We found early (∼100 ms), middle (∼200 ms), and late (∼300 ms) latency “surprise” responses to changed stimuli. These responses can neither be explained exclusively in terms of remapping operations, as movement vectors were equivalent across conditions, nor by differences in the postsaccadic stimulus because we compared responses to identical stimuli. Early and middle latency responses were either lateralized and/or dependent on the Inset factor, suggesting that their sources are processes specific to the visual sensory domain. In contrast, the late latency response resembled a P3 ERP component, thus suggesting it has a source in a high-order process, possibly nonvisual, that it is related to the occurrence of an unexpected event. Such dissociation between perceptual and associative predictions have been shown previously in human EEG, with comparable methods, topographies and time courses, but in the context of perceptual decision-making experiments (Wyart et al., 2012; Cheadle et al., 2014). The late response we observed was also present when the stimulus was located inside the blind spot, but it was reduced in amplitude compared with a response outside the blind spot. This modified response to a change in the blind spot indicates knowledge of the unreliability of the filled-in information, occurring only at a late stage of processing.
We observed early, middle, and late latency effects following a change of the stimulus during a saccade. Both early and middle effects are compatible with modality specific processes: they interact with the side of the field in which the movement is directed (early and middle component) and the orientation contrast of the stimulus (early component only). Previously, sensory error signals have been associated in EEG experiment with the mismatch negativity potential (MMN), both in the auditory (Garrido et al., 2009) and visual domain (Stefanics et al., 2011). In the visual domain, orientation mismatch, comparable to our saccade-contingent change in orientation of the stimulus, result in MMN with a temporal and topographic profile similar to the early and middle latency change, and change interactions seen here (Astikainen et al., 2008). These early effects are, however, unlikely to be related to processes occurring in the primary visual cortex. At 100 ms, the first feedforward–feedback sweep in V1 has already occurred (Hupé et al., 2000; Chen et al., 2007). Furthermore, the C1 visual ERP component, which originates in V1 (Di Russo et al., 2002), has a latency of 50–60 ms and peaks ∼90 ms, which is mostly before the effects seen here. The absence of a very early error signal is in concordance with the current knowledge of the extent of remapping in visual areas. Responses related to remapping are present at high levels in the visual hierarchy and are almost absent in the primary visual cortex (Nakamura and Colby, 2002; Merriam et al., 2007), making it less likely that predictions related to eye movement reach this area. The prediction of foveal, high-spatial frequency content in the primary visual cortex would be, in any case, inefficient due to the limited spatial spectral resolution of peripheral information (Anderson et al., 1991) and the limited accuracy of eye movements (Weber and Daroff, 1971). This favors a more restricted role of predictive coding for the primary visual cortex, in which only statistical regularities about the world and the effect of low-level spatial context are taken in account (Srinivasan et al., 1982; Rao and Ballard, 1999; Fiser et al., 2010), rather than an adaptive, all-encompassing process that also predicts specific content at all cortical areas. Nevertheless, the change-related effects starting at 100 and 200 ms are likely due to other stages of low- and middle-level visual processing.
Previous studies that attempted to uncover error signals to an unpredicted sensory input have been inconclusive regarding how early, or how upstream, prediction signals are produced. In some studies, only late signals related to prediction errors were found. For instance, in the modeling of mismatch negativity signals of auditory stimuli, only the late evoked responses (P3 like here), can be clearly attributed to inhibitory feedback of prediction errors (Garrido et al., 2007). Similarly, a time-frequency analysis shows that high-frequency gamma differences, attributable to prediction errors, start only late, after 200 ms (Todorovic et al., 2011), which is the same latency for the effect that occurs in most ERP repetition suppression experiments (for review, see Grill-Spector et al., 2006). In contrast, other experiments support early prediction errors. Neuroimaging studies show activity patterns in primary visual cortex consistent with predictive signals for pattern adaptation (Grill-Spector et al., 2006; Summerfield et al., 2008; Egner et al., 2010), apparent motion (Alink et al., 2010), and 3D grouping (Murray et al., 2002). In electrophysiological experiments, evidence for early predictions exist for the auditory mismatch negativity effect (Wacongne et al., 2011), and in the case of a reduction of EEG sensory responses due to “self-stimulation” (Martikainen et al., 2005). In this last kind of experiment, the subjects trigger for themselves the appearance of a standard stimulus (Schafer and Marcus, 1973) through a motor action coupled artificially by experimental design, with the appearance of the stimulus. In the case of our experiment, the stimulus was always present, and the subjects' actions were directly related to the modality of stimulation. The stimulus changed its retinotopic location and resolution due to a shift of the visual field that follows overlearned sensorimotor contingencies expected for any eye movement.
The absence of an early interaction between Change and Blind spot factors indicate that filled-in signals, which are inferred from neighbor inputs, are processed by visual areas as if they were the result of an actual input. Such interaction only emerges at a later stage in the form of a modulation of both anterior and posterior subcomponents of the P3. This supports the idea that the exclusively inferred quality of the signals from the blind spot is not lost, and it is taken into account in higher-level associative areas. Even though most of the research showing visual-related P3 components has been done in conditions without eye movements, P3 responses have been recently described in experiment that permit them (Dandekar et al., 2012a; Kamienkowski et al., 2012; Kaunitz et al., 2014). In contrast to these experiments, in which an infrequent item or a search target produced the P3 component, here the P3 was elicited by a movement-contingent stimulus change. Whereas the MMN potential discussed above is related to low-level sensory processing, the P3 is considered a correlate of a high-level error signal. For instance, P3 responses seem to be a response associated to the processing of global deviants in a stimulus or event succession rather than to local deviants (Bekinschtein et al., 2009; Chennu et al., 2013), thus depending on the episodic context rather than in specific sensory features (Donchin and Coles, 1988). A formal interpretation of the P3 is that it corresponds to the processing of statistical surprise (Mars et al., 2008; Feldman and Friston, 2010; Kolossa et al., 2012), and also, especially for the posterior subcomponent, to the update of perceptual evidence (O'Connell et al., 2012; Wyart et al., 2012; Kelly and O'Connell, 2013; Cheadle et al., 2014). The reduction of the anterior subcomponent (peaking at 300 ms) in blind spot trials is consistent with predictive coding simulations of attention (Feldman and Friston, 2010). In these simulations, top-down estimates of reliability (precision) modulate the gain of prediction error units in lower regions of the visual hierarchy. This gain modulation would correspond to attention, where high-precision signals enjoy greater gain and the P3 represents a revision of these precision estimates. Changes in visual stimuli need to be associated with movements or transients to be detected (Grimes, 1996; Henderson and Hollingworth, 2003). Because this is prevented here by precise experimental timing, it is safe to assume that saccade-contingent changes, even if task irrelevant, are novel events that would result in a revision on the reliability of estimates of stimulus or event constancy, at least in the local context of the experiment. However, in the case of information from the blind spot there is no such context that can change the intrinsic unreliability of filled-in signals, thus resulting in a reduced revision of conditional expectations about the stimulus being stationary. This means that an interpretation of our findings is that we attend away (ignore) visual information from the blind spot; thereby attenuating subsequent responses to violated predictions, when resampling the visual scene.
A modulation of the posterior subcomponent of the P3 in blind spot trials can be observed as well. In contrast to the modulation of the anterior subcomponent, this difference is not fully consistent with the temporal progression and topography of the change effect. We consider two alternatives interpretations, not necessarily incompatible, of this posterior interaction. First, although the blind spot region remains unreliable, our experimental design could result in a revision, not of the precision estimates, but of the underlying model of the causes of sensory input from this region, normally inferred from the surrounding. In other words, in blind spot trials there is a revision not only of the expectation about the stimulus being stationary (albeit reduced compared with trials outside the blind spot in which the veridical presaccadic stimulus has a high reliability), but also of the filling-in model. The second interpretation follows the results of EEG experiments about perceptual decision-making (O'Connell et al., 2012; Wyart et al., 2012; Kelly and O'Connell, 2013; Cheadle et al., 2014), in which a similar posterior topography and time course to the one observed here is seen for the updating of perceptual evidence, indicating that the posterior cluster of the interaction could represent an updating of the perceptual evidence about the contents of the blind spot location. Crucially, these are updates of a decision signal instead of a perceptual one, and thus in our experiment, even in the absence of an explicit task goal, would represent the accumulation of new evidence against the filling-in percept being a reliable model of sensory input.
There are two main conclusions of the present work. First, the sensory consequences of eye movements are actively predicted at multiple levels of the visual hierarchy. This occurs for the prediction of the actual visual content that is present before an eye movement, rather than only for the prediction of general statistics of visual content. Second, the prediction of content that is exclusively inferred differs between levels of the visual hierarchy. Low-level sensory areas process the stimulus as if it originated from an external input source. In contrast, in higher-level processing, the filled-in (and therefore imprecise) nature of the blind-spot information is taken into account. These results suggest that a hierarchy of predictions does not operate in a strictly successive way, in which prediction and errors necessarily propagate all the way down and up, respectively, low- and high-level predictions of the same content can be dissociated.
Footnotes
This work was supported by Priority Program 1665 of the DFG to B.V.E., ERC-2010-AdG#269716-MULTISENSE and SFB 936 Multi-Site Communication in the Brain (B6) to P.K., and Grant FP7-ICT-270212 Extending Sensorimotor Contingencies to Cognition (eSMCs) and Grant H2020, H2020-FETPROACT-2014, 641321 (socSMCs) to J.P.O. We thank Tim Kietzmann, Basil Wahn, and Anna Lisa Gert for their helpful discussions about the methods and providing comments on the paper, and the anonymous reviewers for constructive criticism and helpful suggestions.
The authors declare no competing financial interests.
References
- Alink A, Schwiedrzik CM, Kohler A, Singer W, Muckli L. Stimulus predictability reduces responses in primary visual cortex. J Neurosci. 2010;30:2960–2966. doi: 10.1523/JNEUROSCI.3730-10.2010. [DOI] [PMC free article] [PubMed] [Google Scholar]
- Anderson SJ, Mullen KT, Hess RF. Human peripheral spatial resolution for achromatic retinal factors. J Physiol. 1991;442:47–64. doi: 10.1113/jphysiol.1991.sp018781. [DOI] [PMC free article] [PubMed] [Google Scholar]
- Astikainen P, Lillstrang E, Ruusuvirta T. Visual mismatch negativity for changes in orientation: a sensory memory-dependent response. Eur J Neurosci. 2008;28:2319–2324. doi: 10.1111/j.1460-9568.2008.06510.x. [DOI] [PubMed] [Google Scholar]
- Awater H, Kerlin JR, Evans KK, Tong F. Cortical representation of space around the blind spot. J Neurophysiol. 2005;94:3314–3324. doi: 10.1152/jn.01330.2004. [DOI] [PMC free article] [PubMed] [Google Scholar]
- Bastos AM, Usrey WM, Adams RA, Mangun GR, Fries P, Friston KJ. Canonical microcircuits for predictive coding. Neuron. 2012;76:695–711. doi: 10.1016/j.neuron.2012.10.038. [DOI] [PMC free article] [PubMed] [Google Scholar]
- Bekinschtein TA, Dehaene S, Rohaut B, Tadel F, Cohen L, Naccache L. Neural signature of the conscious processing of auditory regularities. Proc Natl Acad Sci U S A. 2009;106:1672–1677. doi: 10.1073/pnas.0809667106. [DOI] [PMC free article] [PubMed] [Google Scholar]
- Brainard DH. The psychophysics toolbox. Spat Vis. 1997;10:433–436. doi: 10.1163/156856897X00357. [DOI] [PubMed] [Google Scholar]
- Cheadle S, Wyart V, Tsetsos K, Myers N, de Gardelle V, Herce Castañón S, Summerfield C. Adaptive gain control during human perceptual choice. Neuron. 2014;81:1429–1441. doi: 10.1016/j.neuron.2014.01.020. [DOI] [PMC free article] [PubMed] [Google Scholar]
- Chen CM, Lakatos P, Shah AS, Mehta AD, Givre SJ, Javitt DC, Schroeder CE. Functional anatomy and interaction of fast and slow visual pathways in macaque monkeys. Cereb Cortex. 2007;17:1561–1569. doi: 10.1093/cercor/bhl067. [DOI] [PubMed] [Google Scholar]
- Chennu S, Noreika V, Gueorguiev D, Blenkmann A, Kochen S, Ibáñez A, Owen AM, Bekinschtein TA. Expectation and attention in hierarchical auditory prediction. J Neurosci. 2013;33:11194–11205. doi: 10.1523/JNEUROSCI.0114-13.2013. [DOI] [PMC free article] [PubMed] [Google Scholar]
- Cornelissen FW, Peters EM, Palmer J. The eyelink toolbox: eye tracking with MATLAB and the psychophysics toolbox. Behav Res Methods Instrum Comput. 2002;34:613–617. doi: 10.3758/BF03195489. [DOI] [PubMed] [Google Scholar]
- Dandekar S, Ding J, Privitera C, Carney T, Klein SA. The fixation and saccade P3. PLoS One. 2012a;7:e48761. doi: 10.1371/journal.pone.0048761. [DOI] [PMC free article] [PubMed] [Google Scholar]
- Dandekar S, Privitera C, Carney T, Klein SA. Neural saccadic response estimation during natural viewing. J Neurophysiol. 2012b;107:1776–1790. doi: 10.1152/jn.00237.2011. [DOI] [PMC free article] [PubMed] [Google Scholar]
- Delorme A, Makeig S. EEGLAB: an open source toolbox for analysis of single-trial EEG dynamics including independent component analysis. J Neurosci Methods. 2004;134:9–21. doi: 10.1016/j.jneumeth.2003.10.009. [DOI] [PubMed] [Google Scholar]
- Dimigen O, Sommer W, Hohlfeld A, Jacobs AM, Kliegl R. Coregistration of eye movements and EEG in natural reading: analyses and review. J Exp Psychol Gen. 2011;140:552–572. doi: 10.1037/a0023885. [DOI] [PubMed] [Google Scholar]
- Di Russo F, Martínez A, Sereno MI, Pitzalis S, Hillyard SA. Cortical sources of the early components of the visual evoked potential. Hum Brain Mapp. 2002;15:95–111. doi: 10.1002/hbm.10010. [DOI] [PMC free article] [PubMed] [Google Scholar]
- Donchin E, Coles MGH. Is the P300 component a manifestation of context updating? Behav Brain Sci. 1988;11:357–374. doi: 10.1017/S0140525X00058027. [DOI] [Google Scholar]
- Egner T, Monti JM, Summerfield C. Expectation and surprise determine neural population responses in the ventral visual stream. J Neurosci. 2010;30:16601–16608. doi: 10.1523/JNEUROSCI.2770-10.2010. [DOI] [PMC free article] [PubMed] [Google Scholar]
- Engel AK, Maye A, Kurthen M, König P. Where's the action? The pragmatic turn in cognitive science. Trends Cogn Sci. 2013;17:202–209. doi: 10.1016/j.tics.2013.03.006. [DOI] [PubMed] [Google Scholar]
- Ernst MO, Banks MS. Humans integrate visual and haptic information in a statistically optimal fashion. Nature. 2002;415:429–433. doi: 10.1038/415429a. [DOI] [PubMed] [Google Scholar]
- Feldman H, Friston KJ. Attention, uncertainty, and free-energy. Front Hum Neurosci. 2010;4:215. doi: 10.3389/fnhum.2010.00215. [DOI] [PMC free article] [PubMed] [Google Scholar]
- Fiorani Júnior M, Rosa MG, Gattass R, Rocha-Miranda CE. Dynamic surrounds of receptive fields in primate striate cortex: a physiological basis for perceptual completion? Proc Natl Acad Sci U S A. 1992;89:8547–8551. doi: 10.1073/pnas.89.18.8547. [DOI] [PMC free article] [PubMed] [Google Scholar]
- Fiser J, Berkes P, Orbán G, Lengyel M. Statistically optimal perception and learning: from behavior to neural representations. Trends Cogn Sci. 2010;14:119–130. doi: 10.1016/j.tics.2010.01.003. [DOI] [PMC free article] [PubMed] [Google Scholar]
- Friedman D, Cycowicz YM, Gaeta H. The novelty P3: an event-related brain potential (ERP) sign of the brain's evaluation of novelty. Neurosci Biobehav Rev. 2001;25:355–373. doi: 10.1016/S0149-7634(01)00019-7. [DOI] [PubMed] [Google Scholar]
- Friston K, Adams RA, Perrinet L, Breakspear M. Perceptions as hypotheses: saccades as experiments. Front Psychol. 2012;3:151. doi: 10.3389/fpsyg.2012.00151. [DOI] [PMC free article] [PubMed] [Google Scholar]
- Garrido MI, Kilner JM, Kiebel SJ, Friston KJ. Evoked brain responses are generated by feedback loops. Proc Natl Acad Sci U S A. 2007;104:20961–20966. doi: 10.1073/pnas.0706274105. [DOI] [PMC free article] [PubMed] [Google Scholar]
- Garrido MI, Kilner JM, Stephan KE, Friston KJ. The mismatch negativity: a review of underlying mechanisms. Clin Neurophysiol. 2009;120:453–463. doi: 10.1016/j.clinph.2008.11.029. [DOI] [PMC free article] [PubMed] [Google Scholar]
- Grill-Spector K, Henson R, Martin A. Repetition and the brain: neural models of stimulus-specific effects. Trends Cogn Sci. 2006;10:14–23. doi: 10.1016/j.tics.2005.11.006. [DOI] [PubMed] [Google Scholar]
- Grimes J. On the failure to detect changes in scenes across saccades. In: Akins K, editor. Perception. New York: Oxford UP; 1996. pp. 89–110. [Google Scholar]
- Henderson JM, Hollingworth A. Global change blindness during scene perception. Psychol Sci. 2003;14:493–497. doi: 10.1111/1467-9280.02459. [DOI] [PubMed] [Google Scholar]
- Hupé JM, James AC, Girard P, Lomber SG, Payne BR, Bullier J. Feedback connections act on the early part of the responses in monkey visual cortex. J Neurophysiol. 2001;85:134–145. doi: 10.1152/jn.2001.85.1.134. [DOI] [PubMed] [Google Scholar]
- Kamienkowski JE, Ison MJ, Quiroga RQ, Sigman M. Fixation-related potentials in visual search: a combined EEG and eye tracking study. J Vis. 2012;12(7):4, 1–20. doi: 10.1167/12.7.4. [DOI] [PubMed] [Google Scholar]
- Kaunitz LN, Kamienkowski JE, Varatharajah A, Sigman M, Quiroga RQ, Ison MJ. Looking for a face in the crowd: fixation-related potentials in an eye-movement visual search task. Neuroimage. 2014;89:297–305. doi: 10.1016/j.neuroimage.2013.12.006. [DOI] [PubMed] [Google Scholar]
- Kelly SP, O'Connell RG. Internal and external influences on the rate of sensory evidence accumulation in the human brain. J Neurosci. 2013;33:19434–19441. doi: 10.1523/JNEUROSCI.3355-13.2013. [DOI] [PMC free article] [PubMed] [Google Scholar]
- Kleiner M, Brainard D, Pelli DG. What's new in psychtoolbox-3? Percept 36, ECVP Abstract Supplement: 14. 2007 [Google Scholar]
- Kok P, Jehee JF, de Lange FP. Less is more: expectation sharpens representations in the primary visual cortex. Neuron. 2012;75:265–270. doi: 10.1016/j.neuron.2012.04.034. [DOI] [PubMed] [Google Scholar]
- Kolossa A, Fingscheidt T, Wessel K, Kopp B. A model-based approach to trial-by-trial p300 amplitude fluctuations. Front Hum Neurosci. 2012;6:359. doi: 10.3389/fnhum.2012.00359. [DOI] [PMC free article] [PubMed] [Google Scholar]
- Komatsu H, Kinoshita M, Murakami I. Neural responses in the retinotopic representation of the blind spot in the macaque V1 to stimuli for perceptual filling-in. J Neurosci. 2000;20:9310–9319. doi: 10.1523/JNEUROSCI.20-24-09310.2000. [DOI] [PMC free article] [PubMed] [Google Scholar]
- Körding KP, Wolpert DM. Bayesian integration in sensorimotor learning. Nature. 2004;427:244–247. doi: 10.1038/nature02169. [DOI] [PubMed] [Google Scholar]
- Litvak V, Mattout J, Kiebel S, Phillips C, Henson R, Kilner J, Barnes G, Oostenveld R, Daunizeau J, Flandin G, Penny W, Friston K. EEG and MEG data analysis in SPM8. Comput Intell Neurosci. 2011;2011:852961. doi: 10.1155/2011/852961. [DOI] [PMC free article] [PubMed] [Google Scholar]
- Mars RB, Debener S, Gladwin TE, Harrison LM, Haggard P, Rothwell JC, Bestmann S. Trial-by-trial fluctuations in the event-related electroencephalogram reflect dynamic changes in the degree of surprise. J Neurosci. 2008;28:12539–12545. doi: 10.1523/JNEUROSCI.2925-08.2008. [DOI] [PMC free article] [PubMed] [Google Scholar]
- Martikainen MH, Kaneko K, Hari R. Suppressed responses to self-triggered sounds in the human auditory cortex. Cereb Cortex. 2005;15:299–302. doi: 10.1093/cercor/bhh131. [DOI] [PubMed] [Google Scholar]
- Matsumoto M, Komatsu H. Neural responses in the macaque v1 to bar stimuli with various lengths presented on the blind spot. J Neurophysiol. 2005;93:2374–2387. doi: 10.1152/jn.00811.2004. [DOI] [PubMed] [Google Scholar]
- Merriam EP, Genovese CR, Colby CL. Remapping in human visual cortex. J Neurophysiol. 2007;97:1738–1755. doi: 10.1152/jn.00189.2006. [DOI] [PMC free article] [PubMed] [Google Scholar]
- Murray SO, Kersten D, Olshausen BA, Schrater P, Woods DL. Shape perception reduces activity in human primary visual cortex. Proc Natl Acad Sci U S A. 2002;99:15164–15169. doi: 10.1073/pnas.192579399. [DOI] [PMC free article] [PubMed] [Google Scholar]
- Nakamura K, Colby CL. Updating of the visual representation in monkey striate and extrastriate cortex during saccades. Proc Natl Acad Sci U S A. 2002;99:4026–4031. doi: 10.1073/pnas.052379899. [DOI] [PMC free article] [PubMed] [Google Scholar]
- O'Connell RG, Dockree PM, Kelly SP. A supramodal accumulation-to-bound signal that determines perceptual decisions in humans. Nat Neurosci. 2012;15:1729–1735. doi: 10.1038/nn.3248. [DOI] [PubMed] [Google Scholar]
- Palmer JA, Makeig S, Kreutz-Delgado K, Rao B. Newton method for the ICA mixture model. Proceedings of the 33rd IEEE International Conference on Acoustics and Signal Processing; 2008. pp. 1805–1808. [Google Scholar]
- Pernet CR, Chauveau N, Gaspar C, Rousselet GA. LIMO EEG: a toolbox for hierarchical LInear MOdeling of ElectroEncephaloGraphic data. Comput Intell Neurosci. 2011;2011:831409. doi: 10.1155/2011/831409. [DOI] [PMC free article] [PubMed] [Google Scholar]
- Pernet CR, Latinus M, Nichols TE, Rousselet GA. Cluster-based computational methods for mass univariate analyses of event-related brain potentials/fields: a simulation study. J Neurosci Methods. 2014 doi: 10.1016/j.jneumeth.2014.08.003. Advance online publication. [DOI] [PMC free article] [PubMed] [Google Scholar]
- Plöchl M, Ossandón JP, König P. Combining EEG and eye tracking: identification, characterization, and correction of eye movement artifacts in electroencephalographic data. Front Hum Neurosci. 2012;6:278. doi: 10.3389/fnhum.2012.00278. [DOI] [PMC free article] [PubMed] [Google Scholar]
- Polich J. Updating P300: an integrative theory of P3a and P3b. Clin Neurophysiol. 2007;118:2128–2148. doi: 10.1016/j.clinph.2007.04.019. [DOI] [PMC free article] [PubMed] [Google Scholar]
- Rao RP, Ballard DH. Predictive coding in the visual cortex: a functional interpretation of some extra-classical receptive-field effects. Nat Neurosci. 1999;2:79–87. doi: 10.1038/4580. [DOI] [PubMed] [Google Scholar]
- Ravden D, Polich J. Habituation of P300 from visual stimuli. Int J Psychophysiol. 1998;30:359–365. doi: 10.1016/S0167-8760(98)00039-7. [DOI] [PubMed] [Google Scholar]
- Ravden D, Polich J. On P300 measurement stability: habituation, intra-trial block variation, and ultradian rhythms. Biol Psychol. 1999;51:59–76. doi: 10.1016/S0301-0511(99)00015-0. [DOI] [PubMed] [Google Scholar]
- Rousselet GA, Gaspar CM, Wieczorek KP, Pernet CR. Modeling single-trial ERP reveals modulation of bottom-up face visual processing by top-down task constraints (in some subjects) Front Psychol. 2011;2:137. doi: 10.3389/fpsyg.2011.00137. [DOI] [PMC free article] [PubMed] [Google Scholar]
- Schafer EW, Marcus MM. Self-stimulation sensory responses. Science. 1973;181:175–177. doi: 10.1126/science.181.4095.175. [DOI] [PubMed] [Google Scholar]
- Smith SM, Nichols TE. Threshold-free cluster enhancement: addressing problems of smoothing, threshold dependence and localisation in cluster inference. Neuroimage. 2009;44:83–98. doi: 10.1016/j.neuroimage.2008.03.061. [DOI] [PubMed] [Google Scholar]
- Srinivasan MV, Laughlin SB, Dubs A. Predictive coding: a fresh view of inhibition in the retina. Proc R Soc Lond. 1982;216:427–459. doi: 10.1098/rspb.1982.0085. [DOI] [PubMed] [Google Scholar]
- Stefanics G, Kimura M, Czigler I. Visual mismatch negativity reveals automatic detection of sequential regularity violation. Front Hum Neurosci. 2011;5:46. doi: 10.3389/fnhum.2011.00046. [DOI] [PMC free article] [PubMed] [Google Scholar]
- Summerfield C, Trittschuh EH, Monti JM, Mesulam MM, Egner T. Neural repetition suppression reflects fulfilled perceptual expectations. Nat Neurosci. 2008;11:1004–1006. doi: 10.1038/nn.2163. [DOI] [PMC free article] [PubMed] [Google Scholar]
- Todorovic A, van Ede F, Maris E, de Lange FP. Prior expectation mediates neural adaptation to repeated sounds in the auditory cortex: an MEG study. J Neurosci. 2011;31:9118–9123. doi: 10.1523/JNEUROSCI.1425-11.2011. [DOI] [PMC free article] [PubMed] [Google Scholar]
- Tong F, Engel SA. Interocular rivalry revealed in the human cortical blind-spot representation. Nature. 2001;411:195–199. doi: 10.1038/35075583. [DOI] [PubMed] [Google Scholar]
- Wacongne C, Labyt E, van Wassenhove V, Bekinschtein T, Naccache L, Dehaene S. Evidence for a hierarchy of predictions and prediction errors in human cortex. Proc Natl Acad Sci U S A. 2011;108:20754–20759. doi: 10.1073/pnas.1117807108. [DOI] [PMC free article] [PubMed] [Google Scholar]
- Weber RB, Daroff RB. The metrics of horizontal saccadic eye movements in normal humans. Vision Res. 1971;11:921–928. doi: 10.1016/0042-6989(71)90212-4. [DOI] [PubMed] [Google Scholar]
- Weiss Y, Simoncelli EP, Adelson EH. Motion illusions as optimal percepts. Nat Neurosci. 2002;5:598–604. doi: 10.1038/nn0602-858. [DOI] [PubMed] [Google Scholar]
- Wilcox RR. Introduction to robust estimation and hypothesis testing. Ed 3. Waltham, MA: Academic; 2012. [Google Scholar]
- Wolf E, Morandi AJ. Retinal sensitivity in the region of the blind spot. J Opt Soc Am. 1962;52:806–812. doi: 10.1364/JOSA.52.000806. [DOI] [PubMed] [Google Scholar]
- Wolpert DM, Ghahramani Z, Jordan MI. An internal model for sensorimotor integration. Science. 1995;269:1880–1882. doi: 10.1126/science.7569931. [DOI] [PubMed] [Google Scholar]
- Wyart V, de Gardelle V, Scholl J, Summerfield C. Rhythmic fluctuations in evidence accumulation during decision making in the human brain. Neuron. 2012;76:847–858. doi: 10.1016/j.neuron.2012.09.015. [DOI] [PMC free article] [PubMed] [Google Scholar]