

Abstract
Vasodilatory prostaglandins play a key role in neurovascular coupling (NVC), the tight link between neuronal activity and local cerebral blood flow, but their precise identity, cellular origin and the receptors involved remain unclear. Here we show in rats that NMDA-induced vasodilation and hemodynamic responses evoked by whisker stimulation involve cyclooxygenase-2 (COX-2) activity and activation of the prostaglandin E2 (PgE2) receptors EP2 and EP4. Using liquid chromatography-electrospray ionization-tandem mass spectrometry, we demonstrate that PgE2 is released by NMDA in cortical slices. The characterization of PgE2 producing cells by immunohistochemistry and single-cell reverse transcriptase-PCR revealed that pyramidal cells and not astrocytes are the main cell type equipped for PgE2 synthesis, one third expressing COX-2 systematically associated with a PgE2 synthase. Consistent with their central role in NVC, in vivo optogenetic stimulation of pyramidal cells evoked COX-2-dependent hyperemic responses in mice. These observations identify PgE2 as the main prostaglandin mediating sensory-evoked NVC, pyramidal cells as their principal source and vasodilatory EP2 and EP4 receptors as their targets.
SIGNIFICANCE STATEMENT Brain function critically depends on a permanent spatiotemporal match between neuronal activity and blood supply, known as NVC. In the cerebral cortex, prostaglandins are major contributors to NVC. However, their biochemical identity remains elusive and their cellular origins are still under debate. Although astrocytes can induce vasodilations through the release of prostaglandins, the recruitment of this pathway during sensory stimulation is questioned. Using multidisciplinary approaches from single-cell reverse transcriptase-PCR, mass spectrometry, to ex vivo and in vivo pharmacology and optogenetics, we provide compelling evidence identifying PgE2 as the main prostaglandin in NVC, pyramidal neurons as their main cellular source and the vasodilatory EP2 and EP4 receptors as their main targets. These original findings will certainly change the current view of NVC.
Keywords: astrocytes, cerebral cortex, cyclooxygenase-2, interneurons, pyramidal cells
Introduction
Neurovascular coupling (NVC), the tight link between neuronal activity and local cerebral blood flow, is essential for normal brain function. It is also the physiological basis of functional brain imaging techniques, such as positron emission tomography and functional magnetic resonance imaging that are widely used to map neuronal activity using hemodynamic signals (Fox et al., 1988; Logothetis et al., 2001; Iadecola, 2004; Lauritzen, 2005). In several pathologies including Alzheimer's disease and stroke, NVC is altered by dysfunction in the neuronal, astroglial, and/or vascular compartments of the neurovascular unit (Iadecola, 2004; Zlokovic, 2011).
Despite this physiopathological importance the cellular and molecular mechanisms of NVC remain elusive. In the neocortex they involve various messengers (Attwell et al., 2010; Cauli and Hamel, 2010; Leithner et al., 2010; Liu et al., 2012). In rodents, vasodilatory prostaglandins play a key role in NVC accounting for approximately one-half of the hyperemic response to sensory stimuli (Niwa et al., 2000; Bakalova et al., 2002; Stefanovic et al., 2006; Lecrux et al., 2011). Prostaglandins are arachidonic acid derivatives produced by the sequential action of rate-limiting cyclooxygenases (COXs) and terminal synthesizing enzymes specifying their nature (Funk, 2001). Presumably because of the lack of selective inhibitors for terminal enzymes, most studies relied only on inhibiting COX-1 and/or COX-2 activity (Niwa et al., 2000, 2001; Bakalova et al., 2002; Zonta et al., 2003; Stefanovic et al., 2006; Takano et al., 2006; Gordon et al., 2008; Lecrux et al., 2011), hence lacking determination of the prostaglandin subspecies relevant for NVC.
In the cerebral cortex prostaglandin E2 (PgE2) and prostacyclin (PgI2) are the main prostaglandins relaxing vascular smooth muscle cells and pericytes through activation of EP2, EP4, or IP receptors (Davis et al., 2004; Maubach et al., 2009; Myren et al., 2010, 2011; Woodward et al., 2011; Hall et al., 2014). Although antagonism of these receptors provides a means to identify the NVC prostaglandins, their use is still poorly documented (Hall et al., 2014) and has been limited by the confounding constrictive effect of the PgE2 receptor EP1 (Dabertrand et al., 2013).
The cellular sources of the NVC prostaglandins are also uncertain since different synthesizing enzymes are expressed in various cell types including neurons, astrocytes, microglia, and endothelial cells (Yamagata et al., 1993; Breder et al., 1995; Kaufmann et al., 1996; Mehl et al., 1999; Vazquez-Tello et al., 2004; Wang et al., 2005; Cahoy et al., 2008; Anrather et al., 2011; Lecrux et al., 2011).
We addressed these issues using ex vivo and in vivo approaches, and found that COX-2 and the PgE2 receptors EP2 and EP4 are essential contributors of NVC responses in the cerebral cortex. Consistently we demonstrate the PgE2 release ex vivo by means of liquid chromatography-electrospray ionization-tandem mass spectrometry (LC-ESI-MS/MS). Using immunocytochemistry and single-cell reverse transcriptase-PCR (scRT-PCR), we established that pyramidal cells are the major cell type equipped for COX-2-derived PgE2 synthesis. We further demonstrated their central role by concurrent in vivo optogenetic photostimulation of pyramidal cells and pharmacological manipulations of the NVC response. Our findings identify pyramidal cells and PgE2, respectively, as the major source and key vasoactive messenger of NVC responses to sensory stimulation.
Materials and Methods
Animals.
Wistar rats (postnatal days 17.0 ± 0.1; Janvier) were used for patch-clamp recordings, vascular reactivity and measurement of prostanoids in acute slices. Adult Wistar or Sprague-Dawley rats (250–300 g) were respectively used for immunostaining (n = 7) or whisker-induced NVC experiments (n = 15). The Jackson Laboratory Line B6;129P-Emx1tm1Jlr/J (Gorski et al., 2002) mice were crossed with B6;129S-Gt(ROSA)26Sortm32.1(CAG-COP4*H134R/EYFP)Hze/J mice (Madisen et al., 2012). Five male and female 2- to 4-month-old animals from the resultant strain weighing 20–30 g were used for optogenetic experiments. B6.Cg-Tg(Thy1-YFPH)2Jrs/J mice (Feng et al., 2000) of the same age and weight were used for controls (n = 4). All animals were housed in a temperature-controlled (21–25°C) room under daylight conditions and were given water ad libitum. A maximum of five mice or three rats are housed per cage and single animal housing was avoided. All experiments were performed in accordance with the EU Council Directive 86-609, the British Columbia Animal Care Committee and animal and Ethics committee of the Montreal Neurological Institute in accordance with Canadian Council for Animal Care guidelines.
Slice preparation.
After decapitation brains were quickly removed and placed into cold (∼4°C) oxygenated artificial CSF (aCSF) containing the following (in mm): 126 NaCl, 2.5 KCl, 1.25 NaH2PO4, 2 CaCl2, 1 MgCl2, 26 NaHCO3, 10 glucose, 15 sucrose, and 1 kynurenic acid (Sigma-Aldrich). For patch-clamp recordings and vascular reactivity rat coronal slices (300 μm thick) containing the barrel cortex were cut with a vibratome (VT1000S; Leica) and allowed to recover at room temperature for at least 1 h in aCSF saturated with O2/CO2 (95%/5%) as previously described (Karagiannis et al., 2009). Slices were then transferred to a submerged recording chamber and perfused with oxygenated aCSF lacking kynurenic acid. Blood vessels and cells were first visualized in the slice under infrared (IR) illumination, using 60× (LUMPlan FL/IR 60×/0.90 W) or 40× (LUMPlan FL N 40×/0.80 W) objectives attached to BX51WI (Olympus) or SliceScope (Scientifica) microscope equipped with Dodt gradient contrast optics (DGC; Luigs and Neumann; Dodt and Zieglgansberger, 1998) and collimated light emitting device (LED; 780 nm, ThorLabs) as transmitted light sources. For prostaglandins and thromboxane analysis, parasagittal slices (400 μm thick) were microdissected to isolate the sensorimotor cortex and the underlying white matter.
Vascular reactivity.
Diving arterioles in layers I–III were selected under IR-DGC videomicroscopy on the basis of their well defined luminal diameter (10–30 μm), their length remaining in the focal plane for at least 50 μm (Cauli et al., 2004; Rancillac et al., 2006) and of the thickness of their wall (4.6 ± 0.2 μm, n = 89 arterioles; Table 1) indicative of the presence of smooth muscle cells (Girouard et al., 2010). A resting period of at least 30 min (Lovick et al., 1999; Zonta et al., 2003) was observed after slice transfer. To limit the temperature-dependent toxicity of NMDA in slices (Andrew et al., 1996) images were acquired at room temperature every 10 s using a digital CCD camera (CoolSnap HQ2, Roper Scientific, or QIClick, QImaging) and Imaging Workbench 6.0.25 (INDEC BioSystems) or Image Pro Plus 6.3.1 (MediaCybernetics) software. The focal plane was maintained constantly on-line using parenchymal cells as anatomical landmarks. To compensate for potential x–y drifts all images were realigned off-line using the “StackReg” plug-in (Thévenaz et al., 1998) of ImageJ 1.48 software. Luminal diameter was measured on registered images using custom analysis software developed in MATLAB (MathWorks). To ovoid potential drawbacks due to blood vessels instability, only arterioles exhibiting a stable luminal diameter were further taken into account. Arterioles were considered stable if the relative SD (RSD) of their luminal diameter during an initial baseline period of 5 min was <5%. Because arterioles have a limited myogenic tone in brain slices (Fergus and Lee, 1997; Lovick et al., 1999; Cauli et al., 2004; Rancillac et al., 2006; Mishra et al., 2014), blood vessels were preconstricted by superfusing the thromboxane A2 agonist, 9,11-dideoxy-11a,9a-epoxymethanoprostaglandin F2α (U46619; 50–75 nm). As the degree of vasoconstriction has been reported to influence the amplitude and polarity of vascular responses (Blanco et al., 2008), only arterioles developing a similar and stable vasoconstriction (−40.6 ± 1.5% of initial diameter, RSD <10%, n = 89 arterioles; Table 1; Movie 1) within the 40 min following U46619 application were included in the analysis. NMDA (30 μm) was bath-applied for 5 min after 60 min of U46619 superfusion (Movie 1). COX-1/2 inhibitors and prostaglandin receptor antagonists were applied 30 min before NMDA application and throughout all the duration of the experiment. Tetrodotoxin (TTX) was applied 15 min before NMDA application. Only one arteriole was monitored per slice. Dilatory responses are expressed as changes relatively to the preconstricted state. The magnitude (Bakalova et al., 2002) of vasodilations was defined as the integral of diameter changes measured for a period of 1000 s following the onset of vasodilation.
Table 1.
Morphological and physiological properties of diving arterioles
| Ctrl (n = 16) | Indo (n = 6) | SC 560 (n = 12) | NS 398 (n = 10) | AH 6809 (n = 14) | L 161-982 (n = 11) | CAY 10441 (n = 12) | TTX (n = 8) | |
|---|---|---|---|---|---|---|---|---|
| Resting luminal diameter, μm | 17.3 ± 1.9 | 14.0 ± 2.5 | 19.3 ± 2.2 | 16.1 ± 1.2 | 14.9 ± 1.4 | 16.9 ± 2.4 | 16.6 ± 1.5 | 16.3 ± 2.2 |
| U(16,6) = 36 | U(16,12) = 78 | U(16,10) = 80 | U(16,14) = 95 | U(16,11) = 79 | U(16,12) = 93 | U(16,8) = 61 | ||
| p = 0.407007 | p = 0.42275 | p = 1 | p = 0.49841 | p = 0.680026 | p = 0.909139 | p = 0.880976 | ||
| n.s. | ||||||||
| Wall thickness, μm | 4.9 ± 0.4 | 4.6 ± 0.5 | 4.2 ± 0.4 | 4.7 ± 0.4 | 4.9 ± 0.4 | 5.2 ± 0.5 | 4.2 ± 0.4 | 3.9 ± 0.6 |
| U(16,6) = 40 | U(16,12) = 79 | U(16,10) = 75.5 | U(16,14) = 110 | U(16,11) = 76 | U(16,12) = 83 | U(16,8) = 37 | ||
| p = 0.590031 | p = 0.449918 | p = 0.815935 | p = 0.951039 | p = 0.576537 | p = 0.567585 | p = 0.105638 | ||
| n.s. | ||||||||
| Resting stability, % | 1.2 ± 0.2 | 1.6 ± 0.2 | 1.4 ± 0.2 | 1.5 ± 0.2 | 1.4 ± 0.2 | 1.7 ± 0.3 | 1.4 ± 0.1 | 1.3 ± 0.2 |
| U(16,6) = 25 | U(16,12) = 73 | U(16,10) = 57.5 | U(16,14) = 93 | U(16,11) = 61 | U(16,12) = 72 | U(16,8) = 49 | ||
| p = 0.098026 | p = 0.301529 | p = 0.240562 | p = 0.447547 | p = 0.194506 | p = 0.28029 | p = 0.382604 | ||
| n.s. | ||||||||
| Constriction level, % | 46.5 ± 3.2 | 46.0 ± 6.5 | 45.1 ± 4.9 | 39.4 ± 5.0 | 37.5 ± 3.5 | 37.2 ± 4.5 | 37.2 ± 3.5 | 35.3 ± 4.8 |
| U(16,6) = 45 | U(16,12) = 93.5 | U(16,10) = 52 | U(16,14) = 69 | U(16,11) = 58.5 | U(16,12) = 57 | U(16,8) = 37.5 | ||
| p = 0.857733 | p = 0.909139 | p = 0.149647 | p = 0.077067 | p = 0.14767 | p = 0.07354 | p = 0.105638 | ||
| n.s. | ||||||||
| Constriction stability, % | 3.4 ± 0.6 | 3.9 ± 0.7 | 3.2 ± 0.6 | 3.1 ± 0.4 | 3.1 ± 0.5 | 3.1 ± 0.6 | 2.6 ± 0.4 | 2.4 ± 0.2 |
| U(16,6) = 35 | U(16,12) = 92.5 | U(16,10) = 74 | U(16,14) = 105 | U(16,11) = 85 | U(16,12) = 82 | U(16,8) = 50 | ||
| p = 0.366773 | p = 0.873052 | p = 0.775995 | p = 0.790107 | p = 0.903538 | p = 0.536889 | p = 0.41665 | ||
| n.s. | ||||||||
Ctrl, Control; Indo, indomethacin; SC 560, COX-1 inhibitor; NS 398, COX-2 inhibitor; AH 6809, EP1/2 receptor antagonist; L 161-982, EP4 receptor antagonist; CAY 10441, IP receptor antagonist; TTX, tetrodotoxin; n, number of diving arterioles. Values are mean ± SEM Mann–Whitney U test and corresponding exact p values. n.s., not statistically significant from control condition with Bonferroni correction for multiple comparisons.
Movie 1.
NMDA induced vasodilation. Diving cortical arteriole visualized in a slice by IR-DGC was preconstricted with U46619 (50 nm, 310–6000 s). Bath application of 30 μm NMDA (3910–4200 s) reversibly dilated blood vessel. For more details, see Figure 1.
Figure 1.

Characterization of NMDA-induced vasodilations. A, Diameter changes induced by 5 min bath applications of NMDA (30 μm; black bar and vertical gray zone). The SEM envelopes the mean traces. The horizontal dashed lines represent the initial diameters. The vertical scale bar indicates the relative diameter changes. Under control conditions (Ctrl, black, n = 16 arterioles from 12 rats) NMDA induces vasodilations. Nonselective COX-1/2 inhibition by indomethacin (Indo; magenta, n = 6 arterioles from 3 rats) dramatically reduced the vascular responses. COX-1 inhibition by SC 560 (purple, n = 12 arterioles from 9 rats) did not alter the vascular response in contrast to the selective inhibition of COX-2 by NS 398 (red, n = 10 arterioles from 8 rats). Antagonism of EP2, EP4, and IP receptors respectively by AH 6809 (orange, n = 14 arterioles from 13 rats), L 161–982 (green, n = 11 arterioles from 6 rats) and CAY 10441 (blue, n = 12 arterioles from 7 rats) reduced the vascular responses. Blockade of action potentials by TTX (brown, n = 8 arterioles from 3 rats) dramatically reduced the vascular responses. B, Representative example showing infrared images of a preconstricted diving arteriole that reversibly dilated to NMDA application. Pial surface is upward. Scale bar, 20 μm. White dashed vertical lines indicate the initial position of the vessel wall. C, D, Effects of COX-1/2 inhibition, EP2, EP4, and IP receptor antagonism, and action potentials blockade on maximal amplitude (C) and magnitude (D) of NMDA-induced vasodilations. Dots represent individual arteriolar responses. Bars and error bars correspond to the mean ± SEM. *, **, and *** statistically different from Ctrl condition with p < 0.05, 0.01 and 0.001, respectively; n.s., not statistically significant.
Analysis of prostaglandins and thromboxane: collection of supernatants and slices.
Four acute slices and a control slice were placed in two wells of a 12-well plate filled with 1 ml of oxygenated aCSF containing 50 nm U46619 and a mixture of O2/CO2 (95%/5%) was continuously delivered. After an equilibration period of 30 min, 100 μl of supernatant were collected and rapidly frozen in dry ice (t = −30 min). One-hundred microliters of SC 560, NS 398 or their vehicle (DMSO 0.02%) were then added to the medium. After 30 min of incubation 100 μl of supernatant were collected, rapidly frozen in dry ice (t = 0 min), and replaced by a solution supplemented with NMDA or its vehicle (water). After 2 and 5 min of incubation 100 and ∼900 μl were, respectively, collected, frozen, and replaced by 1 ml of aCSF containing COX-inhibitor or its vehicle but lacking NMDA. One-hundred microliters of supernatant were collected 5 min and 15 min after NMDA washout (t = 10 and 20 min, respectively). After 25 min, all of the remaining supernatant (i.e., ∼800 μl) was collected and frozen as well as the four slices. Viability of slices after treatment was evaluated by ensuring that the control slice displayed numerous healthy-looking cells when observed under IR-DGC illumination.
Analysis of prostaglandins and thromboxane: equipment.
Lipid analysis was performed using LC-ESI-MS/MS. The LC-MS/MS system consisted of a hybrid triple quadrupole-ion trap QTrap 5500 mass spectrometer (AB Sciex) equipped with a Turbo-V-source operating in negative ESI mode, an Agilent 1200 binary HPLC pump, column oven (40°C) and degasser (Agilent) and an HTC Pal autosampler (Chromtech) with a cooling stack which kept the samples at 4°C. High-purity nitrogen for the mass spectrometer was produced by a NGM 22-LC/MS nitrogen generator (Cmc Instruments).
Analysis of prostaglandins and thromboxane: extraction and mass spectrometry.
Analysis of prostaglandin content was performed as previously described (Schmitz et al., 2014). The homogenized tissue pieces and the slice supernatants were extracted by two rounds of liquid-liquid extraction with ethylacetate (600 μl). The samples were spiked before extraction with the internal standard mixture, 100 μl of 0.15 m EDTA and 10 μl BHT (2 mg/ml in methanol) to prevent oxidation of analytes. After vortexing and centrifugation for 3 min at 17,000 × g, the organic fractions were combined and evaporated at a temperature of 45°C under a gentle stream of nitrogen.
LC-MS/MS conditions.
For the chromatographic separation a Synergi Hydro-RP column and precolumn were used (150 × 2 mm I.D., 4 μm particle size and 80 Å pore size from Phenomenex). A linear gradient was used at a flow rate of 300 μl/min. The mobile phase A was water/formic acid (100:0.0025, v/v, pH 4.0) and mobile phase B acetonitrile/formic acid (100:0.0025, v/v). The sample solvent was acetonitrile/water/formic acid (20:80:0.0025, v/v, pH 4.0). The total run time was 16 min and injection volume 45 μl. Retention times of 6-keto-PgF1α, TXB2, PgF2α, PgE2, and PgD2 were 7.4, 8.0, 8.2, 8.7, and 9.2 min, respectively.
The mass spectrometer was operated in the negative ion mode with an electrospray voltage of −4500 V at 450°C. Multiple reaction monitoring was used for quantification. The mass transitions used are m/z 351.1 →m/z 315.0 for PgE2 and PgD2, m/z 353.1 →m/z 309.2 for PgF2α, m/z 369.1 →m/z 163.0 for 6-keto-PgF1α, m/z 369.1 →m/z 169.1 for TXB2, m/z 355.1 →m/z 275.1 for [2H4]-PgE2 and [2H4]-PgD2, m/z 357.1 →m/z 313.2 for [2H4]-PgF2α, m/z 373.2 →m/z 167.1 for [2H4]-6-keto-PgF1α and m/z 373.1 →m/z 173.1 for [2H4]-TXB2 all with a dwell time of 50 ms. All quadrupoles were working at unit resolution.
Quantification.
Concentrations of the calibration standards, quality controls, and unknowns were evaluated by Analyst software (v1.5; B Sciex). Ratios of peak areas of the lipid and the respective internal standard (y-axis) were plotted against concentration (x-axis) and calibration curves for each lipid were calculated by least-square regression analysis with 1/concentration2 weighting. Variations in accuracy and intraday and interday precision (n = 6 for each concentration, respectively) were <15% over the respective ranges of calibration (0.02–250 ng/ml for PgE2, PgD2 and 6keto-PgF1α; 0.075–250 for TXB2 and 0.08–1000 for PgF2α).
Astrocytes vital staining.
Slices were vitally stained by a 20 min superfusion of aCSF containing 1 μm sulforhodamine 101 (SR101, Sigma-Aldrich) or 2 μm TexasRed hydrazide (TxRed; Invitrogen) and rinsed for at least 10 min (Lecrux et al., 2011). SR101 and TxRed were excited at 535 nm with a LED (CoolLED, Precise Excite) and red fluorescence was collected using a Triple-beamsplitter 395/495/610 (FF395/495/610-Di01-25x36, Semrock) and a Tripleband emission filter 425/527/685 (FF01-425/527/685-25, Semrock). IR-DGC and fluorescent Images were captured with a digital CCD camera (CoolSnap HQ2) and Imaging Workbench 6.0.25 software.
Whole-cell recordings.
Patch pipettes (5.5 ± 0.1 MΩ) pulled from borosilicate glass were filled with 8 μl of RNase free internal solution containing the following in (mm): 144 K-gluconate, 3 MgCl2, 0.5 EGTA, 10 HEPES, pH 7.2 (285/295 mOsm). Whole-cell recordings were performed at 27.0 ± 0.5°C using a patch-clamp amplifier (Axopatch 200B, MDS). Data were filtered at 5–10 kHz and digitized at 50 kHz using an acquisition board (Digidata 1440, MDS) attached to a personal computer running pCLAMP 10.2 software package (MDS).
Electrophysiological properties were determined in voltage-clamp mode for astrocytes (Houades et al., 2008; Lecrux et al., 2011) and current-clamp mode for neurons (Karagiannis et al., 2009). Membrane potential values were not corrected for liquid junction potential. Input resistance of astrocytes was determined by plotting a voltage/current curve of the current response at steady state. This resistance was corrected for series resistance determined by plotting a voltage/current curve of the capacitive transients (Houades et al., 2008). Resting membrane potential of astrocytes was determined by calculating the intercept of the voltage/current curve with the 0 pA value. Resting membrane potential of neurons was measured just after passing in whole-cell configuration. Only neurons with a resting membrane potential more negative than −51 mV were analyzed further. Thirty-two electrophysiological properties chosen to describe the electrophysiological diversity of cortical neurons (Ascoli et al., 2008) were determined as previously described (Karagiannis et al., 2009) using custom analysis software developed in MATLAB (MathWorks).
Morphological analysis of IR-DGC images.
Arteriole wall thickness was measured manually using Image-Pro Analyzer 7.0.0.951 software (Media Cybernetics). Somatic features were measured from IR-DGC images of the recorded cells as previously described (Karagiannis et al., 2009). Briefly, the soma was manually delineated using Image-Pro Analyzer 7.0.0.951 software. Then, the length of major and minor axes, the perimeter, and the area were extracted. The soma elongation was calculated as the ratio between major and minor axes. Roundness was calculated according to:
 |
A value close to 1 is indicative of round somata. Somata with no obvious process and displaying a roundness value lower than 1.5 was considered as round. Cells with a soma exhibiting two processes in opposite direction were defined as fusiform if their elongation was >2 (Cauli et al., 2000). If it was <2, cells were considered as ovoid. Cells whose soma had >2 processes were defined as irregular.
Cytoplasm harvest and scRT-PCR.
At the end of the whole-cell recording lasting <20 min, the cytoplasmic content was aspirated in the recording pipette. The pipette's content was expelled into a test tube and RT was performed in a final volume of 10 μl, as described previously (Lambolez et al., 1992). Two scRT-PCR protocols were designed to probe simultaneously for the expression of prostaglandin synthesizing enzymes and well established markers of cortical astrocytes (Houades et al., 2008) or neurons (Ascoli et al., 2008; Karagiannis et al., 2009). Prostaglandin-synthesizing enzymes included COX-1 and COX-2, the terminal PgE2 synthases (PGES); mPGES1, mPGES2, and cPGES, and PgI2 synthase (PGIS). Astrocytes markers included S100β and glial fibrillary acidic protein (GFAP). Neuronal markers included the vesicular glutamate transporter, vGluT1, the two isoforms of glutamic acid decarboxylase (GAD65 and GAD67), the neuronal isoform of nitric oxide synthase (NOS-1), calbindin (CB), calretinin (CR), parvalbumin (PV), neuropeptide Y (NPY) or vasoactive intestinal polypeptide (VIP), somatostatin (SOM), and cholecystokinin (CCK). Two-steps amplification was performed essentially as described previously (Cauli et al., 1997) using the primer pairs listed in Table 2. Ten microliters of each individual PCR product were run on a 2% agarose gel stained with ethidium bromide using ΦX174 digested by HaeIII as a molecular weight marker.
Table 2.
PCR primers
| Genes accession no. | First PCR primers | Size, bp | Second PCR nested primers | Size, bp |
|---|---|---|---|---|
| GFAP | Sense, 454: AAGCTCCAAGATGAAACCAACCT | 631 | Sense, 509 ACAGACAGGAGGCGGATGAA | 263 |
| NM_017009 | (Lambolez et al., 1992) | (Lecrux et al., 2011) | ||
| Antisense, 1066: CGATCTCGATGTCCAGGGC | Antisense, 749 GGACCGATACCACTCTTCTGTTT | |||
| (Lambolez et al., 1992) | (Lecrux et al., 2011) | |||
| S100β | Sense, 45: CCATCAGTATTCAGGGAGAGAGGG | 166 | Sense, 58: GGGAGAGAGGGTGACAAGCA | 132 |
| NM_013191.1 | (Lecrux et al., 2011) | (Lecrux et al., 2011) | ||
| Antisense, 191: GTCACACTCCCCATCCCCAT | Antisense, 170: TTCGTCCAGCGTCTCCATCA | |||
| (Lecrux et al., 2011) | (Lecrux et al., 2011) | |||
| vGluT1 | Sense, 361: GGCTCCTTTTTCTGGGGGTAC | 259 | Sense, 373: TGGGGGTACATTGTCACTCAGA | 201 |
| NM_053859.1 | (Gallopin et al., 2006) | (Gallopin et al., 2006) | ||
| Antisense, 600: CCAGCCGACTCCGTTCTAAG | Antisense, 553:ATGGCAAGCAGGGTATGTGAC | |||
| (Gallopin et al., 2006) | (Gallopin et al., 2006) | |||
| GAD65 | Sense, 713: TCTTTTCTCCTGGTGGTGCC | 391 | Sense, 743: TGTACGCCATGCTCATTGCC | 312 |
| NM_012563.1 | (Bochet et al., 1994) | (Gallopin et al., 2006) | ||
| Antisense, 1085: CCCCAAGCAGCATCCACAT | Antisense, 1032: CAGCTACAGCCAAGAGAGGATCA | |||
| (Bochet et al., 1994) | (Gallopin et al., 2006) | |||
| GAD67 | Sense, 529: TACGGGGTTCGCACAGGTC | 599 | Sense, 581: TGGATATCATTGGTTTAGCTGGC | 508 |
| NM_017007.1 | (Cauli et al., 1997) | (Gallopin et al., 2006) | ||
| Antisense, 1109: CCCCAAGCAGCATCCACAT | Antisense, 1065: TCACATATGTCTGCAATCTCCTGG | |||
| (Cauli et al., 1997) | (Gallopin et al., 2006) | |||
| NOS-1 | Sense, 2816: AACTGGGAGGGGAGAGGATTC | 548 | Sense, 2829: GAGGATTCTGAAGATGAGGGAGG | 517 |
| NM_052799.1 | (Cauli et al., 2004) | Antisense, 3323: CCTTCCAATTACTGATGACACCC | ||
| Antisense, 3323: GGGTGGGAGGCGAGATTCAT | ||||
| (Cauli et al., 2004) | ||||
| CB | Sense, 134: AGGCACGAAAGAAGGCTGGAT | 432 | Sense, 166: CCTGAGATGAAAACCTTTGTGG | 249 |
| NM_031984.2 | (Cauli et al., 1997) | (Gallopin et al., 2006) | ||
| Antisense, 544: TCCCACACATTTTGATTCCCTG | Antisense, 392: CACGGTCTTGTTTGCTTTCTCTA | |||
| (Cauli et al., 1997) | (Gallopin et al., 2006) | |||
| PV | Sense, 115: AAGAGTGCGGATGATGTGAAGA | 388 | Sense, 151: CTGGACAAAGACAAAAGTGGCT | 244 |
| NM_022499.2 | (Cauli et al., 1997) | (Gallopin et al., 2006) | ||
| Antisense, 480: TTGTTTCTCCAGCATTTTCCAG | Antisense,376: AGAAGGGCTGAGATGGGGC | |||
| (Cauli et al., 1997) | (Gallopin et al., 2006) | |||
| CR | Sense, 142: CTGGAGAAGGCAAGGAAAGGT | 309 | Sense, 157: AAAGGTTCTGGCATGATGTCC | 265 |
| NM_053988.1 | (Cauli et al., 1997) | (Gallopin et al., 2006) | ||
| Antisense, 429: AGGTTCATCATAGGGACGGTTG | Antisense, 401: TCAGGAGGTCGGACAGAAATC | |||
| (Cauli et al., 1997) | (Gallopin et al., 2006) | |||
| NPY | Sense, −45: GCCCAGAGCAGAGCACCC | 359 | Sense, −21: CAGAGACCACAGCCCGCC | 302 |
| NM_012614.1 | (Cauli et al., 1997) | (Gallopin et al., 2006) | ||
| Antisense, 292: CAAGTTTCATTTCCCATCACCA | Antisense, 261: CTTCAAGCCTTGTTCTGGGG | |||
| (Cauli et al., 1997) | (Gallopin et al., 2006) | |||
| VIP | Sense, 189: TGCCTTAGCGGAGAATGACA | 287 | Sense, 208: ACGCCCTATTATGATGTGTCCAG | 214 |
| NM_053991.1 | (Cauli et al., 1997) | (Gallopin et al., 2006) | ||
| Antisense, 456: CCTCACTGCTCCTCTTCCCA | Antisense, 402: TTTGCTTTCTAAGGCGGGTG | |||
| (Cauli et al., 1997) | (Gallopin et al., 2006) | |||
| SOM | Sense, 43: ATCGTCCTGGCTTTGGGC | 208 | Sense, 75: GCCCTCGGACCCCAGACT | 150 |
| NM_012659.1 | (Cauli et al., 1997) | (Gallopin et al., 2006) | ||
| Antisense, 231: GCCTCATCTCGTCCTGCTCA | Antisense, 207: TGGGGCAAATCCTCAGGC | |||
| (Cauli et al., 1997) | (Gallopin et al., 2006) | |||
| CCK | Sense, 177: CGCACTGCTAGCCCGATACA | 216 | Sense, 192: ATACATCCAGCAGGTCCGCA | 151 |
| NM_012829.1 | (Cauli et al., 1997) | (Gallopin et al., 2006) | ||
| Antisense, 373: TTTCTCATTCCGCCTCCTCC | Antisense, 320: TGGGTATTCGTAGTCCTCAGCAC | |||
| (Cauli et al., 1997) | (Gallopin et al., 2006) | |||
| COX-1 | Sense, 27: GTTTCCCCTGCTGCTGCTC | 359 | Sense, 137: AGGGTGTCTGTGTCCGCTTC | 185 |
| NM_017043.1 | (Lecrux et al., 2011) | (Lecrux et al., 2011) | ||
| Antisense, 366: GGCTGGGGATAAGGTTGGAC | Antisense, 301: GGCATTCACAAACTCCCAGAT | |||
| (Lecrux et al., 2011) | (Lecrux et al., 2011) | |||
| COX-2 | Sense, 199: CTGAAGCCCACCCCAAACAC | 247 | Sense, 202: AAGCCCACCCCAAACACAGT | 206 |
| NM_017232.2 | (Lecrux et al., 2011) | (Lecrux et al., 2011) | ||
| Antisense, 426: TGGGAGTTGGGCAGTCATCA | Antisense, 384: CTGGTGTAGTAGGAGAGGTTGGAG | |||
| (Lecrux et al., 2011) | (Lecrux et al., 2011) | |||
| mPGES1 | Sense, 9: CCTGGGTTTGGTGATGGAGAA | 362 | Sense, 36: GGTGCTCCCCGCCTTTCT | 290 |
| NM_021583.2 | Antisense, 350: GGTTCATTTTGCCCAGGTAGG | Antisense, 303: TGAGGACCACGAGGAAATGTATC | ||
| mPGES2 | Sense, 358: GACTTCCACTCCCTGCCCT | 348 | Sense, 381: GGTGGTAGAGGTGAATCCCG | 291 |
| NM_001107832.1 | Antisense, 686: CTGCCGCCACTTCATCTCCT | Antisense, 652: TTTCCGCCATACATCTGCTG | ||
| cPGES | Sense, −18: GCCCTCTGCCCCGTTCAC | 305 | Sense, 26: ACGACCGAAGGGACTATGTATT | 187 |
| NM_001130989.1 | Antisense, 266: GCTTTGCCCTTTCCTTTGTTA | Antisense, 191: CTGTCCGTTCTTTTATGCTTGG | ||
| PGIS | Sense, 1142: GTGACCGCCTTCTCCTCTTTC | 240 | Sense, 1174: CCCCAGAAGGACCCAGAAATC | 190 |
| NM_031557.2 | Antisense, 1361: TCAGCAGCAGGACCACAAACT | Antisense, 1342: ACTGTTTGATGCTGTTGATGGC |
Note: Position 1, first base of the start codon.
Double-fluorescence labeling.
Rats were deeply anesthetized with sodium pentobarbital (50 mg/kg, i.p.) and their brain were perfusion-fixed (500 ml of ice-cold 4% paraformaldehyde (PFA), in 0.1 m phosphate buffer, pH 7.4), and postfixed by immersion in 4% PFA (2 h, 4°C). Brains were then cut in 50-μm-thick coronal sections with a HM 650V vibratome (Microm). Sections from three to four different rat brains were simultaneously incubated overnight with the primary antibodies against COX-2 and specific markers. Antibodies included goat anti-COX-2 (1:2000; sc-1747, Santa Cruz Biotechnology; Damm et al., 2011), rabbit anti-ionized calcium-binding adapter molecule 1 (Iba-1, 1:1000, no. 019-19741, Wako Pure Chemical Industries; Lloyd-Burton and Roskams, 2012), rabbit anti-S100β (1:2000, no. 37, Swant; Horky et al., 2006), rabbit anti-Satb2 (1:1000, ab34735, Abcam; S. Lee et al., 2010). The respective immunoreactions were visualized with the following secondary antibodies: donkey-anti goat AlexaFluor 555 (1:400, A21432, Invitrogen), donkey-anti mouse AlexaFluor 488 (1:400, A21202, Invitrogen), and donkey-anti rabbit AlexaFluor 488 (1:400, A21206, Invitrogen). The vascular bed was labeled with biotinylated lycopersicon esculentum agglutinin (LEA; 10 μg/ml, B-1175, Vector Laboratories; Mazzetti et al., 2004) and revealed with AlexaFluor 488 streptavidin (1:400, S-11223, Invitrogen). Sections were mounted with Vectashield (Vector Laboratories) on gelatin-coated slides for visualization. Images of immunostained material were acquired using a TCS SP5 confocal microscope with a 20× objective (20× HC Plan APO IMM COR CS NA 0.7/Oil) and LAS AF software (Leica Microsystems). Cell counting and image processing were performed using Image Pro Plus 4.1.0.0 and Image Pro Analyzer 7.0.0.951 (MediaCybernetics) respectively.
NVC to whisker stimulation using laser Doppler flowmetry (LDF).
Rats were anesthetized (urethane, 1 g/ml, i.p.), cannulated in the femoral artery for blood gas and blood pressure measurements, and placed in a stereotaxic frame (David Kopf Instruments). Body temperature was maintained at 37°C using a rectal probe connected to a homeothermic blanket (Harvard apparatus). The posterior atlanto-occipital membrane was exposed for intracisternal injection (3 μl, 1 μl/min) of vehicle and drugs using a 30 G needle connected to a 10 μl Hamilton syringe driven by a Harvard infusion pump, as previously described (Lecrux et al., 2011). All drugs effects were measured on whisker stimulation at 20 min after intracisternal injection. CAY 10441 and its vehicle slightly, but significantly, affected baseline blood flow. Left whiskers were trimmed, attached to a glass capillary connected to a Piezo actuator (Piezo Systems) placed in a Faraday cage and driven by an isolated pulse stimulator (8 Hz, A-M Systems, Model 2100) controlled by PowerLab (AD Instruments). Seven stimulation blocks (40 s baseline, 20 s stimulation) were given for each condition (control, vehicle, and drug) with only one drug being tested in each rat. The skull over the right barrel cortex was thinned to translucency for positioning of the laser-Doppler probe (wavelength: 785 nm, 0.58 mm diameter, 0.5 mm transmit/receive spacing, Transonic Systems). Following placement of the laser Doppler probe over the most responsive region of the barrel cortex, a tungsten microelectrode (FHC) was inserted using stereotaxic manipulators with an angle (40°) in the cortical depth (1 mm) as close as possible (±1.5 mm) of the LDF probe for simultaneous local field potential (LFP) recordings and another microelectrode was positioned symmetrically in the corresponding ipsilateral barrel cortex. Recordings of LFPs were performed through a 2-channel amplifier (A-M Systems, model 1800), a reference screw being placed on the dura over the frontal cortex. Electrophysiological data were filtered (10–500 Hz), amplified and acquired at 10 kHz through a PowerLab (AD Instruments) and analyzed using script written in MATLAB (MathWorks). LDF data were extracted for every second using LabChart software (AD instruments), and whisker-evoked cerebral blood flow (CBF) changes over baseline for the seven stimulation blocks were averaged. LFPs on the contralateral and corresponding ipsilateral barrel cortex were averaged every 125 ms for each 20 s stimulation, and the LFP amplitude, defined as the difference between the maximal and minimal values, was averaged over the repeated blocks and normalized from control condition.
Laser-speckle contrast imaging and optogenetic stimulation.
Mice were anesthetized with 5% isoflurane in air, and then reduced to 1–1.5% during surgery. Body temperature was maintained at 37 ± 0.5°C by a heating pad which had its intensity controlled by temperature feedback from a rectal probe. The mouse was secured in a custom-made head hold using cyanoacrylate and dental cement and a craniotomy was made over the right forelimb sensorimotor cortex. The dura was left intact. Agarose dissolved in HEPES buffered aCSF, pH 7.3, to 1.5% was placed over the surface of the cortex at 37°C. The surface of the cortex was then covered with a no.1 130, 160 μm thick glass coverslip. Before imaging, the brain was warmed to ∼37°C by pumping warm water through tubing attached to the custom built stainless steel head hold (Xie et al., 2013). During stimulation procedures anesthesia was switched to a ketamine/xylazine combination (100/10 mg/kg) that was supplemented as required.
The surface of the cortex was illuminated with a 784 nm 32 mW StockerYale SNF-XXX_885 s-35 laser (Stocker and Yale) with a beam expander directed at the cortex at a 30° angle. Light intensity was controlled with a polarizer. The flow of blood cells and resultant blurring in the interference patterns (Briers, 2001) was detected by a CCD camera (Dalsa 1M60). Image acquisition was performed using EPIX XCAP software (v2.2). Ten trials for each stimulation parameter consisting of 100–130 frames were acquired at 10 Hz with a 10 ms exposure time. Using MATLAB (MathWorks) each 1024 × 1024 pixel image in the stack was variance filtered spatially with a kernel size of 3 pixels. Blood flow measurements were estimated as the inverse square of speckle contrast values which were scaled between minimum and maximum flow rate (Cheng and Duong, 2007). Minimum flow was determined from contrast values measured from the mouse cortex after the animal was killed. For stimulation a 473 nm laser beam (Crystalaser, collimated to ∼100 μm diameter, 5 ms pulses, 3.3 mW, 100 Hz, 1 s) was targeted to forelimb sensorimotor cortex (Scott and Murphy, 2012). Light from the 473 nm laser was blocked from contaminating the speckle signal as detected by the camera by a 715 nm long-pass filter. Regions of interest selected for assessment of speckle contrast over time were 1 mm2 and centered at the site where the laser was targeted over the cortex.
After baseline assessment of light-evoked hemodynamic responses the agarose was removed from the cortical surface and NS 398 was administrated directly on the cortex for 30 min. Agarose was then reapplied to the cortex (37°C), covered with a coverslip, and laser speckle contrast imaging ensued. The magnitude of CBF change was defined as the integral of CBF changes measured from the onset of stimulation to the end of the recording.
Drugs.
U46619, NMDA, SC 560, NS 398, AH 6809; and L 161-982 were purchased from Enzo Life Sciences, CAY 10441 from Cayman chemical, Indomethacin from Sigma-Aldrich and TTX from Latoxan.
Statistical analyses.
Statistical analyses were performed with Prism4 (GraphPad Software) or Statistica 6 (Statsoft). All values are expressed as mean ± SEM. Normality of distributions and equality of variances were assessed using the Shapiro–Wilk test and the F test, respectively. Parametric tests were only used if these criteria were met. Bonferroni correction was used for multiple comparisons. Statistical significance on all figures uses the following convention: *p < 0.05, **p < 0.01, ***p < 0.001.
Statistical significance of vascular responses, morphological and electrophysiological properties, and light-induced CBF responses between Thy1-YFP and Emx1-Cre;Ai32 mice was determined using the Mann–Withney U test. Comparison of the occurrence of expressed genes between different cell types was determined using Fisher's exact test. Statistical significance of light-induced CBF responses before and after NS 398 application was determined using a paired t test. Drug effects on CBF (at the maximum dose and time efficacy determined in preliminary experiments), LFP, blood gases, blood pressure measurements, and prostaglandin analysis were compared by repeated-measures ANOVA, followed by a post hoc Newman–Keuls test between each condition. When normality of distribution was not met, the Friedman test was used.
Results
COX-2-derived prostaglandins mediate NMDA-induced vasodilations
To identify the prostaglandins involved in NVC, we focused on NMDA receptors for the following reasons: (1) their activation promotes in vivo the release of the vasodilatory PgE2 and PgI2 (Lazarewicz and Salińska, 1995; Pepicelli et al., 2005). (2) Similar to COX-2, their activity accounts for approximately one-half of the NVC responses to various sensory stimuli (Niwa et al., 2000; Norup and Lauritzen, 2001; Bakalova et al., 2002; Gsell et al., 2006; Stefanovic et al., 2006; Lecrux et al., 2011). (3) NMDA receptors blockade occludes the reduction of the NVC responses induced by COX-2 inhibition (Lecrux et al., 2011), suggesting that most of the NVC response evoked by NMDA receptors is due to the release and action of vasodilatory prostaglandins. Finally, (4) NMDA has been shown to dilate cortical arterioles in acute cortical slices (Fergus and Lee, 1997; Lovick et al., 1999).
Because the brain slice preparation offers a well controlled extracellular environment suitable for pharmacological manipulations (Iadecola and Nedergaard, 2007) and prostaglandin measurement (Gordon et al., 2008), we first sought to determine whether vasodilatory prostaglandins could mediate the NMDA-induced vasodilations in young rats. We chose this approach as a good compromise for preservation of slice quality, easily achieved in young animals and essential to preserve neurovascular physiology, and a phenotype of the neuro-glio-vascular unit close to adulthood (Mishra et al., 2014). Indeed, COX-2 expression (Yamagata et al., 1993; Kaufmann et al., 1996; Tocco et al., 1997), astrocyte phenotype (Stichel et al., 1991; Zhou et al., 2006; Houades et al., 2008) and vascular patterns (Harb et al., 2013; Whiteus et al., 2013; Lacoste et al., 2014) maturate during the end of the third postnatal week.
We used 30 μm NMDA, a submaximal concentration eliciting large vasodilations (Fergus and Lee, 1997) compatible with their pharmacological investigations (Mishra et al., 2014). Bath application of NMDA, dilated preconstricted cortical arterioles (maximal dilation 84.7 ± 11.9%, magnitude 47.7 ± 7.6 103 % · s; Fig. 1; Table 1; Movie 1). In a majority of arterioles (n = 10 of 16), NMDA did not fully bring back luminal diameters to their preconstriction value (83.2 ± 3.5%). However in some cases (n = 6 of 16) it further dilated arterioles by 12.0 ± 3.5%.
To evaluate whether the biosynthesis of vasodilatory prostaglandins was involved, slices were pretreated with the nonselective COXs inhibitor indomethacin at 5 μm (Table 3). This treatment abolished almost completely the NMDA responses (maximal dilation: 25.0 ± 5.0%, p = 0.002412, U(16,6) = 9, Mann–Whitney U test; magnitude: 2.9 ± 5.0 103 % · s, p = 0.000804, U(16,6) = 6, Mann–Whitney U test; Fig. 1) indicating that vasodilatory prostaglandins are recruited during NMDA-induced vasodilations. We next determined the relative contribution of COX-1 and COX-2 to these responses. Selective COX-1 inhibition with SC 560 (100 nm; Table 3) did not alter the maximal amplitude (83.5 ± 14.7%, p = 0.766584, U(16,12) = 89, Mann–Whitney U test) or the magnitude of the vasodilations (50.2 ± 11.9 103 % · s, p = 0.873052, U(16,12) = 92, Mann–Whitney U test; Fig. 1). However, during the 5 min of NMDA application the peak of vasodilation was lower in the presence of SC 560 (17.0 ± 4.9%) than in control condition (38.2 ± 8.4%, p = 0.000204, U(16,12) = 16, Mann–Whitney U test; Fig. 1A), suggesting that COX-1-derived prostaglandins may participate in the initial phase of the NVC response.
Table 3.
In vitro IC50 and concentrations of various COX inhibitors and prostaglandin receptor antagonists used for inhibition in tissue
| Inhibitor/antagonist | In vitro IC50 (or Ki) | Concentrations used for inhibition in brain tissue |
||
|---|---|---|---|---|
| Preparation | Concentration | |||
| Indomethacin | COX-1: 22 nm | COX-2: 87 nm | Brain slices | 5 μm |
| (Lora et al., 1998) | (Zonta et al., 2003) | |||
| SC 560 | COX-1: 9 nm | COX-2: 6.3 μm | Brain slices | 100 nm |
| (Smith et al., 1998) | (Blanco et al., 2008) | |||
| NS 398 | COX-1: 50 μm | COX-2: 0.6 μm | Brain slices | 10 μm |
| (Lora et al., 1998) | (Slanina and Schweitzer, 2005) | |||
| AH 6809 | EP1: 1.3 μm (Ki) | EP2: 0.5 μm (Ki) | Isolated cerebrovascular arterioles | 10 μm |
| (Boie et al., 1997) | (Myren et al., 2010; Dabertrand et al., 2013) | |||
| L 161-982 | EP4: 100 nm | Brain slices | 1 μm | |
| (Machwate et al., 2001) | (Hall et al., 2014) | |||
| CAY 10441 | IP: 7 nm | Not available | ||
| (Bley et al., 2006) | ||||
In contrast with SC 560, and similarly to indomethacin, selective COX-2 inhibition with NS 398 (10 μm; Table 3) dramatically reduced the maximal amplitude (29.3 ± 5.3%, p = 0.000555, U(16,10) = 18, Mann–Whitney U test; Fig. 1) and magnitude of the response (10.1 ± 3.8 103 % · s, p = 0.000910, U(16,10) = 20, Mann–Whitney U test; Fig. 1). NS 398 strongly diminished the maximal response during the 5 min of NMDA application (14.1 ± 4.1%, p = 0.000025, U(16,10) = 0, Mann–Whitney U test; Fig. 1A). Similarly to the in vivo context (Niwa et al., 2000, 2001; Bakalova et al., 2002; Stefanovic et al., 2006; Lecrux et al., 2011) our observations demonstrate a prominent role of COX-2 metabolites in NVC validating therefore this ex vivo approach. We also report that the initial phase of the NVC response to NMDA is sensitive to SC 560 and NS 398.
To identify the nature of the dilatory prostaglandins involved, we antagonized the vasodilatory PgE2 and PgI2 receptors. Since there is no commercially available selective EP2 antagonist, we used the EP2/EP1 antagonist AH 6809 (10 μm; Table 3). AH 6809 strongly reduced the maximal amplitude (35.8 ± 7.2%, p = 0.002069, U(16,14) = 40, Mann–Whitney U test; Fig. 1) and the magnitude of NMDA-induced vasodilations (16.7 ± 4.9 103% · s, p = 0.003321, U(16,14) = 43, Mann–Whitney U test; Fig. 1). We next thought to block EP4 receptors with its selective antagonist L 161-982 (1 μm; Table 3). L 161-982 significantly impaired the maximal amplitude (43.8 ± 11.9%, p = 0.019827, U(16,11) = 41, Mann–Whitney U test; Fig. 1) but not the magnitude of vasodilations (23.0 ± 7.8% 103% · s, p = 0.026246, U(16,11) = 43, Mann–Whitney U test; Fig. 1). Blockade of IP receptor was achieved with CAY 10441 (200 nm; Table 3). CAY 10441 reduced the maximal amplitude (36.3 ± 5.2%, p = 0.000670, U(16,12) = 26, Mann–Whitney U test; Fig. 1) and the magnitude of vasodilations (18.5 ± 4.6 103 % · s, p = 0.003711, U(16,12) = 35, Mann–Whitney U test; Fig. 1). The reduction of NMDA-induced vasodilations by EP2, EP4, and IP receptor antagonists and during COX-2 or COX-1 inhibition suggests that PgE2 and PgI2 essentially derived from COX-2 activity underlie these vascular responses.
NMDA promotes the biosynthesis and release of PgE2 and PgI2 in cortical slices
To confirm that PgE2 and PgI2 are indeed produced and released by NMDA applications we sought to measure the content in PgE2 and 6-keto prostaglandin F1α (6-keto PgF1α), the stable metabolite of PgI2, produced in slices before, during and after NMDA application in presence or absence of COX inhibitors (Fig. 2). Prostaglandins and thromboxane were measured by LC-ESI-MS/MS which permits an unambiguous identification of prostaglandins (Schmidt et al., 2005, 2014). Because the amount of PgE2 that can be released by slices is very low (Gordon et al., 2008), four slices were coincubated each time. Prostaglandin analysis was performed in the supernatant at different time points and in the tissue at the end of the treatments (Fig. 2).
Figure 2.

Vasodilatory prostaglandins release dynamics induced by NMDA. Dynamics of PgE2 (A) and 6-keto PgF1α (B) levels in the supernatants (left) and in the slices after treatments (right). Samples were collected before adding COX inhibitors (t = −30), before (t = 0 min) and during (t = 2 and 5 min) NMDA (30 μm; black bar and vertical gray zone), and after removing NMDA (t = 10, 20 and 30 min). PgE2 (A) and to a lesser extent and 6-keto PgF1α (B) levels increased during NMDA application (NMDA, black traces) but not after NMDA removal. No change was observed when applying NMDA vehicle (water, Ctrl, gray traces) or when NMDA was applied in presence of NS 398 (red traces) or SC 560 (purple traces). Tissue content (right) in PgE2 (A) and 6-keto PgF1α (B) were elevated when slices were treated with NMDA in absence of COX inhibitor. Numbers in parenthesis represent the number of replicates. Error bars are SEM.
The temporal profile of PgE2 content (Fig. 2A) was significantly altered when slices were treated by NMDA (p = 0.00514, Q(7,3) = 20.21, Firedman test), but not when NMDA was omitted (p = 0.09697, Q(7,3) = 12.11, Firedman test) or when NMDA was applied in presence of NS 398 (p = 0.19886, Q(7,3) = 9.82, Firedman test) or SC 560 (p = 0.19417, Q(7,2) = 9,90, Firedman test). Similarly to PgE2, the temporal profile of 6-keto PgF1α (Fig. 2B) was modified by NMDA treatment (p = 0.03266, Q(7,3) = 15.27 with NMDA and p = 0.24846, Q(7,3) = 9,06 without NMDA, Firedman tests) but not in presence of NS 398 (p = 0.34416, Q(7,3) = 7.87, Firedman test) or SC 560 (p = 0.49799, Q(7,2) = 6,36, Firedman test).
PgE2 content in the supernatant reached a maximum of 54 ± 28 pg/ml) 5 min after the application of NMDA (Fig. 2A) and remained elevated in the tissue after NMDA treatment without COX inhibitor (32 ± 22 pg/4 slices). Although in the supernatant the content in 6-keto PgF1α was often below the lower limit of quantification (see Materials and Methods), during NMDA application a maximal level of 6-keto PgF1 α (9 ± 8 pg/ml) could be reached after 5 min and was reliably quantifiable in the tissue after NMDA treatment without COX inhibitor (23 ± 13 pg/4 slices; Fig. 2B).
Similarly to previous in vivo observations (Lazarewicz and Salińska, 1995; Pepicelli et al., 2005; Anrather et al., 2011), our ex vivo data confirm that NMDA promotes the release of PgE2 and, to a lesser extent, of 6-keto PgF1α, dependent on COX-1 and COX-2 activity, hence supporting the recruitment of the PgE2 and PgI2 vasodilatory receptors in NMDA-induced vasodilations.
The NVC response to sensory stimulation recruits PgE2 vasodilatory receptors
Our ex vivo data have indicated that NMDA-induced vasodilations are mediated by the release of PgE2 and PgI2 chiefly derived form COX-2 activity and activation of EP2, EP4, and IP receptors. Because NVC responses to sensory stimulations also involve NMDA receptors and COX-2 metabolites (Niwa et al., 2000; Norup and Lauritzen, 2001; Bakalova et al., 2002; Gsell et al., 2006; Stefanovic et al., 2006; Lecrux et al., 2011) we sought to determine whether EP2, EP4, and IP receptors were involved in the NVC response to sensory stimulation and in adult animals.
It has been recently estimated that in vivo the majority of the CBF increase in response to sensory stimulation is mediated by capillaries dilation (Hall et al., 2014). We used LDF to obtain a global readout of CBF changes including layer IV of the somatosensory cortex which exhibits the highest neuronal and capillary density (Woolsey et al., 1996; Tsai et al., 2009) and where the NVC response initiates and propagates to upstream diving arterioles (Silva and Koretsky, 2002; Tian et al., 2010; Hall et al., 2014; Filosa et al., 2015). Indeed, with appropriate laser wavelength, fiber diameter and source–detector separation (see Materials and Methods) it has been estimated that LDF samples ∼1 mm3 of tissue at a depth down to 680 μm (Fredriksson et al., 2009). PgE2 and PgI2 receptor antagonists were delivered by a single intracisternal injection. Although this strategy has proven efficient with little or no side effect on physiological parameters (Lecrux et al., 2011, 2012), the precise concentration in the parenchyma is unknown as it is governed by diffusion and largely depends on tissue depth. We therefore tested different antagonist concentrations (Table 4). To avoid unspecific effects of the antagonists or their vehicle (Matsuura et al., 2009) at high concentrations, we did not inject drugs beyond 10−4 M.
Table 4.
In vivo neurovascular coupling response impairment by receptor antagonists
| Antagonist | Concentration | Effect on the peak CBF whisker response | n |
|---|---|---|---|
| AH 6809 | 10−7 m | −5.7 ± 4.5% | 4 |
| 10−6 m | −28.2 ± 2.6% | 5 | |
| 10−5 m | −15.0 ± 3.8% | 6 | |
| 10−4 m | −6.1 ± 3.8% | 5 | |
| L 161-982 | 10−4 m | −17.7 ± 4.8% | 4 |
| CAY 10441 | 10−6 m | +10.2 ± 11.8% | 3 |
| 10−5 m | +10.4 ± 22.1% | 3 | |
| 10−4 m | +0.6 ± 8.7% | 5 |
The EP2/EP1 antagonist AH 6809 was most effective at inhibiting the NVC response when delivered at 1 μm (Table 4). Surprisingly, at higher concentrations the AH 6809-mediated inhibition of the NVC response was lower (Table 4). This dose-dependent effect may be due to the lower affinity of AH 6809 for the EP1 receptor than for the EP2 receptor (Table 3). The combined antagonism of EP1/EP2 receptors obtained at higher doses may have unmasked the vasoconstrictory effect of EP1 receptors (Dabertrand et al., 2013) resulting in an apparent lower inhibition of the NVC response. Consistent with the results in acute slices, AH 6809 (1 μm), reduced the NVC responses to whisker stimulation (p = 0.0069, F(2,10) = 8.54, repeated-measures ANOVA; Fig. 3A,B), without altering the whisker-evoked neuronal activity measured by the amplitude of the LFPs (p = 0.1453, F(2,6) = 2.707, repeated-measures ANOVA; Fig. 3C), blood gases or blood pressure (Table 5). Similarly L 161–982 (100 μm; Table 4) significantly reduced the hemodynamic response (p = 0.0112, F(2,6) = 10.43, repeated-measures ANOVA; Fig. 3A,B) without altering LFPs (p = 0.8856, F(2,6) = 0.1240, repeated-measures ANOVA; Fig. 3C) or physiological parameters (Table 5). In contrast with ex vivo observations, IP receptor blockade with CAY 10441, even when delivered at high concentrations (100 μm; Table 4), had no or virtually no effect on the evoked NVC (p = 0.4560, F(2,8) = 0.87, repeated-measures ANOVA; Fig. 3A,B) and electrophysiological (p = 0.1412, F(2,4) = 3.323, repeated-measures ANOVA; Fig. 3C) responses, or physiological parameters (Table 5). In line with our ex vivo data on vascular reactivity (Fig. 1) and prostaglandin analysis (Fig. 2), these in vivo observations indicate that COX-2-derived PgE2 acting on EP2 and EP4 receptors is the main vasodilatory prostaglandin involved in NVC responses to sensory stimulations.
Figure 3.

Effects of EP2, EP4, and IP receptors blockade on the NVC response to sensory stimulation. A, Whisker stimulation (gray zone, top black bar) induced increases in CBF in the contralateral barrel cortex under control conditions (Ctrl; black lines). The evoked response was not altered by vehicle (gray line), whereas the EP1/EP2 receptor antagonist AH 6809 (orange, n = 6 rats) and EP4 receptor antagonist L 161–982 (green, n = 4 rats), but not the IP receptor antagonist CAY 10441 (blue, n = 5 rats), decreased this response. The SEM envelopes the mean traces. B, C, Maximal whisker-evoked changes in CBF (B) and in LFPs (C), under baseline (CBF: 8.0 ± 1.1%, 10.9 ± 1.3%, and 8.6 ± 1.2%; LFPs: 100.0 ± 16.7%, 100.0 ± 27.0%, and 100.0 ± 20.8%) and vehicle (CBF: 8.7 ± 1.0%, 11.9 ± 1.2% and 9.0 ± 1.5%; LFPs: 122.3 ± 30.8%, 105.0 ± 14.6%, and 115.4 ± 31.3%) conditions and application of AH 6809 (CBF: 5.9 ± 1.3%; LFPs: 126.6 ± 30.8, n = 6 and 4 rats, respectively), L 161–982 (CBF: 8.7 ± 2.1%; LFPs: 101.9 ± 17.0%, n = 4 rats) or CAY 10441 (CBF: 7.9 ± 1.1%; LFPs: 135.0 ± 38.4%, n = 5 and 3 rats, respectively). Whisker stimulation induced increases in the amplitude of the LFPs in the contralateral barrel cortex as shown by the representative tracings (average of 7 trials from 1 rat) for each compound (C, top). Contralateral LFP amplitudes were normalized by the mean amplitude under baseline conditions. *p < 0.05 and **p < 0.01 compared with vehicle conditions, ★p < 0.05 compared with Ctrl conditions, n.s., not statistically significant. Dots represent individual responses. Horizontal bars and error bars represent mean ± SEM.
Table 5.
Physiological parameters in rats during whisker stimulation
| Compound | Condition | MAP, mmHg | HR, beats/min | pH | pCO2, mmHg | pO2, mmHg |
|---|---|---|---|---|---|---|
| AH 6809 | Control | 79.1 ± 5.6 | 382.7 ± 14.4 | 7.44 ± 0.02 | 41.7 ± 0.6 | 90.7 ± 3.2 |
| Vehicle | 78.9 ± 5.8 | 374.6 ± 17.5 | 7.43 ± 0.01 | 42.7 ± 1.6 | 91.3 ± 3.0 | |
| MAP, HR | Drug | 79.2 ± 5.3 | 376.7 ± 20.3 | 7.44 ± 0.01 | 41.3 ± 0.9 | 90.0 ± 3.0 |
| (n = 6 rats) | Q(2,6) = 1.00000 | Q(2,6) = 0.3333333 | Q(2,4) = 1.50000 | F(2,8) = 0.04450 | F(2,8) = 1.027 | |
| pH (n = 4 rats) | p = 0.60653 | p = 0.84648 | p = 0.47237 | p = 0.9074 | p = 0.3974 | |
| pCO2, pO2 | n.s. | n.s. | n.s. | n.s. | n.s. | |
| (n = 5 rats) | ||||||
| L 161-982 | Control | 74.7 ± 4.9 | 398.2 ± 37.3 | 7.42 ± 0.01 | 36.0 ± 4.8 | 101.1 ± 9.7 |
| Vehicle | 74.3 ± 6.5 | 401.9 ± 43.8 | 7.43 ± 0.01 | 38.5 ± 1.6 | 91.4 ± 1.5 | |
| MAP, HR, pH, pO2 | Drug | 73.5 ± 6.8 | 377.5 ± 30.0 | 7.42 ± 0.02 | 36.3 ± 3.8 | 105.6 ± 7.7 |
| (n = 4 rats) | F(2,6) = 0.1294 | F(2,6) = 2.689 | F(2,6) = 0.2572 | F(2,4) = 0.7467 | F(2,6) = 1.621 | |
| pCO2 | p = 0.8037 | p = 0.1930 | p = 0.7263 | p = 0.4786 | p = 0.2923 | |
| (n = 3 rats) | n.s. | n.s. | n.s. | n.s. | n.s. | |
| CAY 10441 | Control | 76.1 ± 5.2 | 384.3 ± 13.0 | 7.42 ± 0.01 | 38.4 ± 2.8 | 96.6 ± 1.7 |
| Vehicle | 78.3 ± 6.6 | 394.3 ± 16.8 | 7.42 ± 0.01 | 40.9 ± 2.0 | 93.4 ± 3.4 | |
| (n = 5 rats) | Drug | 77.5 ± 6.1 | 371.2 ± 14.8 | 7.42 ± 0.02 | 38.8 ± 1.9 | 89.9 ± 3.6 |
| F(2,8) = 1.046 | F(2,8) = 2.112 | Q(2,5) = 1.20000 | Q(2,5) = 2.80000 | F(2,8) = 4.616 | ||
| p = 0.3676 | p = 0.2090 | p = 0.54881 | p = 0.2466 | p = 0.0970 | ||
| n.s. | n.s. | n.s. | n.s. | n.s. |
Mean arterial blood pressure (MAP), heart rate (HR), pH, and blood gases (pCO2 and pO2) were measured during whisker-induced CBF responses under control conditions, as well as after vehicle and drug infusion. None of the compounds used affected physiological parameters. The number of rats is indicated within parentheses. Repeated-measures ANOVA (F) or Friedman test (Q) and corresponding exact p values. n.s.; not statistically significant.
Pyramidal cells are the main cell type constitutively expressing COX-2
To identify the cellular sources of PgE2 in NVC, we next examined the cellular distribution of COX-2 in the different cellular elements of the neuro-glio-vascular unit. Although the NVC response initiates in layer IV of the somatosensory cortex (Silva and Koretsky, 2002; Tian et al., 2010; Filosa et al., 2015) we focused on layers I-IV in which COX-2 cells predominates across the different cortical areas (Breder et al., 1995). Consistently, COX-2 immunolabeling obtained from 7 different rats was particularly abundant in layer II–III (Fig. 4). It mainly consisted in cytoplasmic staining and was virtually absent from the vascular bed stained with LEA (Fig. 4A) or from microglia immunostained for Iba-1 (Fig. 4B). Similarly, very few S100β-immunolabeled astrocytes were COX-2-immunopositive (2.1 ± 0.9%, n = 3199 S100β-positive cells from 4 rats; Fig. 4C). In contrast, most COX-2-immunoreactive cells displayed a nucleus positive for Satb2 (Fig. 4D), a transcription factor of pyramidal cells (S. Lee et al., 2010). COX-2 cells accounted for 27.7 ± 2.6% of Satb2 neurons (n = 6175 Satb2-positive cells from 4 rats). This suggests that pyramidal neurons, over astrocytes, microglia, and endothelial cells, are the primary cell type constitutively expressing COX-2. Nonetheless it remains unclear whether COX-2-derived vasodilatory prostaglandins are directly produced by pyramidal neurons or if their synthesis is transcellular, as suggested for 20-hydroxyeicosatetraenoic acid (Mulligan and MacVicar, 2004; Attwell et al., 2010), another arachidonic acid derivative.
Figure 4.
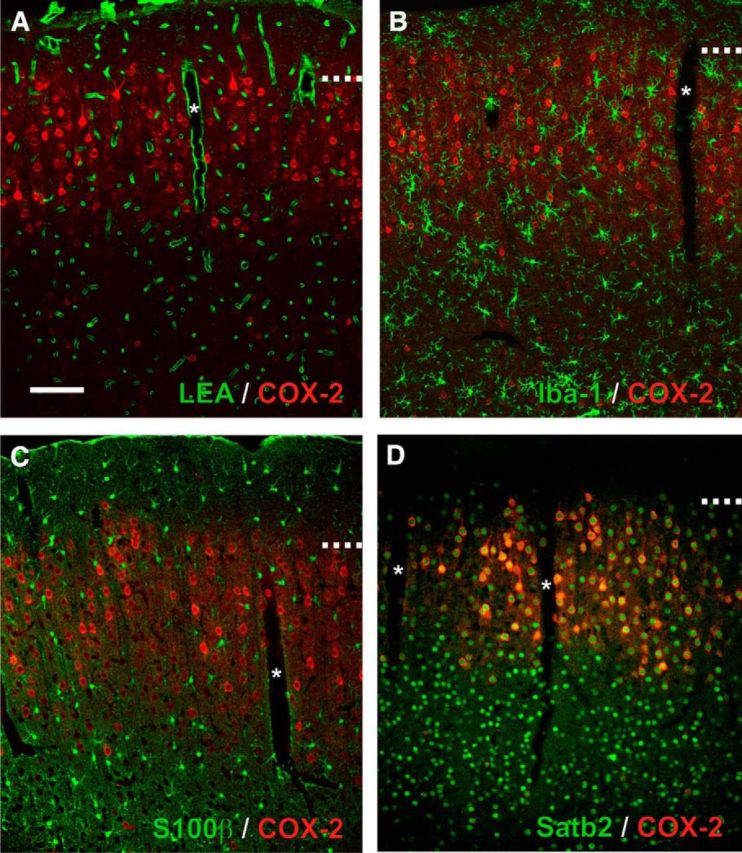
Expression of COX-2 in the neuro-glio-vascular unit. Representative single plane confocal images of double fluorescence staining showing the constitutive expression of COX-2 (red). Scale bar, 100 μm. *Denotes diving blood vessels. Dashed lines represent layer I–II border. Pial surface is upward. A, COX-2 immunolabeling is absent from the vascular bed stained with LEA (green) and (B) from microglia immunostained for Iba-1. C, S100β immunostained astrocytes (green) are essentially COX-2-negative. D, COX-2-immunopositive cells are Satb2-positive (green).
Astrocytes have the capability to produce PgE2 essentially derived from COX-1 activity
To determine the capacity of astrocytes and neurons to produce PgE2 and PgI2 from arachidonic acid we assessed at the single-cell level the cellular distribution of PgE2 and PgI2 synthesizing enzymes including the rate limiting and the terminal synthesizing enzymes in young rats. Two scRT-PCR protocols were respectively designed for astrocyte and neuron characterizations. The efficiency of the protocols was tested on 500 pg of total RNA purified from rat cerebral cortex. Figure 5 shows that for each protocol the sizes of all PCR-generated fragments were as predicted by the mRNA sequences (Table 2) and confirms the sensitivity of the scRT-PCR procedures (Cauli et al., 1997).
Figure 5.

Sensitivity of RT-mPCR protocols. Total cortical RNAs (500 pg) were subjected to RT-PCR protocols designed for the molecular characterization of perivascular astrocytes (A) and cortical neurons (B). The PCR products were resolved in separate lanes by agarose gel electrophoresis in parallel with Φx174 digested by HaeIII as molecular weight marker and stained with ethidium bromide. The amplified fragments corresponding to astrocytic (A, left) and neuronal (B, top) molecular markers, as well as PgE2 and PgI2 synthesizing enzymes (A, right, B, bottom) had the size predicted by their mRNA sequence (Table 2).
To facilitate astrocytes identification, slices were vitally stained with SR101 (n = 35 cells) or TxRed (n = 9 cells), two related fluorescent dyes of cortical astrocytes (Nimmerjahn et al., 2004). Labeled cells were selected in the vicinity of an arteriole (Fig. 6A) and at the border of layers I and II which contain a high density of astrocytes (McCaslin et al., 2011) and the highest astrocytic molecular diversity (Zeisel et al., 2015). Cells were also selected according to the presence of a prominent perivascular process (Fig. 6A) or a cell body directly apposed to an arteriole (n = 6 cells). In line with their glial identity (Zhou et al., 2006), labeled cells exhibited small somata (Fig. 6A; Table 6). Whole-cell recordings revealed a linear I/V curve (Fig. 6B), a hyperpolarized membrane potential (−87.9 ± 1.3 mV), a low input resistance (46.7 ± 7.7 MΩ) and an inability to generate action potentials, which are all characteristics of mature cortical astrocytes (Zhou et al., 2006; Houades et al., 2008). The molecular analysis of these cells revealed the expression of at least one of the two astrocytic markers; GFAP and S100β (Fig. 6C). Consistent with a low level of GFAP in quiescent cortical astrocytes (Wilhelmsson et al., 2006; Houades et al., 2008), GFAP was detected in one-half of the astrocytes, whereas S100β was expressed in most astrocytes (98%, n = 43 of 44 cells).
Figure 6.
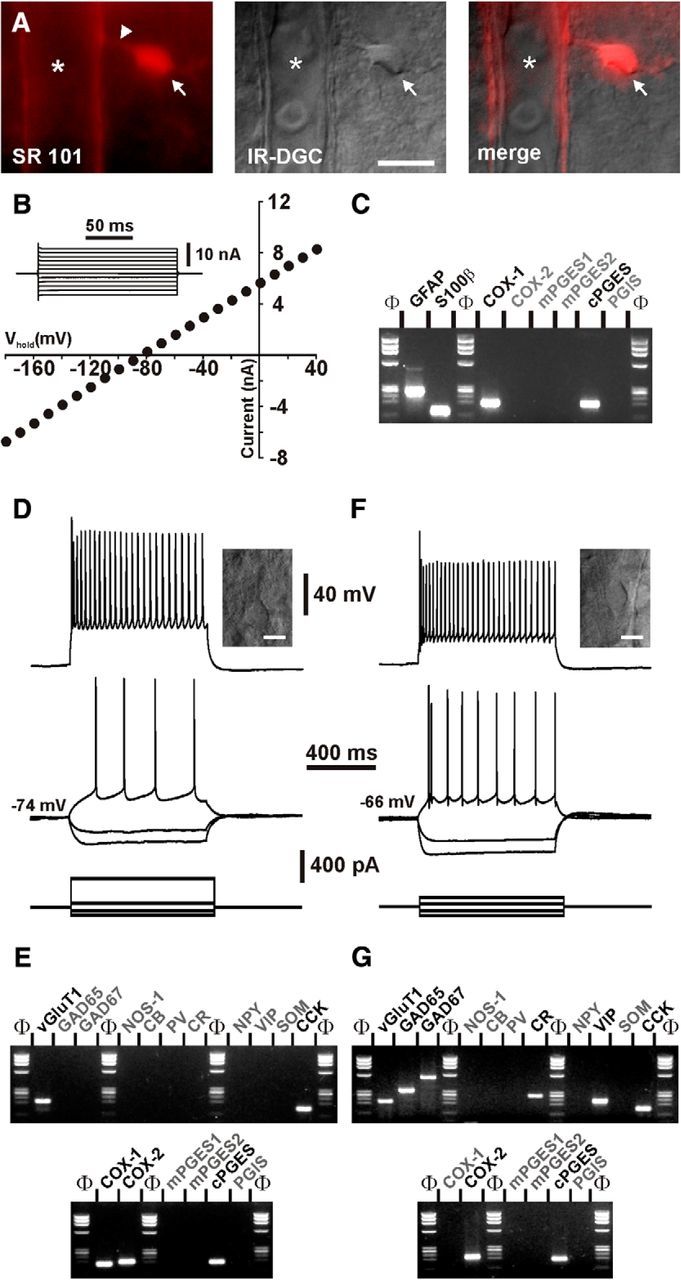
Characterization of prostaglandin producing cells. A, Vital staining of a perivascular astrocyte with SR101. Wide-field fluorescence image of the SR101-labeled cortical astrocyte (left) showing an intensely labeled cell body (arrow) sending a process (arrowhead) onto a diving arteriole (*). Corresponding field-of-view observed under IR-DGC illumination (middle) and superimposition of the two images (right). Pial surface is upward. Scale bar, 10 μm. B, Electrophysiological characterization in voltage-clamp mode of the astrocyte shown in A. Note the linear I/V curve, the low input resistance (slope) and the hyperpolarized resting membrane potential (0 nA intercept) characteristic of passive astrocytes. The inset illustrates current responses evoked by voltage steps (from −180 to 40 mV, 20 mV increments) used to determine the I/V curve at steady-state. C, scRT-PCR analysis of the same astrocyte (A, B) revealing expression of GFAP, S100β, COX-1, and cPGES. D, Voltage responses induced by injection of current pulses in a layer II–III pyramidal cell (bottom traces). Inset, IR-DGC image of the recorded cell, pial surface is upward (scale bar, 10 μm). In response to just-above-threshold current pulse, this neuron fired action potentials with a long lasting biphasic AHP and little frequency adaptation (middle trace). Near saturation, it showed the typical firing of a regular spiking neuron with marked frequency adaptation and spike amplitude accommodation (upper trace). E, The pyramidal cell shown in D expressed vGluT1, CCK, COX-1, COX-2, and cPGES. F, Voltage responses induced by injection of current pulses in a fusiform interneuron (bottom traces). Inset, IR-DGC image of the recorded interneuron, pial surface is upward (scale bar, 10 μm). Note the high input resistance of the cell observed at hyperpolarizing current pulses (middle traces). In response to just-above-threshold current pulse, this interneuron fired a first action potential with a monophasic AHP followed by action potentials with complex AHP. Near saturation, this neuron showed the firing of an adapting-VIP interneuron with marked frequency adaptation and spike amplitude accommodation (upper trace). G, This interneuron expressed vGluT1, GAD65, GAD67, CR, VIP, CCK, COX-2, and cPGES.
Table 6.
Somatic properties of different cortical cells
| Astrocytes (n = 44) | Pyramidal cells (n = 24) | Interneurons (n = 66) | |
|---|---|---|---|
| Layer | 1.2 ± 0.1 | 2.4 ± 0.1 | 2.3 ± 0.1 |
| U(44,24) = 46.5 | U(24,66) = 748.5 | U(44,66) = 194 | |
| p = 8.10−13 | p = 0.693357 | p = 4.10−18 | |
| Astr <<< Pyr, Int | |||
| Major axis (μm) | 18.5 ± 0.9 | 30.2 ± 2.0 | 23.9 ± 0.8 |
| U(44,24) = 140 | U(24,66) = 450 | U(44,66) = 800 | |
| p = 9.10−9 | p = 0.001533 | p = 0.00005 | |
| Astr <<< Int << Pyr | |||
| Minor axis (μm) | 7.9 ± 0.3 | 14.4 ± 0.7 | 10.3 ± 0.2 |
| U(44,24) = 50 | U(24,66) = 197 | U(44,66) = 443 | |
| p = 2.10−12 | p = 4.10−9 | p = 6.10−11 | |
| Astr <<< Int <<< Pyr | |||
| Elongation | 2.4 ± 0.1 | 2.1 ± 0.1 | 2.3 ± 0.1 |
| U(44,24) = 443 | U(24,66) = 620 | U(44,66) = 1432 | |
| p = 0.28041 | p = 0.118109 | p = 0.9057 | |
| n.s. | |||
| Area (μm2) | 68.6 ± 3.3 | 208.5 ± 13.6 | 155.2 ± 5.8 |
| U(44,24) = 2 | U(24,66) = 373,5 | U(44,66) = 47 | |
| p = 4.10−18 | p = 0.000083 | p = 1.10−25 | |
| Astr <<< Int <<< Pyr | |||
| Perimeter (μm) | 47.5 ± 2.3 | 76.5 ± 5.1 | 56.3 ± 1.7 |
| U(44,24) = 155 | U(24,66) = 359 | U(44,66) = 964 | |
| p = 4.10−7 | p = 0.000045 | p = 0.002692 | |
| Astr << Int. <<< Pyr | |||
| Roundness | 2.68 ± 0.16 | 2.27 ± 0.18 | 1.65 ± 0.06 |
| U(44,24) = 420 | U(24,66) = 406 | U(44,66) = 555 | |
| p = 0.168911 | p = 0.000315 | p = 1.10−8 | |
| Int <<< Pyr, Astr | |||
n, Number of cells; Astr, astrocytes; Pyr, pyramidal cells; Int, interneurons. Mann–Whitney U tests and corresponding exact p values. << and <<< indicate significantly smaller with p < 0.01 and <0.001, respectively, with Bonferroni correction for multiple comparisons; n.s., not statistically significant.
As previously observed (Takano et al., 2006; Lecrux et al., 2011), COX-1 was detected in a subpopulation of perivascular astrocytes (20%, n = 9 of 44 cells; Figs. 6C,7). In agreement with our immunohistochemical observations (Fig. 4C), a minority of S100β-positive astrocytes expressed COX-2 (5%, n = 2 of 44 cells; Fig. 7). The PGES isoform, mPGES1, was never observed (Figs. 6C, 7B). In contrast, mPGES2 and cPGES were respectively detected in 5% (n = 2) and 32% (n = 14) of the astrocytes (Figs. 6C, 7B). PGIS was detected in 8 cells (18%; Fig. 7A,C) and was systematically coexpressed with cPGES. Interestingly expression of cPGES (89%, n = 8 of 9 cells, p = 0.0001, Fisher's exact test) and PGIS (44%, n = 4 of 9 cells, p = 0.0422, Fisher's exact test) was enriched in COX-1-positive astrocytes. These data confirm the ability of perivascular astrocytes to synthesize COX-1-derived PgE2 (Takano et al., 2006; Gordon et al., 2008) and PgI2 to a lesser extent.
Figure 7.

Expression profiles of the PgE2 and PgI2 synthesizing enzymes. A, Histograms depicting the occurrence of prostanoid synthesizing enzymes in identified cell types. PGES denotes expression of mPGES1, 2, and/or cPGES. Layer II–III cortical pyramidal neurons (n = 24 cells, black) express much more frequently COX-2, than perivascular astrocytes (n = 44 cells, red) and interneurons (n = 66 cells, white). B, Occurrence of the three PGES isoforms in identified cell types. mPGES1 is not detected in any cell types. mPGES2 is more frequently observed in pyramidal neurons and interneurons than in astrocytes. cPGES is detected in the three cell types but more frequently in pyramidal cells than in astrocytes. *, **, and *** statistically significant with p < 0.05, p <0.01, and p <0.001 respectively. C, Coexpression of prostanoid synthesizing enzymes in identified cell types. The occurrence of cells positive for an enzyme is proportional to the size of the box in a given cell type. Coexpression of PGES (green) and PGIS (blue) with COX-1 (top, purple) and with COX-2 (bottom, red) in astrocytes (S100β and/or GFAP-positive; left), pyramidal cells (vGluT1-positive; middle) and interneurons (GAD65- and/or 67-positive; right).
Pyramidal cells are the main cell type equipped for COX-2-derived PgE2 biosynthesis
We next characterized layer II–III neurons to confirm at the mRNA level our immunohistochemical observations (Fig. 4D) and further determine the expression profile of PgE2 and PgI2 synthesizing enzymes. Pyramidal cells were chosen on the basis of a prominent apical dendrite extending from a large triangular soma (n = 24 cells; Fig. 6D, inset; Table 6). In contrast, collected interneurons (n = 66 cells) displayed a round (n = 4 cells), ovoid (n = 16 cells), or fusiform soma (n = 46 cells; Fig. 6F, inset). Whole-cell current-clamp recordings revealed a resting membrane potential more hyperpolarized in pyramidal cells than in interneurons (Fig. 6D,F; Table 7). Pyramidal cells fired larger and wider action potentials than interneurons (Fig. 6D,F; Table 8). They also discharged at a lower-frequency (Fig. 6D,F; Table 9). This confirms the regular spiking phenotype of pyramidal cells (McCormick et al., 1985; Cauli et al., 2000; Andjelic et al., 2009; Karagiannis et al., 2009). Consistently, the molecular analysis of pyramidal cells revealed expression of the vesicular glutamate transporter, vGluT1 (Fig. 6E) but none of the two GABA synthesizing enzymes. CCK (Fig. 6E) and, to a lesser extent, CB but not the other interneuron markers (Table 10), were frequently observed in pyramidal cells (Cauli et al., 2000; Andjelic et al., 2009; Karagiannis et al., 2009). In contrast, interneurons expressed at least one of the two GADs and frequently the interneuron markers (Fig. 6G; Table 10), particularly CR, NPY, or VIP. These electrophysiological and molecular data confirm the glutamatergic and the GABAergic phenotypes of pyramidal cells and interneurons, respectively.
Table 7.
Subthreshold properties of different neuronal populations
| Pyramidal cells (n = 24) | Interneurons (n = 66) | |
|---|---|---|
| Resting potential, mV | −69.7 ± 1.8 | −59.8 ± 0.8 |
| U(24,66) = 286.5 | p = 0.000001 | |
| Pyr <<< Int | ||
| Input resistance, MΩ | 277 ± 30 | 526 ± 29 |
| U(24,66) = 250 | p = 1.10−7 | |
| Pyr <<< Int | ||
| Time constant, ms | 32.2 ± 2.6 | 32.2 ± 2.1 |
| U(24,66) = 728 | p = 0.564733 | |
| n.s. | ||
| Membrane capacitance, pF | 122.4 ± 5.8 | 67.5 ± 4.5 |
| U(24,66) = 133 | p = 2.10−11 | |
| Int. <<< Pyr. | ||
| Sag index, % | 7.1 ± 1.4 | 9.6 ± 1.1 |
| U(24,66) = 669 | p = 0.265639 | |
| n.s. | ||
Pyr, Pyramidal cells; Int, interneurons, n, number of cells; Mann–Whitney U tests and corresponding exact p values; <<< indicates significantly smaller with p < 0.001; n.s., not statistically significant.
Table 8.
Action potential waveform properties of different neuronal populations
| Pyramidal cells (n = 24) | Interneurons (n = 66) | |
|---|---|---|
| 1st spike amplitude, mV | 96.6 ± 2.3 | 89.2 ± 1.4 |
| U(24,66) = 476,5 | p = 0.00354 | |
| Int << Pyr | ||
| 2nd spike amplitude, mV | 95.0 ± 2.3 | 85.2 ± 1.5 |
| U(24,66) = 369 | p = 0.00007 | |
| Int <<< Pyr | ||
| 1st spike duration, ms | 1.3 ± 0.1 | 0.7 ± 0.1 |
| U(24,66) = 231 | p = 4.10−8 | |
| Int <<< Pyr | ||
| 2nd spike duration, ms | 1.3 ± 0.1 | 0.7 ± 0.0 |
| U(24,66) = 223 | p = 3.10−8 | |
| Int <<< Pyr | ||
| Amplitude reduction, % | 1.6 ± 0.3 | 4.4 ± 0.8 |
| U(24,66) = 553 | p = 0.02888 | |
| Pyr < Int | ||
| Duration increase, % | 0.7 ± 0.3 | 0.8 ± 1.9 |
| U(24,66) = 628 | p = 0.13646 | |
| n.s. | ||
| 1st spike, 1st component AHP, mV | −5.9 ± 0.6 | −15.2 ± 0.6 |
| U(24,66) = 52 | p = 8.10−16 | |
| Int <<< Pyr | ||
| 1st spike, 1st AHP component latency, ms | 7.0 ± 0.6 | 3.8 ± 0.2 |
| U(24,66) = 240 | p = 8.10−8 | |
| Int <<< Pyr | ||
| 1st spike, 2nd component AHP, mV | −12.9 ± 0.6 | −7.6 ± 0.9 |
| U(24,66) = 443 | p = 0.00121 | |
| Pyr << Int | ||
| 1st spike, 2nd AHP component latency, ms | 50.2 ± 4.5 | 15.6 ± 2.1 |
| U(24,66) = 155 | p = 1.10−10 | |
| Int <<< Pyr | ||
| 1st spike, ADP, mV | 0.0 ± 0.0 | 1.9 ± 0.3 |
| U(24,66) = 444 | p = 0.00125 | |
| Pyr << Int | ||
| 1st spike, ADP latency, ms | 0.0 ± 0.0 | 4.4 ± 0.7 |
| U(24,66) = 444 | p = 0.00125 | |
| Pyr << Int | ||
| 2nd spike, 1st component AHP, mV | −6.5 ± 0.7 | −15.6 ± 0.6 |
| U(24,66) = 82 | p = 6.10−14 | |
| Int <<< Pyr | ||
| 2nd spike, 1st AHP component latency, ms | 9.3 ± 1.6 | 3.8 ± 0.3 |
| U(24,66) = 199 | p = 5.10−9 | |
| Int <<< Pyr | ||
| 2nd spike, 2nd component AHP, mV | −13.5 ± 0.8 | −9.5 ± 0.9 |
| U(24,66) = 494 | p = 0.00608 | |
| Int << Pyr | ||
| 2nd spike, 2nd AHP component latency, ms | 55.6 ± 5.9 | 18.0 ± 1.9 |
| U(24,66) = 172 | p = 6.10−10 | |
| Int <<< Pyr | ||
| 2nd spike, ADP, mV | 0.0 ± 0.0 | 1.9 ± 0.3 |
| U(24,66) = 432 | p = 0.00082 | |
| Pyr <<< Int | ||
| 2nd spike, ADP latency, ms | 0.0 ± 0.0 | 2.9 ± 0.4 |
| U(24,66) = 432 | p = 0.00082 | |
| Pyr <<< Int | ||
Pyr, Pyramidal cells; Int, interneurons; n, number of cells; Mann–Whitney U tests and corresponding exact p values; <, << and <<< indicate significantly smaller with p < 0.05, < 0.01, and <0.001, respectively; n.s., not statistically significant.
Table 9.
Firing properties of different neuronal populations
| Pyramidal cells (n = 24) | Interneurons (n = 66) | |
|---|---|---|
| Amplitude accommodation, mV | 12.0 ± 1.3 | 4.2 ± 0.5 |
| U(24,66) = 242 | p = 9.10−8 | |
| Int <<< Pyr | ||
| Amplitude of early adaptation, Hz | 95.1 ± 7.8 | 77.5 ± 5.4 |
| U(24,66) = 551 | p = 0.02753 | |
| Int < Pyr | ||
| Time constant of early adaptation, ms | 15.4 ± 1.5 | 25.2 ± 2.1 |
| U(24,66) = 398 | p = 0.00023 | |
| Pyr <<< Int | ||
| Maximal steady-state frequency, Hz | 45.6 ± 2.8 | 92.0 ± 7.5 |
| U(24,66) = 315 | p = 0.00001 | |
| Pyr <<< Int | ||
| Late adaptation, Hz/s | −24.6 ± 1.9 | −189.3 ± 151.0 |
| U(24,66) = 633 | p = 0.14899 | |
| n.s. | ||
Pyr, Pyramidal cells; Int, interneurons; n, number of cells; Mann–Whitney U tests and corresponding exact p values; < and <<< indicate significantly smaller with p < 0.05 and <0.001, respectively; n.s., not statistically significant.
Table 10.
Occurrence of molecular markers in different neuronal populations
| Pyramidal cells, % (n = 24) | Interneurons, % (n = 66) | |
|---|---|---|
| vGluT1 | 100 | 45 |
| p = 0.0000 | ||
| Int <<< Pyr | ||
| GAD | 0 | 100 |
| p = 0.0000 | ||
| Pyr <<< Int | ||
| NOS-1 | 0 | 9 |
| p = 0.1873 | ||
| n.s. | ||
| CB | 46 | 26 |
| p = 0.0781 | ||
| n.s. | ||
| PV | 21 | 21 |
| p = 1.0000 | ||
| n.s. | ||
| CR | 0 | 27 |
| p = 0.0024 | ||
| Pyr << Int | ||
| NPY | 0 | 20 |
| p = 0.0171 | ||
| Pyr < Int. | ||
| VIP | 0 | 48 |
| p = 0.0000 | ||
| Pyr. <<< Int | ||
| SOM | 25 | 29 |
| p = 0.7959 | ||
| n.s. | ||
| CCK | 79 | 47 |
| p = 0.0082 | ||
| Int << Pyr | ||
Pyr, Pyramidal cells; Int, interneurons; n, number of cells; Fisher's exact test p values; <, << and <<< indicate significantly smaller with p < 0.05, <0.01, and <0.001, respectively; n.s., not statistically significan.
COX-1 was observed in 38% (n = 9 of 24; Fig. 6E) and 27% (n = 18 of 66) of pyramidal cells and interneurons, respectively, and COX-2 in 33% of pyramidal cells (n = 8 of 24 cells; Figs. 6E, 7A,C) but only in 8% of interneurons (n = 5 of 66 cells; Figs. 6G, 7A,C). Coexpression of both COX isoforms occurred in 17% of pyramidal cells (Fig. 6E) and in 5% of interneurons. Similar to astrocytes, mPGES1 was never detected in neurons (Figs. 6E,G, 7B). In contradistinction, mPGES2 and cPGES were respectively detected in 29 (n = 7 of 24 cells) and 75% (n = 18 of 24 cells; Figs. 6E, 7B) of pyramidal cells and in 26 (n = 17 of 66 cells) and 53% (n = 35 of 66 cells) of interneurons (Figs. 6G, 7B). Interestingly, expression of at least one terminal PgE2 synthesizing enzyme was observed in all COX-1- or COX-2-positive pyramidal cells (Figs. 6E, 7C), and in a majority of interneurons positive for COX-1 (94%, n = 17 of 18 cells) or COX-2 (80%, n = 4 of 5 cells; Figs. 6G, 7C). PGIS was expressed in 25% of pyramidal cells (n = 6 of 24 cells, Fig. 7A,C) and only in 11% of interneurons (n = 7 of 66 cells; Fig. 7A,C). These data indicate that subpopulations of cortical neurons can synthesize PgE2 and, to a lesser extent, PgI2.
The occurrence of COX-1 was similar in astrocytes, pyramidal cells, and interneurons (astrocytes vs pyramidal cells, p = 0.1563, astrocytes vs interneurons, p = 0.5006; pyramidal cells vs interneurons, p = 0.4364, Fisher's exact tests; Fig. 7A,C). In contrast, our immunocytochemical (Fig. 4D) and scRT-PCR data showed that pyramidal neurons were the main cell type constitutively expressing COX-2 (astrocytes vs pyramidal cells, p = 0.0026, astrocytes vs interneurons, p = 0.7000; pyramidal cells vs interneurons, p = 0.0046; Fisher's exact tests; Fig. 7A,C). Expression of at least one PGES was more frequent in neurons than in astrocytes (astrocytes vs pyramidal cells, p = 0.0001; astrocytes vs interneurons, p = 0.0018; pyramidal cells vs interneurons, p = 0.1221; Fisher's exact tests; Fig. 7A,C). cPGES was the main isoform in the three cell types and was most frequent in neurons and, particularly, in pyramidal cells (astrocytes vs pyramidal cells, p = 0.0009; astrocytes vs interneurons, p = 0.0327; pyramidal cells vs interneurons, p = 0.0894; Fisher's exact tests; Fig. 7B). Expression mPGES2 was infrequent in neurons and very rare in astrocytes (astrocytes vs pyramidal cells, p = 0.0073; astrocytes vs interneurons, p = 0.0041; pyramidal cells vs interneurons, p = 0.7904; Fisher's exact tests; Fig. 7B). PGIS was similarly rare in neurons and astrocytes (astrocytes vs pyramidal cells, p = 0.5415; astrocytes vs interneurons, p = 0.2717; pyramidal cells vs interneurons, p = 0.1000; Fisher's exact tests; Fig. 7A,C). Consistent with prostaglandin analysis (Fig. 2), these data indicate that perivascular astrocytes and cortical neurons are better equipped to produce PgE2 than PgI2. They also suggest that pyramidal neurons are the main source of PgE2-derived from COX-2 activity. Consistent with a neuronal origin of PgE2 in NVC, NMDA-induced vasodilations were dramatically reduced by blockade of action potentials with TTX (5 μm, n = 8 arterioles, maximal dilation 20.8 ± 3.9%, p = 0.00002, U(16,8) = 3, magnitude 9.0 ± 2.2 103.%.s, p = 0.00037, U(16,8) = 10; Mann–Whitney U tests; Fig. 1) indicating that neuronal activity is required for these responses.
Optogenetic stimulation of pyramidal cells induces COX-2-dependent hyperemic responses
Similar to LDF, it has been reported that 95% of the laser-speckle contrast imaging signal comes from the top 700 μm of tissue (Davis et al., 2014). To evaluate functionally the capability of pyramidal cells to release vasodilatory prostaglandins in vivo, we combined direct optogenetic stimulation of channelrhodopsin-2 (ChR-2)-expressing neurons with laser speckle contrast imaging of cerebral blood flow (Scott and Murphy, 2012). Similarly to rats, mice exhibit a COX-2-dependent NVC response to sensory stimulation (Niwa et al., 2000; Bakalova et al., 2002; Stefanovic et al., 2006; Lecrux et al., 2011). We therefore took advantage of available Cre driver lines to obtain an expression of ChR2 in pyramidal cells. Efficient expression of ChR-2 was obtained by crossing Emx1-Cre mice with Ai32 mice which permits a conditional expression of ChR2 and a robust photoexcitability of pyramidal cells (Madisen et al., 2012). Photoexcitation at 473 nm (100 Hz, 5 ms, 3 mW) of Emx1-Cre;Ai32 mice (n = 5 mice) elicited a rapid and transient increase in cerebral blood flow (Fig. 8; magnitude 118.3 ± 24.2%.s, maximal change 27.7 ± 3.5%) that was not observed with Thy1-YFP mice that do not express ChR2 (n = 4 mice, magnitude 2.9 ± 3.2%.s, p = 0.01587, U(5,4) = 0; maximal change 5.6 ± 1.2%, p = 0.01587, U(5,4) = 0, Mann–Whitney U tests; Fig. 8B–D). Consistent with the release of COX-2-derived PgE2, laser speckle contrast changes evoked by photoexcitation of Emx1-Cre;Ai32 pyramidal cells were reduced by application of the COX-2 inhibitor NS 398 (100 μm, Magnitude 55.9 ± 12.4%.s, p = 0.0226, t(4) = 3.6064, paired t test, maximal change 16.0 ± 3.7%, p = 0.0226, t(4) = 3.6080, paired t test; Fig. 8B–D). These optogenetic results show that direct activation of pyramidal cells is sufficient to release COX-2-derived vasodilatory prostaglandins.
Figure 8.

Optogenetic stimulations of pyramidal cells evoke COX-2-dependent hyperemic responses. A, Variance filtered speckle contrast image. Darker tones represent higher velocity blood flow. Montage of fractional change in speckle contrast images from cortical optogenetic stimulation of an Emx1-Cre;Ai32 mouse. B, Optogenetically evoked increases in blood flow, the scaled inverse square of speckle contrast, before (black trace) and after application of NS 398 (red trace; n = 5 mice). Blue light excitation (473 nm) in Thy1-YFP mice (yellow; n = 4 mice) does note evoke increase in blood flow. The SEM envelopes the mean traces. C, D, Effects of photostimulation on magnitude (C) and maximal changes (D) of blood flow in Thy1-YFP and Emx1-Cre;Ai32 mice before and after NS 398 application. Dots represent individual neurovascular responses. Horizontal bars and error bars correspond to the mean ± SEM. *Statistically different from Emx1-Cre;Ai32 mice under baseline condition with p < 0.05.
Discussion
Here we deciphered the molecular and cellular mechanisms responsible for the biosynthesis and activity of vasodilatory prostaglandins involved in NVC (Fig. 9). We identified in slices the rate-limiting enzyme involved in this pathway by showing that COX-2, but also to a lesser extent COX-1, metabolites mediate NMDA-induced vasodilations. Further, we identified PgE2 as the main vasodilatory prostaglandins by demonstrating ex vivo and in vivo the implication of its EP2 and EP4 receptors and by showing its release ex vivo using LC-ESI-MS/MS. We found that pyramidal cells are the main cell type equipped for PgE2 synthesis derived from COX-2 activity. Moreover we showed that increased activity of these neurons through direct optogenetic stimulation evoked COX-2-dependent NVC responses, hence demonstrating a key role for PgE2-derived from pyramidal cells in NVC responses.
Figure 9.

Biosynthesis and vasodilatory effects of PgE2 and PgI2. Increased intracellular calcium activates phospholipase A2 (PLA2). Arachidonic acid (AA) is released from membrane phospholipids (MPL) by PLA2 and metabolized by COX-1 or COX-2 to produce the intermediary prostaglandin H2 (PgH2). PgE2 and PgI2 are, respectively, synthesized from PgH2 by PGES and PGIS. Upon binding and action on type 2 or 4 PgE2 (EP2/4) or PgI2 (IP) receptors these two prostaglandins relax smooth muscle cells (SMCs) or pericytes and dilate blood vessels. AA can be also metabolized by a cytochrome P450-epoxygenase (Cyp450) to produce 14,15-epoxyeicosatrienoic acid (14,15 EET) which induces EP2-dependent vasodilation. EC, Endothelial cell. SC 560 and NS 398 are selective COX-1 and COX-2 inhibitors respectively. Indomethacin (Indo) is a nonselective COX-1/2 inhibitor. AH 6809, L161-982, and CAY 10441 are EP2, EP4, and IP antagonists, respectively.
Cellular distribution of PgE2 and PgI2 synthesizing enzymes
Our data showing COX-1 expression in various cell types are supported by previous observations demonstrating its localization in microglia, astrocytes, neurons and endothelial cells (Takano et al., 2006; Cahoy et al., 2008; Gordon et al., 2008; Tang and Vanhoutte, 2008; Tanaka et al., 2009; Anrather et al., 2011; Lecrux et al., 2011). In contrast, we observed by immunohistochemistry and scRT-PCR that COX-2 is largely restricted to pyramidal neurons, rarely in astrocytes and interneurons, and virtually absent in microglial cells and the vascular bed (Yamagata et al., 1993; Breder et al., 1995; Kaufmann et al., 1996; Wang et al., 2005; Takano et al., 2006; Cahoy et al., 2008; Gordon et al., 2008; Anrather et al., 2011; Lecrux et al., 2011). Regarding the terminal PgE2 synthesizing enzymes, cPGES was observed in all cell types investigated (Vazquez-Tello et al., 2004; Sang et al., 2005; Cahoy et al., 2008), mPGES2 was essentially detected in neurons (Sang et al., 2005; Cahoy et al., 2008), whereas mPGES1 was virtually absent from neurons and astrocytes (Ikeda-Matsuo et al., 2006; Cahoy et al., 2008). We also confirmed a rather infrequent PGIS expression (Mehl et al., 1999; Cahoy et al., 2008). Importantly, we disclosed that COX-2-positive pyramidal cells systematically express a cPGES and/or mPGES2 to a lesser extent. This indicates that under homeostatic conditions COX-2-derived PgE2 is essentially produced by pyramidal cells.
Origins of vasodilatory prostaglandins in NVC
Perivascular astrocytes can release COX-1-, but not COX-2-derived, vasodilatory prostaglandins following activation of group I metabotropic glutamate receptors (Zonta et al., 2003; Takano et al., 2006; Gordon et al., 2008). However, the recruitment of this pathway during sensory stimulation is unlikely because pharmacological and genetic evidence showed that such stimuli elicit COX-2, but not COX-1,-dependent hyperemic responses (Niwa et al., 2000, 2001; Bakalova et al., 2002; Stefanovic et al., 2006; Lecrux et al., 2011). Furthermore, the recruitment of astrocytes by group I metabotropic glutamate receptors has been recently questioned (Calcinaghi et al., 2011; Nizar et al., 2013; Sun et al., 2013; Bonder and McCarthy, 2014; Jego et al., 2014). This suggests that under normal conditions sensory stimulations do not substantially recruit vasodilatory prostaglandins produced by astrocytes.
We found that NMDA-induced vasodilations were almost completely abolished by COX-2 inhibition, suggesting that the NMDA-dependent fraction of the NVC response is essentially mediated by vasodilatory prostaglandins. Our results indicating that COX-2-derived PgE2 released during sensory stimulation has a pyramidal origin are supported further by optogenetic observations showing that the selective photostimulation of CaMKIIα pyramidal cells, which extensively coexpress COX-2 (Kaufmann et al., 1996), evoked a hemodynamic response (J. H. Lee et al., 2010; Ji et al., 2012). In addition, the NVC responses induced by the photostimulation of pyramidal neurons, but not by sensory stimulation, are virtually insensitive to ionotropic glutamate receptors blockade (Scott and Murphy, 2012). This further points to release of vasodilatory messengers by pyramidal cells. Since the NVC involves numerous vasoactive messengers (Iadecola, 2004; Leithner et al., 2010; Liu et al., 2012), it is likely that the optogenetic photostimulation of pyramidal cells recruits indirectly other vasoactive messengers. Consistently, a substantial fraction of the NVC response to sensory stimulation is insensitive to COX-2 inhibition (Niwa et al., 2000; Bakalova et al., 2002; Stefanovic et al., 2006; Lecrux et al., 2011) and PgE2 receptor antagonism (present study). Interestingly, COX-2 has been described in dendrites, spines or axon terminals (Kaufmann et al., 1996; Wang et al., 2005), suggesting that pyramidal cells can remotely release PgE2.
We found that the initial phase of NMDA-induced vasodilations was also COX-1-dependent. The cellular origin of COX-1-derived prostaglandins released by NMDA remains undetermined given the large cellular distribution of COX-1 (see above) and the widespread expression of NMDA receptors in various neuronal types (Cauli et al., 2000), but also in some astrocytes, microglial and endothelial cells (Lalo et al., 2006; Kaindl et al., 2012; LeMaistre et al., 2012). Microglia, a major cell type expressing COX-1, can release PgE2 upon NMDA stimulation, but secondary to neuronal ATP release (Anrather et al., 2011) making unlikely their contribution to the early NVC response. The expression of COX-1 in neurons and astrocytes suggests that these cell types might be responsible for the early NVC response. Finally, given that endothelial cells play a key role in fast hemodynamics (Chen et al., 2014), they might also contribute to the early NVC response.
Release of prostaglandins
Consistent with in vivo data (Lazarewicz and Salińska, 1995; Pepicelli et al., 2005; Anrather et al., 2011) we observed a COX-1 and COX-2-dependent release of PgE2 and 6-keto PgF1α. The level of PgE2 release by NMDA is approximately one-half that found with mGluR1/5 agonists (Gordon et al., 2008), suggesting that they are more efficient than NMDA at inducing PgE2 release. This is consistent with widespread expression of mGluR1/5 in astrocytes and neurons (Porter and McCarthy, 1996; Cauli et al., 2000). However, number of slices and duration of incubation were not described (Gordon et al., 2008) making a direct comparison difficult. Furthermore, due to cross-reactivity among the different prostaglandins, the content in PgE2 may have been overestimated by using immunoassay (Schmidt et al., 2005). Interestingly, in line with in vivo observations (Lazarewicz et al., 2000), using LC-ESI-MS/MS we found that up to 396 ± 141 pg/ml PgD2 was released by NMDA, a prostaglandin structurally similar to PgE2.
The dynamics of the NMDA-dependent PgE2 and 6-keto PgF1α (Fig. 2) are overall compatible with the kinetics NMDA-induced vasodilations (Fig. 1). However a direct comparison is difficult given the different mode of NMDA delivery and washout between supernatant analysis and vascular reactivity (Mishra et al., 2014). The sustained vasodilation after NMDA washout is reminiscent of an intracellular Ca2+ increase after a prolonged exposure of NMDA, involving an initial increase via NMDA receptors followed by a secondary activation of other Ca2+-permeable channels including transient receptor potential channels (Olah et al., 2009) and/or voltage-gated Ca2+ channels (Oda et al., 2014). Recruitment of extrasynaptic NMDA receptors are likely to be responsible for this secondary Ca2+ increase (Oda et al., 2014) and overproduction of PgE2 (Stark and Bazan, 2011). Whether or not these different initial entry points are specifically coupled with COX-1 and/or COX-2 remains to be determined.
Prostaglandin receptors in NVC
The prostaglandin receptors EP2, EP4, and IP are expressed in cerebrovascular smooth muscle cells and pericytes (Myren et al., 2010, 2011; Dabertrand et al., 2013; Hall et al., 2014). We observed an impairment of the NVC responses by the EP2 and EP4 antagonists both ex vivo and in vivo. These data suggesting an involvement of PgE2 are consistent with recent observations showing a recruitment of EP4 receptors in cerebral vasodilation evoked by glutamate (Hall et al., 2014). Antagonism of both EP2 and EP4 receptors reduced the maximal amplitude of NMDA-induced vasodilation, but their magnitude were only impaired by the EP2 antagonist, indicating that EP2 receptors may have a longer lasting vasodilatory effect than EP4 receptors. This is consistent with the reported agonist-induced internalization of EP4 but not EP2 receptor (Desai et al., 2000). This further suggests that EP2 receptor would be the major vasodilatory PgE2 receptor activated during a sustained hyperemic response. Because 14,15-EET can induce vasodilation by acting on EP2 receptors (Yang et al., 2010), the AH 6809-sensitive vasodilation could be also explained by the release of 14,15-EET from astrocytes (Alkayed et al., 1996, 1997; Fig. 9). Although the IP antagonist impaired NMDA-induced vasodilations in slices, it did not alter the hyperemic response to sensory stimulation. This difference between ex vivo and in vivo NVC responses is probably because bath application of NMDA recruits more massively NMDA receptors than sensory stimuli, resulting in enhanced PgI2 biosynthesis and release. In addition, the levels of 6-keto PgF1α released in slices are very low; it is therefore likely that the production of PgI2 induced by sensory stimulation in vivo is negligible.
Conclusion
Using different multidisciplinary approaches we demonstrate that pyramidal cells produce and release COX-2-derived PgE2 inducing vasodilation and functional hyperemia via activation of EP2 and EP4 receptors. So far most studies focused almost exclusively on the role of astrocytes in NVC (Attwell et al., 2010) thereby overlooking the possibility of a direct neurogenic control. Our finding emphasizing the importance of neurons provides important insights in the field of NVC and will have consequences on the interpretation of functional imaging based on hemodynamic signals widely used to map neuronal activity in health and disease.
Footnotes
This work was supported by grants from the Human Frontier Science Program (RGY0070/2007; B.C. and E.M.C.H.), the Agence Nationale pour la Recherche (ANR 2011 MALZ 003 01; B.C.) “IHU Institut de Neurosciences Translationelles de Paris,” (ANR-10-IAIHU-06; B.C.), the Fondation pour la Recherche sur le Cerveau / Rotary Club de France (AOE-7 “Espoir en tête 2012”; B.C.), the Canadian Institutes of Health Research (CIHR, MOP-84209 to E.H. and MOP-12675 to T.H.M.), the Heart and Stroke Foundation of Canada (E.H. and T.H.M.), and by the Heart and Stroke Foundation of British Columbia and Yukon (T.H.M.) or Québec (E.H.), and T.H.M. and B.C. were supported by a joint UPMC and UBC collaborative grant funded by Djavad Mowafaghian Centre for Brain Health; part of this work was coordinated by CEA/MIRCen/IB2M and supported by the association France Alzheimer (ASTROinAD; B.C.); I.T. was supported by the Deutsche Forschungsgemeinschaft (CRC1039 A3) and A.K. was supported by a Fondation pour la Recherche Médicale fellowship (FDT20100920106). The funders had no role in study design, data collection and analysis, decision to publish, or preparation of the paper. We thank Alexandre Mourot and Jérémie Naudé for their help and assistance, Eleni Tzavara and Victor Gorgievski for providing the S100β antibody, Monara Angelim and Pascal Legendre for providing the Iba-1 antibody, and the Cell Imaging and the animal facilities of the IBPS.
The authors declare no competing financial interest.
References
- Alkayed NJ, Narayanan J, Gebremedhin D, Medhora M, Roman RJ, Harder DR. Molecular characterization of an arachidonic acid epoxygenase in rat brain astrocytes. Stroke. 1996;27:971–979. doi: 10.1161/01.STR.27.5.971. [DOI] [PubMed] [Google Scholar]
- Alkayed NJ, Birks EK, Narayanan J, Petrie KA, Kohler-Cabot AE, Harder DR. Role of P-450 arachidonic acid epoxygenase in the response of cerebral blood flow to glutamate in rats. Stroke. 1997;28:1066–1072. doi: 10.1161/01.STR.28.5.1066. [DOI] [PubMed] [Google Scholar]
- Andjelic S, Gallopin T, Cauli B, Hill EL, Roux L, Badr S, Hu E, Tamás G, Lambolez B. Glutamatergic nonpyramidal neurons from neocortical layer VI and their comparison with pyramidal and spiny stellate neurons. J Neurophysiol. 2009;101:641–654. doi: 10.1152/jn.91094.2008. [DOI] [PMC free article] [PubMed] [Google Scholar]
- Andrew RD, Adams JR, Polischuk TM. Imaging NMDA- and kainate-induced intrinsic optical signals from the hippocampal slice. J Neurophysiol. 1996;76:2707–2717. doi: 10.1152/jn.1996.76.4.2707. [DOI] [PubMed] [Google Scholar]
- Anrather J, Gallo EF, Kawano T, Orio M, Abe T, Gooden C, Zhou P, Iadecola C. Purinergic signaling induces cyclooxygenase-1-dependent prostanoid synthesis in microglia: roles in the outcome of excitotoxic brain injury. PLoS One. 2011;6:e25916. doi: 10.1371/journal.pone.0025916. [DOI] [PMC free article] [PubMed] [Google Scholar]
- Ascoli GA, Alonso-Nanclares L, Anderson SA, Barrionuevo G, Benavides-Piccione R, Burkhalter A, Buzsáki G, Cauli B, Defelipe J, Fairén A, Feldmeyer D, Fishell G, Fregnac Y, Freund TF, Gardner D, Gardner EP, Goldberg JH, Helmstaedter M, Hestrin S, Karube F, et al. Petilla terminology: nomenclature of features of GABAergic interneurons of the cerebral cortex. Nat Rev Neurosci. 2008;9:557–568. doi: 10.1038/nrn2402. [DOI] [PMC free article] [PubMed] [Google Scholar]
- Attwell D, Buchan AM, Charpak S, Lauritzen M, Macvicar BA, Newman EA. Glial and neuronal control of brain blood flow. Nature. 2010;468:232–243. doi: 10.1038/nature09613. [DOI] [PMC free article] [PubMed] [Google Scholar]
- Bakalova R, Matsuura T, Kanno I. The cyclooxygenase inhibitors indomethacin and Rofecoxib reduce regional cerebral blood flow evoked by somatosensory stimulation in rats. Exp Biol Med (Maywood) 2002;227:465–473. doi: 10.1177/153537020222700710. [DOI] [PubMed] [Google Scholar]
- Blanco VM, Stern JE, Filosa JA. Tone-dependent vascular responses to astrocyte-derived signals. Am J Physiol Heart Circ Physiol. 2008;294:H2855–H2863. doi: 10.1152/ajpheart.91451.2007. [DOI] [PMC free article] [PubMed] [Google Scholar]
- Bley KR, Bhattacharya A, Daniels DV, Gever J, Jahangir A, O'Yang C, Smith S, Srinivasan D, Ford AP, Jett MF. RO1138452 and RO3244794: characterization of structurally distinct, potent and selective IP (prostacyclin) receptor antagonists. Br J Pharmacol. 2006;147:335–345. doi: 10.1038/sj.bjp.0706554. [DOI] [PMC free article] [PubMed] [Google Scholar]
- Bochet P, Audinat E, Lambolez B, Crépel F, Rossier J, Iino M, Tsuzuki K, Ozawa S. Subunit composition at the single-cell level explains functional properties of a glutamate-gated channel. Neuron. 1994;12:383–388. doi: 10.1016/0896-6273(94)90279-8. [DOI] [PubMed] [Google Scholar]
- Boie Y, Stocco R, Sawyer N, Slipetz DM, Ungrin MD, Neuschäfer-Rube F, Püschel GP, Metters KM, Abramovitz M. Molecular cloning and characterization of the four rat prostaglandin E2 prostanoid receptor subtypes. Eur J Pharmacol. 1997;340:227–241. doi: 10.1016/S0014-2999(97)01383-6. [DOI] [PubMed] [Google Scholar]
- Bonder DE, McCarthy KD. Astrocytic Gq-GPCR-linked IP3R-dependent Ca2+ signaling does not mediate neurovascular coupling in mouse visual cortex in vivo. J Neurosci. 2014;34:13139–13150. doi: 10.1523/JNEUROSCI.2591-14.2014. [DOI] [PMC free article] [PubMed] [Google Scholar]
- Breder CD, Dewitt D, Kraig RP. Characterization of inducible cyclooxygenase in rat brain. J Comp Neurol. 1995;355:296–315. doi: 10.1002/cne.903550208. [DOI] [PMC free article] [PubMed] [Google Scholar]
- Briers JD. Laser Doppler, speckle and related techniques for blood perfusion mapping and imaging. Physiol Meas. 2001;22:R35–R66. doi: 10.1088/0967-3334/22/4/201. [DOI] [PubMed] [Google Scholar]
- Cahoy JD, Emery B, Kaushal A, Foo LC, Zamanian JL, Christopherson KS, Xing Y, Lubischer JL, Krieg PA, Krupenko SA, Thompson WJ, Barres BA. A transcriptome database for astrocytes, neurons, and oligodendrocytes: a new resource for understanding brain development and function. J Neurosci. 2008;28:264–278. doi: 10.1523/JNEUROSCI.4178-07.2008. [DOI] [PMC free article] [PubMed] [Google Scholar]
- Calcinaghi N, Jolivet R, Wyss MT, Ametamey SM, Gasparini F, Buck A, Weber B. Metabotropic glutamate receptor mGluR5 is not involved in the early hemodynamic response. J Cereb Blood Flow Metab. 2011;31:e1–10. doi: 10.1038/jcbfm.2011.96. [DOI] [PMC free article] [PubMed] [Google Scholar]
- Cauli B, Hamel E. Revisiting the role of neurons in neurovascular coupling. Front Neuroenergetics. 2010;2:9. doi: 10.3389/fnene.2010.00009. [DOI] [PMC free article] [PubMed] [Google Scholar]
- Cauli B, Audinat E, Lambolez B, Angulo MC, Ropert N, Tsuzuki K, Hestrin S, Rossier J. Molecular and physiological diversity of cortical nonpyramidal cells. J Neurosci. 1997;17:3894–3906. doi: 10.1523/JNEUROSCI.17-10-03894.1997. [DOI] [PMC free article] [PubMed] [Google Scholar]
- Cauli B, Porter JT, Tsuzuki K, Lambolez B, Rossier J, Quenet B, Audinat E. Classification of fusiform neocortical interneurons based on unsupervised clustering. Proc Natl Acad Sci U S A. 2000;97:6144–6149. doi: 10.1073/pnas.97.11.6144. [DOI] [PMC free article] [PubMed] [Google Scholar]
- Cauli B, Tong XK, Rancillac A, Serluca N, Lambolez B, Rossier J, Hamel E. Cortical GABA interneurons in neurovascular coupling: relays for subcortical vasoactive pathways. J Neurosci. 2004;24:8940–8949. doi: 10.1523/JNEUROSCI.3065-04.2004. [DOI] [PMC free article] [PubMed] [Google Scholar]
- Chen BR, Kozberg MG, Bouchard MB, Shaik MA, Hillman EM. A critical role for the vascular endothelium in functional neurovascular coupling in the brain. J Am Heart Assoc. 2014;3:e000787. doi: 10.1161/JAHA.114.000787. [DOI] [PMC free article] [PubMed] [Google Scholar]
- Cheng H, Duong TQ. Simplified laser-speckle-imaging analysis method and its application to retinal blood flow imaging. Opt Lett. 2007;32:2188–2190. doi: 10.1364/OL.32.002188. [DOI] [PMC free article] [PubMed] [Google Scholar]
- Dabertrand F, Hannah RM, Pearson JM, Hill-Eubanks DC, Brayden JE, Nelson MT. Prostaglandin E(2), a postulated astrocyte-derived neurovascular coupling agent, constricts rather than dilates parenchymal arterioles. J Cereb Blood Flow Metab. 2013;33:479–482. doi: 10.1038/jcbfm.2013.9. [DOI] [PMC free article] [PubMed] [Google Scholar]
- Damm J, Luheshi GN, Gerstberger R, Roth J, Rummel C. Spatiotemporal nuclear factor interleukin-6 expression in the rat brain during lipopolysaccharide-induced fever is linked to sustained hypothalamic inflammatory target gene induction. J Comp Neurol. 2011;519:480–505. doi: 10.1002/cne.22529. [DOI] [PubMed] [Google Scholar]
- Davis MA, Kazmi SM, Dunn AK. Imaging depth and multiple scattering in laser speckle contrast imaging. J Biomed Opt. 2014;19 doi: 10.1117/1.JBO.19.8.086001. 086001. [DOI] [PMC free article] [PubMed] [Google Scholar]
- Davis RJ, Murdoch CE, Ali M, Purbrick S, Ravid R, Baxter GS, Tilford N, Sheldrick RL, Clark KL, Coleman RA. EP4 prostanoid receptor-mediated vasodilatation of human middle cerebral arteries. Br J Pharmacol. 2004;141:580–585. doi: 10.1038/sj.bjp.0705645. [DOI] [PMC free article] [PubMed] [Google Scholar]
- Desai S, April H, Nwaneshiudu C, Ashby B. Comparison of agonist-induced internalization of the human EP2 and EP4 prostaglandin receptors: role of the carboxyl terminus in EP4 receptor sequestration. Mol Pharmacol. 2000;58:1279–1286. doi: 10.1124/mol.58.6.1279. [DOI] [PubMed] [Google Scholar]
- Dodt HU, Zieglgänsberger W. Visualization of neuronal form and function in brain slices by infrared videomicroscopy. Histochem J. 1998;30:141–152. doi: 10.1023/A:1003291218707. [DOI] [PubMed] [Google Scholar]
- Feng G, Mellor RH, Bernstein M, Keller-Peck C, Nguyen QT, Wallace M, Nerbonne JM, Lichtman JW, Sanes JR. Imaging neuronal subsets in transgenic mice expressing multiple spectral variants of GFP. Neuron. 2000;28:41–51. doi: 10.1016/S0896-6273(00)00084-2. [DOI] [PubMed] [Google Scholar]
- Fergus A, Lee KS. Regulation of cerebral microvessels by glutamatergic mechanisms. Brain Res. 1997;754:35–45. doi: 10.1016/S0006-8993(97)00040-1. [DOI] [PubMed] [Google Scholar]
- Filosa JA, Morrison HW, Iddings JA, Du W, Kim KJ. Beyond neurovascular coupling, role of astrocytes in the regulation of vascular tone. Neuroscience. 2015 doi: 10.1016/j.neuroscience.2015.03.064. Advance online publication. Retrieved April 3, 2015. [DOI] [PMC free article] [PubMed] [Google Scholar]
- Fox PT, Raichle ME, Mintun MA, Dence C. Nonoxidative glucose consumption during focal physiologic neural activity. Science. 1988;241:462–464. doi: 10.1126/science.3260686. [DOI] [PubMed] [Google Scholar]
- Fredriksson I, Larsson M, Strömberg T. Measurement depth and volume in laser Doppler flowmetry. Microvasc Res. 2009;78:4–13. doi: 10.1016/j.mvr.2009.02.008. [DOI] [PubMed] [Google Scholar]
- Funk CD. Prostaglandins and leukotrienes: advances in eicosanoid biology. Science. 2001;294:1871–1875. doi: 10.1126/science.294.5548.1871. [DOI] [PubMed] [Google Scholar]
- Gallopin T, Geoffroy H, Rossier J, Lambolez B. Cortical sources of CRF, NKB, and CCK and their effects on pyramidal cells in the neocortex. Cereb Cortex. 2006;16:1440–1452. doi: 10.1093/cercor/bhj081. [DOI] [PubMed] [Google Scholar]
- Girouard H, Bonev AD, Hannah RM, Meredith A, Aldrich RW, Nelson MT. Astrocytic endfoot Ca2+ and BK channels determine both arteriolar dilation and constriction. Proc Natl Acad Sci U S A. 2010;107:3811–3816. doi: 10.1073/pnas.0914722107. [DOI] [PMC free article] [PubMed] [Google Scholar]
- Gordon GR, Choi HB, Rungta RL, Ellis-Davies GC, MacVicar BA. Brain metabolism dictates the polarity of astrocyte control over arterioles. Nature. 2008;456:745–749. doi: 10.1038/nature07525. [DOI] [PMC free article] [PubMed] [Google Scholar]
- Gorski JA, Talley T, Qiu M, Puelles L, Rubenstein JL, Jones KR. Cortical excitatory neurons and glia, but not GABAergic neurons, are produced in the Emx1-expressing lineage. J Neurosci. 2002;22:6309–6314. doi: 10.1523/JNEUROSCI.22-15-06309.2002. [DOI] [PMC free article] [PubMed] [Google Scholar]
- Gsell W, Burke M, Wiedermann D, Bonvento G, Silva AC, Dauphin F, Bührle C, Hoehn M, Schwindt W. Differential effects of NMDA and AMPA glutamate receptors on functional magnetic resonance imaging signals and evoked neuronal activity during forepaw stimulation of the rat. J Neurosci. 2006;26:8409–8416. doi: 10.1523/JNEUROSCI.4615-05.2006. [DOI] [PMC free article] [PubMed] [Google Scholar]
- Hall CN, Reynell C, Gesslein B, Hamilton NB, Mishra A, Sutherland BA, O'Farrell FM, Buchan AM, Lauritzen M, Attwell D. Capillary pericytes regulate cerebral blood flow in health and disease. Nature. 2014;508:55–60. doi: 10.1038/nature13165. [DOI] [PMC free article] [PubMed] [Google Scholar]
- Harb R, Whiteus C, Freitas C, Grutzendler J. In vivo imaging of cerebral microvascular plasticity from birth to death. J Cereb Blood Flow Metab. 2013;33:146–156. doi: 10.1038/jcbfm.2012.152. [DOI] [PMC free article] [PubMed] [Google Scholar]
- Horky LL, Galimi F, Gage FH, Horner PJ. Fate of endogenous stem/progenitor cells following spinal cord injury. J Comp Neurol. 2006;498:525–538. doi: 10.1002/cne.21065. [DOI] [PMC free article] [PubMed] [Google Scholar]
- Houades V, Koulakoff A, Ezan P, Seif I, Giaume C. Gap junction-mediated astrocytic networks in the mouse barrel cortex. J Neurosci. 2008;28:5207–5217. doi: 10.1523/JNEUROSCI.5100-07.2008. [DOI] [PMC free article] [PubMed] [Google Scholar]
- Iadecola C. Neurovascular regulation in the normal brain and in Alzheimer's disease. Nat Rev Neurosci. 2004;5:347–360. doi: 10.1038/nrn1387. [DOI] [PubMed] [Google Scholar]
- Iadecola C, Nedergaard M. Glial regulation of the cerebral microvasculature. Nat Neurosci. 2007;10:1369–1376. doi: 10.1038/nn2003. [DOI] [PubMed] [Google Scholar]
- Ikeda-Matsuo Y, Ota A, Fukada T, Uematsu S, Akira S, Sasaki Y. Microsomal prostaglandin E synthase-1 is a critical factor of stroke-reperfusion injury. Proc Natl Acad Sci U S A. 2006;103:11790–11795. doi: 10.1073/pnas.0604400103. [DOI] [PMC free article] [PubMed] [Google Scholar]
- Jego P, Pacheco-Torres J, Araque A, Canals S. Functional MRI in mice lacking IP-dependent calcium signaling in astrocytes. J Cereb Blood Flow Metab. 2014;34:1599–1603. doi: 10.1038/jcbfm.2014.144. [DOI] [PMC free article] [PubMed] [Google Scholar]
- Ji L, Zhou J, Zafar R, Kantorovich S, Jiang R, Carney PR, Jiang H. Cortical neurovascular coupling driven by stimulation of channelrhodopsin-2. PLoS One. 2012;7:e46607. doi: 10.1371/journal.pone.0046607. [DOI] [PMC free article] [PubMed] [Google Scholar]
- Kaindl AM, Degos V, Peineau S, Gouadon E, Chhor V, Loron G, Le Charpentier T, Josserand J, Ali C, Vivien D, Collingridge GL, Lombet A, Issa L, Rene F, Loeffler JP, Kavelaars A, Verney C, Mantz J, Gressens P. Activation of microglial N-methyl-d-aspartate receptors triggers inflammation and neuronal cell death in the developing and mature brain. Ann Neurol. 2012;72:536–549. doi: 10.1002/ana.23626. [DOI] [PubMed] [Google Scholar]
- Karagiannis A, Gallopin T, Dávid C, Battaglia D, Geoffroy H, Rossier J, Hillman EM, Staiger JF, Cauli B. Classification of NPY-expressing neocortical interneurons. J Neurosci. 2009;29:3642–3659. doi: 10.1523/JNEUROSCI.0058-09.2009. [DOI] [PMC free article] [PubMed] [Google Scholar]
- Kaufmann WE, Worley PF, Pegg J, Bremer M, Isakson P. COX-2, a synaptically induced enzyme, is expressed by excitatory neurons at postsynaptic sites in rat cerebral cortex. Proc Natl Acad Sci U S A. 1996;93:2317–2321. doi: 10.1073/pnas.93.6.2317. [DOI] [PMC free article] [PubMed] [Google Scholar]
- Lacoste B, Comin CH, Ben-Zvi A, Kaeser PS, Xu X, Costa LF, Gu C. Sensory-related neural activity regulates the structure of vascular networks in the cerebral cortex. Neuron. 2014;83:1117–1130. doi: 10.1016/j.neuron.2014.07.034. [DOI] [PMC free article] [PubMed] [Google Scholar]
- Lalo U, Pankratov Y, Kirchhoff F, North RA, Verkhratsky A. NMDA receptors mediate neuron-to-glia signaling in mouse cortical astrocytes. J Neurosci. 2006;26:2673–2683. doi: 10.1523/JNEUROSCI.4689-05.2006. [DOI] [PMC free article] [PubMed] [Google Scholar]
- Lambolez B, Audinat E, Bochet P, Crépel F, Rossier J. AMPA receptor subunits expressed by single Purkinje cells. Neuron. 1992;9:247–258. doi: 10.1016/0896-6273(92)90164-9. [DOI] [PubMed] [Google Scholar]
- Lauritzen M. Reading vascular changes in brain imaging: is dendritic calcium the key? Nat Rev Neurosci. 2005;6:77–85. doi: 10.1038/nrn1589. [DOI] [PubMed] [Google Scholar]
- Lazarewicz JW, Salińska E. N-methyl-d-aspartate-evoked release of cyclo-oxygenase products in rabbit hippocampus: an in vivo microdialysis study. J Neurosci Res. 1995;40:660–666. doi: 10.1002/jnr.490400511. [DOI] [PubMed] [Google Scholar]
- Lazarewicz JW, Salinska E, Stafiej A, Ziembowicz A, Zieminska E. NMDA receptors and nitric oxide regulate prostaglandin D2 synthesis in the rabbit hippocampus in vivo. Acta Neurobiol Exp (Wars) 2000;60:427–435. doi: 10.55782/ane-2000-1362. [DOI] [PubMed] [Google Scholar]
- Lecrux C, Toussay X, Kocharyan A, Fernandes P, Neupane S, Lévesque M, Plaisier F, Shmuel A, Cauli B, Hamel E. Pyramidal neurons are “neurogenic hubs” in the neurovascular coupling response to whisker stimulation. J Neurosci. 2011;31:9836–9847. doi: 10.1523/JNEUROSCI.4943-10.2011. [DOI] [PMC free article] [PubMed] [Google Scholar]
- Lecrux C, Kocharyan A, Sandoe CH, Tong XK, Hamel E. Pyramidal cells and cytochrome P450 epoxygenase products in the neurovascular coupling response to basal forebrain cholinergic input. J Cereb Blood Flow Metab. 2012;32:896–906. doi: 10.1038/jcbfm.2012.4. [DOI] [PMC free article] [PubMed] [Google Scholar]
- Lee JH, Durand R, Gradinaru V, Zhang F, Goshen I, Kim DS, Fenno LE, Ramakrishnan C, Deisseroth K. Global and local fMRI signals driven by neurons defined optogenetically by type and wiring. Nature. 2010;465:788–792. doi: 10.1038/nature09108. [DOI] [PMC free article] [PubMed] [Google Scholar]
- Lee S, Hjerling-Leffler J, Zagha E, Fishell G, Rudy B. The largest group of superficial neocortical GABAergic interneurons expresses ionotropic serotonin receptors. J Neurosci. 2010;30:16796–16808. doi: 10.1523/JNEUROSCI.1869-10.2010. [DOI] [PMC free article] [PubMed] [Google Scholar]
- Leithner C, Royl G, Offenhauser N, Füchtemeier M, Kohl-Bareis M, Villringer A, Dirnagl U, Lindauer U. Pharmacological uncoupling of activation induced increases in CBF and CMRO(2) J Cereb Blood Flow Metab. 2010;30:311–322. doi: 10.1038/jcbfm.2009.211. [DOI] [PMC free article] [PubMed] [Google Scholar]
- LeMaistre JL, Sanders SA, Stobart MJ, Lu L, Knox JD, Anderson HD, Anderson CM. Coactivation of NMDA receptors by glutamate and d-serine induces dilation of isolated middle cerebral arteries. J Cereb Blood Flow Metab. 2012;32:537–547. doi: 10.1038/jcbfm.2011.161. [DOI] [PMC free article] [PubMed] [Google Scholar]
- Liu X, Li C, Falck JR, Harder DR, Koehler RC. Relative contribution of cyclooxygenases, epoxyeicosatrienoic acids, and pH to the cerebral blood flow response to vibrissal stimulation. Am J Physiol Heart Circ Physiol. 2012;302:H1075–H1085. doi: 10.1152/ajpheart.00794.2011. [DOI] [PMC free article] [PubMed] [Google Scholar]
- Lloyd-Burton S, Roskams AJ. SPARC-like 1 (SC1) is a diversely expressed and developmentally regulated matricellular protein that does not compensate for the absence of SPARC in the CNS. J Comp Neurol. 2012;520:2575–2590. doi: 10.1002/cne.23029. [DOI] [PubMed] [Google Scholar]
- Logothetis NK, Pauls J, Augath M, Trinath T, Oeltermann A. Neurophysiological investigation of the basis of the fMRI signal. Nature. 2001;412:150–157. doi: 10.1038/35084005. [DOI] [PubMed] [Google Scholar]
- Lora M, Denault JB, Leduc R, de Brum-Fernandes AJ. Systematic pharmacological approach to the characterization of NSAIDs. Prostaglandins Leukot Essent Fatty Acids. 1998;59:55–62. doi: 10.1016/S0952-3278(98)90052-7. [DOI] [PubMed] [Google Scholar]
- Lovick TA, Brown LA, Key BJ. Neurovascular relationships in hippocampal slices: physiological and anatomical studies of mechanisms underlying flow-metabolism coupling in intraparenchymal microvessels. Neuroscience. 1999;92:47–60. doi: 10.1016/S0306-4522(98)00737-4. [DOI] [PubMed] [Google Scholar]
- Machwate M, Harada S, Leu CT, Seedor G, Labelle M, Gallant M, Hutchins S, Lachance N, Sawyer N, Slipetz D, Metters KM, Rodan SB, Young R, Rodan GA. Prostaglandin receptor EP(4) mediates the bone anabolic effects of PGE(2) Mol Pharmacol. 2001;60:36–41. doi: 10.1124/mol.60.1.36. [DOI] [PubMed] [Google Scholar]
- Madisen L, Mao T, Koch H, Zhuo JM, Berenyi A, Fujisawa S, Hsu YW, Garcia AJ, 3rd, Gu X, Zanella S, Kidney J, Gu H, Mao Y, Hooks BM, Boyden ES, Buzsáki G, Ramirez JM, Jones AR, Svoboda K, Han X, et al. A toolbox of Cre-dependent optogenetic transgenic mice for light-induced activation and silencing. Nat Neurosci. 2012;15:793–802. doi: 10.1038/nn.3078. [DOI] [PMC free article] [PubMed] [Google Scholar]
- Matsuura T, Takuwa H, Bakalova R, Obata T, Kanno I. Effect of cyclooxygenase-2 on the regulation of cerebral blood flow during neuronal activation in the rat. Neurosci Res. 2009;65:64–70. doi: 10.1016/j.neures.2009.05.006. [DOI] [PubMed] [Google Scholar]
- Maubach KA, Davis RJ, Clark DE, Fenton G, Lockey PM, Clark KL, Oxford AW, Hagan RM, Routledge C, Coleman RA. BGC20–1531, a novel, potent and selective prostanoid EP receptor antagonist: a putative new treatment for migraine headache. Br J Pharmacol. 2009;156:316–327. doi: 10.1111/j.1476-5381.2009.00027.x. [DOI] [PMC free article] [PubMed] [Google Scholar]
- Mazzetti S, Frigerio S, Gelati M, Salmaggi A, Vitellaro-Zuccarello L. Lycopersicon esculentum lectin: an effective and versatile endothelial marker of normal and tumoral blood vessels in the central nervous system. Eur J Histochem. 2004;48:423–428. doi: 10.4081/916. [DOI] [PubMed] [Google Scholar]
- McCaslin AF, Chen BR, Radosevich AJ, Cauli B, Hillman EM. In vivo 3D morphology of astrocyte-vasculature interactions in the somatosensory cortex: implications for neurovascular coupling. J Cereb Blood Flow Metab. 2011;31:795–806. doi: 10.1038/jcbfm.2010.204. [DOI] [PMC free article] [PubMed] [Google Scholar]
- McCormick DA, Connors BW, Lighthall JW, Prince DA. Comparative electrophysiology of pyramidal and sparsely spiny stellate neurons of the neocortex. J Neurophysiol. 1985;54:782–806. doi: 10.1152/jn.1985.54.4.782. [DOI] [PubMed] [Google Scholar]
- Mehl M, Bidmon HJ, Hilbig H, Zilles K, Dringen R, Ullrich V. Prostacyclin synthase is localized in rat, bovine and human neuronal brain cells. Neurosci Lett. 1999;271:187–190. doi: 10.1016/S0304-3940(99)00558-3. [DOI] [PubMed] [Google Scholar]
- Mishra A, O'Farrell FM, Reynell C, Hamilton NB, Hall CN, Attwell D. Imaging pericytes and capillary diameter in brain slices and isolated retinae. Nat Protoc. 2014;9:323–336. doi: 10.1038/nprot.2014.019. [DOI] [PubMed] [Google Scholar]
- Mulligan SJ, MacVicar BA. Calcium transients in astrocyte endfeet cause cerebrovascular constrictions. Nature. 2004;431:195–199. doi: 10.1038/nature02827. [DOI] [PubMed] [Google Scholar]
- Myren M, Baun M, Ploug KB, Jansen-Olesen I, Olesen J, Gupta S. Functional and molecular characterization of prostaglandin E2 dilatory receptors in the rat craniovascular system in relevance to migraine. Cephalalgia. 2010;30:1110–1122. doi: 10.1177/0333102409357957. [DOI] [PubMed] [Google Scholar]
- Myren M, Olesen J, Gupta S. Pharmacological and expression profile of the prostaglandin I(2) receptor in the rat craniovascular system. Vascul Pharmacol. 2011;55:50–58. doi: 10.1016/j.vph.2011.06.004. [DOI] [PubMed] [Google Scholar]
- Nimmerjahn A, Kirchhoff F, Kerr JN, Helmchen F. Sulforhodamine 101 as a specific marker of astroglia in the neocortex in vivo. Nat Methods. 2004;1:31–37. doi: 10.1038/nmeth706. [DOI] [PubMed] [Google Scholar]
- Niwa K, Araki E, Morham SG, Ross ME, Iadecola C. Cyclooxygenase-2 contributes to functional hyperemia in whisker-barrel cortex. J Neurosci. 2000;20:763–770. doi: 10.1523/JNEUROSCI.20-02-00763.2000. [DOI] [PMC free article] [PubMed] [Google Scholar]
- Niwa K, Haensel C, Ross ME, Iadecola C. Cyclooxygenase-1 participates in selected vasodilator responses of the cerebral circulation. Circ Res. 2001;88:600–608. doi: 10.1161/01.RES.88.6.600. [DOI] [PubMed] [Google Scholar]
- Nizar K, Uhlirova H, Tian P, Saisan PA, Cheng Q, Reznichenko L, Weldy KL, Steed TC, Sridhar VB, MacDonald CL, Cui J, Gratiy SL, Sakadzić S, Boas DA, Beka TI, Einevoll GT, Chen J, Masliah E, Dale AM, Silva GA, et al. In vivo stimulus-induced vasodilation occurs without IP3 receptor activation and may precede astrocytic calcium increase. J Neurosci. 2013;33:8411–8422. doi: 10.1523/JNEUROSCI.3285-12.2013. [DOI] [PMC free article] [PubMed] [Google Scholar]
- Norup NA, Lauritzen M. Coupling and uncoupling of activity-dependent increases of neuronal activity and blood flow in rat somatosensory cortex. J Physiol. 2001;533:773–785. doi: 10.1111/j.1469-7793.2001.00773.x. [DOI] [PMC free article] [PubMed] [Google Scholar]
- Oda Y, Kodama S, Tsuchiya S, Inoue M, Miyakawa H. Intracellular calcium elevation during plateau potentials mediated by extrasynaptic NMDA receptor activation in rat hippocampal CA1 pyramidal neurons is primarily due to calcium entry through voltage-gated calcium channels. Eur J Neurosci. 2014;39:1613–1623. doi: 10.1111/ejn.12555. [DOI] [PubMed] [Google Scholar]
- Olah ME, Jackson MF, Li H, Perez Y, Sun HS, Kiyonaka S, Mori Y, Tymianski M, MacDonald JF. Ca2+-dependent induction of TRPM2 currents in hippocampal neurons. J Physiol. 2009;587:965–979. doi: 10.1113/jphysiol.2008.162289. [DOI] [PMC free article] [PubMed] [Google Scholar]
- Pepicelli O, Fedele E, Berardi M, Raiteri M, Levi G, Greco A, Ajmone-Cat MA, Minghetti L. Cyclo-oxygenase-1 and -2 differently contribute to prostaglandin E2 synthesis and lipid peroxidation after in vivo activation of N-methyl-d-aspartate receptors in rat hippocampus. J Neurochem. 2005;93:1561–1567. doi: 10.1111/j.1471-4159.2005.03150.x. [DOI] [PubMed] [Google Scholar]
- Porter JT, McCarthy KD. Hippocampal astrocytes in situ respond to glutamate released from synaptic terminals. J Neurosci. 1996;16:5073–5081. doi: 10.1523/JNEUROSCI.16-16-05073.1996. [DOI] [PMC free article] [PubMed] [Google Scholar]
- Rancillac A, Rossier J, Guille M, Tong XK, Geoffroy H, Amatore C, Arbault S, Hamel E, Cauli B. Glutamatergic control of microvascular tone by distinct GABA neurons in the cerebellum. J Neurosci. 2006;26:6997–7006. doi: 10.1523/JNEUROSCI.5515-05.2006. [DOI] [PMC free article] [PubMed] [Google Scholar]
- Sang N, Zhang J, Marcheselli V, Bazan NG, Chen C. Postsynaptically synthesized prostaglandin E2 (PGE2) modulates hippocampal synaptic transmission via a presynaptic PGE2 EP2 receptor. J Neurosci. 2005;25:9858–9870. doi: 10.1523/JNEUROSCI.2392-05.2005. [DOI] [PMC free article] [PubMed] [Google Scholar]
- Schmidt R, Coste O, Geisslinger G. LC-MS/MS-analysis of prostaglandin E2 and D2 in microdialysis samples of rats. J Chromatogr B Analyt Technol Biomed Life Sci. 2005;826:188–197. doi: 10.1016/j.jchromb.2005.09.001. [DOI] [PubMed] [Google Scholar]
- Schmitz K, de Bruin N, Bishay P, Männich J, Häussler A, Altmann C, Ferreirós N, Lötsch J, Ultsch A, Parnham MJ, Geisslinger G, Tegeder I. R-flurbiprofen attenuates experimental autoimmune encephalomyelitis in mice. EMBO Mol Med. 2014;6:1398–1422. doi: 10.15252/emmm.201404168. [DOI] [PMC free article] [PubMed] [Google Scholar]
- Scott NA, Murphy TH. Hemodynamic responses evoked by neuronal stimulation via channelrhodopsin-2 can be independent of intracortical glutamatergic synaptic transmission. PLoS One. 2012;7:e29859. doi: 10.1371/journal.pone.0029859. [DOI] [PMC free article] [PubMed] [Google Scholar]
- Silva AC, Koretsky AP. Laminar specificity of functional MRI onset times during somatosensory stimulation in rat. Proc Natl Acad Sci U S A. 2002;99:15182–15187. doi: 10.1073/pnas.222561899. [DOI] [PMC free article] [PubMed] [Google Scholar]
- Slanina KA, Schweitzer P. Inhibition of cyclooxygenase-2 elicits a CB1-mediated decrease of excitatory transmission in rat CA1 hippocampus. Neuropharmacology. 2005;49:653–659. doi: 10.1016/j.neuropharm.2005.04.019. [DOI] [PubMed] [Google Scholar]
- Smith CJ, Zhang Y, Koboldt CM, Muhammad J, Zweifel BS, Shaffer A, Talley JJ, Masferrer JL, Seibert K, Isakson PC. Pharmacological analysis of cyclooxygenase-1 in inflammation. Proc Natl Acad Sci U S A. 1998;95:13313–13318. doi: 10.1073/pnas.95.22.13313. [DOI] [PMC free article] [PubMed] [Google Scholar]
- Stark DT, Bazan NG. Synaptic and extrasynaptic NMDA receptors differentially modulate neuronal cyclooxygenase-2 function, lipid peroxidation, and neuroprotection. J Neurosci. 2011;31:13710–13721. doi: 10.1523/JNEUROSCI.3544-11.2011. [DOI] [PMC free article] [PubMed] [Google Scholar]
- Stefanovic B, Bosetti F, Silva AC. Modulatory role of cyclooxygenase-2 in cerebrovascular coupling. Neuroimage. 2006;32:23–32. doi: 10.1016/j.neuroimage.2006.03.014. [DOI] [PubMed] [Google Scholar]
- Stichel CC, Müller CM, Zilles K. Distribution of glial fibrillary acidic protein and vimentin immunoreactivity during rat visual cortex development. J Neurocytol. 1991;20:97–108. doi: 10.1007/BF01279614. [DOI] [PubMed] [Google Scholar]
- Sun W, McConnell E, Pare JF, Xu Q, Chen M, Peng W, Lovatt D, Han X, Smith Y, Nedergaard M. Glutamate-dependent neuroglial calcium signaling differs between young and adult brain. Science. 2013;339:197–200. doi: 10.1126/science.1226740. [DOI] [PMC free article] [PubMed] [Google Scholar]
- Takano T, Tian GF, Peng W, Lou N, Libionka W, Han X, Nedergaard M. Astrocyte-mediated control of cerebral blood flow. Nat Neurosci. 2006;9:260–267. doi: 10.1038/nn1623. [DOI] [PubMed] [Google Scholar]
- Tanaka S, Nakamura T, Sumitani K, Takahashi F, Konishi R, Itano T, Miyamoto O. Stage- and region-specific cyclooxygenase expression and effects of a selective COX-1 inhibitor in the mouse amygdala kindling model. Neurosci Res. 2009;65:79–87. doi: 10.1016/j.neures.2009.05.013. [DOI] [PubMed] [Google Scholar]
- Tang EH, Vanhoutte PM. Gene expression changes of prostanoid synthases in endothelial cells and prostanoid receptors in vascular smooth muscle cells caused by aging and hypertension. Physiol Genomics. 2008;32:409–418. doi: 10.1152/physiolgenomics.00136.2007. [DOI] [PubMed] [Google Scholar]
- Thévenaz P, Ruttimann UE, Unser M. A pyramid approach to subpixel registration based on intensity. IEEE Trans Image Process. 1998;7:27–41. doi: 10.1109/83.650848. [DOI] [PubMed] [Google Scholar]
- Tian P, Teng IC, May LD, Kurz R, Lu K, Scadeng M, Hillman EM, De Crespigny AJ, D'Arceuil HE, Mandeville JB, Marota JJ, Rosen BR, Liu TT, Boas DA, Buxton RB, Dale AM, Devor A. Cortical depth-specific microvascular dilation underlies laminar differences in blood oxygenation level-dependent functional MRI signal. Proc Natl Acad Sci U S A. 2010;107:15246–15251. doi: 10.1073/pnas.1006735107. [DOI] [PMC free article] [PubMed] [Google Scholar]
- Tocco G, Freire-Moar J, Schreiber SS, Sakhi SH, Aisen PS, Pasinetti GM. Maturational regulation and regional induction of cyclooxygenase-2 in rat brain: implications for Alzheimer's disease. Exp Neurol. 1997;144:339–349. doi: 10.1006/exnr.1997.6429. [DOI] [PubMed] [Google Scholar]
- Tsai PS, Kaufhold JP, Blinder P, Friedman B, Drew PJ, Karten HJ, Lyden PD, Kleinfeld D. Correlations of neuronal and microvascular densities in murine cortex revealed by direct counting and colocalization of nuclei and vessels. J Neurosci. 2009;29:14553–14570. doi: 10.1523/JNEUROSCI.3287-09.2009. [DOI] [PMC free article] [PubMed] [Google Scholar]
- Vazquez-Tello A, Fan L, Hou X, Joyal JS, Mancini JA, Quiniou C, Clyman RI, Gobeil F, Jr, Varma DR, Chemtob S. Intracellular-specific colocalization of prostaglandin E2 synthases and cyclooxygenases in the brain. Am J Physiol Regul Integr Comp Physiol. 2004;287:R1155–R1163. doi: 10.1152/ajpregu.00077.2004. [DOI] [PubMed] [Google Scholar]
- Wang H, Hitron IM, Iadecola C, Pickel VM. Synaptic and vascular associations of neurons containing cyclooxygenase-2 and nitric oxide synthase in rat somatosensory cortex. Cereb Cortex. 2005;15:1250–1260. doi: 10.1093/cercor/bhi008. [DOI] [PubMed] [Google Scholar]
- Whiteus C, Freitas C, Grutzendler J. Perturbed neural activity disrupts cerebral angiogenesis during a postnatal critical period. Nature. 2014;505:407–411. doi: 10.1038/nature12821. [DOI] [PMC free article] [PubMed] [Google Scholar]
- Wilhelmsson U, Bushong EA, Price DL, Smarr BL, Phung V, Terada M, Ellisman MH, Pekny M. Redefining the concept of reactive astrocytes as cells that remain within their unique domains upon reaction to injury. Proc Natl Acad Sci U S A. 2006;103:17513–17518. doi: 10.1073/pnas.0602841103. [DOI] [PMC free article] [PubMed] [Google Scholar]
- Woodward DF, Jones RL, Narumiya S. International union of basic and clinical pharmacology: LXXXIII: classification of prostanoid receptors, updating 15 years of progress. Pharmacol Rev. 2011;63:471–538. doi: 10.1124/pr.110.003517. [DOI] [PubMed] [Google Scholar]
- Woolsey TA, Rovainen CM, Cox SB, Henegar MH, Liang GE, Liu D, Moskalenko YE, Sui J, Wei L. Neuronal units linked to microvascular modules in cerebral cortex: response elements for imaging the brain. Cereb Cortex. 1996;6:647–660. doi: 10.1093/cercor/6.5.647. [DOI] [PubMed] [Google Scholar]
- Xie Y, Chen S, Anenberg E, Murphy TH. Resistance of optogenetically evoked motor function to global ischemia and reperfusion in mouse in vivo. J Cereb Blood Flow Metab. 2013;33:1148–1152. doi: 10.1038/jcbfm.2013.89. [DOI] [PMC free article] [PubMed] [Google Scholar]
- Yamagata K, Andreasson KI, Kaufmann WE, Barnes CA, Worley PF. Expression of a mitogen-inducible cyclooxygenase in brain neurons: regulation by synaptic activity and glucocorticoids. Neuron. 1993;11:371–386. doi: 10.1016/0896-6273(93)90192-T. [DOI] [PubMed] [Google Scholar]
- Yang C, Kwan YW, Au AL, Poon CC, Zhang Q, Chan SW, Lee SM, Leung GP. 14,15-Epoxyeicosatrienoic acid induces vasorelaxation through the prostaglandin EP(2) receptors in rat mesenteric artery. Prostaglandins Other Lipid Mediat. 2010;93:44–51. doi: 10.1016/j.prostaglandins.2010.06.004. [DOI] [PubMed] [Google Scholar]
- Zeisel A, Muñoz-Manchado AB, Codeluppi S, Lönnerberg P, La Manno G, Juréus A, Marques S, Munguba H, He L, Betsholtz C, Rolny C, Castelo-Branco G, Hjerling-Leffler J, Linnarsson S. Cell types in the mouse cortex and hippocampus revealed by single-cell RNA-seq. Science. 2015;347:1138–1142. doi: 10.1126/science.aaa1934. [DOI] [PubMed] [Google Scholar]
- Zhou M, Schools GP, Kimelberg HK. Development of GLAST(+) astrocytes and NG2(+) glia in rat hippocampus CA1: mature astrocytes are electrophysiologically passive. J Neurophysiol. 2006;95:134–143. doi: 10.1152/jn.00570.2005. [DOI] [PubMed] [Google Scholar]
- Zlokovic BV. Neurovascular pathways to neurodegeneration in Alzheimer's disease and other disorders. Nat Rev Neurosci. 2011;12:723–738. doi: 10.1038/nrn3114. [DOI] [PMC free article] [PubMed] [Google Scholar]
- Zonta M, Angulo MC, Gobbo S, Rosengarten B, Hossmann KA, Pozzan T, Carmignoto G. Neuron-to-astrocyte signaling is central to the dynamic control of brain microcirculation. Nat Neurosci. 2003;6:43–50. doi: 10.1038/nn980. [DOI] [PubMed] [Google Scholar]