

Abstract
Alzheimer's disease (AD) is the most common cause of dementia. Neuroinflammation appears to play an important role in AD pathogenesis. Ligands of the 18 kDa translocator protein (TSPO), a marker for activated microglia, have been used as positron emission tomography (PET) tracers to reflect neuroinflammation in humans and mouse models. Here, we used the novel TSPO-targeted PET tracer 18F-GE180 (flutriciclamide) to investigate differences in neuroinflammation between young and old WT and APP/PS1dE9 transgenic (Tg) mice. In vivo PET scans revealed an overt age-dependent elevation in whole-brain uptake of 18F-GE180 in both WT and Tg mice, and a significant increase in whole-brain uptake of 18F-GE180 (peak-uptake and retention) in old Tg mice compared with young Tg mice and all WT mice. Similarly, the 18F-GE180 binding potential in hippocampus was highest to lowest in old Tg > old WT > young Tg > young WT mice using MRI coregistration. Ex vivo PET and autoradiography analysis further confirmed our in vivo PET results: enhanced uptake and specific binding (SUV75%) of 18F-GE180 in hippocampus and cortex was highest in old Tg mice followed by old WT, young Tg, and finally young WT mice. 18F-GE180 specificity was confirmed by an in vivo cold tracer competition study. We also examined 18F-GE180 metabolites in 4-month-old WT mice and found that, although total radioactivity declined over 2 h, of the remaining radioactivity, ∼90% was due to parent 18F-GE180. In conclusion, 18F-GE180 PET scans may be useful for longitudinal monitoring of neuroinflammation during AD progression and treatment.
SIGNIFICANCE STATEMENT Microglial activation, a player in Alzheimer's disease (AD) pathogenesis, is thought to reflect neuroinflammation. Using in vivo microPET imaging with a novel TSPO radioligand, 18F-GE180, we detected significantly enhanced neuroinflammation during normal aging in WT mice and in response to AD-associated pathology in APP/PS1dE9 Tg mice, an AD mouse model. Increased uptake and specific binding of 18F-GE180 in whole brain and hippocampus were confirmed by ex vivo PET and autoradiography. The binding specificity and stability of 18F-GE180 was further confirmed by a cold tracer competition study and a metabolite study, respectively. Therefore, 18F-GE180 PET imaging may be useful for longitudinal monitoring of neuroinflammation during AD progression and treatment and may also be useful for other neurodegenerative diseases.
Keywords: Alzheimer's disease, GE180 PET tracer, microglia, neuroinflammation, TSPO
Introduction
Alzheimer's disease (AD) lesions, including senile plaques, are associated with an inflammatory response indicated by the recruitment of activated microglia and astrocytes and increased complement proteins, cytokines, and other immune-related molecules (McGeer et al., 1987; Nagele et al., 2003; Heneka et al., 2005; Heneka et al., 2010; Jacobs and Tavitian, 2012). Neuroinflammation is thought to play an important role in the pathogenesis of AD, although it is unclear when and how it drives the disease process. Initially, neuroinflammatory responses may be a self-defense mechanism to protect the brain during disease and injury (Meda et al., 2001; Morgan et al., 2005; Tuppo and Arias, 2005; Hickman et al., 2008; Winkeler et al., 2010). However, sustained, chronic inflammation appears to exacerbate amyloid-β (Aβ) deposition and may contribute to neuronal dysfunction (Meda et al., 2001; Tan and Seshadri, 2010; Winkeler et al., 2010).
In vivo visualization of microglial activation is now possible using molecular imaging ligands and PET scans. The 18 kDa translocator protein (TSPO) is minimally expressed in the CNS in human and mice under normal physiological conditions, but increases dramatically in microglial cells when activated in response to neuronal damage and inflammation (Benavides et al., 1987; Guilarte et al., 1995; Chen and Guilarte, 2008; Liu et al., 2014), thus establishing TSPO as a target for PET imaging of neuroinflammation. In addition, microglia in the CNS may assume pro-inflammatory (M1) or anti-inflammatory (M2) phenotypes (Mosser and Edwards, 2008), although it remains unclear whether TSPO upregulation corresponds to a pro-inflammatory or anti-inflammatory microglial phenotype or both.
The first generation of TSPO radioligand, 11C-PK11195, has been used clinically for imaging inflammation in a wide variety of diseases over the past 20 years (Chauveau et al., 2008). Although Banati et al. (2014) recently reported that 11C-PK11195 bound TSPO specifically and selectively in WT mice versus TSPO knock-out mice, other studies have indicated that 11C-PK11195 may not be an ideal PET tracer due to its low specificity and signal-to-noise ratio and short half-life (∼20 min) due to its carbon-11 isotope (Imaizumi et al., 2007; Chauveau et al., 2008; Ching et al., 2012). A second-generation TSPO tracer, 18F-GE180 (flutriciclamide), is a tricyclic indole that binds selectively with high affinity to TSPO (Wadsworth et al., 2012). 18F-GE180 and 11C-PK11195 have been compared directly in rats after intrastriatal injection of lipopolysaccharide (LPS) (Dickens et al., 2014) and stroke (Boutin et al., 2015). 18F-GE180 was superior to 11C-PK11195 in detecting in vivo glial activation and both ex vivo and in vivo imaging techniques indicated that 18F-GE180 had a significantly higher binding potential (BP) compared with 11C-PK11195 due to a higher specific binding affinity of GE180 and lower noise in nonspecific regions.
Here, we performed in vivo 18F-GE180 microPET scans to compare neuroinflammation in live young and aged WT and APP/PS1dE9 Tg mice and confirmed our results with ex vivo PET and ex vivo autoradiography (AR). 18F-GE180 PET imaging allowed the detection of both age-related and AD-pathology-associated changes in brain inflammation in mice.
Materials and Methods
Animals.
In vivo and ex vivo imaging was performed in 4- and 26-month-old male C57BL/6 (WT) mice, as well as 4- and 26-month-old male APPswe/PS1dE9 Tg mice (original breeders obtained from The Jackson Laboratory) on the C57BL/6 background (n = 6 per group). APPswe/PS1dE9 Tg mice harbor the Swedish APPK594N/M595L and PS1dE9 (deletion of exon 9) human transgenes under a mouse prion protein promoter (Jankowsky et al., 2004). A cold tracer competition study for tracer specificity was performed using 13-month-old male WT and APP/PS1dE9 Tg mice (n = 2 per group) and a GE180 metabolite study was performed in 4-month-old male WT mice (n = 3 per time point). All animal use was approved by the Harvard Standing Committee for Animal Use and was in compliance with all state and federal regulations.
Double and triple immunofluorescence staining.
To assess the colocalization between TSPO and Aβ, microglia, and astrocytes, double immunofluorescence (IF) labeling was conducted on adjacent frozen brain sections (10 μm) from 26-month-old APP/PS1dE9 Tg mice (n = 4) with the following antibodies: anti-TSPO rabbit mAb (1:200; Abcam), anti-Aβ 6E10 mouse mAb (raised against Aβ1–16 peptide, 1:1000; Covance), anti-Aβ40 mouse mAb (1:200; Covance), anti-Aβ42 mouse mAb (1:200; Covance), anti-CD45 rat mAb (a marker for activated microglia, 1:2000; AbD Serotec), anti-CD68 rat mAb (a marker for activated microglia, 1:2000; AbD Serotec) and anti-GFAP mouse mAb (a marker for astrocytes, 1:500; Sigma-Aldrich). One percent aqueous Thioflavin S (Sigma-Aldrich) was used to visualize fibrillar amyloid in plaques and blood vessels. Similarly, double IF staining of TSPO and Aβ, microglia, or astrocytes was also performed on paraffin-embedded, formalin-fixed human AD brain sections using the following antibodies: anti-human/mouse TSPO rabbit pAb (1:200; Trevigen), anti-Aβ42 mouse mAb (1:200; Covance), anti-human HLA-DR mouse mAb (a marker for human activated microglia, 1:200; NeoMarkers), and anti-GFAP mouse mAb (1:500; Sigma-Aldrich). In addition, triple IF labeling with 6E10/TSPO/CD86 (using a pro-inflammatory microglial marker, rat anti-mouse CD86 mAb, 1:200; BD Biosciences) (Kobayashi et al., 2013) or 6E10/TSPO/CD206 (using an anti-inflammatory microglial marker, goat anti-mouse CD206 pAb, 1:200; R&D Systems) (Han et al., 2014) was performed on 26-month-old APP/PS1dE9 Tg mice. The immunostaining pattern was captured using a Zeiss LSM 710 laser scan confocal microscope with a 63× oil objective.
18F-GE180 radiotracer production.
18F-GE180 was synthesized on the FASTlab synthesizer using a previously published method (Wickstrøm et al., 2014). Briefly, 18F was generated by proton irradiation of 18O-enriched H2O (97% enrichment). After suitable workup, the 18F anion was then reacted with the precursor molecule (GE Healthcare), resulting in the formation of 18F-GE180.
Generation of an MRI template.
A 4-month-old C57BL/6J mouse was anesthetized by isofluorane and underwent coronal T2-weighted, 3D echo-spin MRI imaging at the Brigham and Women's Hospital small animal imaging laboratory core facility. The MRI data were used as an anatomical template for PET coregistration.
In vivo PET, ex vivo PET, and ex vivo AR.
Mice were anesthetized with 3% isoflurane (Baxter Medical) and medical grade oxygen at a rate of 1 L/min. A CT scout scan was done first, followed by a CT scan and a dynamic PET scan. Each mouse received the same dose per gram of body weight, 1.75 μCi/g 18F-GE180 tracer solution by tail vein injection, followed by a 0.1 ml saline flush. Dynamic PET imaging for each mouse was immediately performed for 2 h (in vivo PET) using a small animal PET/CT scanner (eXplore Vista; GE Healthcare). The spatial resolution of the PET scanner was ∼1.6 mm at the center of the field-of-view. The data were acquired in 3D mode at the energy window of 250–700 keV, which yields 4% count sensitivity. After in vivo PET scanning, the mouse was administered an overdose of isoflurane for euthanization. The mouse brain was rapidly removed and sliced into 9 coronal brain slabs (each ∼1 mm-thick). A static ex vivo PET scan was performed on the brain slabs for 10 min. Afterward, the slabs were transferred onto a phosphor plate for overnight exposure to acquire an ex vivo AR image. The plate was read using a Bio-Rad plate scanner and the Quantity One program. Images were acquired at the highest resolution of 50 μm.
Imaging analysis.
The PET data were reconstructed into 2D sinograms (frames: 1 min × 8, 2 min × 6, and 10 min × 10) using Fourier rebinning and the conventional ordered-subsets expectation-maximization algorithm with 16 subsets and 2 iterations. Random and scattered coincidence events were corrected during the image reconstruction. The voxel dimensions of the reconstructed images were 0.3875 × 0.3875 × 0.775 mm3. The volume of interest (VOI) was placed on the whole brain by coregistration with CT images using MMWSK-V imaging analysis software and on hippocampus (HC) using AMIDE imaging analysis software with reference to the MRI template. The tracer uptake in each VOI was estimated as the percentage of injection dose per unit volume (%ID/ml). For static PET images (ex vivo PET), VOI was placed on the combined HC and cortex (CTX) regions on brain slabs 8 and 9 using MMWSK-V imaging analysis software. For ex vivo AR data analysis, regions of interest (ROIs) were drawn in the combined HC and CTX regions on the images obtained by autoradiography. Digital AR images were processed for mean pixel intensity analysis (mean radiotracer uptake) and histogram analysis (specific uptake) using ImageJ software. The standardized uptake value (SUV75%) was calculated using the formula below. SUV75% = number of pixels in the top 25% of the signal/number of pixels in the entire area × 100%. The BP was defined as the ratio of 18F-GE180 uptake in the target region (e.g., SUV in the HC) to uptake in the reference region (SUV in the thalamus). The thalamus served as the reference region in this study because of the lack of TSPO IR in this brain region in APP/PS1dE9 Tg mice (Fig. 1).
Figure 1.

Absence of TSPO IR in thalamus in APP/PS1dE9 Tg mice. Immunohistochemical staining with an anti-Aβ antibody R1282, an anti-TSPO monoclonal antibody, and an anti-Iba-1 antibody (marker for microglia/macrophage) was performed on frozen brain sections from each of four 26-month-old APP/PS1dE9 Tg mice. Representative images showing antibody IR in mouse cortex, hippocampus, cerebellum, striatum, and thalamus are displayed. Although plaque-associated Iba-1 IR was observed in all five brain regions, plaque-associated TSPO IR was observed in cortex, hippocampus, cerebellum, and striatum, but not in thalamus. Therefore, we chose the thalamus as the reference region for our study. Scale bar, 50 μm.
Biodistribution of 18F-GE180 in organs/tissues.
In addition to harvesting the brain after completion of the 2 h of dynamic PET imaging, biosample/tissues/organs were harvested immediately for a biodistribution study. Samples were collected from blood, heart, lung, liver, spleen, left and right kidney, intestine, bladder (without urine), femur bone, brown fat, cerebellum, and tail. The WIZARD2-2480 Automatic Gamma Counter was used to quantify the remaining radioactivity in each sample. All radioactivity values were corrected for decay and normalized by the weight of the sample (% ID/g).
Cold tracer competition study.
Thirteen-month-old WT and APP/PS1dE9 Tg mice were either pre-injected with 1 μm (in 0.2 ml) unlabeled GE180 (“cold” tracer) or pre-injected with 0.2 ml saline and, 10 min later, all mice received an injection of 18F-GE180 (“hot” tracer, ∼450 μCi). All mice received a 5 min CT scan, followed by a 2 h dynamic in vivo PET scan. All mice were killed 2 h after 18F-GE180 injection. Their brains were harvested, sliced, and scanned for 10 min under static ex vivo PET and then exposed overnight to phosphor film for ex vivo AR.
Metabolite study.
Four-month-old WT mice were anesthetized with 3% isoflurane and medical grade oxygen at a rate of 1 L/min and injected with 1 mCi (0.2 ml) tracer into the tail vein, followed by a 0.1 ml saline flush. Each mouse was kept anesthetized and then killed 10, 30, 60, or 120 min after tracer injection (n = 3 per time point). At each time point, blood was collected by cardiac puncture and centrifuged at 5000 × g for 5 min in 0.5 m EDTA-coated microcentrifuge tubes to obtain the plasma. The initial radioactivity in plasma was measured using a gamma-well counter and then diluted with ice-cold 100% acetonitrile (plasma:acetonitrile v:v = 1:10) and vortexed for 1 min. Thereafter, mice were perfused with 20 ml PBS and the brain (minus the cerebellum and medulla/pons), liver, and kidney were removed. The initial radioactivity in brain, liver, and kidney was measured using the well counter. Each tissue sample was homogenized with ice-cold 100% acetonitrile using a rotary blade homogenizer at maximum speed for ∼1 min. The ratio of tissue/acetonitrile (w/v) was 1:10. Centrifugation of the plasma/acetonitrile mixture and tissue homogenates was performed at 4000 × g for 5 min to remove the proteins. After centrifugation, the supernatant of each sample was transferred to a round-bottom flask for rotary evaporation at 40°C. Each sample was reconstituted with 3 ml of the mobile phase (60% acetonitrile) and then filtered through a 0.22 μm filter. The radioactivity in each reconstituted sample was also recorded. Three milliliters of each filtered solution was injected into the Shimadzu HPLC system with a Waters μBondapak C18, 10 μm, 125A, 7.8 × 300 mm. The mobile phase was 60% acetonitrile in water and the flow rate was 3.0 ml/min (isocratic). Quantification of the percent of parent GE180 was calculated using the following formula (the rest of the radioactivity represents metabolites): %GE180 = total GE180 radioactivity/total radioactivity × 100%.
Statistical analysis.
Prism 5.0 software (GraphPad) was used to analyze the data. All data are expressed as mean ± SEM. For group comparisons of pharmacokinetic variables, either one-way or two-way ANOVA followed by post hoc Bonferroni's test for multiple comparisons were performed. A value of p < 0.05 was considered significant for all statistical tests.
Results
Colocalization of TSPO, microglia, and Aβ deposition in APP/PS1dE9 Tg mouse brains
It has been reported that TSPO expression is significantly increased in the activated microglial cells during brain inflammation in AD, Parkinson's disease, and other brain injuries (Benavides et al., 1987; Guilarte et al., 1995; Chen and Guilarte, 2008). In this study, to first confirm the colocalization of TSPO IR with other microglial markers, as well as Aβ and astrocyte markers, double IF staining was used on serial, adjacent frozen brain sections from four ∼26-month-old APP/PS1dE9 Tg mice. We found that TSPO-labeled microglia were strongly associated with Aβ deposition. Some TSPO-positive cells overlapped with Aβ IR, suggesting the possibility of phagocytic clearance of Aβ by TSPO-positive cells (Fig. 2A–D). Activated microglia were identified by CD45 and CD68 immunolabeling. Most of the TSPO IR colocalized with CD45 IR and CD68 IR (yellow labeling represents colocalization in Fig. 2E,F), whereas only a very small amount of TSPO IR overlapped with GFAP IR (Fig. 2G), indicating that TSPO was mainly expressed in activated microglia in APP/PS1dE9 Tg mouse brains. The association of Aβ deposition and TSPO-positive microglia was also observed in human AD brain sections (Fig. 1H–K).
Figure 2.

TSPO IR colocalizes with microglia, especially those associated with Aβ deposits in APP/PS1dE9 Tg mouse and human AD brain. Double IF showed that TSPO IR was closely associated with plaques stained by an anti-Aβ 6E10 (A), an anti-Aβ42 antibody (B), an anti-Aβ40 antibody (C), and thioflavin S (D),and was colocalized with the microglia markers CD45 (E) and CD68 (F), but rarely with the astrocyte marker GFAP (G) in the hippocampus of a 26-month-old APP/PS1dE9 Tg mouse. Similarly, double IF on human AD brain sections indicated that TSPO IR was associated with plaques stained by an anti-Aβ 3A1 (H) and an anti-Aβ42 antibody (I) and was colocalized with the glia markers HLA-DR (J) and, to some degree, GFAP (K). Immunoreactivity of triple IF staining in 26-month-old APP/PS1dE9 Tg mice with anti-CD86 (L), anti-TSPO (M), and 6E10 (N), as well as the merged image (O), showed that TSPO IR colocalized with CD86 IR, a pro-inflammatory phenotypic marker, in microglia that were associated with Aβ plaques. In addition, triple labeling of CD206 (P), TSPO (Q), and 6E10 (R), as well as the merged image (S), indicated that TSPO IR also colocalized with CD206, an anti-inflammatory phenotypic marker, in activated microglia associated with plaques (but not those further away; data not shown). DAPI (blue) was used to indicate the cell nucleus.
To further explore whether TSPO is a selective marker for pro-inflammatory or anti-inflammatory microglia phenotypes, we conducted triple labeling using an anti-Aβ antibody (6E10), anti-TSPO, anti-CD86 (an “M1” pro-inflammatory marker), or anti-CD206 (an “M2” anti-inflammatory marker) in 26-month-old APP/PS1dE9 Tg mouse brain. CD86-positive microglia (Fig. 2L) were closely associated with Aβ plaques (Fig. 2N), whereas CD206-positive microglia (Fig. 2P) were observed both next to the plaque core and in the vicinity surrounding plaques (Fig. 2R) and were also more broadly dispersed throughout the brain. TSPO IR was colocalized with CD86-positive microglia (Fig. 2L,M,O); however, the colocalization of TSPO and CD206 IR was only seen in those microglia that appeared close to Aβ plaques (Fig. 2P,Q,S).
In vivo 18F-GE180 PET imaging detected aging-related and AD-associated elevations in brain inflammation
To investigate the brain uptake of 18F-GE180, 4-month-old male WT mice (young WT, n = 6), 26-month-old male WT mice (old WT, n = 6), 4-month-old male APP/PS1dE9 Tg mice (young APP/PS1, n = 6), and 26-month-old male, plaque-bearing APP/PS1dE9 Tg mice (old APP/PS1, n = 6) were injected with the 18F-GE180 PET tracer. Mice from all four groups showed no significant differences in body and brain (without cerebellum) weight (Fig. 3A,B). A 2 h dynamic PET imaging was performed for each mouse brain and the images were initially reconstructed using 3 time frames (frame 1: 0–30 min, frame 2: 31–60 min, and frame 3: 61–120 min). The brain uptake of 18F-GE180 PET tracer peaked within the first 30 min and was eliminated with time for both WT and APP/PS1dE9 Tg mice (data not shown).
Figure 3.

Whole-brain and hippocampal-specific uptake of 18F-GE180 PET tracer in 4- and 26-month-old WT and APP/PS1dE9 Tg mice. A, No significant differences in mouse body weight were found between the groups. B, Mouse brains (without cerebellum) were removed and weighed 2 h after tracer injection. No significant differences in mouse brain weight were found between groups. C, To quantify the whole-brain uptake of GE180 during the 2 h dynamic PET scan, the VOI was drawn manually on the PET images for each mouse. No significant differences in VOI volume were observed between groups. n = 6 per group. D, E, The sagittal views (D) and time–radioactivity curve (E) of 18F-GE180 uptake in young WT, old WT, young APP/PS1dE9 Tg, and old APP/PS1dE9 Tg mouse whole brains scanned by in vivo PET dynamic acquisition for 2 h. F, Hippocampal VOI was identified by PET/MRI image infusion (a) and the coronal views of 18F-GE180 uptake in brains of young WT (b), old WT (c), young APP/PS1dE9 Tg (d), and old APP/PS1dE9 Tg (e) mice scanned by in vivo PET with coregistration of an MRI anatomical template are shown. G, Time–radioactivity curves in thalamus (reference region) for all groups were obtained from 2 h dynamic PET scans. H, Time–radioactivity curves of relative hippocampal uptake (normalized to the thalamus) were calculated for all groups. Two-way ANOVA with post hoc Bonferroni's test were applied for statistical analysis (data shown in Results). n = 6 per group.
To further investigate the 18F-GE180 PET tracer's uptake properties, especially within the first 30 min, we further reconstructed the 2 h PET images to 24 time frames (frames: 1 min × 8, 2 min × 6, 10 min ×10). The coronal cerebral PET images were fused with CT images for quantification and the whole-brain area as the VOI was outlined manually in each mouse. The VOI size across the mice was very consistent (Fig. 3C). The time–radioactivity curves indicated that the peak brain uptake of 18F-GE180 PET tracer appeared at ∼6 min in WT mice and at ∼4 min in APP/PS1dE9 Tg mice and stabilized after 60 min in both WT and APP/PS1dE9 Tg mice (Fig. 3E). In addition, in vivo PET images revealed an overt, age-dependent elevation in whole-brain uptake of 18F-GE180 (peak-uptake and retention) in WT mice from 4 to 26 months of age (F(1,10) = 61.9, p < 0.001 for main effect of genotype) and a significant increase in whole-brain uptake of 18F-GE180 in old APP/PS1dE9 Tg mice compared with young WT mice (F(1,10) = 83.3, p < 0.001), old WT (F(1,10) = 24.2, p < 0.001) and young APP/PS1dE9 Tg mice (F(1,10) = 45.4, p < 0.001) (Fig. 3D,E).
To gain insight into the region-specific uptake of 18F-GE180, we focused on mouse hippocampus because it is an important and vulnerable brain region in AD and was shown to contain the majority of TSPO and Aβ IR in the APP/PS1dE9 Tg mouse brain. The hippocampal VOI was identified precisely according to coregistration of the PET images with a mouse brain MRI (Fig. 3Fa). Representative PET images in mouse hippocampus for each group are shown in Figure 3, Fb–Fe. The difference in uptake of 18F-GE180 in the hippocampus between groups is displayed (F(3,20) = 72.6, p < 0.001 for main effect of genotype) by plotting the hippocampus-to-thalamus radioactivity ratios (i.e., binding potential) for each scan time (Fig. 3H). Time–radioactivity curves for the relative 18F-GE180 uptake in the hippocampus showed significantly higher tracer uptake in old APP/PS1dE9 Tg mice than in young WT mice (F(1,10) = 55.8, p < 0.001), old WT mice (F(1,10) = 15.4, p = 0.0028), or young APP/PS1dE9 Tg mice (F(1,10) = 43.0, p < 0.001); however, the uptake and retention of 18F-GE180 in the thalamus of young and old APP/PS1dE9 Tg mice were comparable to those of young and old WT mice (Fig. 3G). The significant increase in accumulation of 18F-GE180 PET signal in hippocampus from old APP/PS1dE9 Tg mice versus either WT mice or young Tg mice was accompanied by a dramatic elevation of hippocampal TSPO IR in old APP/PS1dE9 Tg mice versus the other mice (Fig. 4A), which corresponded to a higher BP for APP/PS1dE9 Tg mice (1.66 ± 0.057) compared with the BP for young WT mice (1.03 ± 0.045), old WT mice (1.26 ± 0.056), or young APP/PS1dE9 Tg mice (1.14 ± 0.022). In addition, an age-related increase in hippocampal tracer uptake was observed in the old WT mice (F(1,10) = 6.15, p = 0.0326) compared with young WT mice (Fig. 3H), suggesting that both aging and AD pathogenesis result in an increase in neuroinflammation.
Figure 4.

18F-GE180 PET and AR signal were correlated with TSPO IR in hippocampus in 4- and 26-month-old WT and APP/PS1dE9 Tg mice. Hippocampal TSPO IR (% ROI; black bars) in 4- and 26-month-old WT and APP/PS1dE9 Tg mice was quantified by BioQuant software using % ROI (2 planes per mouse, n = 4–6 mice per group). The hippocampal in vivo PET signal during the 60–90 min period of dynamic acquisition (retention, A), ex vivo PET (B), or ex vivo AR (C) was also calculated, respectively, for each group (n = 6) and correlated with TSPO IR. ***p < 0.001, one-way ANOVA with post hoc Bonferroni's test.
Ex vivo PET and AR imaging confirmed the brain-region-specific increase in neuroinflammation in APP/PS1dE9 mice relative to WT mice
After in vivo PET scanning, the brain was removed and sliced into 9 1-mm-thick coronal slabs. These brain slabs were further scanned by microPET for 10 min to acquire ex vivo PET images. We observed an overt increase in radioactivity in old APP/PS1dE9 Tg mouse brain slabs (Fig. 5D) compared with young WT, old WT, or young APP/PS1dE9 Tg mouse brain slabs (Fig. 5A–C). In addition, we observed an intense accumulation of the GE180 radiotracer in the HC and CTX, which also showed the most TSPO and Aβ IR in the old APP/PS1dE9 Tg mice. Quantification of the radioactivity in the combined VOI of HC and CTX by ex vivo PET revealed a significant increase in radioactivity in brain slices 8 (Fig. 5E) and 9 (Fig. 5F), which contained the largest area of HC and CTX, from old APP/PS1dE9 Tg mice versus young WT mice (p < 0.001, Slices 8 and 9), old WT mice (p < 0.01, slice 8; p < 0.001, slice 9), and young APP/PS1dE9 Tg mice (p < 0.001; slices 8 and 9, one-way ANOVA with post hoc Bonferroni's test).
Figure 5.
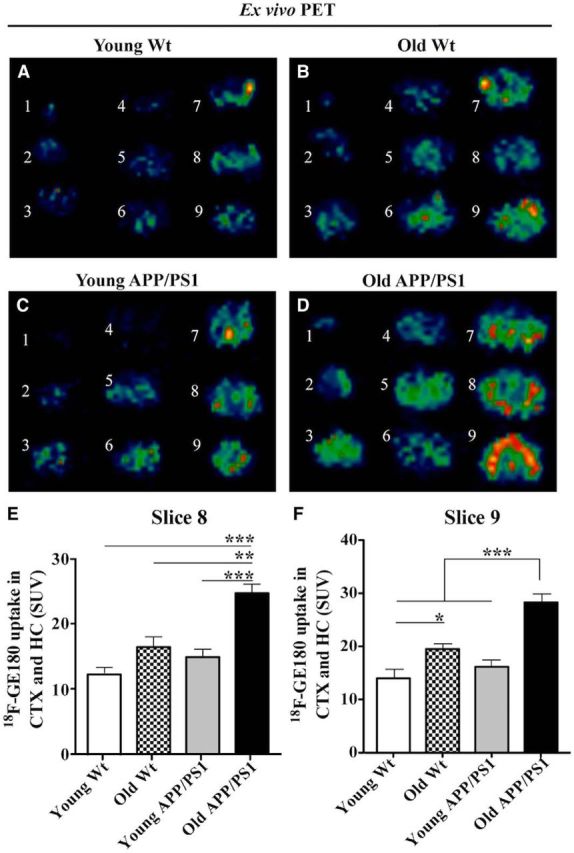
Age- and AD pathology-associated increases in 18F-GE180 uptake in old WT and old APP/PS1dE9 Tg hippocampus (HC) and cortex (CTX) by ex vivo PET analysis. A–D, Representative ex vivo PET images of 1 mm brain slabs of young WT (A), old WT (B), young APP/PS1dE9 Tg (C) and old APP/PS1dE9 Tg (D) mouse brain obtained from 10 min static PET scans. E, Quantification of 18F-GE180 radioactivity in slab 8 was performed in a VOI containing both HC and CTX. F, Uptake of 18F-GE180 in slab 9 was quantified in a VOI containing both HC and CTX. *p < 0.05; **p < 0.01; ***p < 0.001, one-way ANOVA with post hoc Bonferroni's test. n = 6 per group.
Similar to the ex vivo PET images, the ex vivo AR images showed an overall increase in radioactivity in each brain slab from old WT mice and an even further increase in radioactivity in each brain slab from old APP/PS1dE9 Tg mice relative to radioactivity in the brain slabs from young WT and young APP/PS1dE9 Tg mice, respectively (Fig. 6A), suggesting that the uptake of 18F-GE180 was elevated with aging and AD pathogenesis. We further quantified the mean intensity of the 18F-GE180 AR signal, which represents mean tracer uptake, in HC and CTX in brain slabs 8 and 9 by manually drawing an ROI combining HC and CTX (outlined in white in Fig. 6B), followed by normalization with the radioactivity in the ROI of thalamus drawn in slab 8 (outlined by a small white square in Fig. 6B). Figure 6, D and E, illustrates significant increases in 18F-GE180 radioactivity in the HC + CTX combined ROI in brain slices 8 and 9, respectively, from old APP/PS1dE9 Tg mice compared with young WT mice (p < 0.001, slices 8 and 9), old WT mice (p < 0.001, Slice 8; p < 0.05 slice 9), and young APP/PS1dE9 Tg mice (p < 0.001, slices 8 and 9, one-way ANOVA with post hoc Bonferroni's test) mice. In addition, we observed an aging-related elevation in 18F-GE180 radioactivity in the combined ROI in aged WT mice versus young WT mice (p < 0.001, slice 8; p < 0.01, slice 9; one-way ANOVA with post hoc Bonferroni's test).
Figure 6.

Increased 18F-GE180 uptake in aged WT and aged APP/PS1dE9 Tg mouse brains from ex vivo AR analysis. A, Representative ex vivo AR images are shown for young and old WT, as well as young and old APP/PS1dE9 Tg mice. B, C, For quantitative analysis, a combined hippocampal and cortical ROI was drawn on brain slabs 8 and 9 and a reference region in thalamus was drawn (small white square) on brain slab 8 (B). No difference was found in ROI size between groups (C). D, E, 18F-GE180 radioactivity in HC + CTX ROI in slabs 8 (D) and 9 (E) was normalized by the radioactivity in the thalamus ROI and the ratios (relative radioactivity) were compared between groups. F, G, Representative histogram is shown of the ROI in slab 9 from an old WT mouse (F) and an old APP/PS1dE9 Tg mouse (G) that were processed using ImageJ. H, I, Values of SUV75% in ROI in slabs 8 (H) and 9 (I) of all mice were calculated. *p < 0.05; **p < 0.01; ***p < 0.001, one-way ANOVA with post hoc Bonferroni's test. n = 6 per group.
Histogram analysis was used to further compare the specific binding of 18F-GE180 in the HC + CTX combined ROI in brain slabs 8 and 9 between groups. Comparison of the size of the combined ROI (Fig. 6C) indicated that there was no difference between groups upon drawing the ROI for each mouse. Histograms of the combined ROI of old APP/PS1dE9 Tg mice showed a two-peak pattern (Fig. 6G), whereas histograms of the combined ROI of old WT mice showed a one-peak pattern (Fig. 6F). The SUV75% was extracted to define the intensity of 18F-GE180 uptake in the combined ROI in slabs 8 and 9. The SUV75% value indicated that, in slab 8 (Fig. 6H), 0.56 ± 0.12% and 1.38 ± 0.31% of pixels in the ROI in the young and old WT mice (n = 6 per group), respectively, had relatively high intensity, whereas 1.12 ± 0.27% and 4.4 ± 0.66% of pixels in the ROI of the young and old APP/PS1dE9 Tg mice (n = 6 per group), respectively, had high intensity. In slab 9 (Fig. 6I), 0.69 ± 0.04% and 1.40 ± 0.17% of pixels in the ROI in the young and old WT mice, respectively, had relatively high intensity, whereas 0.84 ± 0.12% and 6.08 ± 0.80% of pixels in the ROI of the young and old APP/PS1dE9 Tg mice, respectively, had high intensity. These results suggest significantly higher and more specific 18F-GE180 uptake in HC and CTX of aged APP/PS1dE9 Tg mice (p < 0.001 for slab 8 and 9, one-way ANOVA with post hoc Bonferroni's test) compared with the same brain regions in the young and old WT mice, as well as young APP/PS1dE9 Tg mice (Fig. 6H,I).
Peripheral distribution of the 18F-GE180 radiotracer was similar between the different mouse ages and genotypes
To investigate the peripheral distribution of 18F-GE180, we measured the radioactivity in samples collected 2 h after injection from blood, heart, lung, liver, spleen, left and right kidney, intestine, bladder (without urine), femur bone, brown fat, cerebellum, and tail. We found no significant difference in the distribution of the tracer into the organs/tissues between groups, which may have been due in part to the high variability observed within each group. However, the kidneys, lung, liver, and spleen generally showed higher radioactivity levels compared with other organs. Kidney had the highest amount of radioactivity (per gram) and blood had the lowest among the tissues collected (Fig. 7). The biodistribution of 18F-GE180 in both WT and APP/PS1dE9 Tg mice was generally consistent with the known distribution of TSPO in rodents (Kurumaji and Toru, 1996; Sekimata et al., 2008; Vicidomini et al., 2015) and humans (Anholt et al., 1985; Liu et al., 2003; Bribes et al., 2004) and was similar to that of other TSPO ligands such as 11C-PK11195 (Hirvonen et al., 2010), 11C-PBR28 (Brown et al., 2007), 11C-DPA-713 (Endres et al., 2012), and 18F-PBR06 (Fujimura et al., 2010).
Figure 7.

Biodistribution of 18F-GE180 tracer in organs or tissues. Organs or tissues were collected at 2 h after tracer injection and radioactivity was measured with a WIZARD2-2480 automatic gamma counter with decay correction. n = 3 in the old WT mice group and old APP/PS1dE9 Tg mice group; n = 4 in young WT mice group.
Pre-injection of unlabeled GE180 abolishes the brain uptake of 18F-GE180 radiotracer
To verify the binding specificity of 18F-GE180 radiotracer, we conducted a cold tracer competition study in 13-month-old male APP/PS1dE9 mice and age-matched male WT controls. The whole-brain time–radioactivity curve generated by 2 h of dynamic PET imaging indicated that the APP/PS1dE9 Tg mouse that received a saline injection before the hot (18F-GE180) tracer injection showed an overall higher whole-brain uptake of the 18F-GE180 tracer compared with the age-matched WT mouse that received the same treatment (Fig. 8A,B), which confirmed our earlier results demonstrating increased neuroinflammation in older (26-month-old) APP/PS1dE9 Tg mice compared with age-matched WT mice. Moreover, the in vivo whole-brain uptake of the hot tracer in APP/PS1dE9 Tg mice was strikingly abolished by the pre-injection of cold (unlabeled GE180) tracer, whereas very little difference was seen in whole-brain uptake of hot tracer between WT mice pre-injected with saline or cold tracer.
Figure 8.

Pre-injection of unlabeled GE180 inhibits the binding of 18F-GE180 in mouse brain. A, Sagittal in vivo PET images are shown of 13-month-old WT and APP/PS1dE9 Tg mice that received a pre-injection of saline or unlabeled GE180 (cold) tracer, followed by an injection of 18F-GE180 (hot) tracer. B, Two-hour dynamic in vivo 18F-GE180 PET whole-brain time-activity curves of WT and APP/PS1dE9 Tg mice were generated after pre-injection with either saline or cold tracer. The time frames used for image reconstruction were as follows: 1 min × 8 + 2 min × 6 + 10 min × 10. n = 1 per group. C, Representative ex vivo PET images of brain slabs from the WT and APP/PS1dE9 Tg mice in B are shown. D, Quantification of 18F-GE180 uptake in the combined HC and CTX ROI in slabs 8 and 9 by ex vivo PET analysis revealed higher uptake in the APP/PS1dE9 Tg mice. n = 2 per group. E, Representative ex vivo AR images of brain slabs from the WT and APP/PS1dE9 Tg mice in B and C are shown. F, Quantification of 18F-GE180 uptake in the combined HC and CTX ROI in slabs 8 and 9 by ex vivo AR analysis confirmed our in vivo and ex vivo PET findings of increased uptake in APP/PS1dE9 Tg mice compared with WT mice. The data were normalized by the radioactivity in thalamus. n = 2 per group.
The combined HC and CTX ROI was analyzed for the ex vivo PET images (Fig. 8C,D) and ex vivo AR images (Fig. 8E,F) in mouse brain slabs 8 and 9. Similar to in vivo PET, we observed an overtly greater elevation of radioactivity levels in the combined ROI in saline-preinjected APP/PS1dE9 Tg mice compared with the saline-preinjected WT mice. In addition, APP/PS1dE9 Tg mice that received the cold tracer before hot tracer showed a considerably lower amount of radioactivity in the ROI compared with those that received saline before hot tracer, indicating that the pre-injection of cold tracer specifically blocked the binding/uptake of the 18F-GE180 radiotracer in the HC and CTX. To a lesser extent, injection of cold tracer before hot tracer also inhibited the ex vivo uptake of hot tracer in WT mice.
Low metabolites of 18F-GE180 in mouse brain
To quantify the GE180 PET tracer metabolites and to explore how metabolites change over time, we conducted a metabolite study in 4-month-old male WT mice. All mice received an injection of 1 mCi 18F-GE180 and were then killed at 10, 30, 60, or 120 min after injection. Plasma, brain, kidney, and liver samples were purified and reconstituted in the HPLC mobile phase and then injected into the HPLC for quantification. The total radioactivity in each original sample (initial) and each reconstituted sample (final) was recorded before injection into HPLC. Upon comparison of the initial and final radioactivity levels (decay corrected) within each sample, we found that the radioactivity recovery in the reconstituted plasma, brain, kidney, and liver samples was 77.1 ± 9.0%, 90.8 ± 5.5%, 90.3 ± 7.0%, and 95.6 ± 3.5%, respectively, relative to the initial radioactivity, suggesting there was very little loss of radioactivity during the sample preparation procedure.
The HPLC integrations for mouse brain, kidney, and liver samples showed significant and reliable signals for parent 18F-GE180 anked radiolabeled metabolites (Fig. 9A–C); however, the signal for the mouse plasma samples was below the detectable range of the HPLC radiodetector (Fig. 9D). Notably, parent 18F-GE180 remained at high levels in brain (Fig. 9E), kidney (Fig. 9F), and liver (Fig. 9G) during the 2 h after tracer injection (Table 1, n = 3/time point). In particular, of the total radioactivity, the 18F-GE180 parent was 91.1 ± 2.2% in brain, 98.1 ± 0.94% in kidney, and 96.0 ± 0.39% in liver, respectively, 2 h after injection, suggesting that, even though the total radioactivity declined over 2 h (Fig. 9H), of the remaining radioactivity, >90% was parent 18F-GE180.
Figure 9.

Changes in total metabolites and GE180 in brain, kidney, and liver during the 2 h after tracer injection. Representative HPLC plots for the radioactivity of GE180 and its metabolites in samples of brain (A), kidney (B), liver (C), and plasma (D) collected over the 120 min after tracer injection are shown. E–G, Levels of 18F-GE180 and total metabolites in mouse brains (E), liver (F), and kidney (G) were calculated for samples taken 10, 30, 60, and 120 min after tracer injection. Data quantification was based on the HPLC integration. H, The total radioactivity in mouse plasma, brain, kidney, and liver was reduced over 120 min; however, of the remaining radioactivity, a large portion was parent GE180 in brain, kidney, and blood (as shown in E–G). n = 3/sample/time point.
Table 1.
Quantified HPLC integration for percentage of GE180 parent compound in mouse brain, kidney, and liver at 10, 30, 60, and 120 min after injection
| Time points | Dataset 1 | Dataset 2 | Dataset 3 | % Average parent 18 F-GE180 (n = 3) | %SEM (n = 3) | |
|---|---|---|---|---|---|---|
| % Parent in brain | 10 min | 97.7 | 97.3 | 96.0 | 97.0 | 0.5 |
| 30 min | 97.3 | 95.3 | 96.8 | 96.5 | 0.6 | |
| 60 min | 100.0 | 95.5 | 94.8 | 96.8 | 1.6 | |
| 120 min | 86.8 | 93.7 | 92.9 | 91.1 | 2.2 | |
| % Parent in kidney | 10 min | 98.3 | 98.3 | 97.7 | 98.1 | 0.2 |
| 30 min | 89.9 | 99.6 | 98.0 | 95.9 | 3.0 | |
| 60 min | 98.2 | 97.7 | 98.6 | 98.2 | 0.3 | |
| 120 min | 99.2 | 98.8 | 96.2 | 98.1 | 0.9 | |
| % Parent in liver | 10 min | 94.6 | 94.5 | 94.5 | 94.5 | 0.03 |
| 30 min | 93.8 | 93.8 | 91.4 | 93.0 | 0.8 | |
| 60 min | 95.4 | 95.3 | 92.5 | 94.4 | 0.9 | |
| 120 min | 95.8 | 96.8 | 95.5 | 96.0 | 0.4 |
Discussion
Microglia activation reflects neuroinflammation in the brain. PET imaging using radioligands targeting microglia-associated protein markers/receptors upregulated during microglia activation can be used to detect and quantify brain neuroinflammation. TSPO, an 18KDa protein upregulated with microglia activation, may be useful for monitoring neuroinflammation in the human brain. TSPO is upregulated, not only during pathological insults of the brain, including AD (Yasuno et al., 2012; Kreisl et al., 2013), experimental autoimmune encephalomyelitis (Abourbeh et al., 2012; Mattner et al., 2013), multiple sclerosis (Takano et al., 2013), stroke (Boutin et al., 2013; Lartey et al., 2014), and traumatic brain injury (Wang et al., 2014), but also during normal aging (Gulyás et al., 2011; Varrone et al., 2013). The first TSPO radioligand, 11C-PK11195, was used to image neuroinflammatory changes in animal models of focal ischemia (Rojas et al., 2007; Chen and Guilarte, 2008; Schroeter et al., 2009), in human brain ischemia (Gerhard et al., 2005; Price et al., 2006), and in neurodegenerative diseases (Cagnin et al., 2001; Venneti et al., 2006; Chen and Guilarte, 2008). However, the low specificity of binding to TSPO and very short radioactive half-life of 20 min (11C) makes distribution of this PET tracer difficult and generally requires an on-site cyclotron at the hospital (Doorduin et al., 2009; Carter et al., 2012). Therefore, novel, second-generation, selective TSPO radiotracers with higher affinity and longer-lasting half-lives are under investigation.
18F-GE180, a TSPO PET radiotracer with a longer half-life (18F; 110 min), has high affinity and specificity for TSPO (Wadsworth et al., 2012). A comparison between 18F-GE180 and 11C-PK11195 in rat brains after LPS microinjection demonstrated that 18F-GE180 performed significantly better than 11C-PK11195 for imaging TSPO-associated neuroinflammation by displaying improved BP in both ex vivo and in vivo experiments (Dickens et al., 2014). Here, the 18F-GE180 radio-signal was predominantly localized to the CTX and HC in our aged APP/PS1dE9 Tg mouse brains by in vivo PET, ex vivo PET, and AR imaging. These regions also had the most TSPO IR and Aβ deposition, suggesting that 18F-GE180 reflected the distribution of TSPO-associated neuroinflammation. In our metabolite study, >91% of intact GE180 remained in mouse brain over a 2 h period, suggesting that 18F-GE180 provides a reliable in vivo and ex vivo radio signal for brain imaging due to its low metabolites in brain.
AD, the most common form of dementia, is characterized pathologically by extracellular Aβ neuritic plaques, neuron loss, and intracellular neurofibrillary tangles (Selkoe, 2001). Prominent activation of inflammatory processes is observed in human AD postmortem brain, including activation of microglia, resident tissue macrophages in CNS, and astrocytosis (McGeer et al., 1987; Meda et al., 1995; Akiyama et al., 2000; Wyss-Coray and Mucke, 2002; Heneka and O'Banion, 2007; Chauveau et al., 2009). Another TSPO radioligand, 11C-PBR28, detects differences in neuroinflammation in many brain regions, such as prefrontal and superior temporal CTX and HC, between AD patients and elderly healthy controls (Kreisl et al., 2013). Correlations between 11C-PBR28 binding and neurobehavioral score or 11C-Pittsburgh Compound B binding were observed, implying that in vivo radiotracer binding to TSPO correlated with severity of AD. PET imaging with 11C-DAA1106, another TSPO radioligand, also showed significantly increased BP in AD or mild cognitive impairment compared with age-matched controls (Yasuno et al., 2012). However, other TSPO radiotracers, 11C-vinocetine (Gulyás et al., 2011) and 18F-FEDAA1106 (Varrone et al., 2013), demonstrated increased tracer binding during normal aging, but no significant differences between AD patients and aged healthy controls. Similarly, 18F-DPA-714, another TSPO tracer, failed to distinguish AD patients from healthy subjects (n = 6) (Golla et al., 2015). Differences in radiotracer binding and specificity may underlie these discrepancies.
Here, we used WT and AD mouse models to determine whether neuroinflammation correlates with aging or AD pathology. We found a clear association of TSPO IR and Aβ plaques, immunohistochemical colocalization of TSPO with other microglia markers, and a similar distribution with TSPO PET imaging. Similarly, PET scans with other TSPO tracers including 11C-PK11195 (Venneti et al., 2009; Rapic et al., 2013), DAA1106 (Ji et al., 2008; Maeda et al., 2011), AC-5216 (Maeda et al., 2011), and 18F-PBR-06 (James et al., 2015), using different AD mouse models (APP23, PS19, APP/PS1dE9, or APPL/S), consistently showed tracer uptake in AD mouse CTX and HC, which correlated with the extent of AD pathology.
In the present study, we observed an overt, age-dependent elevation in whole-brain uptake of 18F-GE180 in WT mice from 4 to 26 months of age and a significant increase in whole-brain binding of 18F-GE180 in old APP/PS1dE9 Tg mice compared with young APP/PS1dE9 mice and all WT mice. Hippocampal-specific uptake of 18F-GE180 reflected whole-brain uptake (old Tg > old WT > young Tg > young WT), suggesting that both aging and AD pathogenesis result in increased neuroinflammation. 18F-GE180 uptake (radioactivity) in HC was normalized to 18F-GE180 radioactivity in thalamus, a reference region that lacks of TSPO IR in this AD mouse model. We did not choose the striatum or the cerebellum as reference regions because we observed TSPO and Aβ IR in these regions in aged APP/PS1dE9 Tg mice. Pre-incubation of the radiotracer with cold GE180 significantly reduced 18F-GE180 uptake in HC and CTX of AD Tg mice compared with that measured in the absence of the cold GE180. However, the difference did not reach significance in WT mice. Our results indicate that mouse HC and CTX contain specific binding sites for 18F-GE180. Although ex vivo images cannot be used to estimate TSPO expression because the signal neglects dissociation of the tracer from the receptor, we performed ex vivo imaging because it freezes the tracer pharmacokinetics and therefore provides higher temporal resolution. In addition, ex vivo images offer higher spatial resolution because there is less spill-in signal from surrounding tissues by imaging an isolated slab. Notably, 18F-GE180-generated signals by in vivo PET, ex vivo PET, and ex vivo AR correlated with TSPO IR visualized by IHC in the same mouse brains.
In AD and other neurodegenerative diseases, simultaneous activation of microglia and astrocytes have been observed in brain, even though each may play distinct roles in disease pathogenesis. Both activated microglia and astrocytes overexpress TSPO in abnormal human brains (Vlodavsky and Soustiel, 2007; Cosenza-Nashat et al., 2009). We also observed the colocalization of TSPO IR with microglial markers (CD45 and CD68) and, to a lesser degree, with an astrocyte marker (GFAP) by double IF staining in human AD brain sections.
A previous study using 18F-GE180 found that the TSPO signal was the total sum of the increase in TSPO expression in both the microglia and astrocytes, where the binding coincides (Dickens et al., 2014). In addition, a study in a rat model with selectively induced astrocyte activation and only minimal microglial activation showed that the TSPO radioligands 18F-DPA-714 and 11C-SSR180575 significantly bound to a brain region bearing reactive astrocytes, suggesting that, in addition to activated microglia, astrocytes contribute to the TSPO imaging signal (Lavisse et al., 2012). In APP/PS1dE9 Tg mice, activated microglia and reactive astrocytes colocalize with Aβ plaques in CTX and HC. Here, TSPO IR mainly colocalized with markers for activated microglia, such as CD68 and CD45, but much less with the astrocyte marker GFAP. Therefore, microglia appear to be the primary cell population contributing to the 18F-GE180 PET radiosignal for imaging neuroinflammation in APP/PS1dE9 Tg mouse brain.
Although TSPO upregulation in activated microglia has been demonstrated previously, it was unclear whether TSPO was preferentially expressed in pro-inflammatory or anti-inflammatory microglia. Increased TSPO mRNA and protein levels have been reported in activated BV2 microglia induced by LPS, a pro-inflammatory inducer, whereas multiple pro-inflammatory marker genes, including interleukin-6 (IL-6) and inducible nitric oxide synthase, were suppressed by the TSPO ligand XBD173, implicating a possible correlation of TSPO and pro-inflammatory microglia (Karlstetter et al., 2014). Moreover, a PET imaging study in nonhuman primates given low-dose intravenous LPS showed increased whole-brain uptake of 11C-PBR28 in parallel with elevated serum levels of IL-1β and IL-6, indicating that TSPO may be associated with pro-inflammatory microglial activation (Hannestad et al., 2012). Interestingly, in our study, the triple labeling of Aβ, TSPO, and CD86 (a pro-inflammatory marker) or CD206 (an anti-inflammatory marker) suggested that TSPO colocalized with both CD86 and CD206 markers on activated microglia close to plaques, but not with CD206-positive microglia distant from plaques. Microglial activation has been observed in TSPO knock-out mice, indicating that, although TSPO overexpression appears to reflect microglial activation, TSPO is not required for microglia activation (Banati et al., 2014).
In conclusion, this study reveals that 18F-GE180 is a promising new PET radiotracer for imaging TSPO expression changes in response to neuroinflammation during normal aging and in AD pathogenesis. The binding of 18F-GE180 is specific and stable and its distribution is correlated with the distribution of TSPO and Aβ pathologies. Therefore, PET imaging with the 18F-GE180 radiotracer may be useful for diagnosis, disease progression, and monitoring of treatment effects in human neurodegenerative diseases and animal models, as demonstrated recently in a preclinical treatment study of multiple sclerosis in a rodent model (Airas et al., 2015).
Footnotes
This work was funded by General Electric (Company Sponsor ID A110451.01 to C.A.L. and M.F.D.C.) and the National Institute on Aging–National Institutes of Health (Grant R01 AG040092 to C.A.L.).
V.R., P.A.J., and W.T. are employees of GE Healthcare. The remaining authors declare no competing financial interests.
References
- Abourbeh G, Theze B, Maroy R, Dubois A, Brulon V, Fontyn Y, Dollé F, Tavitian B, Boisgard R. Imaging microglial/macrophage activation in spinal cords of experimental autoimmune encephalomyelitis rats by positron emission tomography using the mitochondrial 18 kDa translocator protein radioligand [(1)(8)F]DPA-714. J Neurosci. 2012;32:5728–5736. doi: 10.1523/JNEUROSCI.2900-11.2012. [DOI] [PMC free article] [PubMed] [Google Scholar]
- Airas L, Dickens AM, Elo P, Marjamäki P, Johansson J, Eskola O, Jones PA, Trigg W, Solin O, Haaparanta-Solin M, Anthony DC, Rinne J. In vivo PET imaging demonstrates diminished microglial activation after fingolimod treatment in an animal model of multiple sclerosis. J Nucl Med. 2015;56:305–310. doi: 10.2967/jnumed.114.149955. [DOI] [PubMed] [Google Scholar]
- Akiyama H, Barger S, Barnum S, Bradt B, Bauer J, Cole GM, Cooper NR, Eikelenboom P, Emmerling M, Fiebich BL, Finch CE, Frautschy S, Griffin WS, Hampel H, Hull M, Landreth G, Lue L, Mrak R, Mackenzie IR, McGeer PL, et al. Inflammation and Alzheimer's disease. Neurobiol Aging. 2000;21:383–421. doi: 10.1016/S0197-4580(00)00124-X. [DOI] [PMC free article] [PubMed] [Google Scholar]
- Anholt RR, De Souza EB, Oster-Granite ML, Snyder SH. Peripheral-type benzodiazepine receptors: autoradiographic localization in whole-body sections of neonatal rats. J Pharmacol Exp Ther. 1985;233:517–526. [PubMed] [Google Scholar]
- Banati RB, Middleton RJ, Chan R, Hatty CR, Kam WW, Quin C, Graeber MB, Parmar A, Zahra D, Callaghan P, Fok S, Howell NR, Gregoire M, Szabo A, Pham T, Davis E, Liu GJ. Positron emission tomography and functional characterization of a complete PBR/TSPO knockout. Nat Commun. 2014;5:5452. doi: 10.1038/ncomms6452. [DOI] [PMC free article] [PubMed] [Google Scholar]
- Benavides J, Fage D, Carter C, Scatton B. Peripheral type benzodiazepine binding sites are a sensitive indirect index of neuronal damage. Brain Res. 1987;421:167–172. doi: 10.1016/0006-8993(87)91287-X. [DOI] [PubMed] [Google Scholar]
- Boutin H, Prenant C, Maroy R, Galea J, Greenhalgh AD, Smigova A, Cawthorne C, Julyan P, Wilkinson SM, Banister SD, Brown G, Herholz K, Kassiou M, Rothwell NJ. [18F]DPA-714: direct comparison with [11C]PK11195 in a model of cerebral ischemia in rats. PLoS One. 2013;8:e56441. doi: 10.1371/journal.pone.0056441. [DOI] [PMC free article] [PubMed] [Google Scholar]
- Boutin H, Murray K, Pradillo J, Maroy R, Smigova A, Gerhard A, Jones PA, Trigg W. (18)F-GE-180: a novel TSPO radiotracer compared to (11)C-R-PK11195 in a preclinical model of stroke. Eur J Nucl Med Mol Imaging. 2015;42:503–511. doi: 10.1007/s00259-014-2939-8. [DOI] [PubMed] [Google Scholar]
- Bribes E, Carrière D, Goubet C, Galiègue S, Casellas P, Simony-Lafontaine J. Immunohistochemical assessment of the peripheral benzodiazepine receptor in human tissues. J Histochem Cytochem. 2004;52:19–28. doi: 10.1177/002215540405200103. [DOI] [PubMed] [Google Scholar]
- Brown AK, Fujita M, Fujimura Y, Liow JS, Stabin M, Ryu YH, Imaizumi M, Hong J, Pike VW, Innis RB. Radiation dosimetry and biodistribution in monkey and man of 11C-PBR28: a PET radioligand to image inflammation. J Nucl Med. 2007;48:2072–2079. doi: 10.2967/jnumed.107.044842. [DOI] [PubMed] [Google Scholar]
- Cagnin A, Brooks DJ, Kennedy AM, Gunn RN, Myers R, Turkheimer FE, Jones T, Banati RB. In-vivo measurement of activated microglia in dementia. Lancet. 2001;358:461–467. doi: 10.1016/S0140-6736(01)05625-2. [DOI] [PubMed] [Google Scholar]
- Carter SF, Schöll M, Almkvist O, Wall A, Engler H, Langstrom B, Nordberg A. Evidence for astrocytosis in prodromal Alzheimer disease provided by 11C-deuterium-L-deprenyl: a multitracer PET paradigm combining 11C-Pittsburgh compound B and 18F-FDG. J Nucl Med. 2012;53:37–46. doi: 10.2967/jnumed.110.087031. [DOI] [PubMed] [Google Scholar]
- Chauveau F, Boutin H, Van Camp N, Dollé F, Tavitian B. Nuclear imaging of neuroinflammation: a comprehensive review of [11C]PK11195 challengers. Eur J Nucl Med Mol Imaging. 2008;35:2304–2319. doi: 10.1007/s00259-008-0908-9. [DOI] [PubMed] [Google Scholar]
- Chauveau F, Van Camp N, Dollé F, Kuhnast B, Hinnen F, Damont A, Boutin H, James M, Kassiou M, Tavitian B. Comparative evaluation of the translocator protein radioligands 11C-DPA-713, 18F-DPA-714, and 11C-PK11195 in a rat model of acute neuroinflammation. J Nucl Med. 2009;50:468–476. doi: 10.2967/jnumed.108.058669. [DOI] [PubMed] [Google Scholar]
- Chen MK, Guilarte TR. Translocator protein 18 kDa (TSPO): molecular sensor of brain injury and repair. Pharmacol Ther. 2008;118:1–17. doi: 10.1016/j.pharmthera.2007.12.004. [DOI] [PMC free article] [PubMed] [Google Scholar]
- Ching AS, Kuhnast B, Damont A, Roeda D, Tavitian B, Dollé F. Current paradigm of the 18-kDa translocator protein (TSPO) as a molecular target for PET imaging in neuroinflammation and neurodegenerative diseases. Insights Imaging. 2012;3:111–119. doi: 10.1007/s13244-011-0128-x. [DOI] [PMC free article] [PubMed] [Google Scholar]
- Cosenza-Nashat M, Zhao ML, Suh HS, Morgan J, Natividad R, Morgello S, Lee SC. Expression of the translocator protein of 18 kDa by microglia, macrophages and astrocytes based on immunohistochemical localization in abnormal human brain. Neuropathol Appl Neurobiol. 2009;35:306–328. doi: 10.1111/j.1365-2990.2008.01006.x. [DOI] [PMC free article] [PubMed] [Google Scholar]
- Dickens AM, Vainio S, Marjamäki P, Johansson J, Lehtiniemi P, Rokka J, Rinne J, Solin O, Haaparanta-Solin M, Jones PA, Trigg W, Anthony DC, Airas L. Detection of microglial activation in an acute model of neuroinflammation using PET and radiotracers 11C-(R)-PK11195 and 18F-GE-180. J Nucl Med. 2014;55:466–472. doi: 10.2967/jnumed.113.125625. [DOI] [PubMed] [Google Scholar]
- Doorduin J, Klein HC, Dierckx RA, James M, Kassiou M, de Vries EF. [11C]-DPA-713 and [18F]-DPA-714 as new PET tracers for TSPO: a comparison with [11C]-(R)-PK11195 in a rat model of herpes encephalitis. Mol Imaging Biol. 2009;11:386–398. doi: 10.1007/s11307-009-0211-6. [DOI] [PMC free article] [PubMed] [Google Scholar]
- Endres CJ, Coughlin JM, Gage KL, Watkins CC, Kassiou M, Pomper MG. Radiation dosimetry and biodistribution of the TSPO ligand 11C-DPA-713 in humans. J Nucl Med. 2012;53:330–335. doi: 10.2967/jnumed.111.094565. [DOI] [PMC free article] [PubMed] [Google Scholar]
- Fujimura Y, Kimura Y, Siméon FG, Dickstein LP, Pike VW, Innis RB, Fujita M. Biodistribution and radiation dosimetry in humans of a new PET ligand, (18)F-PBR06, to image translocator protein (18 kDa) J Nucl Med. 2010;51:145–149. doi: 10.2967/jnumed.109.068064. [DOI] [PMC free article] [PubMed] [Google Scholar]
- Gerhard A, Schwarz J, Myers R, Wise R, Banati RB. Evolution of microglial activation in patients after ischemic stroke: a [11C](R)-PK11195 PET study. Neuroimage. 2005;24:591–595. doi: 10.1016/j.neuroimage.2004.09.034. [DOI] [PubMed] [Google Scholar]
- Golla SS, Boellaard R, Oikonen V, Hoffmann A, van Berckel BN, Windhorst AD, Virta J, Haaparanta-Solin M, Luoto P, Savisto N, Solin O, Valencia R, Thiele A, Eriksson J, Schuit RC, Lammertsma AA, Rinne JO. Quantification of [18F]DPA-714 binding in the human brain: initial studies in healthy controls and Alzheimer's disease patients. J Cereb Blood Flow Metab. 2015;35:766–772. doi: 10.1038/jcbfm.2014.261. [DOI] [PMC free article] [PubMed] [Google Scholar]
- Guilarte TR, Kuhlmann AC, O'Callaghan JP, Miceli RC. Enhanced expression of peripheral benzodiazepine receptors in trimethyltin-exposed rat brain: a biomarker of neurotoxicity. Neurotoxicology. 1995;16:441–450. [PubMed] [Google Scholar]
- Gulyás B, Vas A, Tóth M, Takano A, Varrone A, Cselenyi Z, Schain M, Mattsson P, Halldin C. Age and disease related changes in the translocator protein (TSPO) system in the human brain: positron emission tomography measurements with [11C]vinpocetine. Neuroimage. 2011;56:1111–1121. doi: 10.1016/j.neuroimage.2011.02.020. [DOI] [PubMed] [Google Scholar]
- Han Z, Shen F, He Y, Degos V, Camus M, Maze M, Young WL, Su H. Activation of alpha-7 nicotinic acetylcholine receptor reduces ischemic stroke injury through reduction of pro-inflammatory macrophages and oxidative stress. PLoS One. 2014;9:e105711. doi: 10.1371/journal.pone.0105711. [DOI] [PMC free article] [PubMed] [Google Scholar]
- Hannestad J, Gallezot JD, Schafbauer T, Lim K, Kloczynski T, Morris ED, Carson RE, Ding YS, Cosgrove KP. Endotoxin-induced systemic inflammation activates microglia: [(1)(1)C]PBR28 positron emission tomography in nonhuman primates. Neuroimage. 2012;63:232–239. doi: 10.1016/j.neuroimage.2012.06.055. [DOI] [PMC free article] [PubMed] [Google Scholar]
- Heneka MT, O'Banion MK. Inflammatory processes in Alzheimer's disease. J Neuroimmunol. 2007;184:69–91. doi: 10.1016/j.jneuroim.2006.11.017. [DOI] [PubMed] [Google Scholar]
- Heneka MT, Sastre M, Dumitrescu-Ozimek L, Hanke A, Dewachter I, Kuiperi C, O'Banion K, Klockgether T, Van Leuven F, Landreth GE. Acute treatment with the PPARgamma agonist pioglitazone and ibuprofen reduces glial inflammation and Abeta1–42 levels in APPV717I transgenic mice. Brain. 2005;128:1442–1453. doi: 10.1093/brain/awh452. [DOI] [PubMed] [Google Scholar]
- Heneka MT, O'Banion MK, Terwel D, Kummer MP. Neuroinflammatory processes in Alzheimer's disease. J Neural Transm. 2010;117:919–947. doi: 10.1007/s00702-010-0438-z. [DOI] [PubMed] [Google Scholar]
- Hickman SE, Allison EK, El Khoury J. Microglial dysfunction and defective beta-amyloid clearance pathways in aging Alzheimer's disease mice. J Neurosci. 2008;28:8354–8360. doi: 10.1523/JNEUROSCI.0616-08.2008. [DOI] [PMC free article] [PubMed] [Google Scholar]
- Hirvonen J, Roivainen A, Virta J, Helin S, Någren K, Rinne JO. Human biodistribution and radiation dosimetry of 11C-(R)-PK11195, the prototypic PET ligand to image inflammation. Eur J Nucl Med Mol Imaging. 2010;37:606–612. doi: 10.1007/s00259-009-1298-3. [DOI] [PubMed] [Google Scholar]
- Imaizumi M, Kim HJ, Zoghbi SS, Briard E, Hong J, Musachio JL, Ruetzler C, Chuang DM, Pike VW, Innis RB, Fujita M. PET imaging with [11C]PBR28 can localize and quantify upregulated peripheral benzodiazepine receptors associated with cerebral ischemia in rat. Neurosci Lett. 2007;411:200–205. doi: 10.1016/j.neulet.2006.09.093. [DOI] [PubMed] [Google Scholar]
- Jacobs AH, Tavitian B, INMiND consortium Noninvasive molecular imaging of neuroinflammation. J Cereb Blood Flow Metab. 2012;32:1393–1415. doi: 10.1038/jcbfm.2012.53. [DOI] [PMC free article] [PubMed] [Google Scholar]
- James ML, Belichenko NP, Nguyen TV, Andrews LE, Ding Z, Liu H, Bodapati D, Arksey N, Shen B, Cheng Z, Wyss-Coray T, Gambhir SS, Longo FM, Chin FT. PET imaging of translocator protein (18 kDa) in a mouse model of Alzheimer's disease using N-(2,5-dimethoxybenzyl)-2–18F-fluoro-N-(2-phenoxyphenyl)acetamide. J Nucl Med. 2015;56:311–316. doi: 10.2967/jnumed.114.141648. [DOI] [PMC free article] [PubMed] [Google Scholar]
- Jankowsky JL, Fadale DJ, Anderson J, Xu GM, Gonzales V, Jenkins NA, Copeland NG, Lee MK, Younkin LH, Wagner SL, Younkin SG, Borchelt DR. Mutant presenilins specifically elevate the levels of the 42 residue beta-amyloid peptide in vivo: evidence for augmentation of a 42-specific gamma secretase. Hum Mol Genet. 2004;13:159–170. doi: 10.1093/hmg/ddh019. [DOI] [PubMed] [Google Scholar]
- Ji B, Maeda J, Sawada M, Ono M, Okauchi T, Inaji M, Zhang MR, Suzuki K, Ando K, Staufenbiel M, Trojanowski JQ, Lee VM, Higuchi M, Suhara T. Imaging of peripheral benzodiazepine receptor expression as biomarkers of detrimental versus beneficial glial responses in mouse models of Alzheimer's and other CNS pathologies. J Neurosci. 2008;28:12255–12267. doi: 10.1523/JNEUROSCI.2312-08.2008. [DOI] [PMC free article] [PubMed] [Google Scholar]
- Karlstetter M, Nothdurfter C, Aslanidis A, Moeller K, Horn F, Scholz R, Neumann H, Weber BH, Rupprecht R, Langmann T. Translocator protein (18 kDa) (TSPO) is expressed in reactive retinal microglia and modulates microglial inflammation and phagocytosis. J Neuroinflammation. 2014;11:3. doi: 10.1186/1742-2094-11-3. [DOI] [PMC free article] [PubMed] [Google Scholar]
- Kobayashi K, Imagama S, Ohgomori T, Hirano K, Uchimura K, Sakamoto K, Hirakawa A, Takeuchi H, Suzumura A, Ishiguro N, Kadomatsu K. Minocycline selectively inhibits M1 polarization of microglia. Cell Death Dis. 2013;4:e525. doi: 10.1038/cddis.2013.54. [DOI] [PMC free article] [PubMed] [Google Scholar]
- Kreisl WC, Lyoo CH, McGwier M, Snow J, Jenko KJ, Kimura N, Corona W, Morse CL, Zoghbi SS, Pike VW, McMahon FJ, Turner RS, Innis RB, Biomarkers Consortium PET Radioligand Project Team In vivo radioligand binding to translocator protein correlates with severity of Alzheimer's disease. Brain. 2013;136:2228–2238. doi: 10.1093/brain/awt145. [DOI] [PMC free article] [PubMed] [Google Scholar]
- Kurumaji A, Toru M. Postnatal development of peripheral-type benzodiazepine receptors in rat brain and peripheral tissues. Brain Res Dev Brain Res. 1996;97:148–151. doi: 10.1016/S0165-3806(96)00150-2. [DOI] [PubMed] [Google Scholar]
- Lartey FM, Ahn GO, Shen B, Cord KT, Smith T, Chua JY, Rosenblum S, Liu H, James ML, Chernikova S, Lee SW, Pisani LJ, Tirouvanziam R, Chen JW, Palmer TD, Chin FT, Guzman R, Graves EE, Loo BW., Jr PET imaging of stroke-induced neuroinflammation in mice using [18F]PBR06. Mol Imaging Biol. 2014;16:109–117. doi: 10.1007/s11307-013-0664-5. [DOI] [PMC free article] [PubMed] [Google Scholar]
- Lavisse S, Guillermier M, Hérard AS, Petit F, Delahaye M, Van Camp N, Ben Haim L, Lebon V, Remy P, Dollé F, Delzescaux T, Bonvento G, Hantraye P, Escartin C. Reactive astrocytes overexpress TSPO and are detected by TSPO positron emission tomography imaging. J Neurosci. 2012;32:10809–10818. doi: 10.1523/JNEUROSCI.1487-12.2012. [DOI] [PMC free article] [PubMed] [Google Scholar]
- Liu GJ, Middleton RJ, Hatty CR, Kam WW, Chan R, Pham T, Harrison-Brown M, Dodson E, Veale K, Banati RB. The 18 kDa translocator protein, microglia and neuroinflammation. Brain Pathol. 2014;24:631–653. doi: 10.1111/bpa.12196. [DOI] [PMC free article] [PubMed] [Google Scholar]
- Liu J, Matyakhina L, Han Z, Sandrini F, Bei T, Stratakis CA, Papadopoulos V. Molecular cloning, chromosomal localization of human peripheral-type benzodiazepine receptor and PKA regulatory subunit type 1A (PRKAR1A)-associated protein PAP7, and studies in PRKAR1A mutant cells and tissues. FASEB J. 2003;17:1189–1191. doi: 10.1096/fj.02-1066fje. [DOI] [PubMed] [Google Scholar]
- Maeda J, Zhang MR, Okauchi T, Ji B, Ono M, Hattori S, Kumata K, Iwata N, Saido TC, Trojanowski JQ, Lee VM, Staufenbiel M, Tomiyama T, Mori H, Fukumura T, Suhara T, Higuchi M. In vivo positron emission tomographic imaging of glial responses to amyloid-beta and tau pathologies in mouse models of Alzheimer's disease and related disorders. J Neurosci. 2011;31:4720–4730. doi: 10.1523/JNEUROSCI.3076-10.2011. [DOI] [PMC free article] [PubMed] [Google Scholar]
- Mattner F, Staykova M, Berghofer P, Wong HJ, Fordham S, Callaghan P, Jackson T, Pham T, Gregoire MC, Zahra D, Rahardjo G, Linares D, Katsifis A. Central nervous system expression and PET imaging of the translocator protein in relapsing-remitting experimental autoimmune encephalomyelitis. J Nucl Med. 2013;54:291–298. doi: 10.2967/jnumed.112.108894. [DOI] [PubMed] [Google Scholar]
- McGeer PL, Itagaki S, Tago H, McGeer EG. Reactive microglia in patients with senile dementia of the Alzheimer type are positive for the histocompatibility glycoprotein HLA-DR. Neurosci Lett. 1987;79:195–200. doi: 10.1016/0304-3940(87)90696-3. [DOI] [PubMed] [Google Scholar]
- Meda L, Cassatella MA, Szendrei GI, Otvos L, Jr, Baron P, Villalba M, Ferrari D, Rossi F. Activation of microglial cells by beta-amyloid protein and interferon-gamma. Nature. 1995;374:647–650. doi: 10.1038/374647a0. [DOI] [PubMed] [Google Scholar]
- Meda L, Baron P, Scarlato G. Glial activation in Alzheimer's disease: the role of Abeta and its associated proteins. Neurobiol Aging. 2001;22:885–893. doi: 10.1016/S0197-4580(01)00307-4. [DOI] [PubMed] [Google Scholar]
- Morgan D, Gordon MN, Tan J, Wilcock D, Rojiani AM. Dynamic complexity of the microglial activation response in transgenic models of amyloid deposition: implications for Alzheimer therapeutics. J Neuropathol Exp Neurol. 2005;64:743–753. doi: 10.1097/01.jnen.0000178444.33972.e0. [DOI] [PubMed] [Google Scholar]
- Mosser DM, Edwards JP. Exploring the full spectrum of macrophage activation. Nat Rev Immunol. 2008;8:958–969. doi: 10.1038/nri2448. [DOI] [PMC free article] [PubMed] [Google Scholar]
- Nagele RG, D'Andrea MR, Lee H, Venkataraman V, Wang HY. Astrocytes accumulate A beta 42 and give rise to astrocytic amyloid plaques in Alzheimer disease brains. Brain Res. 2003;971:197–209. doi: 10.1016/S0006-8993(03)02361-8. [DOI] [PubMed] [Google Scholar]
- Price CJ, Wang D, Menon DK, Guadagno JV, Cleij M, Fryer T, Aigbirhio F, Baron JC, Warburton EA. Intrinsic activated microglia map to the peri-infarct zone in the subacute phase of ischemic stroke. Stroke. 2006;37:1749–1753. doi: 10.1161/01.STR.0000226980.95389.0b. [DOI] [PubMed] [Google Scholar]
- Rapic S, Backes H, Viel T, Kummer MP, Monfared P, Neumaier B, Vollmar S, Hoehn M, Van der Linden A, Heneka MT, Jacobs AH. Imaging microglial activation and glucose consumption in a mouse model of Alzheimer's disease. Neurobiol Aging. 2013;34:351–354. doi: 10.1016/j.neurobiolaging.2012.04.016. [DOI] [PubMed] [Google Scholar]
- Rojas S, Martín A, Arranz MJ, Pareto D, Purroy J, Verdaguer E, Llop J, Gómez V, Gispert JD, Millán O, Chamorro A, Planas AM. Imaging brain inflammation with [(11)C]PK11195 by PET and induction of the peripheral-type benzodiazepine receptor after transient focal ischemia in rats. J Cereb Blood Flow Metab. 2007;27:1975–1986. doi: 10.1038/sj.jcbfm.9600500. [DOI] [PubMed] [Google Scholar]
- Schroeter M, Dennin MA, Walberer M, Backes H, Neumaier B, Fink GR, Graf R. Neuroinflammation extends brain tissue at risk to vital peri-infarct tissue: a double tracer [11C]PK11195- and [18F]FDG-PET study. J Cereb Blood Flow Metab. 2009;29:1216–1225. doi: 10.1038/jcbfm.2009.36. [DOI] [PubMed] [Google Scholar]
- Sekimata K, Hatano K, Ogawa M, Abe J, Magata Y, Biggio G, Serra M, Laquintana V, Denora N, Latrofa A, Trapani G, Liso G, Ito K. Radiosynthesis and in vivo evaluation of N-[11C]methylated imidazopyridineacetamides as PET tracers for peripheral benzodiazepine receptors. Nucl Med Biol. 2008;35:327–334. doi: 10.1016/j.nucmedbio.2007.12.005. [DOI] [PubMed] [Google Scholar]
- Selkoe DJ. Alzheimer's disease: genes, proteins, and therapy. Physiol Rev. 2001;81:741–766. doi: 10.1152/physrev.2001.81.2.741. [DOI] [PubMed] [Google Scholar]
- Takano A, Piehl F, Hillert J, Varrone A, Nag S, Gulyás B, Stenkrona P, Villemagne VL, Rowe CC, Macdonell R, Tawil NA, Kucinski T, Zimmermann T, Schultze-Mosgau M, Thiele A, Hoffmann A, Halldin C. In vivo TSPO imaging in patients with multiple sclerosis: a brain PET study with [18F]FEDAA1106. EJNMMI Res. 2013;3:30. doi: 10.1186/2191-219X-3-30. [DOI] [PMC free article] [PubMed] [Google Scholar]
- Tan ZS, Seshadri S. Inflammation in the Alzheimer's disease cascade: culprit or innocent bystander? Alzheimers Res Ther. 2010;2:6. doi: 10.1186/alzrt29. [DOI] [PMC free article] [PubMed] [Google Scholar]
- Tuppo EE, Arias HR. The role of inflammation in Alzheimer's disease. Int J Biochem Cell Biol. 2005;37:289–305. doi: 10.1016/j.biocel.2004.07.009. [DOI] [PubMed] [Google Scholar]
- Varrone A, Mattsson P, Forsberg A, Takano A, Nag S, Gulyás B, Borg J, Boellaard R, Al-Tawil N, Eriksdotter M, Zimmermann T, Schultze-Mosgau M, Thiele A, Hoffmann A, Lammertsma AA, Halldin C. In vivo imaging of the 18-kDa translocator protein (TSPO) with [18F]FEDAA1106 and PET does not show increased binding in Alzheimer's disease patients. Eur J Nucl Med Mol Imaging. 2013;40:921–931. doi: 10.1007/s00259-013-2359-1. [DOI] [PubMed] [Google Scholar]
- Venneti S, Lopresti BJ, Wiley CA. The peripheral benzodiazepine receptor (translocator protein 18kDa) in microglia: from pathology to imaging. Prog Neurobiol. 2006;80:308–322. doi: 10.1016/j.pneurobio.2006.10.002. [DOI] [PMC free article] [PubMed] [Google Scholar]
- Venneti S, Lopresti BJ, Wang G, Hamilton RL, Mathis CA, Klunk WE, Apte UM, Wiley CA. PK11195 labels activated microglia in Alzheimer's disease and in vivo in a mouse model using PET. Neurobiol Aging. 2009;30:1217–1226. doi: 10.1016/j.neurobiolaging.2007.11.005. [DOI] [PMC free article] [PubMed] [Google Scholar]
- Vicidomini C, Panico M, Greco A, Gargiulo S, Coda AR, Zannetti A, Gramanzini M, Roviello GN, Quarantelli M, Alfano B, Tavitian B, Dollé F, Salvatore M, Brunetti A, Pappatà S. In vivo imaging and characterization of [(18)F]DPA-714, a potential new TSPO ligand, in mouse brain and peripheral tissues using small-animal PET. Nucl Med Biol. 2015;42:309–316. doi: 10.1016/j.nucmedbio.2014.11.009. [DOI] [PubMed] [Google Scholar]
- Vlodavsky E, Soustiel JF. Immunohistochemical expression of peripheral benzodiazepine receptors in human astrocytomas and its correlation with grade of malignancy, proliferation, apoptosis and survival. J Neurooncol. 2007;81:1–7. doi: 10.1007/s11060-006-9199-9. [DOI] [PubMed] [Google Scholar]
- Wadsworth H, Jones PA, Chau WF, Durrant C, Fouladi N, Passmore J, O'Shea D, Wynn D, Morisson-Iveson V, Ewan A, Thaning M, Mantzilas D, Gausemel I, Khan I, Black A, Avory M, Trigg W. [(1)(8)F]GE-180: a novel fluorine-18 labelled PET tracer for imaging Translocator protein 18 kDa (TSPO) Bioorg Med Chem Lett. 2012;22:1308–1313. doi: 10.1016/j.bmcl.2011.12.084. [DOI] [PubMed] [Google Scholar]
- Wang Y, Yue X, Kiesewetter DO, Niu G, Teng G, Chen X. PET imaging of neuroinflammation in a rat traumatic brain injury model with radiolabeled TSPO ligand DPA-714. Eur J Nucl Med Mol Imaging. 2014;41:1440–1449. doi: 10.1007/s00259-014-2727-5. [DOI] [PMC free article] [PubMed] [Google Scholar]
- Wickstrøm T, Clarke A, Gausemel I, Horn E, Jørgensen K, Khan I, Mantzilas D, Rajanayagam T, in 't Veld DJ, Trigg W. The development of an automated and GMP compliant FASTlab Synthesis of [(18) F]GE-180; a radiotracer for imaging translocator protein (TSPO) J Labelled Comp Radiopharm. 2014;57:42–48. doi: 10.1002/jlcr.3112. [DOI] [PubMed] [Google Scholar]
- Winkeler A, Boisgard R, Martín A, Tavitian B. Radioisotopic imaging of neuroinflammation. J Nucl Med. 2010;51:1–4. doi: 10.2967/jnumed.109.065680. [DOI] [PubMed] [Google Scholar]
- Wyss-Coray T, Mucke L. Inflammation in neurodegenerative disease–a double-edged sword. Neuron. 2002;35:419–432. doi: 10.1016/S0896-6273(02)00794-8. [DOI] [PubMed] [Google Scholar]
- Yasuno F, Kosaka J, Ota M, Higuchi M, Ito H, Fujimura Y, Nozaki S, Takahashi S, Mizukami K, Asada T, Suhara T. Increased binding of peripheral benzodiazepine receptor in mild cognitive impairment-dementia converters measured by positron emission tomography with [(1)(1)C]DAA1106. Psychiatry Res. 2012;203:67–74. doi: 10.1016/j.pscychresns.2011.08.013. [DOI] [PubMed] [Google Scholar]