

Abstract
Converging evidence demonstrates that physical activity evokes a brain state characterized by distinctive changes in brain metabolism and cortical function. Human studies have shown that physical activity leads to a generalized increase in electroencephalography power across regions and frequencies, and a global increase in brain nonoxidative metabolism of carbohydrate substrates. This nonoxidative consumption of carbohydrate has been hypothesized to include increased de novo synthesis of amino acid neurotransmitters, especially glutamate and GABA. Here, we conducted a series of proton magnetic resonance spectroscopy studies in human volunteers before and after vigorous exercise (≥80% of predicted maximal heart rate). Results showed that the resonance signals of both glutamate and GABA increased significantly in the visual cortex following exercise. We further demonstrated a similar increase in glutamate following exercise in an executive region, the anterior cingulate cortex. The increase in glutamate was similar when using echo times of 30 and 144 ms, indicating that exercise-related T2 relaxation effects across this range of relaxation times did not account for the findings. In addition, we found preliminary evidence that more physical activity during the preceding week predicts higher resting glutamate levels. Overall, the results are consistent with an exercise-induced expansion of the cortical pools of glutamate and GABA, and add to a growing understanding of the distinctive brain state associated with physical activity. A more complete understanding of this brain state may reveal important insights into mechanisms underlying the beneficial effects of physical exercise in neuropsychiatric disorders, neurorehabilitation, aging, and cognition.
SIGNIFICANCE STATEMENT Increasing evidence suggests that distinctly different brain states are associated with sedentary behavior compared with physically active behavior. Metabolic studies show that the nonoxidative consumption of carbohydrates by the brain increases greatly during vigorous activity. Prior studies have suggested that one component of this metabolic shift may involve increasing the reserves of neurotransmitters in the brain via de novo synthesis from carbohydrate substrates. The current study reports the results of three experiments that support this hypothesis by showing increased cortical content of glutamate and GABA following physical activity. Understanding how brain metabolism and function differ during sedentary versus active behavioral states may provide important insights into the neurotherapeutic potential of exercise.
Keywords: exercise, GABA, glutamate, magnetic resonance spectroscopy, neurotransmitter metabolism, physical activity
Introduction
Vigorous physical activity is associated with several distinctive changes in brain state. These include a shift toward excitation in local cortical circuits (Fu et al., 2014), a generalized increase in surface electroencephalographic (EEG) power (Crabbe and Dishman, 2004), and a marked increase in whole-brain nonoxidative carbohydrate (CHO) consumption (Rasmussen et al., 2011). In human studies, EEG power increases following exercise across delta, theta, alpha, and beta frequencies, and over all brain regions studied (Crabbe and Dishman, 2004; Petruzello et al., 2006). In mice, the excitation–inhibition balance shifts toward excitation in visual and other sensory cortical regions, and sensory cortex becomes more responsive to stimuli while running compared with standing on a spherical treadmill (Bennett et al., 2013; Fu et al., 2014). Cell type-specific studies suggest that these changes result from GABAergic interneuron-mediated disinhibition of glutamatergic pyramidal neurons (Fu et al., 2014). Human studies measuring arteriovenous differences in key metabolites across the brain during inactivity and exercise consistently show that CHO uptake by the brain reaches unusually high levels during physical activity and that much of the CHO taken up by the brain during exercise is not oxidized. The metabolic fate and function of this nonoxidized CHO uptake is not yet understood (Dalsgaard et al., 2004; Rasmussen et al., 2011).
One possible explanation for increased nonoxidative brain CHO metabolism during exercise is that CHO is consumed for de novo synthesis of neurotransmitters (Dalsgaard et al., 2004; Maddock et al., 2011). The most abundant neurotransmitters, glutamate and GABA, are each readily synthesized from carbon skeletons derived from CHO substrates, as long as a source of amino groups is available. A recent magnetic resonance spectroscopy (MRS) study demonstrated significantly increased MRS-visible glutamate in the visual cortex immediately following exercise, providing preliminary support for this hypothesis (Maddock et al., 2011). However, this study had several limitations, as follows: it measured only glutamate, it examined only visual cortex, and it was conducted at 1.5 tesla. In addition, it was conducted using only a relatively long echo time. Animal studies suggest that T2 relaxation effects may render vesicular glutamate invisible to MRS at longer echo times (Pirttilä et al., 1993). Thus, the prior result may have reflected translocation of glutamate from the vesicular to the cytoplasmic compartment, rather than de novo synthesis of glutamate.
The current study aims to test the hypothesis that the brain state induced by physical activity includes an expansion of the tissue pools of the amino acid neurotransmitters glutamate and GABA. The study had the following two primary goals: (1) to use a 3 tesla MRI system to test whether cortical GABA and glutamate levels are increased following exercise; and (2) to examine whether exercise-induced changes in glutamate are observed beyond primary sensory and motor cortical regions. To address these questions, Study 1 measured exercise effects on GABA and glutamate in primary visual cortex (V1), and Study 2 compared exercise effects on glutamate in V1 and in the anterior cingulate cortex (ACC). A third study examined the possible role of T2 relaxation effects on MRS visibility by comparing exercise-induced changes in V1 glutamate measured using interleaved short and longer echo-time sequences in the same subjects. In addition, a sedentary control study measured V1 glutamate over time in subjects who went through all of the same procedures as in the exercise studies, but did not exercise.
Materials and Methods
Participants.
Thirty-eight healthy, normal-weight volunteers (22 females and 16 males) participated in a series of three studies of exercise effects on cortical glutamate or GABA levels or in a control study. Demographic features of the subjects in each study are shown in Table 1. All subjects gave informed consent, and underwent a screening medical interview and electrocardiogram (EKG). Subjects were excluded if they had any significant medical illness, history of head injury, neurological or psychiatric disorder, significant EKG abnormalities, or were receiving any medication [hormonal contraceptives (N = 8) and stable thyroid replacement (N = 1) were permitted]. All subjects completed the International Physical Activity Questionnaire (IPAQ, short form), a validated, self-report measure of one's physical activity during the preceding week (Craig et al., 2003).
Table 1.
Participant characteristics and exercise parameters
| S | Age | M/F (n) | BMI | IPAQ | %PMHR | MaxW | MaxRPE | MRS onset |
|---|---|---|---|---|---|---|---|---|
| 1 | 25.8 ± 6.4 | 3/5 | 24.0 ± 2.7 | 98.7 ± 109 | 85.5 ± 4.3 | 168 ± 43 | 6.4 ± 1.4 | 14.6 ± 2.4 |
| 2V | 28.1 ± 9.9 | 2/6 | 23.6 ± 2.7 | 36.4 ± 15.4 | 94.3 ± 7.3 | 189 ± 63 | 7.7 ± 0.9 | 12.8 ± 0.8 |
| 2A | 28.1 ± 10.7 | 2/6 | 23.3 ± 2.2 | 66.8 ± 53.6 | 93.5 ± 8.7 | 179 ± 58 | 8.2 ± 1.2 | 13.3 ± 2.0 |
| 3 | 26.6 ± 7.5 | 6/2 | 23.0 ± 1.7 | 61.6 ± 47.4 | 89.3 ± 5.3 | 161 ± 44 | 7.5 ± 0.5 | 15.3 ± 1.1 |
| Con | 26.2 ± 5.4 | 3/3 | 22.2 ± 3.1 | 60.5 ± 36.8 | 39.6 ± 4.5 | 0 ± 0 | 0 ± 0 | 15.3 ± 1.4 |
Values are reported as the mean ± SD, unless otherwise indicated. S, Study; V, visual cortex; A, anterior cingulate cortex; Con, control; M, male; F, female; BMI, body mass index; %PMHR, % of predicted maximum heart rate achieved during exercise; MaxW, maximum watts of exertion; MaxRPE, maximum rating of perceived exertion on a 0–10 scale (Noble et al. 1983); MRS onset, minutes after end of exercise when MRS data collection began.
Exercise procedures.
In Study 1, GABA was measured in V1 in eight subjects (Table 1). Following pre-exercise MRS acquisitions, subjects underwent graded exercise on a bicycle ergometer (model 868, Monark) to reach a target heart rate (HR) of ≥80% of predicted maximum HR (220 − age; Fox et al., 1971). HR was measured using a heart rate monitor (Polar). Exercise began at 50–100 W and increased by 25–40 W every 2–4 min depending on each subject's fitness level. For Study 1, subjects exercised until they reached their target heart rate (8–17 min of cycling). Subjects then cycled at low load for a final 1 min “cool-down” period before re-entering the MRI scanner for postexercise measurements. This exercise procedure was identical to that used in our earlier study of exercise effects on glutamate (Maddock et al., 2011).
In Study 2, glutamate was measured in the ACC in eight subjects and in V1 in eight subjects (Table 1). The exercise protocol used in Study 1 resulted in different durations of exercise for each subject. To remove this source of variance in the data, the duration of exercise was standardized for Study 2. Following pre-exercise MRS acquisitions, subjects in Study 2 underwent graded exercise until the target heart rate was reached, and then exercised at constant load until the total exercise duration reached 20 min. All subjects had a final 1 min cool down before re-entering the MRI scanner for postexercise measurements.
In Study 3, glutamate was measured in V1 using two different echo times (30 and 144 ms) in eight subjects (Table 1). Following pre-exercise MRS acquisitions, subjects in Study 3 underwent graded exercise, a cool-down period, and postexercise measurements following the same procedures as in Study 2.
In the control study, glutamate was measured in V1 in six subjects following all of the same procedures as in Study 2, except that subjects sat on the ergometer for 20 min without pedaling (Table 1).
MRS procedures.
For Study 1, MRS data were acquired with a Siemens TIM Trio 3 T Magnetic Resonance Imaging (MRI) System using a 32-channel, phased-array head coil. The scanning session began with a three-view, T1-weighted, localizer image, followed by an MPRAGE acquisition for voxel localization (resolution, 0.86 mm isotropic; 192 slices; flip angle, 7°; TE = 4.81 ms; TR = 2160 ms). Following automated second-order shimming, single-voxel pre-exercise proton MRS data were acquired from a 3 × 2.5 × 2.5 cm voxel placed bilaterally over the calcarine sulcus in the primary visual cortex, with its posterior border 7 mm anterior to the dura at its nearest point (Fig. 1). Since our primary goal in Study 1 was to test for exercise-induced increases in GABA, spectra were acquired with a Mescher–Garwood point-resolved spectroscopy (MEGA-PRESS) GABA editing sequence with weak water suppression (Mescher et al., 1998). This single-voxel J-difference spectral editing sequence acquired interleaved edited and unedited spectra with the following parameters: TR = 1500 ms; TE = 68 ms; number of averages = 416; duration = 10.4 min; 8 step phase cycling; 2048 data points; 1000 Hz receiver bandwidth; “on-resonance” edit frequency = 1.9 ppm; “off-resonance” edit frequency = 7.5 ppm; edit pulse bandwidth = 44 Hz. Following exercise, subjects re-entered the scanner. All of the above MR procedures, including precise repositioning of the voxel, were repeated following exercise. This entailed an ∼14 min delay before the postexercise MRS data collection could commence. Two 10.4 min MEGA-PRESS acquisitions were obtained after exercise.
Figure 1.

A, The location of the visual cortex and anterior cingulate cortex voxels. B, The difference spectrum from a MEGA-PRESS GABA editing sequence acquired from the visual cortex. The thicker line segment indicates the frequency range used for peak integration of the GABA signal. C, The LCModel fit of an off-resonance spectrum from a MEGA-PRESS GABA editing sequence acquired from the visual cortex and used to calculate the glutamate signal in Study 1. D, The LCModel fit of a PRESS acquisition from the anterior cingulate cortex with TE = 144 ms. E, The LCModel fit of a PRESS acquisition from the visual cortex with TE = 144 ms. F, The LCModel fit of a PRESS acquisition from the visual cortex with TE = 30 ms. For C through F, the model fit (heavy line) is superimposed on the raw spectral data (fine line) above the estimated baseline (fine undulating line). The raw data line is extensively overlapped by the fit line, but is discernable at some parts per million values (e.g., above the fit line at ∼2.7 ppm and below the fit line at ∼2.5 ppm in D). The residual (fit − raw data) is shown at the top of each panel.
For Study 2, MR data were acquired with a Siemens Skyra 3 T MRI System using a 32-channel, phased-array head coil. The scanning session began with a localizer image followed by an MPRAGE acquisition with the same parameters as in Study 1. Following automated, second-order shimming, single-voxel, pre-exercise proton MRS data were acquired from a 3 × 2.5 × 2.5 cm voxel placed either bilaterally over V1 as in Study 1, or bilaterally over the rostrodorsal ACC, with the posterior–inferior edge of the voxel touching the dorsal surface of the genu and the line marking the posterior quarter of the voxel aligned with the tip of the genu (Fig. 1). Our primary aim in Study 2 was to examine the regional specificity of exercise-induced increases in amino acid neurotransmitter levels. We prioritized measuring glutamate in Study 2 because glutamate is present at much higher levels in cortex than GABA. Thus, demonstrating increased glutamate implicates a larger neurometabolic shift than does a similar percentage increase in GABA (Govindaraju et al., 2000; Maddock and Buonocore, 2012). Since glutamate measurements with a PRESS sequence are more reliable than glutamate measurements with a MEGA-PRESS sequence in our laboratory, a PRESS sequence was used for Study 2. Eight minutes of baseline MRS data were acquired using a PRESS sequence with weak water suppression and the following parameters: TR = 1500 ms; TE = 144 ms; number of averages = 320; duration = 8 min; eight-step phase cycling; 1024 data points; 1200 Hz receiver bandwidth. These parameters closely approximated those used in our earlier 1.5 T study of exercise effects on glutamate (Maddock et al., 2011). All MR procedures were repeated following exercise, except that three successive PRESS acquisitions, totaling 24 min, were obtained after exercise.
The primary aim of Study 3 was to compare the magnitude of the exercise-induced increase in glutamate when measured at short and longer echo times. Thus, MR data were acquired with the same MR system and procedures as for Study 2, except that MRS data were obtained using interleaved short TE (30 ms; TE 30) and longer TE (144 ms; TE 144) PRESS acquisitions. Specifically, PRESS acquisitions consisted of consecutive 2 min blocks composed of a TE 144 acquisition (three preparation scans and 32 averages = 52.5 s), followed by a TE 30 acquisition (three preparation scans and 32 averages = 52.5 s), followed by a TE 30 unsuppressed water acquisition (two preparation scans and 8 averages = 15 s). Unsuppressed water spectra were acquired to enable eddy current correction of the TE 30 data, which is essential for spectral quality at short echo times. The pre-exercise baseline MRS data were acquired for 10 min (five cycles of interleaved acquisitions) and included 4.375 min of TE 144 acquisitions, 4.375 min of TE 30 acquisitions, and 1.25 min of unsuppressed water. The postexercise data were acquired for 24 min (12 cycles of interleaved acquisitions) and were aggregated into three 8 min blocks, each consisting of 3.5 min of TE 144 acquisitions, 3.5 min of TE 30 acquisitions, and 1 min of unsuppressed water.
For the sedentary control study, MR data were acquired with the same parameters as for acquisition of V1 spectra in Study 2.
Processing of MRS data.
For Study 1, GABA and creatine values were quantified by an automated peak integration procedure using jMRUI-v4 (http://www.jmrui.eu) for phase and frequency alignment, and custom software (available by request) for peak integration as previously described (Yoon et al., 2010). The decision to use our peak integration method for the primary analysis rather than curve fitting with LCModel was based on pilot data showing lower within-subjects and between-subjects coefficients of variation when using the former. However, LCModel fits of the GABA resonance in the difference spectra were also calculated using LCModel software version 6.3–1F (Provencher, 1993) and a simulated MEGA-PRESS basis set, which included n-acetylaspartate (NAA), n-acetylaspartyl-glutamate, GABA, glutamate, glutamine, and glutathione. Macromolecules and homocarnosine contribute to the signal measured as “GABA” by both of these methods. GABA/creatine ratios (from peak integration) and GABA/NAA ratios (from LCModel fits) were calculated for the pre-exercise baseline and the two postexercise periods. As a secondary analysis, glutamate/creatine ratios were estimated from the off-resonance spectra using LCModel (version 6.3–1F) and a simulated PRESS basis set, which included NAA, n-acetylaspartyl-glutamate, creatine, phosphocreatine, phosphocholine, glycerophosphocholine, glutamate, glutamine, myo-inositol, scyllo-inositol, glutathione, and taurine. The decision to use the off-resonance spectra for glutamate rather than the coedited glutamate and glutamine (Glx) peak from the difference spectra was based on pilot data showing that the former correlated more reliably than the latter with glutamate values obtained by LCModel fits of conventional PRESS acquisitions from the same voxel.
For Study 2, spectra were processed and metabolite values were quantified using the same LCModel version and basis set molecules as in the glutamate analysis of Study 1, except that the basis set reflected the acquisition parameters used in Study 2. Glutamate and other metabolite values were normalized to creatine for statistical analysis.
For Study 3, spectral data from the TE 144 acquisitions were analyzed as described for Study 2. The TE 30 acquisitions were analyzed with the same version of LCModel, but incorporated the unsuppressed water spectra for eddy current correction and a canonical basis set for TE 30 spectra that included the following additional resonances present at the shorter echo time: aspartate, GABA, and glucose. Glutamate and other metabolite values were normalized to creatine for statistical analysis. For a secondary analysis, glutamate/water ratios were calculated for the TE 30 data.
For the control study, glutamate and other metabolite values were quantified using the same procedures as for Study 2.
Statistical analysis.
In our prior 1.5 T MRS study of exercise, the combined signal from Glx was significantly increased during the first postexercise measurement (effect size d = 0.94) but not during subsequent measurements (effect sizes, all ≤0.18; Maddock et al., 2011). Thus, our planned comparisons for each study targeted the changes from pre-exercise to the first postexercise measurement (“pre-post exercise”). Changes occurring at later postexercise measurements or in other metabolites were examined for descriptive purposes. Because vigorous exercise leads to sweating and other shifts in water homeostasis, we normalized metabolite values to creatine rather than water for the primary analyses.
For Study 1, a repeated-measures ANOVA over the three time points was conducted, followed by the planned comparison of pre-exercise and first postexercise GABA/creatine ratios by paired t test. Similar analyses were conducted for the glutamate/creatine ratios. A Bonferroni correction for testing these two metabolites was applied. Parallel secondary analyses were performed for other metabolite ratios and for the second postexercise GABA and glutamate values. For Study 2, we first conducted a 2 × 2 mixed-model ANOVA of glutamate/creatine ratios with region (V1 and ACC) as a between-subjects factor and the four time points as the within-subjects factor. This was followed by the planned comparison ANOVA restricted to the pre-exercise and first postexercise measurements. Parallel secondary analyses were performed for other metabolite ratios. Paired t tests were used to examine exercise effects on glutamate within each brain region and glutamate changes at later time points after exercise. For Study 3, a repeated-measures ANOVA with both TE (30 and 144 ms) and time (four time points) as within-subjects factors was used to test for an interaction between echo time and exercise effects on glutamate. This was followed by the planned comparison ANOVA restricted to the pre-exercise and first postexercise measurements. Paired t tests were used to examine exercise effects on glutamate within each TE condition and effects at later time points after exercise. Parallel secondary analyses were performed for other metabolite ratios. For the control study, a repeated-measures ANOVA over the four time points was conducted, followed by a paired t test for the planned comparison of glutamate/creatine ratios at baseline and during the first acquisition obtained after sitting on the ergometer without exercising. The α-statistic was set to 0.05 (one-tailed) for paired t tests used with planned comparisons for our directional hypotheses. The α-statistic was set to 0.05 (two tailed) for ANOVAs, correlations, and other exploratory analyses.
Results
Participant characteristics and exercise-related variables for all studies are shown in Table 1. Subjects for all studies had normal body mass index values. IPAQ scores categorized 74% of subjects as having “high” levels of physical activity in the last week, 21% as “moderate,” and 5% as “low.” Example spectra for each study are shown in Figure 1. The GABA/creatine ratio and/or glutamate/creatine ratio at baseline and during the first postexercise period for each study are shown in Table 2. The time courses of the percentage change in glutamate/creatine and GABA/creatine ratios for each study are shown in Figure 2.
Table 2.
Statistical comparisons of baseline to first post-exercise measurements
| S | Region, TE, Glut or GABA | Baseline, mean (SD) | 1st Post ex, mean (SD) | % Increase, mean (SD) | Effect size (d) | Statistical test (t or F) |
|---|---|---|---|---|---|---|
| 1 | V1, 68 ms, GABA/Cr | 0.156 (0.011) | 0.167 (0.007) | 6.8% (5.9%) | 1.35 | t(7) = 3.82, p = 0.003 |
| V1, 68 ms, Glut/Cr | 0.662 (0.060) | 0.682 (0.061) | 3.1% (2.5%) | 1.23 | t(7) = 3.57, p = 0.005 | |
| 2 | V1, 144 ms, Glut/Cr | 0.546 (0.045) | 0.573 (0.045) | 5.2% (6.8%) | 0.78 | R: F(1,14) = 35.9, p < 0.001 |
| ACC, 144 ms, Glut/Cr | 0.741 (0.090) | 0.779 (0.081) | 5.2% (3.5%) | 1.48 | X: F(1,14) = 18.2, p < 0.001 | |
| R × X: F(1,14) = 0.4, NS | ||||||
| 3 | V1, 144 ms, Glut/Cr | 0.565 (0.059) | 0.593 (0.052) | 5.5% (7.0%) | 0.76 | E: F(1,7) = 185.0, p < 0.001 |
| V1, 30 ms, Glut/Cr | 1.073 (0.159) | 1.141 (0.157) | 6.9% (9.1%) | 0.82 | X: F(1,7) = 8.78, p < 0.021 | |
| E × X: F(1,7) = 1.52, NS | ||||||
| Con | V1, 144 ms, Glut/Cr | 0.602 (0.062) | 0.581 (0.057) | −3.3% (6.5%) | −0.50 | t(5) = −1.22, NS |
S, Study; Con, control; Glut, glutamate; Cr, creatine plus phosphocreatine; 1st Post Ex, first MRS measurement following exercise; Effect size, calculated as mean (Post Ex − Baseline)/SD (Post ex − Baseline); R, main effect for brain region; X, main effect for pre-exercise vs postexercise; E, main effect for TE.
Figure 2.
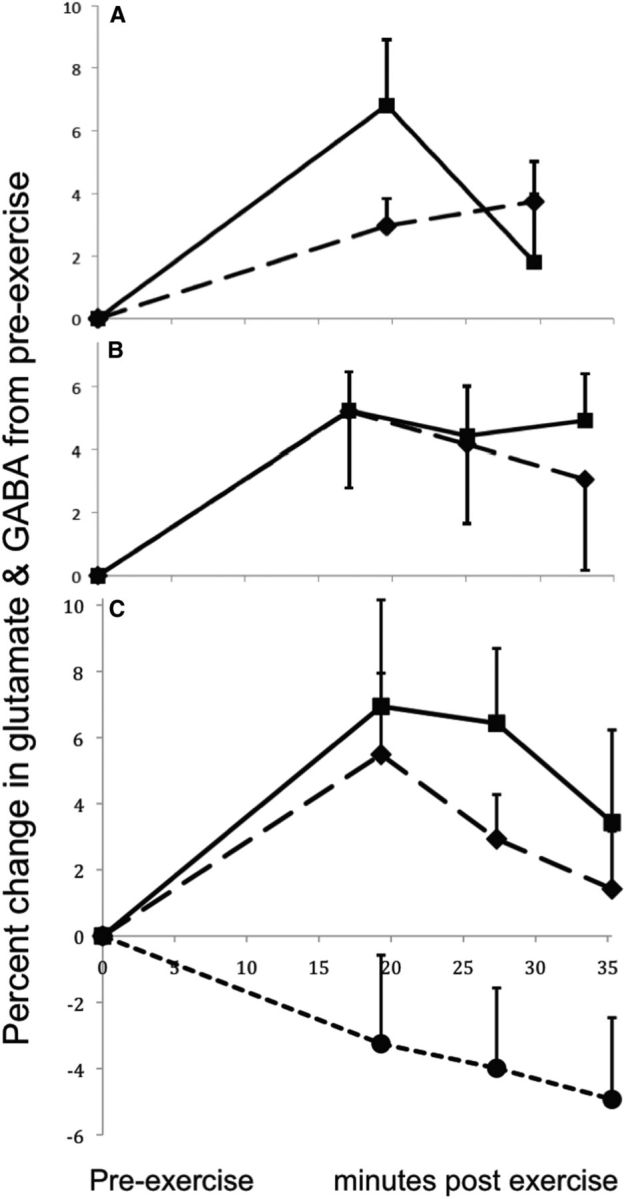
The mean and SEM of the percentage change in GABA/creatine or glutamate/creatine ratio from the baseline to the postexercise measurements. A, The percentage change in GABA/creatine (solid) and glutamate/creatine (dashed) ratios measured in the visual cortex with a MEGA-PRESS editing sequence in Study 1 (N = 8). B, The percentage change in glutamate/creatine ratio measured in the anterior cingulate cortex (solid; N = 8) and the visual cortex (dashed; N = 8) at TE = 144 ms in Study 2. C, The percentage change in glutamate/creatine ratio measured in the visual cortex in eight subjects at TE = 30 ms (solid line) and TE = 144 ms (long dashes; Study 3). Also shown is the percentage change in glutamate/creatine ratio measured in the visual cortex in six sedentary control subjects (short dashes) at TE = 144 ms in the Control Study. These subjects followed all procedures as in Studies 2 and 3, but did not exercise.
Study 1—exercise effects on V1 GABA measured with MEGA-PRESS
Subjects in Study 1 exercised for an average of 11.5 min (range, 8–17 min) and achieved an average maximum heart rate that was 85.5% of their predicted maximum heart rate (Table 1). Repeated-measures ANOVA of the GABA/creatine ratio showed a significant main effect of time (F(2,14) = 8.64, p = 0.004). The V1 GABA/creatine ratio was significantly greater during the first postexercise measurement compared with the pre-exercise measurement (paired t(7) = 3.82, p = 0.003; Table 2). This effect survived the Bonferroni correction that was applied to account for also testing the change in glutamate levels. By the second postexercise measurement, the GABA/creatine ratio no longer differed from the baseline level (paired t(7) = 0.76, NS) and had decreased from the first postexercise measurement (paired t(7) = 4.63, p = 0.001; Fig. 2).
A parallel secondary analysis using LCModel fits of the edited GABA resonance in the difference spectra yielded similar results. The mean signal-to-noise ratio (SNR) for the difference spectra was 25 and the mean Cramer–Rao lower bound (CRLB; a reliability estimate with lower values indicating greater reliability) for GABA was 4.0 (range, 3–5). The mean ± SD for the line width (full-width at half-maximum) of each acquisition was 0.054 ± 0.011 ppm. Repeated-measures ANOVA of the GABA/NAA ratio showed a significant effect of time (F(2,14) = 4.12, p = 0.039). The GABA/NAA ratio was significantly greater during the first postexercise measurement compared with the pre-exercise measurement (paired t(7) = 2.28, p = 0.028). GABA/NAA ratios quantified by LCModel fits were highly correlated with GABA/Cr ratios quantified by peak integration across the 24 measurements (r = 0.66, n = 24, p = 0.0003).
Parallel analysis of the off-resonance spectra showed a significant main effect of time for the V1 glutamate/creatine ratio (F(2,14) = 5.14, p = 0.021). The glutamate/creatine ratio increased during the first postexercise measurement compared with the pre-exercise measurement (paired t(7) = 3.57, p = 0.005, survived Bonferroni correction; Table 2). The glutamate/creatine ratio remained elevated during the second postexercise measurement (paired t(7) = 2.72, p = 0.03). The mean SNR for the off-resonance spectra was 43, and the mean CRLB for glutamate was 6.7 (range, 5–10). The mean ± SD for the line width of each acquisition was 0.046 ± 0.009 ppm. Four other metabolite resonances from the off-resonance spectra were quantified by LCModel, with CRLBs all ≤7 for each acquisition in each subject, including NAA, choline-containing compounds (choline), myo-inositol (inositol), and creatine plus phosphocreatine (creatine). CRLBs were not consistently <20 for any other metabolites. Parallel exploratory analyses showed no significant changes in NAA/creatine, choline/creatine, inositol/creatine, or the absolute (non-normalized) creatine signal from baseline to the first postexercise measurement (all t(7) < 0.92, NS).
Study 2—exercise effects on V1 and ACC glutamate
In Study 2, subjects exercised for 20 min and reached 93.9% of their predicted maximum heart rate (Table 1). The CRLBs for glutamate from each acquisition were all ≤8 (mean = 5.7, SD = 1.3). The mean ± SD for the line width of each acquisition was 0.049 ± 0.012 ppm. The CRLB and line width were similar in the two brain regions examined (V1 and ACC). The mean ± SD for the SNR of each acquisition was 40.8 ± 5.1 in V1 and 29.0 ± 5.3 in ACC.
A mixed-model repeated-measures ANOVA showed a significant main effect for time (F(3,42) = 9.39, p < 0.0001) and for region (F(1,14) = 40.0, p < 0.0001), but no significant interaction (F(3,42) = 0.70, NS). The planned comparison of the pre-exercise versus first postexercise times in the two brain regions showed a significant increase in glutamate/creatine ratios across both brain regions, and no interaction with region (Table 2). The increase in glutamate/creatine ratio after exercise was significant within each region considered separately (ACC: paired t(7) = 4.27, p = 0.002; V1: paired t(7) = 2.81, p = 0.013). The glutamate/creatine ratio remained significantly elevated during the second and third postexercise measurements in the ACC (t(7) = 2.21, p = 0.031, and t(7) = 3.21, p = 0.008, respectively) but not in V1 (t(7) = 1.63, p = 0.074, and t(7) = 1.03, NS, respectively; Fig. 2).
Four other metabolite resonances were quantified by LCModel with CRLBs for each acquisition in each subject all ≤6, including NAA, choline, inositol, and total creatine. CRLBs were not consistently <20 for any other metabolite resonances. We conducted parallel exploratory analyses of the effects of exercise on these four metabolites. There was a significant main effect of pre-post exercise on NAA/creatine, which increased from baseline to the first postexercise measurement (1.748 ± 0.34 and 1.794 ±.31, respectively; F(1,14) = 5.16, p = 0.039). There was a borderline significant main effect of pre-post exercise on inositol/creatine, which tended to decrease from baseline to the first postexercise measurement (0.873 ± 0.124 and 0.831 ± 0.115, respectively; F(1,14) = 4.35, p = 0.056). There was no effect of pre-post exercise for choline or absolute creatine (both F(1,7) ≤ 0.44, NS). There were significant main effects for region for all four metabolites, but no region by pre-post exercise interactions.
Study 3—exercise effects on V1 glutamate measured at TE 30 and TE 144
Ten subjects were enrolled in Study 3, generating usable data from eight subjects. One subject's TE 144 data were lost due to technical error, and one subject fell asleep during the postexercise measurements. Both of these subjects' data were excluded from the analysis. In Study 3, subjects exercised for 20 min and achieved an average maximum heart rate that was 89.3% of their predicted maximum (Table 1). The CRLBs for glutamate from each acquisition were all ≤10 (mean = 6.0, SD = 1.3). The mean ± SD for the line width of all acquisitions was 0.043 ± 0.006 ppm. The CRLB and line width were similar for the two echo times used. The mean ± SD for the SNR of each acquisition was 47.5 ± 5.7 with TE 30 and 39.5 ± 3.3 with TE 144.
The primary aim of Study 3 was to test for an interaction between exercise effects and echo time. A repeated-measures ANOVA showed no significant interaction between TE and time (F(3,21) = 1.01, NS). This analysis also showed a trend toward a main effect of time (F(3,21) = 2.97, p = 0.055) and a significant main effect of TE (F(1,7) = 175.0, p < 0.0001). The planned comparison of pre-exercise versus first postexercise times across short and long TEs showed similar results, except that the difference between pre-exercise and first postexercise was significant across TE values (Table 2). The increase in glutamate/creatine ratio from pre-exercise to first postexercise was significant for each TE considered separately (TE 30: t(7) = 2.31, p = 0.027; TE 144: t(7) = 2.15, p = 0.034). The glutamate/creatine ratio remained significantly elevated over baseline during the second postexercise measurement with both TE 30 and TE 144 (TE 30: t(7) = 3.22, p = 0.007; TE 144: t(7) = 2.12, p = 0.036), but no longer differed from baseline by the third postexercise measurement with either TE (TE 30: t(7) = 1.67, p = 0.070; TE 144: t(7) = 0.92, NS; Fig. 2).
Because nonsuppressed water data were collected at TE 30, we additionally assessed the effect of exercise on glutamate/water ratios. The glutamate/water ratio at TE 30 increased significantly from baseline to the first postexercise measurement (t(7) = 2.54, p = 0.019). The glutamate/water ratio remained elevated over baseline at the second and third postexercise measurements (at second measurement: t(7) = 3.65, p = 0.004; at third measurement: t(7) = 2.22, p = 0.031).
NAA, choline, inositol, and total creatine resonances were quantified by LCModel with CRLBs all ≤7 for both TE 30 and TE 144. Parallel exploratory analyses showed a borderline significant main effect of pre-post exercise on choline/creatine, which tended to decrease from baseline to the first postexercise measurement (0.182 ± 0.024 and 0.177 ± 0.019, respectively; F(1,7) = 5.21, p = 0.057). The effect of pre-post exercise did not approach significance for the other three metabolites (all F(1,7) ≤ 1.36, NS). There were significant main effects for TE for all four metabolites, but no TE by pre-post exercise interactions. Two additional metabolites, glutathione and taurine, were quantified with all CRLBs ≤17 for TE 30 only. Neither metabolite changed significantly from baseline to the first postexercise measurement by paired t test. CRLBs were not consistently <20 for any other metabolites at either echo time.
Control study—V1 glutamate before and after a sedentary control condition
In the control study, six subjects sat on the ergometer for 20 min without exercising. The CRLBs for glutamate were all ≤8 (mean = 6.5, SD = 0.8). The mean ± SD for the line width of each acquisition was 0.042 ± 0.006 ppm. The mean ± SD for the SNR of each acquisition was 42.2 ± 3.7. Repeated-measures ANOVA showed no significant effect of time on glutamate/creatine ratio (F(3,15) = 1.83; NS). The V1 glutamate/creatine ratio was nonsignificantly lower during the first measurement after sitting on the ergometer compared with the baseline measurement (paired t(5) = −1.22, NS; Table 2), and continued trending down over subsequent measurements (Fig. 2).
Exercise effects across studies
In 16 subjects across Studies 2 and 3, the effect of exercise on glutamate level was measured in the same brain region (V1) using the same exercise protocol, pulse sequence, and TE (PRESS, TE 144). The two studies showed very similar effect sizes and percentage increases in glutamate (means of the two studies = 0.77 and 5.3%, respectively). For descriptive purposes, the mean effect size and percentage change in glutamate over all brain regions, exercise protocols, pulse sequences, and TEs used with the 32 exercising subjects across all three studies were 1.07% and 4.9%, respectively.
Across Studies 2, 3 and the Control Study, the baseline glutamate/creatine ratio was measured in the same region (V1) with the same sequence (PRESS, TE 144) in 22 subjects. In these subjects, we conducted an exploratory analysis of the association between physical activity in the preceding week (IPAQ score) and resting levels of cortical glutamate. There was a significant positive correlation between these variables, both by parametric (r = 0.457, n = 22, p = 0.031) and nonparametric analyses (Spearman's ρ = 0.524, n = 22, p = 0.016).
Discussion
These studies demonstrate reliably increased glutamate content in visual and anterior cingulate cortices following vigorous exercise. Across all studies, the percentage increase in glutamate averaged 4.9% during the first postexercise measurement (∼18 min postexercise). Glutamate returned toward baseline by the final measurement (∼34 min postexercise). In contrast, only a downward drift in glutamate was observed in the sedentary control group. These findings extend earlier results from a 1.5 tesla study (Maddock et al., 2011). We also demonstrate for the first time significantly increased visual cortex GABA after exercise. No other metabolites changed reliably following exercise.
MRS measures the overall tissue content of glutamate and GABA. Most brain glutamate is found in three tissue environments. The largest fraction is in the cytoplasm of neurons and glia. Smaller fractions are in synaptic vesicles, and in glial and neuronal mitochondria (Kauppinen et al., 1994; Waagepetersen et al., 2007). Because of the potential neurotoxicity of extracellular glutamate and its avid transport out of the synaptic cleft, only a small fraction of brain glutamate is located in the synaptic cleft or other extracellular spaces in healthy brain (Waagepetersen et al., 2007). The tissue distribution of GABA is probably similar, except that the largest fraction is specifically localized to the cytoplasm of GABAergic neurons (Waagepetersen et al., 2007). At ∼10 mmol/kg, glutamate is the second most highly concentrated organic small molecule in the brain (Govindaraju et al., 2000). A widespread, 5% increase in cortical glutamate persisting ∼20 min following exercise suggests a functionally significant change in brain metabolism. Given the neurotoxic potential of glutamate in brain extracellular fluid (ECF), our findings are unlikely to reflect increased glutamate within the synaptic cleft or other ECF environments. The expanded tissue content of glutamate and GABA more likely reflects an adaptive shift in intracellular metabolic processes that support increased neurotransmission during physical activity.
Study 3 examined whether using a short (30 ms) versus a longer (144 ms) TE would influence the measured change in V1 glutamate with exercise. Several laboratories found that ∼25% of total brain glutamate measured ex vivo is “invisible” to MRS at TEs ranging from 60 to 150 ms (Bovée, 1991; de Graaf et al., 1991; Kauppinen and Williams, 1991; Pirttilä et al., 1993; Kauppinen et al., 1994). Shorter TEs have not yet been examined for glutamate visibility. Rapid T2 relaxation within some tissue environments can cause MRS invisibility at longer TEs. The spatially restricted and viscous internal environment of synaptic vesicles may impose relatively rapid T2 relaxation on vesicular glutamate (Zeigler et al., 2011). Thus, vesicular glutamate may contribute significantly to the fraction of brain glutamate that is invisible to MRS at echo times ≥60 ms (Pirttilä et al., 1993; Kauppinen et al., 1994). If so, the findings in Study 1 (TE 68) and Study 2 (TE 144) of increased glutamate signal following exercise could have been caused either by the expansion of the overall tissue pool of glutamate, or alternatively, by net movement of glutamate from a putative invisible vesicular environment to the “visible” cytoplasmic environment. Assuming that vesicular glutamate is more visible at TE = 30 ms than at TE = 144 ms, the latter scenario predicts that the exercise-induced increase in glutamate signal would be smaller when measured at TE 30 than when measured at TE 144. A finding of larger effects at TE 30 than at TE 144 would argue against that scenario. Study 3 found no significant difference between the effects of exercise at TE 30 and TE 144. This result does not allow us to clearly adjudicate between the two explanations for exercise-induced increases in MRS-visible glutamate, since 30 ms may not be sufficiently short to render vesicular glutamate fully visible. Studies with shorter TEs could resolve this question. However, we observed a slightly larger and longer-lasting increase in glutamate signal measured at TE 30. Furthermore, an exploratory analysis showed that the TE 30/TE 144 ratio of glutamate signal intensities increased slightly, rather than decreased, after exercise (Cohen's d = 0.56). While only suggestive, these patterns are consistent with an expansion of the overall tissue pool of glutamate after exercise.
A robust but poorly understood change in brain metabolism during exercise has been repeatedly described in human studies using the arteriovenous difference method. Specifically, brain uptake of glucose and lactate increases more than the uptake of oxygen during exercise, and this metabolic uncoupling increases with more intense exercise (Dalsgaard et al., 2004; Rasmussen et al., 2011). The oxygen/carbohydrate uptake ratio decreases from its usual resting value of ∼6 to a nadir of ∼3.75 during exercise protocols similar to those we used in Studies 2 and 3 (Ide et al., 2000; Dalsgaard et al., 2002). During exercise, the brain takes up much more glucose and lactate than it consumes by oxidation. A similar uncoupling of glucose and oxygen consumption occurs in localized brain regions during neural activation—part of the phenomenon that enables BOLD contrast (Fox et al., 1988). As with exercise, this activity-dependent metabolic uncoupling is accompanied by locally increased glutamate concentration (Bednařík et al., 2015). However, the metabolic uncoupling during exercise is observable broadly across the brain and is more sustained. The metabolic fate of nonoxidized carbohydrate consumed by the brain during exercise is unknown, but it is not leaving the brain as lactate or accumulating as lactate more than slightly (Dalsgaard et al., 2004; Maddock et al., 2011). Glycogen shunting, flux through the pentose–phosphate pathway, and flux through the anaplerotic pyruvate carboxylase reaction to sustain de novo synthesis of glutamate and GABA via α-ketoglutarate transamination have been suggested as accounting for some of the missing carbohydrate (Dalsgaard et al., 2004; Dalsgaard, 2006; Maddock et al., 2011). Based on published oxygen/carbohydrate uptake data and metabolic models (Ide et al., 2000; Dalsgaard et al., 2002, 2004), and assuming glutamate and GABA increase throughout the whole brain and derived entirely from nonoxidized carbohydrate uptake, we estimate that the increased glutamate and GABA levels seen in our studies can account for at most ∼15% of the increased brain nonoxidized carbohydrate uptake. While increased synthesis of glutamate and GABA may be one component of increased nonoxidative carbohydrate consumption during exercise, other significant metabolic changes must also be involved.
Both animal and human studies report substantial changes in cortical functioning reflecting increased neural activity associated with physical activity. A review of 18 studies showed that EEG power increases after exercise with moderate-to-large effect sizes across all brain regions and frequency bands studied (Crabbe and Dishman, 2004; Petruzello et al., 2006). Three studies of evoked potential changes after exercise observed a generalized increase in P3 amplitude (Kramer and Hillman, 2006). In mice, the cortical excitation–inhibition balance shifts toward excitation in the visual cortex, and glutamatergic pyramidal neurons become more responsive to visual stimuli during running compared with sedentary activity (Niell and Stryker, 2010; Bennett et al., 2013; Fu et al., 2014). Similarly, behavioral performance on some visual tasks improves in running mice (Bennett et al., 2013). In mouse visual cortex, vasoactive intestinal peptide-positive (VIP+) GABAergic interneuron activity increases and somatostatin-positive GABAergic interneuron activity decreases during physical activity, suggesting that the former interneurons increase their inhibition of the latter to produce a net disinhibition of glutamatergic pyramidal neurons (Fu et al., 2014). Ascending neuromodulation by both cholinergic and adrenergic circuits mediates the increased gain of excitatory neurons in visual cortex in running mice (Polack et al., 2013; Fu et al., 2014). The observations on brain carbohydrate metabolism, electrophysiology, and cortical excitation–inhibition balance suggest that the brain state associated with physical activity includes a widespread increase in neural activation compared with the sedentary state. The current findings suggest that this brain state includes a metabolic shift leading to expansion of the tissue pools of glutamate and GABA.
In addition to demonstrating acutely increased glutamate following exercise, we found preliminary evidence that more exercise in the preceding week predicted higher resting glutamate levels. These findings may have relevance to the therapeutic use of exercise in neuropsychiatric conditions. For example, glutamate is consistently reduced in frontal and limbic regions (especially the ACC) during episodes of major depression and often normalizes in association with recovery (Yüksel and Öngür, 2010; Luykx et al., 2012; Maddock and Buonocore, 2012). A similar pattern of findings is evident for GABA in major depressive disorder, especially in occipital cortex (Sanacora and Saricicek, 2007). Exercise appears to be an effective treatment for some patients with major depression (Cooney et al., 2013). Future studies could determine whether baseline glutamate or exercise-induced glutamate responses in the ACC have value as predictors of clinical response to exercise training as a treatment for depression.
In summary, we report a consistent increase in cortical glutamate and GABA levels following a single bout of exercise in young, healthy, physically active volunteers. Glutamate increased in both V1 and ACC. These observations add to a growing recognition that the brain state associated with physical activity differs from that associated with sedentary states and includes distinctive changes in brain metabolism. Future studies may determine how these acute effects relate to longer-term training effects and whether they are relevant to the neurotherapeutic potential of exercise.
Footnotes
We thank Costin Tanase, PhD, for technical assistance with acquisition and analysis of MRS data.
The authors declare no competing financial interests.
References
- Bednar̆ík P, Tkác̆ I, Giove F, DiNuzzo M, Deelchand DK, Emir UE, Eberly LE, Mangia S. Neurochemical and BOLD responses during neuronal activation measured in the human visual cortex at 7 Tesla. J Cereb Blood Flow Metab. 2015;35:601–610. doi: 10.1038/jcbfm.2014.233. [DOI] [PMC free article] [PubMed] [Google Scholar]
- Bennett C, Arroyo S, Hestrin S. Subthreshold mechanisms underlying state-dependent modulation of visual responses. Neuron. 2013;80:350–357. doi: 10.1016/j.neuron.2013.08.007. [DOI] [PMC free article] [PubMed] [Google Scholar]
- Bovée WM. Quantification of glutamate, glutamine, and other metabolites in in vivo proton NMR spectroscopy. NMR Biomed. 1991;4:81–84. doi: 10.1002/nbm.1940040209. [DOI] [PubMed] [Google Scholar]
- Cooney GM, Dwan K, Greig CA, Lawlor DA, Rimer J, Waugh FR, McMurdo M, Mead GE. Exercise for depression. Cochrane Database Syst Rev. 2013;9:CD004366. doi: 10.1002/14651858.CD004366.pub6. [DOI] [PMC free article] [PubMed] [Google Scholar]
- Crabbe JB, Dishman RK. Brain electrocortical activity during and after exercise: a quantitative synthesis. Psychophysiology. 2004;41:563–574. doi: 10.1111/j.1469-8986.2004.00176.x. [DOI] [PubMed] [Google Scholar]
- Craig CL, Marshall AL, Sjöström M, Bauman AE, Booth ML, Ainsworth BE, Pratt M, Ekelund U, Yngve A, Sallis JF, Oja P. International physical activity questionnaire: 12-country reliability and validity. Med Sci Sports Exerc. 2003;35:1381–1395. doi: 10.1249/01.MSS.0000078924.61453.FB. [DOI] [PubMed] [Google Scholar]
- Dalsgaard MK. Fuelling cerebral activity in exercising man. J Cereb Blood Flow Metab. 2006;26:731–750. doi: 10.1038/sj.jcbfm.9600256. [DOI] [PubMed] [Google Scholar]
- Dalsgaard MK, Ide K, Cai Y, Quistorff B, Secher NH. The intent to exercise influences the cerebral O(2)/carbohydrate uptake ratio in humans. J Physiol. 2002;540:681–689. doi: 10.1113/jphysiol.2001.013062. [DOI] [PMC free article] [PubMed] [Google Scholar]
- Dalsgaard MK, Quistorff B, Danielsen ER, Selmer C, Vogelsang T, Secher NH. A reduced cerebral metabolic ratio in exercise reflects metabolism and not accumulation of lactate within the human brain. J Physiol. 2004;554:571–578. doi: 10.1113/jphysiol.2003.055053. [DOI] [PMC free article] [PubMed] [Google Scholar]
- de Graaf AA, Deutz NE, Bosman DK, Chamuleau RA, de Haan JG, Bovee WM. The use of in vivo proton NMR to study the effects of hyperammonemia in the rat cerebral cortex. NMR Biomed. 1991;4:31–37. doi: 10.1002/nbm.1940040106. [DOI] [PubMed] [Google Scholar]
- Fox PT, Raichle ME, Mintun MA, Dence C. Nonoxidative glucose consumption during focal physiologic neural activity. Science. 1988;241:462–464. doi: 10.1126/science.3260686. [DOI] [PubMed] [Google Scholar]
- Fox SM, 3rd, Naughton JP, Haskell WL. Physical activity and the prevention of coronary heart disease. Ann Clin Res. 1971;3:404–432. [PubMed] [Google Scholar]
- Fu Y, Tucciarone JM, Espinosa JS, Sheng N, Darcy DP, Nicoll RA, Huang ZJ, Stryker MP. A cortical circuit for gain control by behavioral state. Cell. 2014;156:1139–1152. doi: 10.1016/j.cell.2014.01.050. [DOI] [PMC free article] [PubMed] [Google Scholar]
- Govindaraju V, Young K, Maudsley AA. Proton NMR chemical shifts and coupling constants for brain metabolites. NMR Biomed. 2000;13:129–153. doi: 10.1002/1099-1492(200005)13:3<129::AID-NBM619>3.0.CO;2-V. [DOI] [PubMed] [Google Scholar]
- Ide K, Schmalbruch IK, Quistorff B, Horn A, Secher NH. Lactate, glucose and O2 uptake in human brain during recovery from maximal exercise. J Physiol. 2000;522:159–164. doi: 10.1111/j.1469-7793.2000.t01-2-00159.xm. [DOI] [PMC free article] [PubMed] [Google Scholar]
- Kauppinen RA, Williams SR. Nondestructive detection of glutamate by 1H nuclear magnetic resonance spectroscopy in cortical brain slices from the guinea pig: evidence for changes in detectability during severe anoxic insults. J Neurochem. 1991;57:1136–1144. doi: 10.1111/j.1471-4159.1991.tb08271.x. [DOI] [PubMed] [Google Scholar]
- Kauppinen RA, Pirttilä TR, Auriola SO, Williams SR. Compartmentation of cerebral glutamate in situ as detected by 1H/13C n.m.r. Biochem J. 1994;298:121–127. doi: 10.1042/bj2980121. [DOI] [PMC free article] [PubMed] [Google Scholar]
- Kramer AF, Hillman CH. Aging, physical activity, and neurocognitive function. In: Acevedo EO, Ekkekakis P, editors. Psychobiology of physical activity. Champaign, IL: Human Kinetics; 2006. pp. 45–59. [Google Scholar]
- Luykx JJ, Laban KG, van den Heuvel MP, Boks MP, Mandl RC, Kahn RS, Bakker SC. Region and state specific glutamate downregulation in major depressive disorder: a meta-analysis of (1)H-MRS findings. Neurosci Biobehav Rev. 2012;36:198–205. doi: 10.1016/j.neubiorev.2011.05.014. [DOI] [PubMed] [Google Scholar]
- Maddock RJ, Buonocore MH. MR spectroscopic studies of the brain in psychiatric disorders. Curr Top Behav Neurosci. 2012;11:199–251. doi: 10.1007/7854_2011_197. [DOI] [PubMed] [Google Scholar]
- Maddock RJ, Casazza GA, Buonocore MH, Tanase C. Vigorous exercise increases brain lactate and Glx (glutamate+glutamine): a dynamic 1H-MRS study. Neuroimage. 2011;57:1324–1330. doi: 10.1016/j.neuroimage.2011.05.048. [DOI] [PubMed] [Google Scholar]
- Mescher M, Merkle H, Kirsch J, Garwood M, Gruetter R. Simultaneous in vivo spectral editing and water suppression. NMR Biomed. 1998;11:266–272. doi: 10.1002/(SICI)1099-1492(199810)11:6<266::AID-NBM530>3.0.CO;2-J. [DOI] [PubMed] [Google Scholar]
- Niell CM, Stryker MP. Modulation of visual responses by behavioral state in mouse visual cortex. Neuron. 2010;65:472–479. doi: 10.1016/j.neuron.2010.01.033. [DOI] [PMC free article] [PubMed] [Google Scholar]
- Noble BJ, Borg GA, Jacobs I, Ceci R, Kaiser P. A category-ratio perceived exertion scale: relationship to blood and muscle lactates and heart rate. Med Sci Sports Exerc. 1983;15:523–528. [PubMed] [Google Scholar]
- Petruzello SJ, Ekkekakis E, Hall EE. Physical activity, affect, and electroencephalogram studies. In: Acevedo EO, Ekkekakis P, editors. Psychobiology of physical activity. Champaign, IL: Human Kinetics; 2006. pp. 111–128. [Google Scholar]
- Pirttilä TR, Hakumäki JM, Kauppinen RA. 1H nuclear magnetic resonance spectroscopy study of cerebral glutamate in an ex vivo brain preparation of guinea pig. J Neurochem. 1993;60:1274–1282. doi: 10.1111/j.1471-4159.1993.tb03287.x. [DOI] [PubMed] [Google Scholar]
- Polack PO, Friedman J, Golshani P. Cellular mechanisms of brain state-dependent gain modulation in visual cortex. Nat Neurosci. 2013;16:1331–1339. doi: 10.1038/nn.3464. [DOI] [PMC free article] [PubMed] [Google Scholar]
- Provencher SW. Estimation of metabolite concentrations from localized in vivo proton NMR spectra. Magn Reson Med. 1993;30:672–679. doi: 10.1002/mrm.1910300604. [DOI] [PubMed] [Google Scholar]
- Rasmussen P, Wyss MT, Lundby C. Cerebral glucose and lactate consumption during cerebral activation by physical activity in humans. FASEB J. 2011;25:2865–2873. doi: 10.1096/fj.11-183822. [DOI] [PubMed] [Google Scholar]
- Sanacora G, Saricicek A. GABAergic contributions to the pathophysiology of depression and the mechanism of antidepressant action. CNS Neurol Disord Drug Targets. 2007;6:127–140. doi: 10.2174/187152707780363294. [DOI] [PubMed] [Google Scholar]
- Waagepetersen HS, Sonnewald U, Schousboe A. Glutamine, glutamate, and GABA: metabolic aspects. In: Lajtha A, Oja S, Schousboe A, Saransaari P, editors. Handbook of neurochemistry and molecular neurobiology: amino acids and peptides in the nervous system. New York: Springer; 2007. pp. 1–21. [Google Scholar]
- Yoon JH, Maddock RJ, Rokem A, Silver MA, Minzenberg MJ, Ragland JD, Carter CS. GABA concentration is reduced in visual cortex in schizophrenia and correlates with orientation-specific surround suppression. J Neurosci. 2010;30:3777–3781. doi: 10.1523/JNEUROSCI.6158-09.2010. [DOI] [PMC free article] [PubMed] [Google Scholar]
- Yüksel C, Öngür D. Magnetic resonance spectroscopy studies of glutamate-related abnormalities in mood disorders. Biol Psychiatry. 2010;68:785–794. doi: 10.1016/j.biopsych.2010.06.016. [DOI] [PMC free article] [PubMed] [Google Scholar]
- Zeigler MB, Allen PB, Chiu DT. Probing rotational viscosity in synaptic vesicles. Biophys J. 2011;100:2846–2851. doi: 10.1016/j.bpj.2011.04.042. [DOI] [PMC free article] [PubMed] [Google Scholar]