

Abstract
Recent research yielded the intriguing conclusion that, in healthy adults, higher levels of variability in neuronal processes are beneficial for cognitive functioning. Beneficial effects of variability in neuronal processing can also be inferred from neurocomputational theories of working memory, albeit this holds only for tasks requiring cognitive flexibility. However, cognitive stability, i.e., the ability to maintain a task goal in the face of irrelevant distractors, should suffer under high levels of brain signal variability. To directly test this prediction, we studied both behavioral and brain signal variability during cognitive flexibility (i.e., task switching) and cognitive stability (i.e., distractor inhibition) in a sample of healthy human subjects and developed an efficient and easy-to-implement analysis approach to assess BOLD-signal variability in event-related fMRI task paradigms. Results show a general positive effect of neural variability on task performance as assessed by accuracy measures. However, higher levels of BOLD-signal variability in the left inferior frontal junction area result in reduced error rate costs during task switching and thus facilitate cognitive flexibility. In contrast, variability in the same area has a detrimental effect on cognitive stability, as shown in a negative effect of variability on response time costs during distractor inhibition. This pattern was mirrored at the behavioral level, with higher behavioral variability predicting better task switching but worse distractor inhibition performance. Our data extend previous results on brain signal variability by showing a differential effect of brain signal variability that depends on task context, in line with predictions from computational theories.
SIGNIFICANCE STATEMENT Recent neuroscientific research showed that the human brain signal is intrinsically variable and suggested that this variability improves performance. Computational models of prefrontal neural networks predict differential effects of variability for different behavioral situations requiring either cognitive flexibility or stability. However, this hypothesis has so far not been put to an empirical test. In this study, we assessed cognitive flexibility and cognitive stability, and, besides a generally positive effect of neural variability on accuracy measures, we show that neural variability in a prefrontal brain area at the inferior frontal junction is differentially associated with performance: higher levels of variability are beneficial for the effectiveness of task switching (cognitive flexibility) but detrimental for the efficiency of distractor inhibition (cognitive stability).
Keywords: behavioral variability, BOLD-signal variability, cognitive flexibility, cognitive stability, fMRI
Introduction
Studies from various fields of neuroscience have begun to show that the brain is inherently variable in its processing and that this variability might in fact be functional (Stein et al., 2005; Faisal et al., 2008; Deco et al., 2009; Garrett et al., 2013b). Although one might intuitively assume that variability in neural processing is associated with unconstrained states and that it results in impaired performance, it was shown that brain signal variability increases from rest to task (Garrett et al., 2013a) and is linked to task difficulty (Garrett et al., 2014). Also, neural variability is higher in healthy adults (showing better performance in cognitive tasks) compared with older individuals who show worse cognitive performance (Garrett et al., 2011). Thus, variability in neural processing may in fact be beneficial. Importantly, BOLD mean activity and BOLD variability are essentially independent (Garrett et al., 2011), which underlines the importance of considering variability of neural processing as a relevant indicator of brain function. These conclusions are further supported by developmental studies that show an increase of variability from childhood to adulthood (McIntosh et al., 2008, 2010).
The importance of neural variability is also highlighted in neurocomputational models of working memory processes in prefrontal circuits: Durstewitz and Seamans (2008) suggest that the signal-to-noise ratio (SNR) of cortical networks varies between network states, i.e., between states supporting stable representations within prefrontal working memory circuits (i.e., characterized by low variability and high SNR) and rather unstable network states characterized by higher levels of neural variability that make the system vulnerable to random fluctuations but also allow it to flexibly switch between network states if necessary. From this work, we can infer that variability of neural processing supports the dynamic adaptation to changing environmental demands, a notion that can also be found in work by Deco et al. (2009) and Rolls and Deco (2010), who argue that stochastic dynamics of neural systems promote probabilistic decision making, signal detection, or creative thought.
Given this background of empirical and theoretical work, we hypothesized that individuals with higher variability in neural processing benefit on tasks requiring cognitive flexibility but suffer when the situational demands require a higher degree of cognitive stability and vice versa. We especially aimed at investigating a potential role of variability in the inferior frontal junction (IFJ) region, because work from our laboratory and from others has supposed this region to represent task rules and mediate task switches (Derrfuss et al., 2005; Armbruster et al., 2012; Ueltzhöffer et al., 2015). To test this hypothesis, we investigated brain signal variability under different task demands—i.e., cognitive flexibility versus cognitive stability—and its effect on behavioral performance, which is in our view crucial for gaining a deeper understanding of the function of brain signal variability for cognition. Moreover, we investigated the relationship between behavioral variability and performance in cognitive flexibility and cognitive stability, because the reasoning derived from computational theories might also hold for variability at the behavioral level. Finally, we also explored directly the relationship between brain signal variability and behavioral variability. Brain signal variability was assessed using the difference of residuals (DoR), a new and easy-to-implement analysis approach that relies on model comparison based on the residual maps produced during model estimation by fMRI analysis packages such as SPM (for Statistical Parametric Mapping) or FSL (for Functional MRI of the Brain Software Library).
Materials and Methods
Participants
Ninety-five participants were recruited by sending advertisement letters to 3200 randomly selected citizens from the city of Heidelberg, Germany. A total of 19 subjects had to be excluded from data analysis because of reporting strategic response behavior, an error rate >30%, or neurological abnormalities. The final sample consisted of 76 subjects (42 males; aged 20–51 years; mean age, 31.4 years). All had normal or corrected-to-normal vision, reported no history of any neurological or psychiatric diseases, were right-handed, and gave written informed consent according to a protocol approved by the ethics committee of the University of Heidelberg.
Experimental procedure and behavioral analyses
The task is a highly time-efficient event-related fMRI paradigm that has been designed specifically to probe both cognitive flexibility and stability (Fig. 1A; cf. Armbruster et al., 2012): in 80% of the trials, subjects have to indicate by button press whether a digit between 1 and 9 (excluding 5) appearing above the central fixation cross is odd or even (parity judgment; ongoing task; total of 240 trials). In 20% of the trials, a second digit appears below the fixation cross, and subjects are instructed to answer to the brighter of the two digits. If this is the upper digit, they have to ignore the lower digit and continue responding to the upper digit according to the odd/even rule (distractor inhibition condition, assessing cognitive stability; total of 20 trials). However, if the lower digit is brighter, subjects are instructed to switch to this lower digit and to perform a magnitude judgment, i.e., decide whether it is greater or smaller than 5 (task switch condition, assessing cognitive flexibility; total of 20 trials). From the next trial on, participants continue to apply the ongoing task to the upper digit again. Trial length is fixed to 2 s. Note that, in this task design, task switching involves also a component of inhibitory processes, i.e., suppressing the response to the upper stimulus and suppressing the task set of the ongoing condition. At least the latter aspect is shared with other variants of task-switching paradigms. Also, experimental condition (i.e., ongoing and distractor inhibition versus task switching) is to a certain degree confounded with task (i.e., parity versus magnitude judgment). Both of these characteristics stem from the fact that we strived to design the task as representative as possible for the computational model on which our work is based, i.e., the “dual-state theory” by Durstewitz and Seamans (2008). This, in our view, increases the theoretical relevance of our results (for a more detailed discussion, see Armbruster et al., 2012). These potential limitations are ameliorated by pretesting involving an fMRI experiment in an independent sample of n = 8 participants. In that study, participants performed magnitude and parity judgments with equal frequencies in a block design (three blocks per condition, 150 trials per block; in all other aspects comparable with the present study). Results showed no differences between the two tasks in accuracy (t = −0.73, p = 0.49) but faster response times (RTs) for the magnitude judgment (t = 4.5, p = 0.003). This indicates a higher degree of automaticity for the magnitude judgment, which is line with other research showing, for example, that understanding of parity evolves later during development (Berch et al., 1999). However, as participants switched from parity judgments (ongoing condition) to magnitude judgments (switch condition), this difference, if at all, works against the direction of the expected switch cost effects in behavior, which should result in prolonged RTs for switching/magnitude judgments. Brain activation did not differ between magnitude and parity judgment, neither across the whole brain nor in brain regions that show central results in the present study. Specifically, an ROI analyses in the left IFJ (mask derived from the results in the present study; see below; see Fig. 3B) applying a lower threshold did not show any differences between the tasks (t = 2.34, p = 0.2). These results make it highly unlikely that the reported results stem from a confound between task condition and the nature of the task itself.
Figure 1.
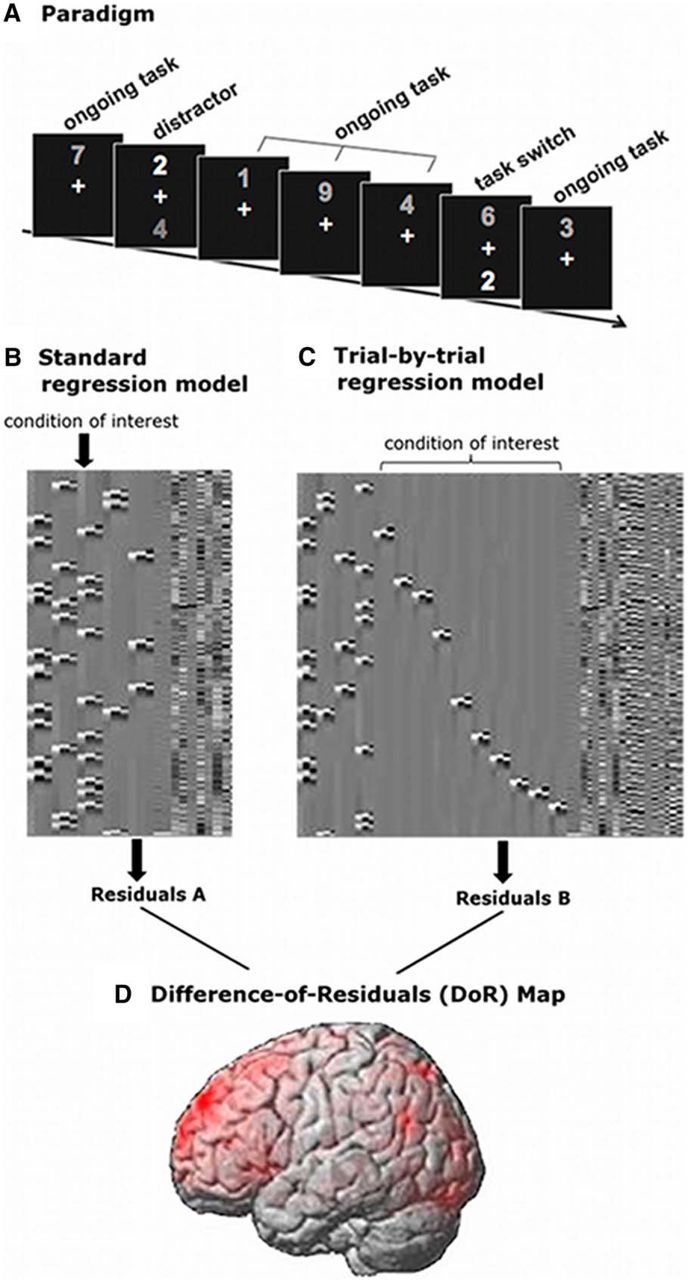
Task paradigm and analysis pipeline for BOLD-signal variability. A, Task paradigm showing examples of ongoing task trials, distractor inhibition trials, and task-switch trials. B, Standard regression model including one regressor per condition (plus 1st and 2nd derivative; see also Model A). C, Trial-by-trial regression model including one regressor (plus 1st and 2nd derivative) per trial for the condition of interest (see also Model B). D, Brain map exemplifying a DoR (i.e., standard model minus trial-by-trial regression model) map for one subject.
Figure 3.

Positive relationship between RT costs and BOLD-signal variability during distractor inhibition and antagonistic relation between performance and BOLD-signal variability in left IFJ. A, Positive correlation between RT costs and condition-specific BOLD-signal variability during distractor inhibition, p < 0.05 (corrected). B, Conjunction in left IJF (k = 8 voxel) between (1) negative correlation of task-switching costs in error rates with BOLD-signal variability, as shown in Figure 2B and (2) positive correlation of distractor inhibition costs in RT and BOLD-signal variability. C, Scatter plots illustrating the antagonistic relationship between BOLD-signal variability and behavior for task switching (left) and distractor inhibition (right) in the overlapping part of the IFJ (note that, after exclusion of one multivariate outlier as detected by Mahalanobis distance, the result for distractor inhibition was still significant with r = 0.26, p = 0.02). **p < 0.01. ER, Error rate.
For analyses of the behavioral data, first all trials with an RT ≤ 150 ms were eliminated as suggested by previous research (MacDonald et al., 2006b; Dixon et al., 2007; Garrett et al., 2011). An upper boundary for legitimate RTs was not applied because trials lasted only 2 s and thus slower responses automatically counted as misses. Additionally, for the baseline condition, trials directly after the performance of a task-switching or distractor inhibition trial were excluded from analyses because they might be “contaminated” with other cognitive processes, such as switching back to the upper digit. Costs in behavioral performance from task switching or distractor inhibition were calculated by subtracting the mean RT or mean error rate in the baseline condition from the mean RT or mean error rate in the respective task condition, resulting in switch costs in RT and error rate, as well as distractor costs in RT and error rate (Monsell, 2003). For assessment of behavioral variability, the intra-individual coefficient of variation (ICV) was calculated for each participant by dividing the individual mean SD by the individual mean of RTs (Guilford, 1956; Schmiedek et al., 2009). This was done for the ongoing condition for which a total of 240 trials was available, thus allowing for a reliable estimation of behavioral variability. Behavioral variability was also assessed in a condition-specific manner, i.e., the ICV was also calculated for RTs of task switching and distractor inhibition. A residualization of age from the behavioral data was not performed because age did not correlate with any of the behavioral measures. The behavioral measures were subjected to correlational analyses with each other and were also screened for possible speed–accuracy tradeoff effects as indicated by highly negative correlations between RTs and error rates of one condition (Heitz, 2014). Finally, correlations between behavioral data and BOLD-signal variability were examined.
FMRI procedure
All images were acquired on a 3 Tesla Siemens Trio MRI scanner equipped with a fast gradient system for EPI and a 32-channel head coil. A total of 350 functional volumes were acquired in two runs, each lasting ∼5 min, using a T2*-weighted BOLD-sensitive gradient-echo, EPI sequence with 32 oblique axial slices (thickness, 3 mm; interslice gap, 1 mm; field of view, 192 mm; matrix size, 64 × 64; in-plane resolution, 3 × 3 mm; repetition time, 1800 ms; echo time, 30 ms; flip angle, 80°). The first eight volumes of each run were discarded to allow for stable magnetization. In addition, a T1-weighted magnetization prepared-rapid gradient echo scan was acquired (thickness, 1 mm; field of view, 256 mm; matrix size, 256 × 256; in-plane resolution, 1 × 1 mm; repetition time, 1570 ms; echo time, 2.63 ms; flip angle, 30°).
fMRI data analysis
Data preprocessing.
fMRI data were first preprocessed using the SPM8 software (www.fil.ion.ucl.ac.uk/spm/software/spm8/): EPI images were corrected for slice-timing differences and motion. Segmentation of the individual subject's structural image provided normalization parameters that were used to normalize the functional images to the Montreal Neurological Institute (MNI) template reference brain. Finally, images were smoothed with an 8 mm FWHM Gaussian kernel. To further denoise the data, individual independent component analyses (ICA) were conducted for each subject as implemented in FSL MELODIC (Beckmann and Smith, 2004). After visual inspection of the components following the procedure described by Kelly et al. (2010), the individual noise components were filtered from the original fMRI data by including their time series into the general linear model (GLM) as additional regressors. Analogously, time series of white matter and CSF ROIs were filtered out. These additional preprocessing steps have been shown to reduce variance of the signal considerably while, at the same time, increasing predictive power of the actual BOLD-signal variability measure (Garrett et al., 2010, 2014). Mean BOLD activity was analyzed as described previously (Armbruster et al., 2012).
Calculation of BOLD-signal variability.
We quantified BOLD-signal variability by calculating the DoR of two different regression models within SPM8 (Fig. 1B–D), using both a GLM with a canonical hemodynamic response function including time and dispersion derivatives to account for variations in the peak and width of the hemodynamic response, and a high-pass filter with 128 s cutoff (Friston et al., 1998). Model A (Fig. 1B) is a standard regression model for an individual subject as it is typically used in fMRI data analyses, including one regressor per condition, one for error trials, plus additional regressors for motion parameters and for the individual noise components from the ICA. Model B (Fig. 1C) is a condition-specific trial-by-trial regression model that is equivalent to the first model, i.e., including one regressor per condition, with the exception that, for the condition of interest (e.g., task switching in Model B), each single correct trial is represented by its own regressor. Note also that, in this model, error trials are modeled within one regressor.
Model A shows the standard regression model:
and Model B shows the trial-by-trial regression model (exemplified for task switching):
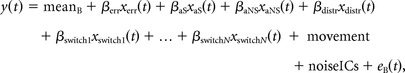 |
where mean indicates intercept, err indicates error trials, aS indicates ambiguous switch trials, aNS indicates ambiguous non-switch trials, distr indicates distractor trials, switch indicates switch trials, switch1…switchN indicates correct switch trials 1 to N (maximum 20), movement indicates movement parameters from the SPM realignment procedure during preprocessing, six parameters in total, each modeled with its own regressor, noiceICs indicates independent components identified as artifacts, each IC modeled with its own regressor, and e indicates error term.
The main rational underlying the present analysis is that the DoR of these two regression models provides an estimate of the trial-to-trial variability in one specific condition of the experiment by quantifying how much additional variance can be explained when explicitly accounting for trial-to-trial variations in BOLD activation strength by separately modeling each individual trial from that condition. Because residuals are the not-explained variance (varres) of a regression model equaling total variance (vartot) minus explained variance (varex), it can be shown that the DoR measure calculated here is equivalent to the difference of explained variance of Model B minus the explained variance of Model A:
difference of the residuals of the two models:
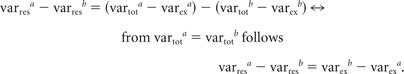 |
By taking the DoR variance (or the difference of explained variance) of two models that are completely equivalent apart from the fact that there is one “mean” regressor for the condition of interest in the one model (Model A/standard) and one regressor for each trial of this condition in the other model (Model B/trial-by-trial; in this study, up to 20 separate regressors depending on error rate), the DoR measure is a variance-based measure of neural variability (see also Results Garrett et al., 2013b). A crucial advantage of the DoR measure presented here is that the residuals per voxel are computed automatically by SPM during model estimation and saved as residual maps (ResMS.img), so that only a difference between two images has to be calculated. This analysis method can be implemented very efficiently by estimating two GLMs and then calculating DoR maps. By default, SPM corrects residual maps by the degrees of freedom of the regression model. However, such a correction would bias the DoR analysis, because the number of degrees of freedom is confounded with the error rate in the trial-to-trial regression model (in which only correct trials were modeled with trial-specific regressors). To avoid this bias, which would lead to a smaller DoR in subjects with higher error rates, we removed this correction for both regression models by adjusting the respective MATLAB code that implements the GLM (SPM8: spm_spm.m, VResMS.pinfo(1) = 1/xX.trRV in line 899 deleted).
Group analyses were performed in the standard framework of SPM by feeding the individual, condition-specific DoR maps into a group-level random-effects model. BOLD-signal variability during distractor inhibition and during task switching were analyzed separately.
Individual differences analyses.
For the purpose of this study, we focused on individual difference analyses, i.e., correlational analyses. Thus, covariates were entered into the group DoR analyses of BOLD-signal variability. We were interested specifically in potential relationships between BOLD-signal variability and the behavioral costs of task switching and distractor inhibition as determined using RTs and error rates. Furthermore, we examined the relationship between BOLD-signal and behavioral variability (ICV; see above). Because age has been shown to affect brain signal variability (Garrett et al., 2010) and because brain signal variability and age were also correlated in our data (see Results), we controlled for age effects by including age as a covariate of no interest. Finally, all individual differences results, i.e., bivariate correlations, were checked for multivariate outliers with the Mahalanobis distance measure (Mahalanobis, 1936).
Throughout all analyses, a significance level of 5% (familywise correction for multiple comparisons) was applied. To this end, a voxel-level threshold of p < 0.005 (uncorrected) was combined with a non-arbitrary cluster-extent threshold (Forman et al., 1995). The cluster-extent threshold (k = 133) resulting in a corrected probability of 5% for false positives was determined via a Monte Carlo simulation with 10,000 iterations using the AFNI (for Automated Functional Neuro-Imaging) routine AlphaSim (Ward, 2000) to model the functional image matrix, excluding cerebellar and brainstem areas as our focus lies on cortical functions.
Results
Behavioral performance
As expected given previous results in an independent sample (Armbruster et al., 2012), we observed greater difficulty—as indicated by performance costs relative to the ongoing task—for both task switching (i.e., cognitive flexibility) and distractor inhibition (i.e., cognitive stability; cf. Table 1). RT costs were significantly higher for task switching compared with distractor inhibition (t(75) = 3.6, p = 0.001; Cohen's d = 0.51), whereas distractor inhibition resulted in higher error rate costs (t(75) = 2.3, p = 0.024; Cohen's d = 0.37). Task switching error costs and distractor inhibition RT costs showed a trend toward a negative correlation (r = −0.20; p = 0.08), suggesting that those participants that inhibit distractors more efficiently, i.e., that need less time to do so, tend to commit more errors during task switching. Although an inverse relationship between performance accuracy and speed can be an indicator of speed–accuracy tradeoffs, this result was here found across conditions, which is not typically considered evidence for a speed–accuracy tradeoff (Heitz, 2014). However, we also found a significant negative correlation between task switching RTs and task switching error rates (r = −0.24, p = 0.04), which could indeed hint toward a speed–accuracy tradeoff. When examining this correlation in more detail, it became evident that it was driven by two subjects exhibiting very high error rates and very short RTs at the same time; also, a Mahalanobis distance analysis for multivariate outliers identified these subjects as extremes, although not as outliers (MD1 = 9.8; MD2 = 12.8). When excluding these subjects, the correlation became insignificant (r = −0.12, p = 0.33), whereas all other results only slightly changed numerically but were unchanged with respect to significance level. For distractor inhibition, no evidence for a speed–accuracy tradeoff was found (r = 0.16, p = 0.18).
Table 1.
Descriptive statistics for behavioral data
| Condition | RTs (ms) |
Error rates (%) |
||
|---|---|---|---|---|
| Mean | SE | Mean | SE | |
| Ongoing task | 679.4 | 10.3 | 2.98 | 0.6 |
| Distractor inhibition | 903.5 | 14.8 | 9.08 | 0.9 |
| Task switching | 961.9 | 11.5 | 6.45 | 0.9 |
| Distractor costs | 224.1 | 16.3 | 6.10 | 1.1 |
| Switch costs | 282.5 | 16.3 | 3.47 | 1.1 |
SE was computed according to Cousineau (2005) and Morey (2008), i.e., the between-subject variance was removed as a repeated-measures ANOVA was applied for data analysis.
Effects of behavioral variability on cognitive stability versus flexibility
Behavioral variability was determined separately for each participant by calculating the ICV (see Materials and Methods) for RTs from the ongoing condition and for RTs in the two critical task conditions, i.e., task switching and distractor inhibition. Behavioral variability differed substantially between individuals (mean ICV ongoing ± SD, 0.2 ± 0.04; mean ICV switch ± SD, 0.13 ± 0.03; mean ICV distractor inhibition ± SD, 0.2 ± 0.06). Behavioral variability in the ongoing condition was differentially related to cognitive flexibility versus stability: although the ICV for the ongoing task was significantly negatively correlated with error rate costs for task switching (r = −0.314, p = 0.006; R2 = 0.1; RT costs task switching, r = −0.024, p = 0.839), it was positively related to RT costs for distractor inhibition (r = 0.40, p = 0.0004; R2 = 0.16 after excluding one outlier; distractor inhibition error costs, r = −0.027, p = 0.814). RT variability in the distractor inhibition condition did not correlate with any of the distractor inhibition cost measures. However, for task switching, behavioral variability results showed a positive correlation with task-switching costs in RTs (r = 0.41, p = 0.0003; R2 = 0.17). The three measures of behavioral variability were not correlated with each other (all p > 0.1), indicating that they most likely reflect different system characteristics. Age did not correlate with any of the behavioral performance measures (all p > 0.1). Thus, performance data showed substantial between-individual differences in behavioral variability and suggest that behavioral variability under certain circumstances can be beneficial for cognitive flexibility but detrimental for cognitive stability.
Mean BOLD activity for cognitive flexibility and stability
As demonstrated previously (Armbruster et al., 2012), task switching and distractor inhibition in the present task activate a widespread frontoparietal network, that mostly overlaps for both conditions but is at the same time more extended for task switching (Fig. 2A; see also Armbruster et al., 2012, their Fig. 4A).
Figure 2.

Brain activity and performance correlations with brain signal variability. A, Univariate activation for task switching (red) and distractor inhibition (yellow); overlap in orange (for visualization purposes, a strict threshold of p < 0.000000000001 was applied so that local maxima of activation patterns can be better identified.). B, Negative correlations between condition-specific BOLD-signal variability and error costs: areas in red show significant negative correlation with error costs in task switching, areas in blue correlate negatively with error costs in distractor inhibition, and overlap in magenta. BG, Basal ganglia; PCC, posterior cingulate corex; SFG, superior frontal gyrus.
Differential effects of brain signal variability on cognitive stability versus flexibility
The main purpose of this study was to explore whether or not brain signal variability is differentially related to cognitive flexibility versus stability. To this end, we estimated condition-specific BOLD-signal variability (for details, see Fig. 1B,C and Materials and Methods) separately for each participant and condition and examined the relationship between BOLD-signal variability and behavioral performance, as well as behavioral variability. For task switching, BOLD-signal variability correlated negatively with error rate costs in a set of areas comprising the left IFJ, bilateral middle frontal gyrus (MFG), right inferior frontal gyrus (IFG) and insula, the middle and anterior cingulate cortex (ACC), supplementary motor area (SMA), medial prefrontal cortex (MPFC), occipital regions, thalamus, and right basal ganglia (Fig. 2B, areas in red; Table 2). Thus, individuals with higher brain signal variability in these areas show smaller task-switching costs with respect to error rates and are thus more effective in task switching. A subset of these areas also showed a negative correlation between BOLD-signal variability and error rate costs for distractor inhibition (Fig. 2B, areas in blue, overlap with task switching in magenta; Table 2).
Table 2.
Coordinates of peak correlations between condition-specific BOLD-signal variability and performance
| Brain region | BA | Hemisphere | MNI coordinates |
Tmax | k | ||
|---|---|---|---|---|---|---|---|
| x | y | z | |||||
| Task switching BOLD-signal variability negatively correlating with task switching costs in error rates | |||||||
| IFJ | 9/45/8/6 | Left | −34 | 6 | 40 | 3.49 | 10301** |
| MFG/superior frontal gyrus | 9/8 | Left | −36 | 32 | 34 | 3.85 | * |
| ACC | 24/32 | Right | 2 | 40 | 16 | 3.59 | * |
| MPFC | 9/10 | Left | −2 | 62 | 2 | 3.72 | * |
| SMA | 32 | Left | −2 | 10 | 46 | 4.21 | * |
| Middle/posterior cingulate cortex | 31/24 | Right | 6 | −38 | 46 | 5.65 | * |
| Postcentral gyrus | 43 | Left | −44 | −22 | 24 | 4.29 | * |
| IFG/insula | 13/45/46/47 | Right | 34 | 26 | 12 | 3.77 | 6338† |
| Calcarine sulcus | 17/18 | Right | 2 | −96 | 0 | 4.13 | † |
| Thalamus | Left | −16 | −28 | 2 | 4.33 | † | |
| Distractor inhibition BOLD-signal variability negatively correlating with distractor inhibition costs in error rates | |||||||
| MPFC | 10 | Right | 6 | 32 | −10 | 4.05 | 1007 |
| 0 | 60 | 8 | 3.76 | ||||
| IFG | 44/45/36/47 | Right | 56 | 28 | 10 | 4.27 | 285 |
| Precuneus | 31/7 | Right | 2 | −50 | 44 | 3.84 | 406 |
| Angular gyrus | 39/40 | Left | −52 | −62 | 36 | 3.60 | 280 |
| Right | 62 | −50 | 28 | 3.91 | 206 | ||
| Cuneus/occipital cortex | Right | 14 | −86 | 42 | 3.97 | 774 | |
| Distractor inhibition BOLD-signal variability positively correlating with distractor inhibition costs in RT | |||||||
| IFJ | 9/8 | Left | −42 | 12 | 40 | 3.99 | 137 |
For correlations between task-switching-related BOLD-signal variability and task-switching error costs local maxima are reported as the correlations formed from two extensive clusters: *one containing 10,301 voxels and the †other containing 6338 voxels.
In contrast, RT costs for distractor inhibition correlated positively with inhibition-related BOLD-signal variability in the left IFJ (Fig. 3A; Table 2). A conjunction analysis revealed that the negative correlation between BOLD signal variability and distractor inhibition costs and the positive correlation between BOLD signal variability and task-switching costs in fact overlapped in the left IFJ (Fig. 3B). Costs in RT for task switching showed no significant relationship with BOLD-signal variability. Thus, variability of BOLD signals at the junction region of the left inferior frontal and precentral sulci (IFJ) is antagonistically related to cognitive flexibility and stability (Fig. 3C).
Relationship between brain signal variability and behavioral variability
Because we were interested in exploring whether or not behavioral variability is predictive of variability in neural processing, we also examined the relationship between condition-specific BOLD-signal variability and behavioral variability as measured by the ICV. For distractor inhibition-related neural variability, we did not observe any correlations with the measures of behavioral variability. However, for neural variability during task switching, we observed a positive correlation with behavioral variability in the ongoing condition, in the left IFJ, the ACC, right precentral and postcentral regions, right middle temporal gyrus, as well as an occipital region in the right hemisphere and in a subcortical cluster including the left caudate nucleus and thalamus (Table 3). For behavioral variability during task switching, there were only negative correlations found with neural variability in this condition, comprising an extensive cluster of brain regions including precentral and postcentral gyri, bilateral SMA, inferior parietal cortex, and insula (Table 3).
Table 3.
Coordinates of peak correlations between condition-specific BOLD-signal variability and behavioral variability
| Brain region | BA | Hemisphere | MNI coordinates |
Tmax | k | ||
|---|---|---|---|---|---|---|---|
| x | y | z | |||||
| Task-switching BOLD-signal variability positively correlating with ICV of the ongoing condition | |||||||
| IFJ | 9/6 | Left | −34 | 8 | 40 | 3.75 | 236 |
| ACC | 32/24 | Right | 6 | 22 | 30 | 3.73 | 207* |
| Precentral and postcentral gyrus | 4/6 | Right | 48 | −14 | 32 | 3.82 | * |
| Middle temporal gyrus | 22 | Right | 52 | −14 | 0 | 4.00 | 320 |
| 22/39 | Right | 56 | −58 | 14 | 3.72 | 169 | |
| Occipital cortex | 19/18 | Right | 42 | −78 | −12 | 4.67 | 145 |
| Caudate | Left | −12 | −2 | 22 | 4.71 | 377† | |
| Thalamus | Left | −2 | −18 | 16 | 3.71 | † | |
| Task-switching BOLD-signal variability negatively correlating with ICV of task switching | |||||||
| Precentral gyrus | 6/4 | Right | 36 | −14 | 40 | 5.21 | 10,629‡ |
| Precentral/postcentral gyrus | 6/4/43 | Left | −52 | −10 | 14 | 4.27 | ‡ |
| SMA | 24/31 | Right | 2 | −2 | 50 | 3.82 | ‡ |
| Insula | 13 | Right | 48 | −6 | 4 | 4.35 | ‡ |
| 13/41 | Left | −42 | −16 | 10 | 4.00 | ‡ | |
| Inferior parietal cortex | 40 | Left | −63 | −30 | 28 | 3.33 | ‡ |
For some areas, local maxima are reported as the correlations formed from coherent clusters: *contains 207 voxels,
†contains 377 voxels, and
‡contains 10,629 voxels.
Comparing DoRs with β-estimate variance
Finally, to validate the proposed DoR method for analyzing BOLD-signal variability, we calculated the variance across the β estimates for the task-switching condition as calculated in the trial-by-trial model for each subject, for a cluster of interest in the left IFJ comprising eight voxels that we identified above as showing opposing relationships between BOLD-signal variability and behavioral distractor versus switch costs (see above and Fig. 3B). In this cluster, we found a highly significant positive correlation of the DoR measure with trial-by-trial variability (r = 0.601, p < 0.0000001). This result demonstrates that the DoR measure is highly comparable with variance-based measures of neural variability.
Discussion
Although previous studies have shown that variability in neural processing can also be helpful (Garrett et al., 2010, 2011, 2013b, 2014), we show in this study that the effect of behavioral and brain signal variability on task performance varies depending on task demands. We implemented a new analysis pipeline for analyzing trial-to-trial BOLD-signal variability in a condition-specific manner, i.e., the DoR approach, and could show that such antagonistic relationships between variability and flexible versus stable task performance can also be observed at the neural level, driven in particular by neural variability in the IFJ region.
The relationship between behavioral variability and cognitive processing
In this study, we determined the ICV for the ongoing condition as a robust indicator of behavioral variability. The observed antagonistic relationship between this basic measure of variability and the behavioral costs of cognitive flexibility versus stability is in line with our hypothesis derived from computational theories (Durstewitz and Seamans, 2008; Ueltzhöffer et al., 2015), i.e., that higher levels of variability facilitate cognitive flexibility but have detrimental effects on cognitive stability. Interestingly, this antagonistic effect is reflected in (lower) error rate costs for task switching but in (higher) RT costs for distractor inhibition. Note that this also holds for brain activation results with respect to IFJ variability (see below). We speculatively interpret this as indicating that, with higher neural variability, brain network states representing different task rules are more readily available (Deco et al., 2009). When required to switch from one task to the other, the system can accordingly activate the new rule more easily, resulting in fewer errors. Nevertheless, it might for the exact same reason take longer to suppress irrelevant task rules triggered by a distractor stimulus, which results in longer RTs during distractor inhibition. However, this interpretation is at present speculative in nature and requires additional research in the future.
We found no such association for inhibition-specific behavioral variability and observed higher RT switch costs in participants with greater task switching-related behavioral variability. In addition, the three indices of behavioral variability were not correlated, suggesting that they may in fact reflect different system properties. For example, the switching-specific ICV effect seems to indicate that increased variability during switching reflects inefficient implementation of switching-specific cognitive processes; this finding is in line with previous research finding higher levels of behavioral variability in cognitively impaired samples (MacDonald et al., 2006a). In contrast, we interpret the antagonistic relation of behavioral variability in the ongoing condition to switch versus distractor costs as an indicator of basic system characteristics determining how efficiently the cognitive system can transition from one task state to another (Durstewitz and Seamans, 2008; Deco et al., 2009), which may be beneficial for some situations but detrimental for others (for a similar reasoning, see Dreisbach and Goschke, 2004; Dreisbach, 2006).
Beneficial effects of brain signal variability on performance
Our results suggest that higher levels of brain signal variability lead to reduced error rates, i.e., higher effectiveness of performance. This was shown for task switching and for distractor inhibition, which is in line with previous research suggesting beneficial effects of higher brain signal variability in general (Garrett et al., 2011). Beneficial effects on performance were shown for variability of neural processing in the MPFC, posterior cingulate cortex (PCC), calcarine sulcus, and right middle posterior temporal gyrus. Especially for MPFC, there is evidence that brain signal variability increases from rest to task in healthy young subjects (Garrett et al., 2013a), is higher in faster and more consistent performers (Garrett et al., 2011), and that variability first increases with higher task difficulty but then decreases when behavioral performance drops (Garrett et al., 2014).
MPFC is acknowledged as a prominent region of the default mode network (DMN) for which reliable task-related activity decreases have been observed (Garrett et al., 2014). So it appears that MPFC deactivates and at the same time shows higher levels of variability during task, both of which can be beneficial for task performance (Raichle et al., 2001). With respect to the current results, this reasoning also holds for the PCC, another important hub of the DMN (Anticevic et al., 2010). One explanation for this may be found in the observation that increased trial-to-trial variability goes along with greater spontaneous coherence between regions (Fox et al., 2006) and that the functional embedding of a region is related to its variability (Mišić et al., 2011). Thus, we tentatively speculate that higher brain signal variability may reflect greater connectivity with other brain regions, which could for example influence task-related patterns of deactivation and activation of DMN versus task-relevant brain networks, respectively (Fox et al., 2005).
Antagonistic effects of brain signal variability on performance
Previous work has shown that the amount of variability in brain signals can vary between cognitive states (rest vs task; Garrett et al., 2013a), task conditions (n-back with upright vs inverted faces; Misić et al., 2010), and difficulty levels (Garrett et al., 2014). A key finding of the present study is that task context can also modulate how brain signal variability influences behavioral performance. Specifically, we show that variability in the IFJ antagonistically modulates task performance during cognitive flexibility versus stability, suggesting that neural variability in this area affects the stability of task rule representations. The IFJ is a region (1) that was previously (based on mean BOLD activity) shown to be important for task switching (Brass et al., 2005; Derrfuss et al., 2005) and for distractor inhibition (Armbruster et al., 2012; Ueltzhöffer et al., 2015), (2) whose activity and connectivity was shown to be modulated by individual behavioral flexibility in ways similar to those observed for neural variability in the present study (Armbruster et al., 2012); and (3) whose activity and connectivity to striatal areas during task switching is modulated by a genetic polymorphism regulating the density of the dopamine D2 receptor (DRD2; Stelzel et al., 2010). The current results underline the importance of the IFJ for this antagonistic relationship between task switching and distractor inhibition by showing that variability of neural processing in IFJ has opposite effects on cognitive stability versus flexibility.
Physiological relevance of brain signal variability
We have shown in previous work that activity and connectivity of IFJ during task switching are modulated by DRD2/ANKK1–TaqIa, a polymorphism that regulates the density of DRD2 in the striatum: individuals with lower DRD2 densities, supposedly associated with increased dopamine activity and decreased prefrontal D1 receptor activation, show better performance despite lesser IFJ activity and IFJ-to-striatum connectivity during task switching (Stelzel et al., 2010). We propose that, together with recent work suggesting that BOLD-signal variability also depends on dopamine levels (Garrett et al., 2015; Guitart-Masip et al., 2015), these lines of research link the current findings to computational theories that model working memory as network attractor states of prefrontal neuronal circuits (Durstewitz and Seamans, 2008). This can provide a sound framework for interpreting the physiological relevance of our results, because neural variability might be interpreted as more frequent or easier transitions from one network state to another. According to Durstewitz and Seamans (2008), such transitions of network states should be more prominent when the network is in a DRD2-dominated state that is, according to their computational simulations, characterized by rather unstable representations, lower SNR, and spontaneous transitions between representations. At the behavioral level, this should afford more flexible processing, and our results support this prediction. Conversely, stable maintenance of representations and a higher SNR, which is a characteristic of D1-dominated activity states should be beneficial for cognitive stability (Durstewitz and Seamans, 2008). Note that these macroscopic model assumptions are also compatible with more recent work suggesting that stable working memory maintenance is achieved by dynamic microscopic processes, such as limit cycle activity (Balaguer-Ballester et al., 2011; Sreenivasan et al., 2014). As we argued previously, evidence points to the IFJ as a critical region for initiating network switches or, in other terms, as a region that represents task rules and thus contains networks whose transitions lead to shifts in the currently active task rule (Armbruster et al., 2012). Accordingly, the robustness of task rule representations may be related to brain signal variability in the IFJ and may thus influence task performance during both cognitive flexibility and cognitive stability in an antagonistic manner.
To conclude, this study demonstrates that stochastic variability of neural processing—measured here on the basis of BOLD signal variability—can influence behavioral performance differentially depending on task context. On the one hand, we observed a generally beneficial effect of brain-signal variability on the accuracy of performance, which is in line with previous research. In addition, neural variability in the IFJ area, i.e., in a critical hub region for cognitive flexibility, supports flexibility but hinders cognitive stability. These results underscore the importance of considering the variability of neural processes when investigating the complex relationship between brain and behavior.
Footnotes
This research was funded by German Ministry of Education and Research Grant 01GQ1003A. C.J.F. was also supported by the State Offensive for the Development of Scientific and Economic Excellence initiative of the State of Hessen, the Emmy Noether Program of the German Research Foundation (Grant FI 848/3-1), and VIDI Grant 45209006 from the Netherlands Organization for Scientific Research.
The authors declare no competing financial interests.
References
- Anticevic A, Repovs G, Shulman GL, Barch DM. When less is more: TPJ and default network deactivation during encoding predicts working memory performance. Neuroimage. 2010;49:2638–2648. doi: 10.1016/j.neuroimage.2009.11.008. [DOI] [PMC free article] [PubMed] [Google Scholar]
- Armbruster DJ, Ueltzhöffer K, Basten U, Fiebach CJ. Prefrontal cortical mechanisms underlying individual differences in cognitive flexibility and stability. J Cogn Neurosci. 2012;24:2385–2399. doi: 10.1162/jocn_a_00286. [DOI] [PubMed] [Google Scholar]
- Balaguer-Ballester E, Lapish CC, Seamans JK, Durstewitz D. Attracting dynamics of frontal cortex ensembles during memory-guided decision-making. PLoS Comput Biol. 2011;7:e1002057. doi: 10.1371/journal.pcbi.1002057. [DOI] [PMC free article] [PubMed] [Google Scholar]
- Beckmann CF, Smith SM. Probabilistic independent component analysis for functional magnetic resonance imaging. IEEE Trans Med Imaging. 2004;23:137–152. doi: 10.1109/TMI.2003.822821. [DOI] [PubMed] [Google Scholar]
- Berch DB, Foley EJ, Hill RJ, Ryan PM. Extracting parity and magnitude from Arabic numerals: developmental changes in number processing and mental representation. J Exp Child Psychol. 1999;74:286–308. doi: 10.1006/jecp.1999.2518. [DOI] [PubMed] [Google Scholar]
- Brass M, Derrfuss J, Forstmann B, von Cramon DY. The role of the inferior frontal junction area in cognitive control. Trends Cogn Sci. 2005;9:314–316. doi: 10.1016/j.tics.2005.05.001. [DOI] [PubMed] [Google Scholar]
- Cousineau D. Confidence intervals in within-subject designs: a simpler solution to Loftus and Masson's method. Tutorial Quant Methods Psychol. 2005;1:42–45. [Google Scholar]
- Deco G, Rolls ET, Romo R. Stochastic dynamics as a principle of brain function. Prog Neurobiol. 2009;88:1–16. doi: 10.1016/j.pneurobio.2009.01.006. [DOI] [PubMed] [Google Scholar]
- Derrfuss J, Brass M, Neumann J, von Cramon DY. Involvement of the inferior frontal junction in cognitive control: meta-analyses of switching and Stroop studies. Hum Brain Mapp. 2005;25:22–34. doi: 10.1002/hbm.20127. [DOI] [PMC free article] [PubMed] [Google Scholar]
- Dixon RA, Garrett DD, Lentz TL, MacDonald SW, Strauss E, Hultsch DF. Neurocognitive markers of cognitive impairment: exploring the roles of speed and inconsistency. Neuropsychology. 2007;21:381–399. doi: 10.1037/0894-4105.21.3.381. [DOI] [PubMed] [Google Scholar]
- Dreisbach G. How positive affect modulates cognitive control: the costs and benefits of reduced maintenance capability. Brain Cogn. 2006;60:11–19. doi: 10.1016/j.bandc.2005.08.003. [DOI] [PubMed] [Google Scholar]
- Dreisbach G, Goschke T. How positive affect modulates cognitive control: reduced perseveration at the cost of increased distractibility. J Exp Psychol Learn Mem Cogn. 2004;30:343–353. doi: 10.1037/0278-7393.30.2.343. [DOI] [PubMed] [Google Scholar]
- Durstewitz D, Seamans JK. The dual-state theory of prefrontal cortex dopamine function with relevance to catechol-o-methyltransferase genotypes and schizophrenia. Biol Psychiatry. 2008;64:739–749. doi: 10.1016/j.biopsych.2008.05.015. [DOI] [PubMed] [Google Scholar]
- Faisal AA, Selen LP, Wolpert DM. Noise in the nervous system. Nat Rev Neurosci. 2008;9:292–303. doi: 10.1038/nrn2258. [DOI] [PMC free article] [PubMed] [Google Scholar]
- Forman SD, Cohen JD, Fitzgerald M, Eddy WF, Mintun MA, Noll DC. Improved assessment of significant activation in functional magnetic resonance imaging (fMRI): use of a cluster-size threshold. Magn Reson Med. 1995;33:636–647. doi: 10.1002/mrm.1910330508. [DOI] [PubMed] [Google Scholar]
- Fox MD, Snyder AZ, Vincent JL, Corbetta M, Van Essen DC, Raichle ME. The human brain is intrinsically organized into dynamic, anticorrelated functional networks. Proc Natl Acad Sci U S A. 2005;102:9673–9678. doi: 10.1073/pnas.0504136102. [DOI] [PMC free article] [PubMed] [Google Scholar]
- Fox MD, Snyder AZ, Zacks JM, Raichle ME. Coherent spontaneous activity accounts for trial-to-trial variability in human evoked brain responses. Nat Neurosci. 2006;9:23–25. doi: 10.1038/nn1616. [DOI] [PubMed] [Google Scholar]
- Friston KJ, Fletcher P, Josephs O, Holmes A, Rugg MD, Turner R. Event-related fMRI: characterizing differential responses. Neuroimage. 1998;7:30–40. doi: 10.1006/nimg.1997.0306. [DOI] [PubMed] [Google Scholar]
- Garrett DD, Kovacevic N, McIntosh AR, Grady CL. Blood oxygen level-dependent signal variability is more than just noise. J Neurosci. 2010;30:4914–4921. doi: 10.1523/JNEUROSCI.5166-09.2010. [DOI] [PMC free article] [PubMed] [Google Scholar]
- Garrett DD, Kovacevic N, McIntosh AR, Grady CL. The importance of being variable. J Neurosci. 2011;31:4496–4503. doi: 10.1523/JNEUROSCI.5641-10.2011. [DOI] [PMC free article] [PubMed] [Google Scholar]
- Garrett DD, Kovacevic N, McIntosh AR, Grady CL. The modulation of BOLD variability between cognitive states varies by age and processing speed. Cereb Cortex. 2013a;23:684–693. doi: 10.1093/cercor/bhs055. [DOI] [PMC free article] [PubMed] [Google Scholar]
- Garrett DD, Samanez-Larkin GR, MacDonald SW, Lindenberger U, McIntosh AR, Grady CL. Moment-to-moment brain signal variability: a next frontier in human brain mapping? Neurosci Biobehav Rev. 2013b;37:610–624. doi: 10.1016/j.neubiorev.2013.02.015. [DOI] [PMC free article] [PubMed] [Google Scholar]
- Garrett DD, McIntosh AR, Grady CL. Brain signal variability is parametrically modifiable. Cereb Cortex. 2014;24:2931–2940. doi: 10.1093/cercor/bht150. [DOI] [PMC free article] [PubMed] [Google Scholar]
- Garrett DD, Nagel IE, Preuschhof C, Burzynska AZ, Marchner J, Wiegert S, Jungehülsing GJ, Nyberg L, Villringer A, Li SC, Heekeren HR, Bäckman L, Lindenberger U. Amphetamine modulates brain signal variability and working memory in younger and older adults. Proc Natl Acad Sci U S A. 2015;112:7593–7598. doi: 10.1073/pnas.1504090112. [DOI] [PMC free article] [PubMed] [Google Scholar]
- Guilford JP. Fundamental statistics in psychology and education. New York: McGraw-Hill; 1956. [Google Scholar]
- Guitart-Masip M, Salami A, Garrett D, Rieckmann A, Lindenberger U, Backman L. BOLD variability is related to dopaminergic neurotransmission and cognitive aging. Cereb Cortex. 2015 doi: 10.1093/cercor/bhv029. doi: 10.1093/cercor/bhv029. Advance online publication. Retrieved February 16, 2016. [DOI] [PubMed] [Google Scholar]
- Heitz RP. The speed-accuracy tradeoff: history, physiology, methodology, and behavior. Front Neurosci. 2014;8:150. doi: 10.3389/fnins.2014.00150. [DOI] [PMC free article] [PubMed] [Google Scholar]
- Kelly RE, Jr, Alexopoulos GS, Wang Z, Gunning FM, Murphy CF, Morimoto SS, Kanellopoulos D, Jia Z, Lim KO, Hoptman MJ. Visual inspection of independent components: defining a procedure for artifact removal from fMRI data. J Neurosci Methods. 2010;189:233–245. doi: 10.1016/j.jneumeth.2010.03.028. [DOI] [PMC free article] [PubMed] [Google Scholar]
- MacDonald SW, Nyberg L, Bäckman L. Intra-individual variability in behavior: links to brain structure, neurotransmission and neuronal activity. Trends Neurosci. 2006a;29:474–480. doi: 10.1016/j.tins.2006.06.011. [DOI] [PubMed] [Google Scholar]
- MacDonald SW, Hultsch DF, Bunce D. Intraindividual variability in vigilance performance: does degrading visual stimuli mimic age-related “neural noise”? J Clin Exp Neuropsychol. 2006b;28:655–675. doi: 10.1080/13803390590954245. [DOI] [PubMed] [Google Scholar]
- Mahalanobis PC. On the generalised distance in statistics. Proc Natl Institute Sci India. 1936;2:49–55. [Google Scholar]
- McIntosh AR, Kovacevic N, Itier RJ. Increased brain signal variability accompanies lower behavioral variability in development. PLoS Comput Biol. 2008;4:e1000106. doi: 10.1371/journal.pcbi.1000106. [DOI] [PMC free article] [PubMed] [Google Scholar]
- McIntosh AR, Kovacevic N, Lippe S, Garrett D, Grady C, Jirsa V. The development of a noisy brain. Arch Ital Biol. 2010;148:323–337. [PubMed] [Google Scholar]
- Misić B, Mills T, Taylor MJ, McIntosh AR. Brain noise is task dependent and region specific. J Neurophysiol. 2010;104:2667–2676. doi: 10.1152/jn.00648.2010. [DOI] [PubMed] [Google Scholar]
- Mišić B, Vakorin VA, Paus T, McIntosh AR. Functional embedding predicts the variability of neural activity. Front Syst Neurosci. 2011;5:90. doi: 10.3389/fnsys.2011.00090. [DOI] [PMC free article] [PubMed] [Google Scholar]
- Monsell S. Task switching. Trends Cogn Sci. 2003;7:134–140. doi: 10.1016/S1364-6613(03)00028-7. [DOI] [PubMed] [Google Scholar]
- Morey RD. Confidence intervals from normalized data: a correction to Cousineau (2005) Tutorial Quant Methods Psychol. 2008;4:61–64. [Google Scholar]
- Raichle ME, MacLeod AM, Snyder AZ, Powers WJ, Gusnard DA, Shulman GL. A default mode of brain function. Proc Natl Acad Sci U S A. 2001;98:676–682. doi: 10.1073/pnas.98.2.676. [DOI] [PMC free article] [PubMed] [Google Scholar]
- Rolls ET, Deco G. The noisy brain: stochastic dynamics as a principle of brain function. Oxford, UK: Oxford UP; 2010. [DOI] [PubMed] [Google Scholar]
- Schmiedek F, Lövdén M, Lindenberger U. On the relation of mean reaction time and intraindividual reaction time variability. Psychol Aging. 2009;24:841–857. doi: 10.1037/a0017799. [DOI] [PubMed] [Google Scholar]
- Sreenivasan KK, Vytlacil J, D'Esposito M. Distributed and dynamic storage of working memory stimulus information in extrastriate cortex. J Cogn Neurosci. 2014;26:1141–1153. doi: 10.1162/jocn_a_00556. [DOI] [PMC free article] [PubMed] [Google Scholar]
- Stein RB, Gossen ER, Jones KE. Neuronal variability: Noise or part of the signal? Nat Rev Neurosci. 2005;6:389–397. doi: 10.1038/nrn1668. [DOI] [PubMed] [Google Scholar]
- Stelzel C, Basten U, Montag C, Reuter M, Fiebach CJ. Frontostriatal involvement in task switching depends on genetic differences in D2 receptor density. J Neurosci. 2010;30:14205–14212. doi: 10.1523/JNEUROSCI.1062-10.2010. [DOI] [PMC free article] [PubMed] [Google Scholar]
- Ueltzhöffer K, Armbruster-Genç DJ, Fiebach CJ. Stochastic dynamics underlying cognitive stability and flexibility. PLoS Comput Biol. 2015;11:e1004331. doi: 10.1371/journal.pcbi.1004331. [DOI] [PMC free article] [PubMed] [Google Scholar]
- Ward BD. Simultaneous inference for fMRI data. 2000. Available at: https://afni.nimh.nih.gov/pub/dist/doc/manual/AlphaSimpdf.