

Abstract
The hypothalamo-pituitary-adrenocortical (HPA) axis regulates stress physiology and behavior. To achieve an optimally tuned adaptive response, it is critical that the magnitude of the stress response matches the severity of the threat. Corticotropin-releasing hormone (CRH) released from the paraventricular nucleus of the hypothalamus is a major regulator of the HPA axis. However, how CRH-producing neurons in an intact animal respond to different stressor intensities is currently not known. Using two-photon calcium imaging on intact larval zebrafish, we recorded the activity of CRH cells, while the larvae were exposed to stressors of varying intensity. By combining behavioral and physiological measures, we first determined how sudden alterations in environmental conditions lead to different levels of stress axis activation. Then, we measured changes in the frequency and amplitude of Ca2+ transients in individual CRH neurons in response to such stressors. The response magnitude of individual CRH cells covaried with stressor intensity. Furthermore, stressors caused the recruitment of previously inactive CRH neurons in an intensity-dependent manner, thus increasing the pool of responsive CRH cells. Strikingly, stressor-induced activity appeared highly synchronized among CRH neurons, and also across hemispheres. Thus, the stressor strength-dependent output of CRH neurons emerges by a dual mechanism that involves both the increased activity of individual cells and the recruitment of a larger pool of responsive cells. The synchronicity of CRH neurons within and across hemispheres ensures that the overall output of the HPA axis matches the severity of the threat.
SIGNIFICANCE STATEMENT Stressors trigger adaptive responses in the body that are essential for survival. How the brain responds to acute stressors of varying intensity in an intact animal, however, is not well understood. We address this question using two-photon Ca2+ imaging in larval zebrafish with transgenically labeled corticotropin-releasing hormone (CRH) cells, which represent a major regulator of the stress axis. We show that stressor strength-dependent responses of CRH neurons emerge via an intensity-dependent increase in the activity of individual CRH cells, and by an increase in the pool of responsive CRH cells at the population level. Furthermore, we report striking synchronicity among CRH neurons even across hemispheres, which suggests tight intrahypothalamic and interhypothalamic coordination. Thus, our work reveals how CRH neurons respond to different levels of acute stress in vivo.
Keywords: calcium imaging, corticotropin releasing hormone, HPA axis, stress, synchronicity, zebrafish
Introduction
An integrated stress response is triggered when animals face a state of threatened homeostasis. Although the stress response is essential for survival, it becomes detrimental when chronically active, and there is a growing association of stress response dysfunction with disorders such as anxiety, depression, hypertension, and memory impairment (McEwen, 2003; de Kloet et al., 2005; Lupien et al., 2009).
The stress response involves multiple sites in both the CNS and the periphery, and the hypothalamo-pituitary-adrenocortical (HPA) axis represents one of the key sites for stress response regulation (Charmandari et al., 2005). During the stress response, a small population of neuroendocrine neurons in the paraventricular nucleus (PVN) of the rostral hypothalamus secretes corticotropin-releasing hormone (CRH) and arginine vasopressin (AVP) into the hypothalamo–pituitary portal circulation. Acting on the anterior pituitary gland, CRH and AVP trigger the release of adrenocorticotropic hormone (ACTH) into the general circulation, which induces the release of glucocorticoids (GCs) from the adrenal cortex. GCs are pleiotropic final effectors of the HPA axis, with numerous targets in both the CNS and the periphery. GCs also exert negative feedback control on the pituitary and the hypothalamus to downregulate the stress response.
The analysis of CRH neuron activity has been challenging until recently because of the difficulty of identifying CRH neurons in vivo. Importantly, the recent development of transgenic mouse lines has allowed for the morphological and electrophysiological characterization of CRH cells (Alon et al., 2009; Martin et al., 2010; Wamsteeker Cusulin et al., 2013; Itoi et al., 2014). Although these studies confirmed the activation of CRH cells after stress exposure, analysis of CRH neuronal activity was limited to ex vivo, poststress preparations; these studies did not address the response of CRH cells to acute stressors. Because the integrated stress response involves many areas in the brain and periphery, its analysis should ideally be performed on an intact animal. However, real-time measurement of cellular activity in response to a stressor, especially in deeper brain areas, has been challenging.
In this study, we took advantage of the transparency and small size of zebrafish larvae to analyze how CRH neurons respond to different acute stressor intensities. To this end, we combined highly controlled stressful inputs with the simultaneous recording of cell activity using two-photon calcium imaging of genetically labeled CRH neurons in intact zebrafish larvae.
Materials and Methods
Fish maintenance
Zebrafish were kept under standard conditions at 28.5°C on a 12 h light/dark cycle (Westerfield, 2000). Embryos of either sex were raised in either eggwater (300 mg/L Red Sea Coral Pro Salt) or E2 medium (5 mm NaCl, 0.25 mm KCl, 0.5 mm MgSO4, 0.15 mm KH2PO4, 0.05 mm Na2HPO4, 0.66 mm CaCl2, 0.71 mm NaHCO3, pH adjusted to 7.0). The AB/TL strain was used for bacterial artificial chromosome (BAC) or plasmid injections. The Tg(otpa3kb:GCaMP3.0); Tg (crh:RFP) zebrafish line was used for in vivo two-photon imaging; and the Tg(POMC:GFP); Tg(crh:RFP) zebrafish line (Liu et al., 2003) was used for immunohistochemistry (IHC). The 0.2 mm 1-phenyl-2-thiourea (PTU; Sigma-Aldrich) was added to the medium when larvae were raised for imaging. All experimental procedures were in accordance with the national animal welfare law and were approved by the local government (Regierungspräsidium Karlsruhe; Animal Protocol Numbers G149-13 and G29-02).
Transgenic lines
The crh:RFP construct was generated by homologous BAC recombination using the BAC clone CHORI-73 28103 and the Red/ET kit (Gene Bridges). Homology arms with the following sequence were cloned into the targeting vector: homology arm 1, GTTTAAACTGGTAATCTTTGTGCTAGTCAGTTTGTATTGCTATGGATGCGTCCTCGTGTTTTGCGCACAATGAGGCACCCAGCTATCCAACTTTTAAGGCGCGCGTAAATGCCCAAGTGGATTTAAAAATATGCATGCGATGCAATGCAATGCAAAAAAAAATTAACGCAAGTGTTCACTAAGGGCGCTTTGATTAAATTGCATCTGTCAAGGATTGAGCTCCGTCCCAGAGTGCGCAAAACAGTTGCCGAGAAGTTGAAATAGTGCGCATAATTGACTCACTTCTCCCGCAGATTCTCCTCGCCACTTTTTGA; and homology arm 2, GACAGTTTGACACCTCTTGTCTAAGATTATTGACATGAAAATGATTAAATCATGTTTAAAATATATACACTAGAGCATATTTCACAATCACCACGTTTAAA.
The crh exon 2, containing the complete coding region, was replaced by the tagRFP gene (Evrogen). An iTol2 cassette (Suster et al., 2011) was inserted into the BAC backbone. The modified BAC was purified using a BAC purification kit (Qiagen) and injected at a concentration of 50 ng/μl into single-cell stage embryos in the presence of 0.2 m KCl, 50 ng/μl Tol2 transposase RNA, and 0.25% phenol red. More than 30 founders were identified, and 1 founder (number 35) with robust tagRFP expression in the neurosecretory preoptic area (NPO) was selected for further propagation. In this Tg(crh:RFP) line, red fluorescent protein (RFP)-positive cells were clustered in the NPO as well as scattered throughout the diencephalon. crh specificity was tested by combining crh in situ hybridization (ISH) and RFP IHC. The RFP-positive cell cluster in the NPO was largely crh positive, while additional RFP-positive cells scattered in the diencephalon were crh negative.
The otpa3kb-hsp-GCaMP3.0 plasmid was generated using the Tol2 kit (Kwan et al., 2007). p5E-otpa3kb-hsp was created by PCR amplifying ∼3 kb of the regulatory region of the transcription factor orthopedia a (otpa; Ryu et al., 2007) from genomic DNA and 1.5 kb of the hsp70-4 basal promoter (Halloran et al., 2000), and subcloning both fragments into p5E-MCS. To create the pME-GCaMP3.0 plasmid, full-length GCaMP3.0 (Tian et al., 2009) was PCR amplified from the GCaMP3.0 plasmid (catalog #22692, Addgene) and subcloned into the pME-MCS. p5E-otpa3kb-hsp and pME-GCaMP3.0 were recombined together with p3E-polyA into the destination vector pDestTol2pA2. The construct was injected together with transposase mRNA, as described previously (Kwan et al., 2007). The following stable transgenic lines were established: Tg(crh:RFP)hd21 and Tg(otpa3kb:GCaMP3.0)hd22.
In situ hybridization and immunohistochemistry
Fluorescent in situ hybridization was performed as described previously (Lauter et al., 2011) using a crh probe (Löhr et al., 2009). Immunohistochemistry was performed as described previously (Kastenhuber et al., 2010) using a rabbit anti-tagRFP antibody (Evrogen) diluted at 1:1000 and a chicken anti-GFP antibody diluted at 1:1000 (Roche) to detect GCaMP3.0. Alexa Fluor 546 anti-rabbit and Alexa Fluor 488 anti-chicken secondary antibodies (Invitrogen) were used at a 1:1000 dilution.
Two-photon imaging and stressor application
Tg(crh:RFP); Tg(otpa3kb:GCaMP3.0) double-transgenic larvae of either sex were raised to 5 or 6 d postfertilization (dpf) in eggwater (when applying pH stress) or E2 medium (when applying osmotic stress) containing PTU, and sorted for RFP and GCaMP3.0 expression before imaging. Single larvae were incubated in α-bungarotoxin (1 mg/ml; Tocris Bioscience) for 5 min and embedded, dorsal side up, in 2% low-melt agarose (Roth) in the imaging chamber. Embedded larvae were acclimatized to the constant flow of medium at 300 μl/min heated to 25°C for 5 min before starting two-photon imaging.
A custom-built two-photon microscope was used to perform Ca2+ imaging. Excitation light provided by a titanium sapphire laser (915 nm; Mira 900, Coherent) was passed through a 20× water-immersion objective (HCX Apo L20×/1.00 W, Leica). Emission light was filtered using bandpass filters (D 535/50 for GCaMP3.0 and HQ 585/40 for RFP) and was collected using photomultiplier tubes (Hamamatsu). Time series were recorded at a resolution of 256 × 256 pixels and a frame rate of 3.4 Hz.
pH in the imaging chamber was monitored using a pH and a reference microelectrode (pH-100 and REF-100, Unisense). Electrodes were calibrated before each imaging session using calibration solutions of pH 4, pH 7, and pH 10 (Merck). Salinity changes within the chamber were monitored by measuring the liquid junction potential. A glass pipette whose tip was sealed with 2% agarose was filled with E2 medium, and an Ag/Cl electrode was used as a reference electrode. Electrodes were calibrated by measuring the junction potential of solutions of fixed NaCl concentration (12.5, 25, 50, 75, 100, 125, 250, and 500 mm) before each imaging session. Stimuli were applied by perfusing concentrated solutions of 100 mm NaCl, 200 mm NaCl, 0.1 mm HCl, or 1 mm HCl through the chamber using a transistor-to-transistor logic (TTL)-controlled solenoid valve switch (NPI Electronic Instruments). For the control condition “E2 medium,” the valve was switched, but larvae were perfused with E2 medium.
After the recording, larvae were fixed in 4% paraformaldehyde overnight at 4°C for post hoc immunohistochemistry and in situ hybridization.
Data analysis
Fluorescence time series were registered using ImageJ TurboReg to eliminate translational motion artifacts and cropped. Regions of interest were manually selected using a custom-made LabView tool (Gabriel et al., 2012). Fluorescence signals were expressed as relative fluorescence changes dF/F0 = (F − F0)/F0 after background subtraction using the lowest of 20 bin values as the baseline signal and stimulus traces were plotted using IGOR Pro.
Ca2+ events (i.e., transient increases in the fluorescence signal) were detected semiautomatically using a custom-made Labview tool. To enable this, a variance trace of each fluorescence time series was computed and smoothed using a moving average filter with a 20 sample-point window. The threshold for this smoothed variance trace was empirically adjusted to detect transient changes in the original fluorescence signal. Empirical threshold adjustment was essential to improve event detection because it eliminated false detection of events associated with slow drifts in the baseline of the signal, which could vary from cell to cell. Temporal windows for these detected Ca2+ events were set based on imaging frames between events for all events above threshold. Peaks (maxima) and onsets were automatically detected within these temporal windows. Quantification and statistics were performed using GraphPad Prism.
Behavior analysis
Avoidance and locomotion experiments were conducted at a mean temperature of 28 ± 1°C under infrared (IR) light only, delivered through a custom-made array of IR-LEDs mounted inside a custom-made light-proof enclosure placed on a vibration-free platform (Newport). Larvae were imaged at 25 frames/s through an infrared-sensitive camera (ICD-49E B/W, Ikegami Tsushinki Co., Ltd.) with its lens (TV Lens, Computer VARI FOCAL H3Z4512 CS-IR, CBC) positioned above a custom-made swimming chamber. EthoVision XT software (Noldus Information Technology) was used to monitor the movements of larvae swimming individually inside the chamber. In all experiments, larvae were allowed to adjust to the conditions of the chamber for 15 min before video recording. Tests were conducted between 9:00 A.M. and 6:00 P.M., and testing of different experimental groups was intermixed throughout the day. We used two different swimming chambers with transparent bottoms for avoidance and locomotion tests. A rectangular chamber (length, 40 mm; width, 20 mm; height, 10 mm) holding a volume of 4 ml of E2 medium was used for avoidance tests. A cylindrical chamber (internal diameter, 10 mm; height, 10 mm) holding a volume of 400 μl of E2 medium was used for locomotion tests. Experiments with the cylindrical chamber were conducted using flowing water; a peristaltic pump (IPC Ismatec, IDEX Health & Science) and two opposite overtures at the bottom of the chamber (inlet and outlet; width, 2.5 mm; height, 400 μm; oriented at 90° relative to the longest axes of the side channels) allowed E2 medium (kept at 28°C ± 0.1°C) to flow at a constant rate of 200 μl/min. Using a computer-controlled perfusion system (Octaflow, ALA Scientific Instruments), known volumes of either NaCl or HCl solution were added to the inner medium of the chamber. Teflon tubes (internal diameter, 230 μm; outer diameter, 600 μm) were used to connect reservoirs of NaCl and HCl solutions to the chamber containing E2 medium, and entry into the chamber was controlled by solenoid valves; TTL signals triggered the opening and closing of the valves (opening time, either 1 or 2 s depending on the solution; pressure, 1 psi).
Avoidance tests.
Five microliters of E2 medium (control), 50 mm NaCl solution (salt exposure), or 1 mm HCl solution (pH drop) were added to the E2 medium in the rectangular chamber (opening time, 2 s; pressure, 1 psi). The movement and space use of a single freely moving larva was monitored before, during, and after the addition of 5 μl of E2 medium, NaCl solution, or HCl solution, as described above.
Locomotion tests.
Two microliters of E2 medium (control), NaCl solution (low concentration, 250 mm; high concentration, 500 mm), or HCl solution (low concentration, 250 μm; high concentration, 1 mm) were injected into a mixing compartment positioned 10 mm from the inlet of the cylindrical swimming chamber. Teflon tubes were used to connect the reservoirs of the various solutions (as described above) with a mixing compartment, allowing the solutions to be mixed with the flowing E2 medium before reaching the inner chamber (opening time, 1–2 s; pressure, 1 psi). The movements of single larvae were monitored before, during, and after the addition of 2 μl of E2 medium, NaCl solution, or HCl solution, as described above.
Cortisol analysis
Groups of 30 5 dpf larvae (experimental unit) were incubated for 10 min in either eggwater or eggwater plus 0.1, 0.5, or 1 mm HCl to study changes in cortisol levels in response to a pH drop. The larvae were incubated in E2 medium or E2 medium plus 25, 100, or 200 mm NaCl for 10 min to study changes in cortisol levels in response to changes in salinity. Cortisol concentration was measured as described by Yeh et al. (2013).
Survival analysis
Three replicates of 30 larvae per condition were incubated in eggwater or eggwater plus 0.01, 0.05, 0.1, 0.5, 1, 2.5, 5, or 10 mm HCl. Alternatively, groups of larvae were incubated in E2 medium or E2 medium plus 25, 50, 100, 250, 500, 750, 1000, or 1500 mm NaCl. Surviving larvae were counted after 2, 5, 8, 10, 15, 20, 30, 35, 45, and 60 min.
Results
Salinity and pH alterations trigger different levels of behavioral and physiological stress reactions
We chose to examine the response of CRH cells to altered salinity and pH in the surrounding medium because, for larval zebrafish, a sudden change in the composition of the surrounding water can pose a severe threat to homeostasis. To allow for robust determination of stress levels arising from alterations in salinity and pH, we used the following three independent measures: behavioral, endocrine, and overall survival. Throughout this study, we used salinity [6.7 and 12.6 parts per thousand (ppt)] and pH levels 6.0 and 4.5, which exceed those found in natural habitats, where salinity typically fluctuates between 0.1 and 0.66 ppt (Lawrence, 2007), and pH fluctuates between 7.9 and 8.2 (McClure et al., 2006; Spence et al., 2006; Engeszer et al., 2007). In this study, salinity values of 6.7 and 12.6 ppt are referred to as NaCllow and NaClhigh, respectively, while pH values of 6.0 and 4.5 are referred to as HCllow and HClhigh, respectively. Larvae showed clear avoidance behavior in response to sudden variations in salinity or pH, as they rapidly moved away from a spot of locally applied concentrated NaCl or HCl solution and continued to avoid this area for a recording period lasting 180 s (Fig. 1A). Avoidance reactions did not occur when E2 control medium was added (see also De Marco et al., 2014). Changes in pH elicited more pronounced behavioral effects compared with changes in salinity, suggesting that while both represent stressful inputs, these inputs vary in their intensity. Similarly, we also observed a sudden increase in locomotor activity after globally increasing the NaCl or HCl concentration within the testing arena (Fig. 1B). Varying NaCl or HCl concentrations altered larval locomotion to different extents (average motion 10 s after the addition/average motion 10 s before the addition; two-way ANOVA: stressor, F(1,20) = 21.67, p = 0.0002; level, F(1,20) = 10.77, p = 0.0037; stressor × level, F(1,20) = 1.988, p = 0.1739), suggesting that these inputs result in a dose-dependent modulation of the behavioral stress response (Fig. 1C).
Figure 1.
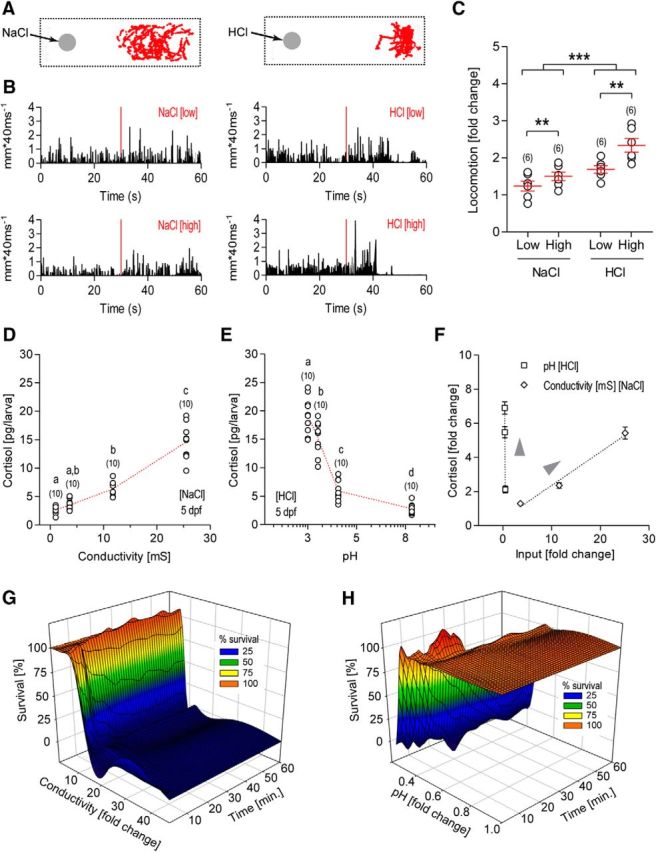
Salinity and pH changes trigger behavioral and physiological stress reactions. A, Representative traces of larvae after the addition of a drop of concentrated NaCl (left) or HCl (right) solution to the medium, showing that larvae avoid the spot where the drop has been placed (gray circles). Depicted in red are x–y coordinates during 180 s. Avoidance was more pronounced after delivery of concentrated HCl solution compared with concentrated NaCl solution. B, Representative motion traces of a single larva before and after perfusion with NaCl (left) or HCl (right) solutions (perfusion onset is indicated by red lines) of different concentrations. C, Locomotion (measured as a fold change: average motion 10 s after the addition of either HCl or NaCl/average motion 10 s before the addition of either HCl or NaCl) increased shortly after the global addition of concentrated solution to the medium. For the conditions chosen here, locomotion changes were more pronounced following a change in pH compared with a change in salinity; for both types of stressors, locomotion increased as NaCl or HCl concentration increased. The data are presented as the mean ± SEM (asterisks indicate significant differences; sample size is in parentheses). D, E, Changes in salinity (D) or pH (E) elicited a dose-dependent increase in whole-body cortisol concentration in larvae. Red lines connect means, bracketed numbers represent sample size (one data point represents a group of 30 larvae), and letters designate the results of the post hoc comparisons. Data points with different letters indicate significant differences, while data points with the same letters do not. F, Differences in responses to pH and salinity became apparent when input fold change was plotted against cortisol fold change (i.e., small changes in pH induced large changes in cortisol levels, while larger changes in conductivity were required to produce an effect of the same magnitude). G, H, Acidification and salinity changes compromised survival in a dose- and time-dependent manner.
To assess the level of stress axis activation elicited by salinity and pH changes, we measured postexposure whole-body cortisol concentration (the main GC in zebrafish). Whole-body cortisol concentration in larvae exposed to different concentrations of NaCl or HCl (for 10 min) increased in a concentration-dependent manner (one-way ANOVA: NaCl, F(3,39) = 107.0, p < 0.0001; HCl: F(3,39) = 97.4, p < 0.0001, followed by post hoc comparisons; Fig. 1D,E), indicating that these environmental changes trigger differential HPA axis activation (Fig. 1F). Last, to assess the severity of our stress conditions, we also measured the survival rate of the larvae. While the survival rate decreased over time following exposure to increasing NaCl and HCl concentrations, changes in pH led to a more dramatic reduction in survival compared with changes in salinity (Fig. 1G,H). Altogether, our results indicate that the pH and salinity conditions chosen here are stressful inputs of different intensities that can create a range of stress levels in larval zebrafish.
Stress-evoked in vivo activity recordings in CRH neurons using two-photon Ca2+ imaging
To measure how hypothalamic CRH neurons in an intact animal respond to stressors, we developed a custom-made in vivo imaging chamber equipped with temperature control and perfusion systems, a solenoid valve, a temperature sensor, and two different sets of electrodes to measure real-time pH and junction potential (as a proxy for salinity; Fig. 2A). The setup allowed the exact monitoring of stimulus onset and strength while imaging neuronal activity using a two-photon microscope (Denk et al., 1990), as shown by the time curves of salinity and pH level (Fig. 2B,C). To assess in vivo CRH neuronal activity, we targeted the calcium indicator GCaMP3.0 to the NPO (Fig. 2D), an area that is homologous to the rodent PVN (Herget et al., 2014). GCaMP3.0 was targeted to the NPO using a promoter element of the otpa transcription factor containing an evolutionarily conserved NPO-specific enhancer module (Gutierrez-Triana et al., 2014). To identify CRH cells in vivo, we generated a transgenic line expressing the red fluorophore tagRFP under the control of the crh promoter using transposon-mediated BAC recombineering (Suster et al., 2011). Whole-mount in situ hybridization revealed that 81.7 ± 3.5% (mean ± SEM) of the labeled RFP cells were CRH positive within the NPO. However, of the total NPO CRH population, only 39.5 ± 4.1% were labeled in the transgenic line. We imaged CRH neuronal activity in vivo using the double-transgenic line Tg(crh:RFP); Tg(otpa3kb:GCaMP3.0). Instead of directly expressing GCaMP3.0 under the crh promoter, we used this double-transgenic approach to compare CRH-positive cells with other (CRH-negative) neuroendocrine cells in the NPO. For each experiment, we confirmed the identity of CRH cells by post hoc staining of CRH, GCaMP3.0, and RFP (Fig. 2E). The transgenically labeled RFP cells thereby served as landmarks, facilitating the registration of activity data from cells imaged in vivo with the post hoc-stained cells. The neuroendocrine nature of the RFP-labeled CRH cells was confirmed by a complete overlap of RFP and CRH immunohistochemistry signals in the pituitary gland (Fig. 2F). In mammals, CRH neurons in the PVN target the anterior pituitary (adenohypophysis) through a portal blood vessel system called the median eminence (ME). In contrast, the ME is absent in zebrafish, and neuroendocrine cells project directly into the pituitary. To determine the target site of CRH neurons within the pituitary gland, we used crabp1 as a marker for the neurohypophysis (Toro et al., 2009), pit1 as a marker for the adenohypophysis (Pogoda and Hammerschmidt, 2007) and the Tg(POMC:GFP) transgenic line to label corticotroph cells (Liu et al., 2003). Immunohistochemistry was used to detect RFP. Transgenically labeled CRH fibers primarily innervated the posterior pars distalis of the pituitary gland, although corticotroph cells were also detected in the anterior pars distalis (Fig. 2G).
Figure 2.

Stressor-induced neuronal activity of CRH-positive cells can be assessed using two-photon Ca2+ imaging. A, Schematic view of the imaging chamber. B, Changes in the liquid junction potential were measured to determine the time course of changes in NaCl concentration in the imaging chamber. The data shown are the averaged stimulus traces of eight experiments for each condition (the mean ± SEM are shown as lines and shaded background). C, Average traces of n = 9 experiemtns (HClhigh) and n = 14 experiments (HCllow) are shown. The means ± SEM are shown as lines and shaded background. D, Schematic drawing of a larval head to illustrate CRH-positive cells (red) in the NPO (gray), some of which innervate the pituitary gland where they contact corticotrophs (green). E, Red-labeled CRH cells (asterisk) were identified in the Tg(crh:RFP); Tg(otpa3kb:GCaMP3.0) line in vivo (top) among other NPO cells (green). The same fish is shown after post hoc staining (bottom) of RFP (red), GCaMP (green), and CRH (blue), with transgenically labeled CRH cells (asterisk) used as landmarks to distinguish unlabeled CRH cells (arrowheads) from CRH-negative NPO cells (arrows). F, IHC against CRH (green) and RFP (red) shows complete colocalization in the pituitary, indicating that RFP fibers in the pituitary originate from CRH rather than falsely labeled RFP cells. Scale bar, 50 μm. G, Top, ISH labeling with markers for the neurohypophysis (crabp1, green) and the adenohypophysis (pit1, blue), together with RFP-labeled fibers (red), show the exact target site of CRH neurons in the pituitary gland. Bottom, Red-labeled CRH:RFP fibers with green-labeled POMC-positive corticotrophs and a blue-labeled neurohypophysis show innervation of the posterior corticotroph cluster. Right panels are 3D reconstructions of confocal stacks. Lateral views of the pituitary gland (anterior is to the left) are shown. Scale bar, 20 μm.
Stress exposure leads to a recruitment of inactive CRH cells
Ca2+ signals from genetically identified CRH cells showed a low-frequency phasic activity, a feature that we used subsequently to determine the activity status of a cell by quantifying the number of above-threshold Ca2+ events (for details on event detection, see Materials and Methods). We observed both active cells (>0 Ca2+ events; 44.5% of the 200 CRH cells recorded in total) and inactive cells (0 Ca2+ events; 55.5% of the 200 CRH cells recorded in total) under basal conditions, as well as activity changes after the onset of the stimulus (i.e., a change in salinity or pH). Four different response categories could be distinguished based on the observed number of Ca2+ events. Using “the number of Ca2+ events during 100 s after the stimulus onset” minus “the number of Ca2+ events during 100 s before the stimulus onset” as a measure of the response, the following categories emerged: (1) “responsive up” (increased number of Ca2+ events); (2) “responsive down” (decreased number of Ca2+ events); (3) “nonresponsive active” (Ca2+ events were invariant to the stimulus); and (4) “nonresponsive inactive” (Ca2+ events were absent; Fig. 3A). We quantified the percentage of cells falling within each of these categories when larvae were treated with either type of stressor at varying intensity (NaCllow = 6.7 ppt; NaClhigh = 12.6 ppt; HCllow = pH 6.0; HClhigh= pH 4.5; Fig. 3B). The number of responsive up cells increased with stressor intensity and was higher in CRH-positive compared with CRH-negative cells (G-test with Bonferroni correction, α = 0.005; E2 medium, G = 1.5, p = 0.22; NaCllow, G = 9.7, p = 0.002; NaClhigh, G = 8.4, p = 0.0037; HCllow, G = 8.6, p = 0.0035; HClhigh, G = 13.5, p = 0.0002). In contrast, the number of responsive down cells was invariant to the various stressful conditions in both CRH-positive and CRH-negative cells (E2 medium, G = 0.2, p = 0.6877; NaCllow, G = 2.2, p = 0.1414; NaClhigh, G = 0.0, p = 0.9529; HCllow, G = 2.4, p = 0.1252; HClhigh, G = 4.1, p = 0.0417). Upon stressor exposure, the number of nonresponsive inactive cells was much lower in CRH-positive compared with CRH-negative cells (G-test with Bonferroni correction, α = 0.005; E2 medium, G = 2.5, p = 0.1162; NaCllow, G = 19.1, p = 0.0000; NaClhigh, G = 11.3, p = 0.0008; HCllow, G = 20.4, p = 0.0000; HClhigh, G = 34.3, p = 0.0000). Further, in CRH-positive cells, the number of nonresponsive inactive cells decreased as stressor intensity increased. Last, the number of nonresponsive active cells was more variable and largely insensitive to the various stressors in both CRH-positive and CRH-negative cells (E2 medium, G = 0.4, p = 0.5503; NaCllow, G = 1.7, p = 0.1970; NaClhigh, G = 0.5, p = 0.4965; HCllow, G = 7.8, p = 0.0052; HClhigh, G = 0.1, p = 0.7511). The high proportion of nonresponsive active CRH cells under the low-HCl stress condition might be a consequence of a high baseline activity in some cells; however, the baseline activity of CRH cells subjected to the low-HCl stress condition was not significantly different from the baseline activity of CRH cells subjected to the other stressful conditions. For the statistical analysis, the above comparisons of response categories were made using individual cells—not individual larvae—as experimental units, as the number of CRH cells per larva recorded ranged from 1 to 7 cells. To rule out a potential bias arising from pseudo-replication, we examined the relationship between the percentages of cells that fell within each category when individual cells versus larvae were used as the units of comparison. Both approaches yielded similar outcomes (Pearson's correlation, R2 = 0.9848, p < 0.0001; Fig. 3C).
Figure 3.

Stressors lead to increased neuronal activity and recruitment of CRH cells. A, Representative fluorescent traces of four CRH cells over 200 s with stimulus onset after 100 s. The number of Ca2+ events was quantified and used to categorize cells into the four categories indicated on the right. B, The number of cells in each category was quantified as a percentage of the total number of cells (CRH-positive E2 medium, n = 31; CRH-negative E2 medium, n = 31; CRH-positive NaCllow, n = 45; CRH-negative NaCllow, n = 46; CRH-positive NaClhigh, n = 42; CRH- negative NaClhigh, n = 44; CRH-positive HCllow, n = 35; CRH-negative HCllow, n = 35; CRH-positive HClhigh, n = 47; CRH-negative HClhigh, n = 46). C, Comparison of the number of cells that fell within each category when individual cells vs larvae were used as experimental units. The numbers in each category deviated only slightly (Pearson's correlation). Each of the 10 conditions indicated in the figure encompass four data points corresponding to the four categories (responsive up, responsive down, nonresponsive active, and nonresponsive inactive).
To further analyze the activity changes of individual cells, we looked at the frequency distribution of the number of prestimulus and poststimulus Ca2+ events following application of different stressor treatments. Figure 4A shows 2D histograms depicting shifts in the distribution of cell numbers with increasing stressor intensity in CRH-positive cells. Most of the changes occurred in previously inactive cells (Fig. 4A, top row of each histogram). In contrast, the majority of CRH-negative cells remained inactive or exhibited lower activity levels compared with CRH-positive cells. Only 1.48% of CRH-negative cells (n = 202 CRH-negative cells recorded in total, including all conditions) showed four Ca2+ events per 100 s, compared with 4.5% for CRH-positive cells (n = 200 CRH-positive cells recorded in total, including all conditions). Similarly, frequency distribution histograms of changes in the number of Ca2+ events were shifted to the right as stressor intensity increased in CRH-positive cells, whereas frequency distribution histograms for CRH-negative cells showed higher kurtosis (kurtosis: CRH-positive, NaCllow = 0.09321, NaClhigh = 0.09502, HCllow = −0.1228, HClhigh = −0.6546; CRH−, NaCllow = 6.009, NaClhigh = 3.344, HCllow = 2.828, HClhigh = 0.8380; Fig. 4B). Thus, as stressor intensity increases, the number of responsive up cells increases through the recruitment of previously inactive cells, while they also show an increase in the number of Ca2+ events.
Figure 4.

Recruitment of inactive CRH cells and the magnitude of activity change covary with stressor intensity. A, Histograms showing how cell distribution changed relative to basal (number of Ca2+ events prestimulus) and stimulus-induced (number of Ca2+ events poststimulus) activity. B, Frequency distribution histograms show that as stressor intensity increased, the number of nonresponsive CRH-positive cells decreased, and the magnitude of change in the number of Ca2+ events increased. In contrast, most CRH-negative cells remained nonresponsive, regardless of stressor intensity. Shaded in gray are nonresponsive cells (active and inactive) that did not show a change in the number of Ca2+ events in response to the stimulus. C, The response magnitude of CRH-positive cells, but not of CRH-negative cells, increased with stressor intensity regardless of the type of stressor. The response magnitude of responsive down cells was unaffected by stressor intensity. The data are presented as the means ± SEM; asterisks indicate significant differences at p < 0.05 and p < 0.01. D, The stimulus-induced change in amplitude of the fluorescence signal (left) and the change in the area under the curve of the peaks (peak AUC; right) increased with stressor intensity regardless of the type of stressor applied. The data are presented as the mean ± SEM; asterisks indicate significant differences at p < 0.05, p < 0.01 or p < 0.001. nr., Number; resp., responsive.
The magnitude of activity change covaries with stressor intensity
We then asked whether the magnitude of activity change varies with the level of stress. We analyzed the average changes in the number of Ca2+ events of responsive cells for each condition (Fig. 4C). Changes in the number of Ca2+ events for responsive up cells did not differ for high levels of osmotic stress compared with pH stress, but there was a trend (significant for pH stress) toward an increase in the number of Ca2+ events as homotypic stress increased (Kruskal–Wallis test, H = 16.01, p = 0.003; followed by Dunn′s multiple comparisons, p < 0.05). No such trend was observed for responsive down cells; however, the low number of cells in this category precluded the detection of possible differences. No significant trend was observed in CRH-negative cells (Kruskal–Wallis test: responsive up, H = 7.07, p = 0.1322; responsive down, H = 2.015, p = 0.7329, followed by Dunn's multiple comparisons, p < 0.05). To further assess the magnitude of activity changes in responsive cells, we analyzed the amplitude of the Ca2+ events (Fig. 4D, left) and the area under the curve (AUC; using the mean plus 2 SDs as a threshold; Fig. 4D, right). Similar to the number of Ca2+ events, Ca2+ event amplitude and the AUC increased as homotypic stress increased and was the same regardless of the type of stressor (Kruskal–Wallis test: amplitudes, H = 33.02, p < 0.0001; AUCs, H = 23.66, p < 0.0001, followed by Dunn′s multiple comparisons, p < 0.05). These results indicate that the magnitude of activity change in CRH-positive cells does not differ between animals subjected to osmotic stress compared with animals subjected to pH stress. Importantly, however, the magnitude of activity change in CRH-positive cells covaried with stressor intensity.
Stress-induced activities are synchronized
We observed that CRH cells, even when located in different hemispheres, showed very similar response patterns (Fig. 5A,B), and the onset times of Ca2+ events within individual animals differed only slightly between the CRH cells, if at all (Fig. 5C). This observation, together with evidence for synchronization and highly coordinated activity reported for other neurosecretory cell populations in rodents (Belin et al., 1984; Belin and Moos, 1986; Israel et al., 2003), led us to speculate that CRH cell activities might be synchronized as well. We therefore performed cross-correlation analyses on CRH-positive cells within one animal, prestimulus and poststimulus, and found high levels of synchronicity among CRH-positive cells (Fig. 5D). To test whether synchronicity was specific to CRH cells, or whether it was a common feature of neuroendocrine cells, we also performed cross-correlation analyses on CRH-negative cells, which consist of a heterogeneous population of NPO cells. Our results reveal synchronicity among CRH-negative cells despite their heterogeneity, suggesting a high level of coordinated activity among the NPO cells.
Figure 5.
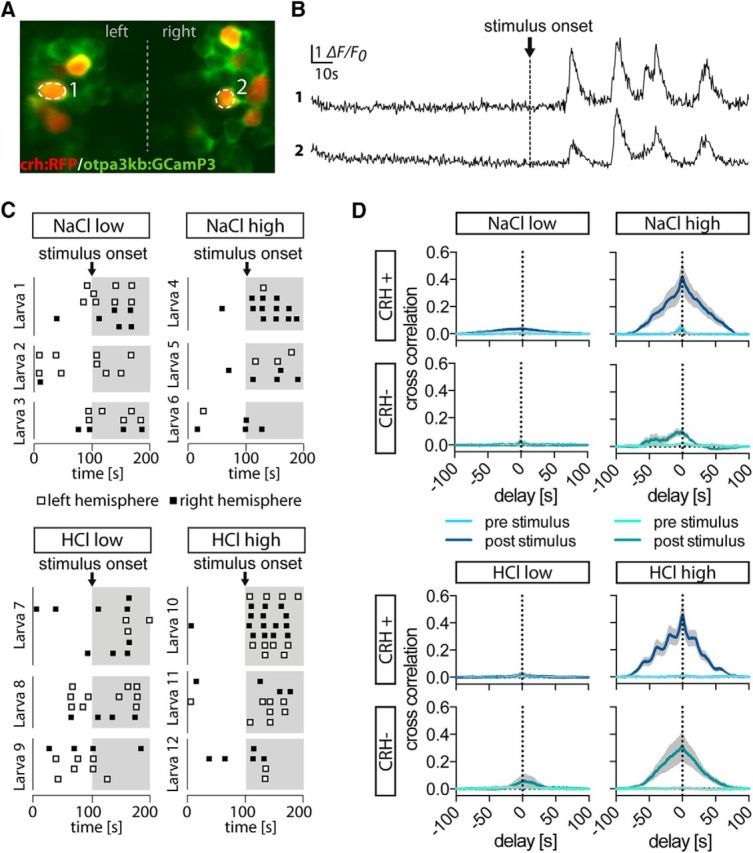
Neuronal responses within the NPO are highly synchronized. A, A typical imaging field of view showing the red-labeled CRH-positive cells among other NPO cells (in green). B, Fluorescence signals of the two cells marked in A. Although the cells were located in different hemispheres, they showed remarkable synchronicity after stimulus onset. C, The onset of Ca2+ events is shown as ticks for CRH-positive cells in three representative larvae per condition (time is on the x-axis, cell ID is on the y-axis). Within each animal, Ca2+ events in CRH-positive cells were largely simultaneous. D, Cross-correlation histograms showing the means ± SEMs of all pairs of cells (within a single animal), excluding inactive cells. The histograms reveal a peak at 0 s, consistent with synchronicity among CRH-positive cells. The peak at 0 s in the cross-correlation histograms for CRH-negative cells within the NPO also indicates synchronicity among this group of cells. Means ± SEMs are shown as lines and shaded backgrounds. Sample sizes: CRH-positive NaCllow, 10 animals in total (4 animals with 2 cells, 3 animals with 3 cells, 1 animal with 4 cells, 1 animal with 5 cells, 1 animal with 6 cells), resulting in 43 cross-correlations; CRH-positive NaClhigh, 12 animals in total (6 animals with 2 cells, 3 animals with 3 cells, 2 animals with 4 cells, 1 animal with 5 cells), resulting in 38 cross-correlations; CRH-positive HCllow, 9 animals in total (2 animals with 2 cells, 4 animals with 3 cells, 2 animals with 4 cells, 1 animal with 6 cells), resulting in 41 cross-correlations; CRH-positive HClhigh, 10 animals in total (1 animal with 2 cells, 2 animals with 3 cells, 2 animals with 4 cells, 3 animals with 5 cells, 2 animals with 7 cells), resulting in 91 cross-correlations; CRH-negative NaCllow, 3 animals in total (each with 2 cells), resulting in 3 cross-correlations; CRH-negative NaClhigh, 5 animals in total (2 animals with 2 cells, 2 animals with 3 cells, 1 animal with 5 cells), resulting in 18 cross-correlations; CRH-negative HCllow, 5 animals in total (2 animals with 2 cells and 3 animals with 3 cells), resulting in 11 cross-correlations; CRH-negative HClhigh, 7 animals in total (4 animals with 2 cells and 3 animals with 3 cells), resulting in 13 cross-correlations.
We hypothesized that if synchronicity emerges from intrahypothalamic signal propagation through electrical coupling or chemical transmission involving somatodendritic release, one would observe a higher degree of synchronicity between cells that are closer to each other. In contrast, if the synchronicity arises from synchronized afferent inputs, the extent of synchronicity would be independent of the distance between CRH cells. To distinguish between these two possibilities, we compared cross-correlation histograms from all cells within the left hemisphere, the right hemisphere, or across hemispheres for three animals that showed activity in a sufficiently large number of CRH cells in both hemispheres. In all three animals, synchronicity within one given hemisphere was slightly weaker than synchronicity across hemispheres, which indicates that synchronicity is independent of the distance between cells (Fig. 6).
Figure 6.

CRH cell activities are synchronized within and across hemispheres. Cross-correlation analysis of CRH-positive cells in three representative larvae within the left hemisphere (green), the right hemisphere (dark blue), or across hemispheres (maroon) shows that responses were synchronized within and across hemispheres. Note that for larva 1 and 3, synchronicity in the left hemisphere was weaker than in the right hemisphere and across hemispheres, whereas for larva 2 synchronicity in the right hemisphere was weaker than in the left hemisphere and across hemispheres. Average cross-correlation histograms of CRH cell activity 100 s poststimulus, including SEMs (gray bands), are shown. (Larva 1: ntotal = 7 cells; nleft = 3 cells, 3 cross-correlations; nright = 4 cells, 6 cross-correlations; nleft-right = 7 cells, 12 cross-correlations; Larva 2: ntotal = 7 cells; nleft = 3 cells, 3 cross-correlations; nright = 4 cells, 6 cross-correlations; nleft-right = 7 cells, 12 cross-correlations; Larva 3: ntotal = 6 cells; nleft = 3 cells, 3 cross-correlations; nright = 3 cells, 3 cross-correlations; nleft-right = 6 cells, 9 cross-correlations). hemi., Hemisphere.
Discussion
Our results indicate that CRH cells regulate their output to different intensities of stress in the following two ways: at the population level by varying the pool of responsive cells; and at the individual cell level by varying the strength of the response (Fig. 7). The two stimuli used here, applied at two different intensities, created different levels of stress. This was reflected in changes in the behavioral and physiological output that correlated well with the pattern of activity increase in CRH cells. Stressor-induced changes in CRH cell activity are highly coordinated, but the coordination goes beyond the stress system and may involve different cell types in the whole NPO, suggesting that there is cross talk between CRH cells and other neuroendocrine cells.
Figure 7.

Mechanism by which hypothalamic CRH cells respond to different intensities of stress. Schematic representation of the mechanism by which CRH-positive cells (red) encode the severity of a threat: a stressor strength-dependent neuronal output is achieved by a dual mechanism involving changes in the activity of individual CRH cells and variations in the pool of responsive cells that participate in the response, whereby increased stress leads to increased CRH cell activity and the recruitment of a larger pool of responsive cells.
In rats, electrophysiological and anatomical features of parvocellular PVN neurons, which include CRH cells, have been characterized extensively (Hoffman et al., 1991; Tasker and Dudek, 1991; Luther and Tasker, 2000; Luther et al., 2002), and CRH cell activation following a stressful input has been detected through increased c-fos expression (Ceccatelli et al., 1989; Senba et al., 1993; Cullinan et al., 1995). The recent development of transgenic mouse lines that allow identification of CRH cells in vivo (Alon et al., 2009; Martin et al., 2010; Wamsteeker Cusulin et al., 2013; Itoi et al., 2014), as well as the development of new techniques that permit imaging or electrophysiological measurement in awake, behaving animals, will be crucial to characterize rodent CRH cell activity, function, and plasticity in vivo. Nevertheless, the recording of cellular activity in intact animals, especially from deeper brain areas, is a difficult task that is greatly facilitated by the transparency and small size of zebrafish larvae. The development of our transgenic CRH line was key to the identification and recording of CRH activity in vivo in intact zebrafish larvae. Transgenic labeling did not fully cover endogenous CRH expression, a phenomenon also observed in some mouse lines with transgenically labeled CRH cells [e.g., in which one-third of all CRH cells were labeled (Itoi et al., 2014), in which there was less GFP expression than endogenous CRH expression (Alon et al., 2009), or in which nearly all CRH cells (96%) coexpressed tdtomato (Wamsteeker Cusulin et al., 2013)]. Nevertheless, the transgenic line allowed us to uncover general characteristic properties of zebrafish CRH cells (slow-acting, phasic) during stress exposure. Because we have used zebrafish larvae for our analysis, in which neurons are in an immature state, future studies should address the response of mature CRH neurons.
It remains difficult to estimate spontaneous CRH activity under basal, unstressed conditions because in our studies larvae were fixed in agarose, which represents a stressful condition. Hence, the E2 medium condition represents the lowest of the five stress levels compared in this study. The slow-acting properties of the CRH cells, along with the technical challenge of assessing the whole population of CRH cells, necessitated the use of extreme salinity and pH conditions in this study. Although the larvae were slightly stressed in embedded conditions, our results show that the increasing activity of CRH neurons correlates well with increasing levels of stress.
pH and salinity changes led to avoidance behavior and cortisol increase in zebrafish larvae, indicating that the CRH activities measured here are indeed stress responses. However, it remains to be dissected which features of a stimulus lead to the activation of CRH cells (e.g., by imaging NPO cells while presenting either aversive or appetitive stimuli such as food or prey-like visual stimuli; Preuss et al., 2014). This will help in understanding whether CRH cells are activated only by aversive, stressful stimuli or whether they also respond to any new stimulus.
In this study, we focused on the role of CRH cells during the stress response because they are known to play a major role in regulating the stress axis. However, other peptides in the PVN, such as AVP and oxytocin (Oxt), are also essential for the stress response (Gibbs, 1986). In fact, many of these active peptides are colocalized with CRH cells, also in the zebrafish NPO (Herget and Ryu, 2015), and might be coreleased in response to stress. Whether the functional heterogeneity of CRH cells has emerged from different peptide expression profiles in these cells remains to be elucidated.
We found that CRH neurons produce a total output that is commensurate with the intensity of a threat through the following two distinct mechanisms: adjustment of the strength of the response of individual cells; and variation in the proportion of cells that are recruited to respond. How do other neuroendocrine systems match their response magnitude to the stimulus strength? The high-frequency coordinated burst firing in rodent Oxt cells gives rise to large pulses of Oxt hormone, which induces contraction of the uterus at birth and in the milk duct during lactation (Belin et al., 1984). The magnitude of milk ejection reflects both variations in intraburst firing rate and variations in the number of Oxt cells recruited (Belin et al., 1984; Belin and Moos, 1986). Similarly, in magnocellular AVP cells, the integrated output of the population must closely match the hydration demand of the body to maintain fluid homeostasis within the system. AVP neurons exhibit different firing patterns (silent with no spontaneous firing, irregular firing, continuous firing, and phasic firing) and are progressively recruited to adopt a phasic firing mode as a function of hydration state (Sabatier and Leng, 2007; Leng et al., 2008). This provides the neural basis for fine tuning the concentration of hormone in the system. Our study shows that parvocellular CRH neurons adopt a similar mechanism of progressive cell recruitment to adjust their response magnitude to the prevailing threat.
Regulation of cells at the population level requires mechanisms of coordination among neighboring cells. In the case of AVP cells, the whole population acts as a signal integrator controlled by somatodendritic release of AVP and other coreleased neuropeptides, which act in an autocrine/paracrine manner (Moos et al., 1998; Brown et al., 2007, 2008).
In contrast, clear evidence for intrahypothalamic CRH release is sparse. Nevertheless, a local CRH-immunoreactive neuronal circuit in the PVN has been identified (Liposits et al., 1985), and a facilitatory effect of locally applied CRH on stress-induced ACTH release (Ono et al., 1985) points to a CRH regulatory feedback loop and a neuromodulatory action of CRH within the PVN. CRH release within the PVN has been detected in sheep during stress and is thought to drive venous cortisol via ACTH (Cook, 2004). Moreover, it has been suggested that a single episode of stress sensitizes the HPA axis through CRH acting within the PVN (Kuzmiski et al., 2010). CRH receptor (CRHR) type 1 has been detected in the mouse PVN, but not in CRH-expressing cells (Justice et al., 2008), and several studies have shown the induction of CRHR1 expression in the PVN after stress (Rivest et al., 1995; Van Pett et al., 2000). To date, zebrafish CRHR expression has only been detected by RT-PCR up to 24 h postfertilization (Alderman and Bernier, 2009). Therefore, intrahypothalamic communication via locally released CRH in the zebrafish remains speculative and needs further investigation. In addition to CRH, other coreleased peptides might serve to coordinate CRH activity. Indeed, crh is highly coexpressed with avp within the NPO, and is occasionally coexpressed with oxt, pro-enkephalin A, pro-enkephalin B, neurotensin, and somatostatin 1.1 (Herget and Ryu, 2015).
Periodicity and synchronization of bursting activity have been shown for rodent Oxt cells in vivo (Belin et al., 1984; Belin and Moos, 1986), and studies using organotypic slice cultures point to an intrahypothalamic pulse generator consisting of glutamatergic neurons (Israel et al., 2003), which can be influenced by local Oxt release (Jourdain et al., 1998). While these studies suggest that synchronization among the Oxt neuron population results from the synchronization of afferent volleys, rather than electrical coupling, earlier reports provide evidence for intrahypothalamic dye transfer via gap junctions (Andrew et al., 1981; Hatton, 1997). In contrast, phasic firing in AVP neurons is asynchronous (Leng and Dyball, 1983; Brown, 2004), giving rise to a smooth (rather than a pulsatile) hormonal release profile. Similar to Oxt, a pulsatile release of gonadotropin-releasing hormone 1 (GnRH1), rather than a sustained elevation, is required to activate pituitary gonadotropin release and steroid release from the gonads (Belchetz et al., 1978; Moenter, 2010). Synchronized and coordinated activity among GnRH1 neurons in the preoptic area in cichlid fish has recently been attributed to coupling at electrical synapses, mediated by the gap junction protein Gdj2 (also known as connexin 36 in mammals and connexin 35 in fish; Ma et al., 2015), but such a mechanism has yet to be verified in other species, including mammals. Although expression of the gap junction protein connexin 35 has been detected during zebrafish CNS development (Jabeen and Thirumalai, 2013), conclusive evidence for electrical coupling within the zebrafish NPO is lacking.
It is conceivable that the coordination of cell populations in the zebrafish NPO occurs via intrahypothalamic peptide release, synchronization of neuronal activity via gap junctions, or by afferent inputs; however, the exact mechanism underlying the striking synchronicity of CRH cells reported here must still be elucidated.
Footnotes
This work was supported by the Max Planck Society and German Research Foundation (Grant DFG-FOR1279). C.M.v.B.-M. was supported by a fellowship of the Swiss National Science Foundation. We thank Boris Knerr and Andrea Wolf for initial cloning of promoters, Martin Lukat for technical support on the imaging chamber, and Ulrich Herget for 3D reconstructions of confocal stacks. We also thank Erin Schuman and Sabine Renninger for helpful comments on the manuscript. In addition, we thank Regina Singer, Gabi Shoemann, Angelika Schoell, and Christiane Brandel for expert fish care.
The authors declare no competing financial interests.
References
- Alderman SL, Bernier NJ. Ontogeny of the corticotropin-releasing factor system in zebrafish. Gen Comp Endocrinol. 2009;164:61–69. doi: 10.1016/j.ygcen.2009.04.007. [DOI] [PubMed] [Google Scholar]
- Alon T, Zhou L, Pérez CA, Garfield AS, Friedman JM, Heisler LK. Transgenic mice expressing green fluorescent protein under the control of the corticotropin-releasing hormone promoter. Endocrinology. 2009;150:5626–5632. doi: 10.1210/en.2009-0881. [DOI] [PMC free article] [PubMed] [Google Scholar]
- Andrew RD, MacVicar BA, Dudek FE, Hatton GI. Dye transfer through gap junctions between neuroendocrine cells of rat hypothalamus. Science. 1981;211:1187–1189. doi: 10.1126/science.7466393. [DOI] [PubMed] [Google Scholar]
- Belchetz PE, Plant TM, Nakai Y, Keogh EJ, Knobil E. Hypophysial responses to continuous and intermittent delivery of hypopthalamic gonadotropin-releasing hormone. Science. 1978;202:631–633. doi: 10.1126/science.100883. [DOI] [PubMed] [Google Scholar]
- Belin V, Moos F. Paired recordings from supraoptic and paraventricular oxytocin cells in suckled rats: recruitment and synchronization. J Physiol. 1986;377:369–390. doi: 10.1113/jphysiol.1986.sp016192. [DOI] [PMC free article] [PubMed] [Google Scholar]
- Belin V, Moos F, Richard P. Synchronization of oxytocin cells in the hypothalamic paraventricular and supraoptic nuclei in suckled rats: direct proof with paired extracellular recordings. Exp Brain Res. 1984;57:201–203. doi: 10.1007/BF00231147. [DOI] [PubMed] [Google Scholar]
- Brown CH. Rhythmogenesis in vasopressin cells. J Neuroendocrinol. 2004;16:727–739. doi: 10.1111/j.1365-2826.2004.01227.x. [DOI] [PubMed] [Google Scholar]
- Brown CH, Scott V, Ludwig M, Leng G, Bourque CW. Somatodendritic dynorphin release: orchestrating activity patterns of vasopressin neurons. Biochem Soc Trans. 2007;35:1236–1242. doi: 10.1042/BST0351236. [DOI] [PubMed] [Google Scholar]
- Brown CH, Ruan M, Scott V, Tobin VA, Ludwig M. Multi-factorial somato-dendritic regulation of phasic spike discharge in vasopressin neurons. Prog Brain Res. 2008;170:219–228. doi: 10.1016/S0079-6123(08)00419-6. [DOI] [PubMed] [Google Scholar]
- Ceccatelli S, Villar MJ, Goldstein M, Hökfelt T. Expression of c-Fos immunoreactivity in transmitter-characterized neurons after stress. Proc Natl Acad Sci U S A. 1989;86:9569–9573. doi: 10.1073/pnas.86.23.9569. [DOI] [PMC free article] [PubMed] [Google Scholar]
- Charmandari E, Tsigos C, Chrousos G. Endocrinology of the stress response. Annu Rev Physiol. 2005;67:259–284. doi: 10.1146/annurev.physiol.67.040403.120816. [DOI] [PubMed] [Google Scholar]
- Cook CJ. Stress induces CRF release in the paraventricular nucleus, and both CRF and GABA release in the amygdala. Physiol Behav. 2004;82:751–762. doi: 10.1016/j.physbeh.2004.06.013. [DOI] [PubMed] [Google Scholar]
- Cullinan WE, Herman JP, Battaglia DF, Akil H, Watson SJ. Pattern and time course of immediate early gene expression in rat brain following acute stress. Neuroscience. 1995;64:477–505. doi: 10.1016/0306-4522(94)00355-9. [DOI] [PubMed] [Google Scholar]
- de Kloet ER, Joëls M, Holsboer F. Stress and the brain: from adaptation to disease. Nat Rev Neurosci. 2005;6:463–475. doi: 10.1038/nrn1683. [DOI] [PubMed] [Google Scholar]
- De Marco RJ, Groneberg AH, Yeh CM, Treviño M, Ryu S. The behavior of larval zebrafish reveals stressor-mediated anorexia during early vertebrate development. Front Behav Neurosci. 2014;8:367. doi: 10.3389/fnbeh.2014.00367. [DOI] [PMC free article] [PubMed] [Google Scholar]
- Denk W, Strickler JH, Webb WW. Two-photon laser scanning fluorescence microscopy. Science. 1990;248:73–76. doi: 10.1126/science.2321027. [DOI] [PubMed] [Google Scholar]
- Engeszer RE, Patterson LB, Rao AA, Parichy DM. Zebrafish in the wild: a review of natural history and new notes from the field. Zebrafish. 2007;4:21–40. doi: 10.1089/zeb.2006.9997. [DOI] [PubMed] [Google Scholar]
- Gabriel JP, Trivedi CA, Maurer CM, Ryu S, Bollmann JH. Layer-specific targeting of direction-selective neurons in the zebrafish optic tectum. Neuron. 2012;76:1147–1160. doi: 10.1016/j.neuron.2012.12.003. [DOI] [PubMed] [Google Scholar]
- Gibbs DM. Vasopressin and oxytocin: hypothalamic modulators of the stress response: a review. Psychoneuroendocrinology. 1986;11:131–139. doi: 10.1016/0306-4530(86)90048-X. [DOI] [PubMed] [Google Scholar]
- Gutierrez-Triana JA, Herget U, Lichtner P, Castillo-Ramírez LA, Ryu S. A vertebrate-conserved cis-regulatory module for targeted expression in the main hypothalamic regulatory region for the stress response. BMC Dev Biol. 2014;14:41. doi: 10.1186/s12861-014-0041-x. [DOI] [PMC free article] [PubMed] [Google Scholar]
- Halloran MC, Sato-Maeda M, Warren JT, Su F, Lele Z, Krone PH, Kuwada JY, Shoji W. Laser-induced gene expression in specific cells of transgenic zebrafish. Development. 2000;127:1953–1960. doi: 10.1242/dev.127.9.1953. [DOI] [PubMed] [Google Scholar]
- Hatton GI. Function-related plasticity in hypothalamus. Annu Rev Neurosci. 1997;20:375–397. doi: 10.1146/annurev.neuro.20.1.375. [DOI] [PubMed] [Google Scholar]
- Herget U, Ryu S. Coexpression analysis of nine neuropeptides in the neurosecretory preoptic area of larval zebrafish. Front Neuroanat. 2015;9:2. doi: 10.3389/fnana.2015.00002. [DOI] [PMC free article] [PubMed] [Google Scholar]
- Herget U, Wolf A, Wullimann MF, Ryu S. Molecular neuroanatomy and chemoarchitecture of the neurosecretory preoptic-hypothalamic area in zebrafish larvae. J Comp Neurol. 2014;522:1542–1564. doi: 10.1002/cne.23480. [DOI] [PubMed] [Google Scholar]
- Hoffman NW, Tasker JG, Dudek FE. Immunohistochemical differentiation of electrophysiologically defined neuronal populations in the region of the rat hypothalamic paraventricular nucleus. J Comp Neurol. 1991;307:405–416. doi: 10.1002/cne.903070306. [DOI] [PubMed] [Google Scholar]
- Israel JM, Le Masson G, Theodosis DT, Poulain DA. Glutamatergic input governs periodicity and synchronization of bursting activity in oxytocin neurons in hypothalamic organotypic cultures. Eur J Neurosci. 2003;17:2619–2629. doi: 10.1046/j.1460-9568.2003.02705.x. [DOI] [PubMed] [Google Scholar]
- Itoi K, Talukder AH, Fuse T, Kaneko T, Ozawa R, Sato T, Sugaya T, Uchida K, Yamazaki M, Abe M, Natsume R, Sakimura K. Visualization of corticotropin-releasing factor neurons by fluorescent proteins in the mouse brain and characterization of labeled neurons in the paraventricular nucleus of the hypothalamus. Endocrinology. 2014;155:4054–4060. doi: 10.1210/en.2014-1182. [DOI] [PubMed] [Google Scholar]
- Jabeen S, Thirumalai V. Distribution of the gap junction protein connexin 35 in the central nervous system of developing zebrafish larvae. Front Neural Circuits. 2013;7:91. doi: 10.3389/fncir.2013.00091. [DOI] [PMC free article] [PubMed] [Google Scholar]
- Jourdain P, Israel JM, Dupouy B, Oliet SH, Allard M, Vitiello S, Theodosis DT, Poulain DA. Evidence for a hypothalamic oxytocin-sensitive pattern-generating network governing oxytocin neurons in vitro. J Neurosci. 1998;18:6641–6649. doi: 10.1523/JNEUROSCI.18-17-06641.1998. [DOI] [PMC free article] [PubMed] [Google Scholar]
- Justice NJ, Yuan ZF, Sawchenko PE, Vale W. Type 1 corticotropin-releasing factor receptor expression reported in BAC transgenic mice: implications for reconciling ligand-receptor mismatch in the central corticotropin-releasing factor system. J Comp Neurol. 2008;511:479–496. doi: 10.1002/cne.21848. [DOI] [PMC free article] [PubMed] [Google Scholar]
- Kastenhuber E, Kratochwil CF, Ryu S, Schweitzer J, Driever W. Genetic dissection of dopaminergic and noradrenergic contributions to catecholaminergic tracts in early larval zebrafish. J Comp Neurol. 2010;518:439–458. doi: 10.1002/cne.22214. [DOI] [PMC free article] [PubMed] [Google Scholar]
- Kuzmiski JB, Marty V, Baimoukhametova DV, Bains JS. Stress-induced priming of glutamate synapses unmasks associative short-term plasticity. Nat Neurosci. 2010;13:1257–1264. doi: 10.1038/nn.2629. [DOI] [PubMed] [Google Scholar]
- Kwan KM, Fujimoto E, Grabher C, Mangum BD, Hardy ME, Campbell DS, Parant JM, Yost HJ, Kanki JP, Chien CB. The Tol2kit: a multisite gateway-based construction kit for Tol2 transposon transgenesis constructs. Dev Dyn. 2007;236:3088–3099. doi: 10.1002/dvdy.21343. [DOI] [PubMed] [Google Scholar]
- Lauter G, Söll I, Hauptmann G. Multicolor fluorescent in situ hybridization to define abutting and overlapping gene expression in the embryonic zebrafish brain. Neural Dev. 2011;6:10. doi: 10.1186/1749-8104-6-10. [DOI] [PMC free article] [PubMed] [Google Scholar]
- Lawrence C. The husbandry of zebrafish (Danio rerio): a review. Aquaculture. 2007;269:1–20. doi: 10.1016/j.aquaculture.2007.04.077. [DOI] [Google Scholar]
- Leng G, Dyball RE. Intercommunication in the rat supraoptic nucleus. Q J Exp Physiol. 1983;68:493–504. doi: 10.1113/expphysiol.1983.sp002742. [DOI] [PubMed] [Google Scholar]
- Leng G, Brown C, Sabatier N, Scott V. Population dynamics in vasopressin cells. Neuroendocrinology. 2008;88:160–172. doi: 10.1159/000149827. [DOI] [PubMed] [Google Scholar]
- Liposits Z, Paull WK, Sétáló G, Vigh S. Evidence for local corticotropin releasing factor (CRF)-immunoreactive neuronal circuits in the paraventricular nucleus of the rat hypothalamus. An electron microscopic immunohistochemical analysis. Histochemistry. 1985;83:5–16. doi: 10.1007/BF00495294. [DOI] [PubMed] [Google Scholar]
- Liu NA, Huang H, Yang Z, Herzog W, Hammerschmidt M, Lin S, Melmed S. Pituitary corticotroph ontogeny and regulation in transgenic zebrafish. Mol Endocrinol. 2003;17:959–966. doi: 10.1210/me.2002-0392. [DOI] [PubMed] [Google Scholar]
- Löhr H, Ryu S, Driever W. Zebrafish diencephalic A11-related dopaminergic neurons share a conserved transcriptional network with neuroendocrine cell lineages. Development. 2009;136:1007–1017. doi: 10.1242/dev.033878. [DOI] [PubMed] [Google Scholar]
- Lupien SJ, McEwen BS, Gunnar MR, Heim C. Effects of stress throughout the lifespan on the brain, behaviour and cognition. Nat Rev Neurosci. 2009;10:434–445. doi: 10.1038/nrn2639. [DOI] [PubMed] [Google Scholar]
- Luther JA, Tasker JG. Voltage-gated currents distinguish parvocellular from magnocellular neurones in the rat hypothalamic paraventricular nucleus. J Physiol. 2000;523:193–209. doi: 10.1111/j.1469-7793.2000.t01-1-00193.x. [DOI] [PMC free article] [PubMed] [Google Scholar]
- Luther JA, Daftary SS, Boudaba C, Gould GC, Halmos KC, Tasker JG. Neurosecretory and non-neurosecretory parvocellular neurones of the hypothalamic paraventricular nucleus express distinct electrophysiological properties. J Neuroendocrinol. 2002;14:929–932. doi: 10.1046/j.1365-2826.2002.00867.x. [DOI] [PubMed] [Google Scholar]
- Ma Y, Juntti SA, Hu CK, Huguenard JR, Fernald RD. Electrical synapses connect a network of gonadotropin releasing hormone neurons in a cichlid fish. Proc Natl Acad Sci U S A. 2015;112:3805–3810. doi: 10.1073/pnas.1421851112. [DOI] [PMC free article] [PubMed] [Google Scholar]
- Martin EI, Ressler KJ, Jasnow AM, Dabrowska J, Hazra R, Rainnie DG, Nemeroff CB, Owens MJ. A novel transgenic mouse for gene-targeting within cells that express corticotropin-releasing factor. Biol Psychiatry. 2010;67:1212–1216. doi: 10.1016/j.biopsych.2010.01.026. [DOI] [PMC free article] [PubMed] [Google Scholar]
- McClure MM, McIntyre PB, McCune AR. Notes on the natural diet and habitat of eight danionin fishes, including the zebrafish Danio rerio. J Fish Biol. 2006;69:553–570. doi: 10.1111/j.1095-8649.2006.01125.x. [DOI] [Google Scholar]
- McEwen BS. Mood disorders and allostatic load. Biol Psychiatry. 2003;54:200–207. doi: 10.1016/S0006-3223(03)00177-X. [DOI] [PubMed] [Google Scholar]
- Moenter SM. Identified GnRH neuron electrophysiology: a decade of study. Brain Res. 2010;1364:10–24. doi: 10.1016/j.brainres.2010.09.066. [DOI] [PMC free article] [PubMed] [Google Scholar]
- Moos F, Gouzènes L, Brown D, Dayanithi G, Sabatier N, Boissin L, Rabié A, Richard P. New aspects of firing pattern autocontrol in oxytocin and vasopressin neurones. Adv Exp Med Biol. 1998;449:153–162. doi: 10.1007/978-1-4615-4871-3_18. [DOI] [PubMed] [Google Scholar]
- Ono N, Bedran de Castro JC, McCann SM. Ultrashort-loop positive feedback of corticotropin (ACTH)-releasing factor to enhance ACTH release in stress. Proc Natl Acad Sci U S A. 1985;82:3528–3531. doi: 10.1073/pnas.82.10.3528. [DOI] [PMC free article] [PubMed] [Google Scholar]
- Pogoda HM, Hammerschmidt M. Molecular genetics of pituitary development in zebrafish. Semin Cell Dev Biol. 2007;18:543–558. doi: 10.1016/j.semcdb.2007.04.004. [DOI] [PubMed] [Google Scholar]
- Preuss SJ, Trivedi CA, vom Berg-Maurer CM, Ryu S, Bollmann JH. Classification of object size in retinotectal microcircuits. Curr Biol. 2014;24:2376–2385. doi: 10.1016/j.cub.2014.09.012. [DOI] [PubMed] [Google Scholar]
- Rivest S, Laflamme N, Nappi RE. Immune challenge and immobilization stress induce transcription of the gene encoding the CRF receptor in selective nuclei of the rat hypothalamus. J Neurosci. 1995;15:2680–2695. doi: 10.1523/JNEUROSCI.15-04-02680.1995. [DOI] [PMC free article] [PubMed] [Google Scholar]
- Ryu S, Mahler J, Acampora D, Holzschuh J, Erhardt S, Omodei D, Simeone A, Driever W. Orthopedia homeodomain protein is essential for diencephalic dopaminergic neuron development. Curr Biol. 2007;17:873–880. doi: 10.1016/j.cub.2007.04.003. [DOI] [PubMed] [Google Scholar]
- Sabatier N, Leng G. Bistability with hysteresis in the activity of vasopressin cells. J Neuroendocrinol. 2007;19:95–101. doi: 10.1111/j.1365-2826.2006.01509.x. [DOI] [PubMed] [Google Scholar]
- Senba E, Matsunaga K, Tohyama M, Noguchi K. Stress-induced c-fos expression in the rat brain: activation mechanism of sympathetic pathway. Brain Res Bull. 1993;31:329–344. doi: 10.1016/0361-9230(93)90225-Z. [DOI] [PubMed] [Google Scholar]
- Spence R, Fatema MK, Reichard M, Huq KA, Wahab MA, Ahmed ZF, Smith C. The distribution and habitat preferences of the zebrafish in Bangladesh. J Fish Biol. 2006;69:1435–1448. doi: 10.1111/j.1095-8649.2006.01206.x. [DOI] [Google Scholar]
- Suster ML, Abe G, Schouw A, Kawakami K. Transposon-mediated BAC transgenesis in zebrafish. Nat Protoc. 2011;6:1998–2021. doi: 10.1038/nprot.2011.416. [DOI] [PubMed] [Google Scholar]
- Tasker JG, Dudek FE. Electrophysiological properties of neurones in the region of the paraventricular nucleus in slices of rat hypothalamus. J Physiol. 1991;434:271–293. doi: 10.1113/jphysiol.1991.sp018469. [DOI] [PMC free article] [PubMed] [Google Scholar]
- Tian L, Hires SA, Mao T, Huber D, Chiappe ME, Chalasani SH, Petreanu L, Akerboom J, McKinney SA, Schreiter ER, Bargmann CI, Jayaraman V, Svoboda K, Looger LL. Imaging neural activity in worms, flies and mice with improved GCaMP calcium indicators. Nat Methods. 2009;6:875–881. doi: 10.1038/nmeth.1398. [DOI] [PMC free article] [PubMed] [Google Scholar]
- Toro S, Wegner J, Muller M, Westerfield M, Varga ZM. Identification of differentially expressed genes in the zebrafish hypothalamic-pituitary axis. Gene Expr Patterns. 2009;9:200–208. doi: 10.1016/j.gep.2008.12.007. [DOI] [PMC free article] [PubMed] [Google Scholar]
- Van Pett K, Viau V, Bittencourt JC, Chan RK, Li HY, Arias C, Prins GS, Perrin M, Vale W, Sawchenko PE. Distribution of mRNAs encoding CRF receptors in brain and pituitary of rat and mouse. J Comp Neurol. 2000;428:191–212. doi: 10.1002/1096-9861(20001211)428:2<191::AID-CNE1>3.0.CO;2-U. [DOI] [PubMed] [Google Scholar]
- Wamsteeker Cusulin JI, Füzesi T, Watts AG, Bains JS. Characterization of corticotropin-releasing hormone neurons in the paraventricular nucleus of the hypothalamus of Crh-IRES-Cre mutant mice. PLoS One. 2013;8:e64943. doi: 10.1371/journal.pone.0064943. [DOI] [PMC free article] [PubMed] [Google Scholar]
- Westerfield M. A Guide for the Laboratory Use of Zebrafish (Danio rerio) Ed 4. Eugene, OR: University of Oregon; 2000. The Zebrafish Book. [Google Scholar]
- Yeh CM, Glöck M, Ryu S. An optimized whole-body cortisol quantification method for assessing stress levels in larval zebrafish. PLoS One. 2013;8:e79406. doi: 10.1371/journal.pone.0079406. [DOI] [PMC free article] [PubMed] [Google Scholar]